Procurement of INFRASTRUCTURE PROJECTS Deepwell Drilling ...
Can Electronic Procurement Improve Infrastructure
Provision?
Evidence from Public Works in India and Indonesia
Sean Lewis-Faupel, Yusuf Neggers, Benjamin A. Olken, and Rohini Pande∗
July 23, 2015
Abstract
This paper examines whether electronic procurement (e-procurement), whichincreases access to information and reduces personal interactions with poten-tially corrupt officials, improves procurement outcomes. We develop uniquedatasets from India and Indonesia and use variation in adoption of e-procurementwithin both countries. We find no evidence of reduced prices but do find that e-procurement leads to quality improvements. In India, where we observe qualitydirectly, e-procurement improves road quality, and in Indonesia, e-procurementreduces delays. Regions with e-procurement are more likely to have winnerscome from outside the region. On net, the results suggest that e-procurementfacilitates entry from higher quality contractors.
JEL Codes: H57, O12, O53
∗The authors are from Wisconsin-Madison (Lewis-Faupel), MIT (Olken) and Harvard University(Neggers and Pande). We thank the editor, Dan Silverman, and three anonymous referees for usefulcomments, Maria Acevedo for superb field work and research assistance, and the InternationalGrowth Center for financial support. We thank Abhijit Banerjee for many thought-provokingconversations, and thank Leila Agha, Matthew Levinson, Zejd Muhammad, and Amanda Pallaisfor outstanding research assistance. Financial support was provided by IGC.
1

I Introduction
Contestable government procurement of goods and services has been estimated at
over 7 percent of world GDP (OECD 2002), with the incidence rising in emerging
economies: For instance, in 2007, the Indian government spent over US $21 billion
($18 per capita) on the procurement of external goods and services, over double what
it spent in 2000 (IMF). Yet, both the quantity and quality of recently constructed
public infrastructure often remain low (Briceno-Garmendia et al. 2004). A limited
supply of local qualified contractors, collusion among contractors, and corruption
among public officials have each been cited as important reasons (Kenny 2007).
A number of governments have responded by adopting electronic procurement
(henceforth: e-procurement) (World Bank 2007). Broadly, e-procurement is the
implementation of a technological platform as directed by a potential buyer (a gov-
ernment agency or firm) to facilitate transactions between that buyer and potential
sellers of goods and services. Commonly, the practice includes electronic postings
by the buyer of products and services desired for procurement. There is often an
online method for potential suppliers to offer those goods or services requested by
the buyer, under a contract and price either preordained by the buyer or offered by
the potential seller. As with traditional procurement, there is typically a method for
choosing among contracts or prices offered by the potential sellers. In some cases,
this selection process is performed automatically by the technology.1 In other cases,
e-procurement consists of contracted sellers providing a set of goods or services at
fixed prices from which the buyer can choose as needed. Additionally, e-procurement
may allow for the electronic transfer of funds as agreed upon in the procurement
1The system may also allow potential sellers to electronically submit other supporting docu-mentation, such as resumes or technical capabilities, or allow the buyer and potential sellers tocommunicate electronically. Additionally, e-procurement may be used to record and archive anynumber of other data points of interest to the buyer.
2
contract. Finally, the technology can facilitate a review by the buyer of the goods or
services delivered by the contracted seller, which may be communicated to the seller,
considered when enforcing contracts, and used by the buyer in future procurement
decisions. We describe the specifics of the e-procurement reforms in the Indian and
Indonesian contexts in the next section.
E-procurement can potentially address three common concerns with manual pro-
curement practices: lack of access to bid information, collusion among bidders, and
corruption. By lowering the costs of obtaining information about a tender process,
e-procurement may increase the number of firms who can bid. Likewise, it can re-
duce bidder collusion by providing tender information to firms outside a local cartel,
allowing non-cartel firms to participate and breaking up local bidding cartels. E-
procurement can also mitigate corruption by reducing government officials’ ability
to selectively withhold information or refuse electronic bids from non-favored bid-
ders. Moreover, by ensuring public access to all procurement data, e-procurement
enhances transparency and the possibility of public oversight.
However, it is plausible that in low income settings, where information technol-
ogy coverage and other aspects of state capacity remain low, e-procurement can only
effect limited change and can potentially make things worse. Potential contractors
(who are currently not in the system) may continue never to learn about available
tenders, and cartels and corrupt officials may continue to use strong-arm tactics to
prevent entry by such contractors. If many small firms have limited access to the
internet, requiring electronic bids could harm competition.
In this paper we examine the impact of electronic procurement on public works
projects in two large emerging economies: India and Indonesia. In India, we exam-
ine procurement practices between 2000 and 2009 for a federally funded rural road
construction program which is implemented by state road departments, the Pradhan
3

Mantri Gram Sarak Yojana (PMGSY) program. Under this program, roughly 145
road packages were tendered per state per year. In Indonesia, we examine contract
data from the national Ministry of Public Works for both construction and consult-
ing (e.g., engineering management and design) contracts each year. On average, 32
consultancy and 58 construction packages per province were issued each year. The
gradual roll-out of e-procurement (at the state-level in India and province-level in
Indonesia) allows for a difference-in-differences strategy: We compare outcomes in
states/provinces before and after the adoption of e-procurement, as well as in those
continuing under manual procurement practices, allowing us to quantify the benefits
or costs of the practice in both countries.
For both countries, we obtained administrative data on the complete universe
of contracts from before and after e-procurement by scraping publicly available
information from respective government websites. In Indonesia we have bidding
and final contract data for all tenders; in India, the website publishes final contract
data but not the details on individual bids. All told, this leaves us with a dataset
of over 20,000 contracts in India and over 14,000 tenders in Indonesia. In addition,
in India, we hand collected bidding data on tenders for four states which we use to
supplement the administrative data.
We first show that, in both India and Indonesia, e-procurement increases the
probability that the winning bidder comes from outside the region where the con-
tract takes place. This is consistent with e-procurement decreasing the costs of
submitting bids for those not physically present. We next examine the impact on
the ultimate outcomes of interest: price, quality of construction, and timeliness.
We find no systematic evidence that electronic procurement lowers prices paid by
the government. In Indonesia, the point estimates are consistent with small (2-5
percent) reductions in prices, but these are not statistically significant. In India,
4
final prices are unaffected. Overall, we can statistically rule out (at the 5 percent
level) declines in contract values of more than 2.7 percent in India, of more than
6.6 percent for Indonesian consulting projects, and of more than 14.1 percent for
Indonesian works contracts.
In contrast, e-procurement led to quality improvements, albeit along different
dimensions in the two countries. A first measure of quality is time-overrun in project
completion. Reports of corruption of procurement in India typically focus on cases
where works are abandoned halfway through or completed in a very tardy manner.
In our data we see that 77 percent of road projects in India and around 95 percent
of public works projects in Indonesia are completed late. In India, we observe no
statistically significant changes in late works, while in Indonesia these declines are
large and significant – whereas only 5 percent of conventionally procured construc-
tion projects in Indonesia are completed on schedule, 20 percent of electronically
procured construction projects are on time.
A separate indicator of quality, only available for India, is an independent audit
report on construction quality, which was conducted identically in roads completed
under both e-procurement and traditional procurement. According to this measure,
we find that e-procurement leads to higher quality roads, with the quality grades
rising by about 12 percent in e-procurement projects compared to other projects.
We then explore the degree to which the results are driven by improving out-
comes among already winning bidders, as opposed to changing who wins. To see
whether the observed changes in outcomes reflect changes in selection of who wins,
for the key variables of interest – price, delays, and quality – we estimate a fixed ef-
fect for each contractor and examine how e-procurement changes the average quality
characteristics of winning contractors (i.e., the fixed effects of who wins). We find
that after e-procurement, winning contractors in India tend to be those who have
5
higher quality on average. In Indonesia, we find evidence that those contractors
who win after e-procurement are systematically less likely to be late. This suggests
that a key mechanism for e-procurement is allowing higher quality contractors to
enter and win projects, rather than simply encouraging better performance from
an existing set of contractors. Increased entry of contractors could reflect better
information flows and/or reduced ability of local contractors to prevent others from
filing tenders.
This paper is related to several economic literatures. While there is a growing
body of work which examines procurement (Bandiera et al. 2009, Krasnokutsaya
and Seim 2011), much of the literature has focused on the award procedures (i.e.,
scoring auctions vs. lowest-price auctions, etc.) (Tran 2008) and potential inter-
actions with other procurement regulations (Decarolis 2014). This paper suggests
that an important component, at least for ensuring quality, can be in the imple-
mentation of the procurement auction, holding these rules fixed. It also contributes
to a growing literature using procurement data to examine corruption (Di Tella
and Shargrodsky 2003, Ferraz and Finan 2008, Bandeira, Prat, and Villetti 2009,
Bobonis, Fuertes, and Schwabe 2010, Cai, Henderson, and Zhang 2013).
Second, past work has highlighted the role of media and technology in shaping
the political and policy landscape. Stromberg (2004) suggests that media access
among constituents may make politicians more responsive to voters, while Falck et
al. (2012), Jaber (2013) and Campante et al. (2014) measure causal impacts of
internet access on political participation. Our paper complements this previous lit-
erature by considering how new technology, in this case implemented by government
itself, may improve the outcomes of a government initiative.
Finally, this paper is part of a recent, broader agenda that documents the role
of communication technology in development. While there are several studies that
6
document the impact of cell phone technology on market access (Jensen 2007, Aker
2010) and education (Aker et al. 2012), this paper represents one of the first studies
to examine the impact of the internet on governance issues.
One advantage of our approach is that we use the same methodology to study
separate e-procurement programs in two different countries. To the extent that
the findings from both countries are similar, the external validity of our results is
given credence. To the best of our knowledge, this study represents one of the first
microeconomic studies that uses difference-in-differences to simultaneously evaluate
a new program in multiple countries, allowing for more careful conclusions with
respect to external validity.2
The paper is structured as follows: In Section II we describe the institutional
details relating to procurement practices and road construction in India and Indone-
sia. In Section III we describe the data and empirical strategy. In Section IV we
report the findings. Section V concludes.
II Background
We start by describing the public works programs in our two study countries, fol-
lowed by the nature of e-procurement adopted in these two settings. We conclude
the section with a brief description of likely channels of influence of e-procurement.
A India
A.1 Public Works Program and Manual Procurement
In the year 2000, India launched a large-scale rural road construction scheme called
Pradhan Mantri Gram Sarak Yojana (PMGSY). The federal government provides
2The other study of this nature we are aware of is Gruber and Mullainathan (2005), whichevaluates the impact of state and provincial cigarette tax changes in the US and Canada.
7
funding for this scheme and coordinates program implementation, but full execu-
tional responsibility lies with state governments. Each state has a rural roads depart-
ment which decides the schedule for road construction and manages procurement.
PMGSY roads follow a uniform criteria for road construction in terms of material
usage and quality for all Indian states.
For PMGSY, all states use the same procurement rules and standardized bidding
document, provided by the national roads agency. The procurement process follows
a cost-based auction procedure. Specifically, conditional on meeting a pre-specified
set of technical qualifications intended to ensure a contractor is capable of completing
the project, the contract is awarded to the lowest bidder. Importantly, these rules
are identical for manual and electronic procurement.
Anecdotally, public procurement in India is rife with corruption, and claims of
impropriety exist throughout the contracting process. Contractors have reported
being physically intimidated or barred from submitting bidding documents. The
handling of bidding documents after submission has also been called into question
with claims of altered bids, inspection of bids prior to technical reviews, and inten-
tional loss of submissions. There is also concern that technical qualifications are
used to unreasonably exclude certain firms from the bidding process. The implica-
tion of many of these reports is that government officials collect rents in exchange
for some advantage in the bidding process.
As a case study, we examined the tendering process for manual procurement for
a random sample of 190 road contracts issued between 2001 and 2006 in the Indian
state of Uttar Pradesh. As Figure 1 shows, there is very little competition in PMGSY
contracts. In 95 percent of cases, the price bid of only one firm was evaluated; that
is, there was only one bid submitted or all other bids were disqualified based on
technical requirements. When we observe multiple bids here, over three quarters of
8
the time all but one bid are disqualified. In the case of any technical disqualification,
all but one bidder are disqualified 100 percent of the time. Prima facie this pattern
of disqualifications is consistent with corrupt officials enforcing a desired winner.
In 2000, when the program began, all Indian states used a manual paper-based
procurement system to bid out contracts to private contractors. This process in-
volved obtaining internal approval of the project, publishing a Notice Inviting Ten-
ders (NIT) in several media outlets (typically newspapers), having suppliers obtain
detailed bid preparation materials from the government, receiving bid submissions
from suppliers, receiving bid evaluations by buyers, and finally, the awarding of
the procurement order and signing of agreements. The complete process required a
long chain of internal authorizations (at times involving several departments), sev-
eral visits by suppliers to departments, and the generation of reams of paper-based
statements and evaluations.
A.2 E-Procurement
The Indian IT Act of 2000 provided legal recognition to electronic transactions.
Since then, several Indian states have passed legislation enacting e-procurement,
and the rural roads department in several states followed by adopting e-procurement
practices for road construction. The implementation of e-procurement for PMGSY
typically involves placing all invitations for tender into an online, searchable database.
An online portal is also established that allows authorized users (contractors) to up-
load bidding materials. The Indian e-procurement systems prohibit procurement
officials from viewing contractor names and viewing or editing price bids before
completing the technical certification process, in theory preventing favoritism in the
selection process. Given the above description of how most bidders are disqualified
during the technical stage, this is potentially important for preventing corrupt prac-
9
tices. Finally, much of the electronic data is stored after auctions are completed,
creating the potential for accountability.
We exploit this variation across time and states for our empirical analysis.
Our sample covers 27 Indian states and territories during the period January 2000
through August 2009. During this time frame, 9 states adopted a system of electronic
procurement. Figure 2a shows the dates when e-procurement rules were adopted in
various states through August 2009. The first state to adopt, in 2004, was Andhra
Pradesh, which (along with Karnataka) is one of the technological leaders of India.
(Note that in some states (Chattisgarh, Gujarat, and Orissa), contracts which are
below a state-specified cost threshold do not go through the electronic procurement
process and are processed on paper. Since the threshold may respond endogenously
to the auction policy (see, e.g., Tran 2008), during the applicable periods, we classify
all projects as electronically tendered in these states.)
B Indonesia
B.1 Public Works Program and Manual Procurement
In Indonesia, we examine the national Ministry of Public Works (MPW). The MPW
procurement process covers mainly two types of contracts, works and consulting.
Works contracts refer to projects such as the building or repairing of roads and
bridges, where physical services or construction work are conducted by the contract
winner. Access to heavy equipment and various construction materials is therefore
typically a necessary component for these projects. Consulting contracts, in con-
trast, entail the provision of professional expertise by the winning bidder in planning
or supervision services such as design and management. Depending on the project,
procurement takes place either at the national headquarters in Jakarta or at the
provincial offices of the MPW.
10
Works and consulting contracts additionally differ in the structure of their bid-
ding processes. Works contracts are generally assigned to the low bidder conditional
on meeting minimum administrative and technical qualifications, as in India. Con-
sulting contracts involve a pre-qualification phase in which potential bidders first
submit a document containing administrative, financial, and work experience infor-
mation. A shortlist of firms meeting minimum qualification requirements are then
invited to submit technical and cost bids. The winning bidder is assigned using a
formula based on a combination of technical score and price, rather than simply
lowest bid conditional on meeting minimum technical requirements as with works
projects. For both types of contracts, a minimum of three bid submissions are re-
quired; otherwise, the processes are repeated. The overall pool of bidding firms
consists of both private firms and state-owned construction firms, with state-owned
firms competing against the private sector without any special preferences.
Public procurement is widely considered “one of the most corruption-ridden sec-
tors” (Freedom House 2012) in Indonesia. For example, the 2009 Enterprise Survey
of Indonesia (World Bank and IFC) sampled 1,444 firms comprising a representative
sample of the non-agricultural formal private economy in the country. In the survey,
38.1 percent of respondents who had attempted to secure a government contract in
the previous year indicated that firms with characteristics similar to theirs make
informal payments or give gifts to public officials to secure such contracts, though
the average value given for these bribes was only 1.8 percent of the total contract
value. A separate survey of 792 randomly sampled construction, consulting, and
supplier firms conducted in 2010 by the Indonesia Procurement Watch (Indonesia
Procurement Watch 2011) provides further suggestive evidence of corruption in the
government procurement process, with 92.7 percent of respondents answering that
they thought their firm had ever given bribes to the government officials involved
11

in managing procurement. Additionally, 97.3 percent of respondents believed that
it was not possible to win the contract tender without bribery and more than 95
percent indicated that the typical value of a bribe was more than 10 percent of the
contract value. Beyond survey results, of the 196 cases considered by the Corrup-
tion Eradication Commission (KPK) of the Government of Indonesia between 2004
and 2010, 86 dealt with bribery and graft related to the procurement of goods and
services and every such case resulted in a conviction (Onishi 2009, Parlina 2011).
Anecdotal evidence suggests that the manual procurement process contributes to
the corruption problem in much the same ways as discussed in India. For example,
government officials may not make the detailed documents required to prepare a bid
available to non-favored firms or purposely misinform them about the proper sub-
mission process (UNAFEI 2008). Alternatively, there could be physical intimidation
of firms that are not part of the cartel from submitting bids.
B.2 E-Procurement
Indonesia began rolling out a “semi-electronic procurement” (SEP) system in 2004
in the central ministry in Jakarta and expanded the procedure across the 33 provin-
cial offices in approximately concentric circles from Jakarta over the next 5 years,
as shown in Figure 2b. The roll-out plan was devised from Jakarta and followed a
standard pattern in Indonesia: roll-out started in Java, spread to the most devel-
oped provinces in Sumatra and Sulawesi next, and then was progressively rolled out
throughout the country. Under SEP, firms are able online to register expressions
of interest, to download detailed bidding and technical qualification documents, to
submit pre-qualification materials, and to post questions and complaints. However,
due to a regulatory constraint, the final submission of bids was still required to be
conducted manually (hence the term “semi”) throughout the period we study. The
12

SEP process thus covers the entire procurement process except the final submission
of bids. There was no change in procurement rules associated with the switch to
SEP; procurement still followed the Presidential guidelines for the procurement of
government goods and services issued in 2003 (Government of Indonesia, 2003).3
Prior to the adoption of SEP in a province, procurement was in a “copy to
internet” (CTI) phase where the acquisition of bidding and technical qualification
documents and the submission of bids were carried out manually, but the contract
details (bids of each firm and the winner) were posted to the internet ex-post to
be publicly available. Crucially for our analysis, the data made public during the
copy-to-internet and semi e-procurement systems are identical and in fact use the
same electronic platform; the only difference is that procurement actually takes
place electronically on the SEP system, whereas in copy-to-internet, information is
just released publicly ex-post. We discuss the data in more detail below.
C E-procurement: Channels of Influence
There are several mechanisms through with e-procurement could affect outcomes.
First, e-procurement could change the composition of bidders. By placing bid-
ding documents online and allowing interactions online rather than in person, e-
procurement facilitates bidding at a distance; on the other hand, since it requires
internet access, it may be more difficult for unsophisticated bidders. Second, e-
procurement may increase the enforcement of government rules and regulations. In
the manual procurement system, the paper trail and threat of audit ensures that
rules are complied with, but this is imperfect; e-procurement adds an additional
layer of intermediation, where the computer system itself enforces certain proce-
dures. Third, e-procurement may prevent denial of access to non-favored suppliers.
3Full e-procurement was not introduced until after the period under study.
13
For example, in a manual procurement system, a procurement official could, for a
supplier outside of a pre-specified cartel, claim that there were no copies available of
bidding documents or refuse to accept a bid. The e-procurement system cannot be
manipulated in this way and provides access to all equally. Finally, even if outcomes
are not changed, if e-procurement costs less for the government to administer than
a manual procurement process, it could still be beneficial to the government (Singer
et al. 2009).
The impact of these changes on prices and quantities is ambiguous for several
reasons. First, while most of these effects of e-procurement are “positive” (in the
sense of increasing competition and/or reducing the possibility of corruption or
collusion), there is one potential downside, namely that it may make access more
difficult for bidders with low internet availability or low levels of computer skills.
Second, even conditional on “improving” outcomes for the government, it is not
ex-ante obvious whether this improvement will come in the form of lower prices,
improved quality, or both (Asker and Cantillon 2010). If e-procurement facilitates
the entry of high quality firms from farther away (say, high quality firms located in
the capital city), one might expect quality to rise; prices might even rise as well. On
the other hand, if e-procurement facilitates the entry of more firms of similar quality,
the impact could either be a fall in prices (if existing firms bid the same quality as
before but reduce prices in light of more competition) or an increase in quality (if
existing firms increase quality of their proposals for the same price). Either way,
these ambiguities suggest that it is important to measure the impacts on both prices
and quality when considering the net impact for the government.
These arguments hold true under a competitive model with no collusion or cor-
ruption, but similar arguments can be made in cases of corruption, as well. For
example, in a corrupt world where the most efficient contractor can pay the highest
14
bribe (as in Tran 2008 and Asker 2010), e-procurement, even if it eliminated the
bribes, would not necessarily change the identity of the firm winning the contract
(Burguet and Che 2004). It would, however, potentially reduce the price. On the
other hand, if there was heterogeneity in firms’ willingness to pay bribes, so the
most efficient firm was not necessarily the one with the highest willingness to pay,
eliminating corruption might also result in a different firm winning the contract and
potentially higher quality (Celentani and Ganuza 2002).
Of course, all of these effects could potentially be muted if the requests for pro-
posal changed in response to e-procurement. For example, one might imagine that
in response to an intervention that made it more difficult for a procurement officer
to direct a contract to a particular bidder, the officer might change the contract
requirements such that only the desired firm could satisfy them. While this issue
could arise, at least in India this is unlikely to be a major force since the Indian
road specifications are largely fixed by PMGSY program guidelines.
III Data and Empirical Strategy
In this section we describe the Indian and Indonesian datasets, followed by our
empirical strategy.
A Data
A.1 India
We obtain administrative data on costs, quality, and delays associated with each
PMGSY contract issued between January 2000 and August 2009 from multiple
PMGSY websites. The dataset covers 27 Indian states. For PMGSY, some road
packages (sets of construction projects and funding allocated by the federal govern-
15
ment) are split into multiple tenders, each with its own contract covering a subset
of roads in the package. As a result, our final dataset covers (at least partial infor-
mation for) 30,578 packages and 35,610 associated contracts.
A first set of outcomes are the cost outcomes associated with each contract.
The estimated cost is the amount budgeted (or “sanctioned” in the terminology
of PMGSY) by the national authority for construction of a specific road or set
of roads in a package. A contract or payment above this amount can only occur
with permission from the national offices. The contract value is the amount the
government agrees to pay the winning firm for the relevant work. The final payment
records the total amount paid out for each package, which as discussed above, may be
distributed among multiple contracts and includes any amendments to the contract
that occur during construction.
We have measures of two key aspects of project quality: timeliness and physical
project quality. For timeliness, we track the time to execution. We use “late com-
pletion,” which is an indicator variable taking value one if road construction work
is not completed by the date agreed to in the initial contract. We also construct
a continuous “time overrun ratio” variable, which is the ratio of actual to agreed
upon time to completion.
To measure the quality of project implementation, we use quality reports sub-
mitted by the National Quality Monitors (NQMs). During construction, PMGSY
has a multi-tier quality monitoring system, with local, state, and national moni-
toring. National monitoring is conducted by NQMs who are retired engineers from
other states. The assignment of packages to NQMs is randomized and is therefore
conducted similarly in places with and without electronic procurement.4 We fo-
4The NQMs are given the letter of request once every two months for carrying out inspection forthe forthcoming two months. The NQMs are required to inspect three districts in a single visit inone state in each of the two months. The letter of request allocates a mix of works in progress andcompleted works. The letter indicates the specific location of works to be inspected and which are
16
cus on the outcomes of this national monitoring as our quality outcome. NQMs
evaluate each part of the work for material and workmanship as per the format of
the standardized “NQM Inspection Report,” indicating the tests carried out and the
test results obtained. Overall grading includes management issues, contract manage-
ment, and quality of work. We use a binary assessment (satisfactory/unsatisfactory)
of the technical fitness of the road at the time of inspection.
For a subset of packages in the states of Andhra Pradesh, Chhattisgarh, Kar-
nataka, and Uttar Pradesh, we have bidding data. This includes the total number
of bids submitted in each auction. Before submitted bids are unsealed, engineers in
each state decide which firms have the technical ability (in training, equipment, and
experience) to complete the project based on materials firms submit with their bid.
We also observe how many of the submitted bids in each auction are judged to be
from technically qualified firms.
A.2 Indonesia
We scraped data from the CTI and SEP websites of the Indonesian Ministry of
Public Works, capturing the complete universe of procurement from 2004 through
2008. Over 14,000 contracts from the MPW national headquarters and the 33
provincial offices are covered. Each entry in the data is at the contract level and
specifies the estimated cost, which is, as in India, the maximum amount allowed by
the MPW to be paid for a given contract. Information on the type of project is
available, as are all bidder names, bid amounts, disqualifications, and final contract
values.
We also have the dates on which the notice and details for each contract were
first posted online (and concurrently in traditional media), as well as the dates of
in-progress or completed works. Within a block (the administrative unit below district), projectsto be inspected are chosen on a random basis.
17
bid opening and contract award. For road projects (which represent a subset of all
projects covered by the Ministry of Public Works), we have a separate database from
the road division that tracks the start dates and expected and actual completion
dates for the services associated with each contract. As with India, we construct
“late completion” and “time overrun” variables. No direct quality measure is avail-
able for Indonesia. For regressions which consider as an outcome variable the above
measures of the timeliness of completion, the number of firms expressing interest
(i.e. registering to access bidding documents), or the number of firms bidding, we
trim the top and bottom 1 percent of sample observations.
B Descriptive Statistics
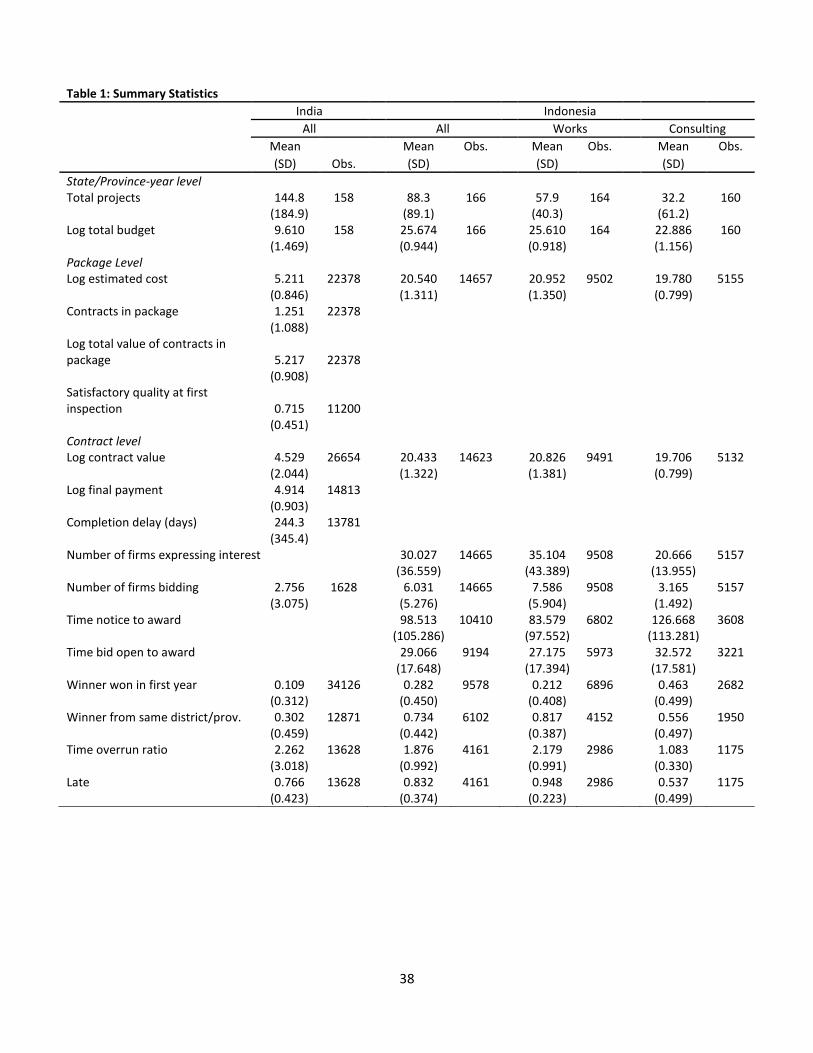
In the first column of Table 1, we present a set of basic descriptive statistics for the
Indian data, and in the remaining columns we present statistics from Indonesia. All
monetary variables are in logs, which is the form in which they will be used in the
regressions below.
Examining the Indian data, in an average year for the typical state, the gov-
ernment sanctioned almost 145 packages worth 9.61 log lakh rupees (approximately
US$33 million at exchange rates for 2005, the midpoint of our dataset; 1 lakh is
100,000 rupees) covering over 6.74 log kilometers (525 miles) of road. At the pack-
age level, the average log estimated cost of completion over the period observed is
5.211 log lakh rupees (about US$416,000). In the subset of auctions for which we
have bidding data (as discussed above, these are from 4 states), there are an average
of 2.7 total bids and 1.7 qualified bids.
One contract per package is the mode, but a long right tail is observed. On
average, a package is associated with 1.25 contracts for which we have data. Roads
contracts generally come in below estimated cost (most likely because exceeding
18
estimated cost requires an additional bureaucratic process). However, cost overruns
with respect to the contracted price are relatively common post-contracting. The
average payment on completed projects exceeds the average contract value by about
46 percent.
Turning to delays and quality, completion before the contracted due date was
rare, with more than three quarters of contracts finished after the assigned deadline
and an average delay of 244 days. There was heterogeneity in quality, with 72
percent of projects receiving a satisfactory quality rating on first inspection.
Examining the Indonesian data in Table 1, between 2004 and 2008 the average
Indonesian province auctioned about 88 contracts per year, with nearly twice as
many works as consulting projects, for a province-level average log total budget of
25.67 log rupiah (approximately US$12 million at 2006 exchange rates). This implies
that the total annual budget for all contracts in our data averages 29.61 log rupiah
(roughly US$615 million). At the project level, the average log estimated cost for
works projects is 20.95 log rupiah (about US$106,000) and for consulting projects
is 19.78 log rupiah (approximately US$33,000). The final contract value for a given
project is on average 10 percent lower than the official estimated cost provided by
the government prior to bidding. Firms winning contracts are typically based in
the same province as the contract, more than 80 percent so for works projects. As
with the data from India, delays are common; nearly all works projects (95 percent)
and more than half of consulting projects (54 percent) are completed later than the
initially agreed upon date.
C Empirical Strategy
We estimate impacts separately for India and Indonesia. In both cases, we make use
of a difference-in-differences strategy, but our implementation differs slightly across
19
countries, as described below.
In India, for road package or contract i in state s which began in year t we
estimate the following OLS specification:
yist = αs + βt + µEPROCst +X ′istγ + εist (1)
where i is a package or contract, s is a state, and t is a year, and EPROCst is a
dummy for e-procurement adoption by state s as of year t. Controls Xist are log
estimated cost and log road length.5 All regressions include state (αs) and year (βt)
fixed effects. In some cases we collapse the package-level data to the state level and
estimate regressions using annual state-level data. In all cases we cluster standard
errors by state.
In Indonesia, the availability of e-procurement at the province level does not
necessarily imply that all projects within a province will be contracted using the
system.6 To obtain the average impacts of the use of e-procurement, we instrument
for actual e-procurement use with the adoption of e-procurement in the province,
as follows. The regression of interest (i.e. the second stage) is:
yist = αs + βt + θEPROCPACKAGEist + δXist + εist (2)
where EPROCPACKAGEist is a dummy for e-procurement use in project i in
province s as of year t. The project level e-procurement variable EPROCPACKAGEist
is instrumented with EPROCst, which is a dummy for whether e-procurement has
5For India, the R-squared values from regressions of e-procurement on log road length and logestimated cost range from 0.0004 to 0.081, depending on the year. For Indonesia, the R-squaredvalues from regressions of project-level e-procurement on log estimated cost range between 0.001 to0.022 for works projects and between 0.000 to 0.125 for consulting projects, depending on the year.
6It is possible that this is true for India as well, but for India we do not observe what fractionof packages actually used e-procurement in a given year.
20
been adopted by province s as of time t.7 The control variable Xist is the log esti-
mated cost (since we have many different types of projects and there is no metric
available in the data other than estimated cost, we cannot control for road length
as for India). Standard errors are clustered by province.
In our regression tables we typically report results for the India sample as Panel
A, Indonesia works projects as Panel B and Indonesia consulting projects as Panel
C .
D Identification Check
Since the adoption of e-procurement is not randomly assigned, we need to ensure
that the timing of e-procurement adoption is not correlated with differential trends
in procurement that would have occurred in the absence of e-procurement.
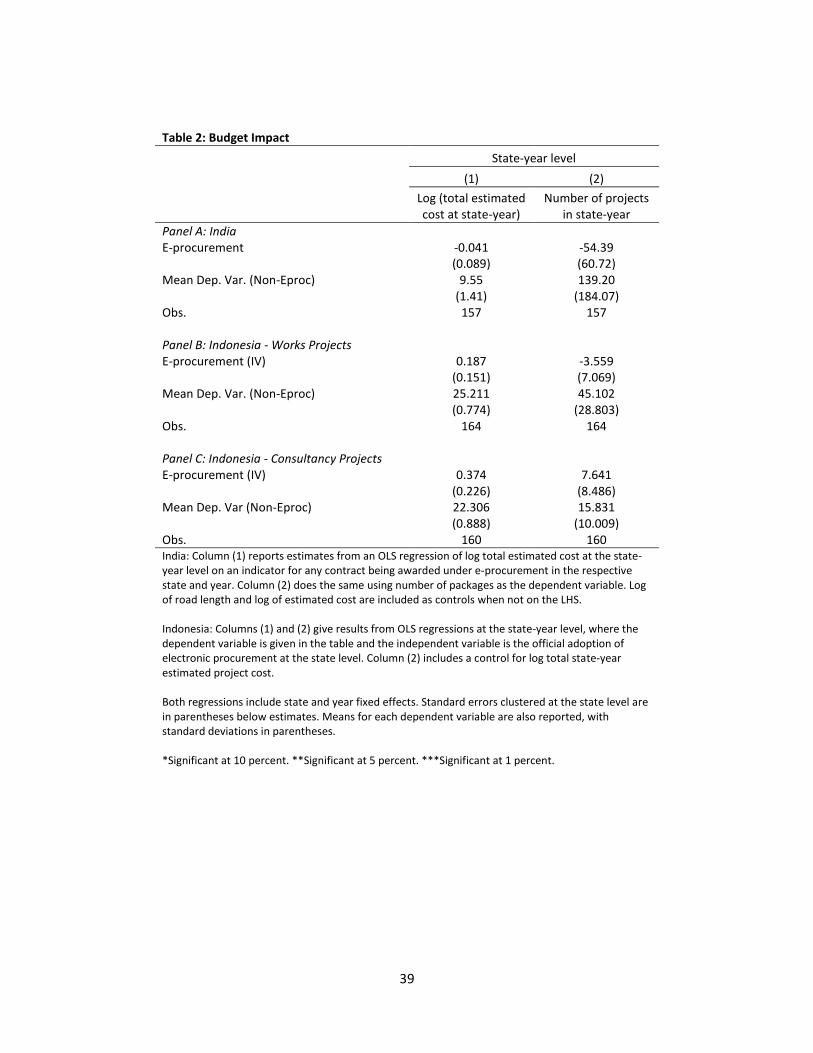
To examine this, we begin by checking whether, overall, the adoption of e-
procurement is associated with a change in the volume (total budget for procure-
ment) or structure (i.e., across how many contracts procurement is distributed) in
a given state or province. Column (1) of Table 2 reports regressions where the
dependent variable is log total estimated cost at the state-year level and the ex-
planatory variable of interest is an indicator for any contract being awarded under
e-procurement, with log of road length included as a control for India. Column (2)
repeats the exercise using number of projects as the dependent variable, controlling
for log total state-year estimated project cost. In neither country do we see a sig-
nificant impact of e-procurement adoption on the total budget allocations (column
1) or the number of projects they are broken into (column 2) at the state/province-
level, suggesting that e-procurement was not coincident with major changes in the
7The first-stage coefficient and F-statistic for works projects are, respectively, 0.359 and 40.79and for consultancy projects are 0.491 and 78.11.
21
amount or structure of contracts being procured.8
Second, we examine whether the year of official adoption of e-procurement at the
state level (conditional on e-procurement occurring after the first two years in our
data – that is, after 2005 in Indonesia or after 2001 in India) is significantly related
to the difference in log average contract value between the first two years of the data
(i.e., between 2001 and 2000 for India (Appendix Table 1, Panel A) and between 2005
and 2004 for Indonesia (Appendix Table 1, Panels B and C). Regressing these early
contract value differences on e-procurement can suggest whether differential initial
trends predict the year of subsequent e-procurement adoption. We see no correlation
between change in state-level contract value and the timing of e-procurement for
either India or Indonesia.
IV Results
A Did E-procurement Change the Contracting Process?
A.1 Contracting Execution
In Table 3 we first examine whether the introduction of e-procurement has an im-
pact on the duration of the project contracting phase. In columns (1) and (2) we
consider the time elapsed between tender notice and contract award and between
bid opening and contract award. Both variables are available only for the Indonesia
sample. While neither variable is significantly impacted for works projects, we find
an increase of 54.15 days (statistically significant at the 1 percent level), a more
than 50 percent increase, in the time elapsed between the tender notice and award-
ing of contract for consulting projects. In conjunction with the absence of an effect
in column (2) on the amount of time between bid opening and award, this implies
8We find a similar null result for e-procurement’s effect on log road length. See Online AppendixTable 2 for these estimates.
22
that for consulting projects e-procurement increased the period of time between the
tender notice and the opening of bidding, in which firms can learn about potential
contracts and prepare their bid documents.
A.2 Who Bids and Who Wins?
We next consider indicators of changing contractor identity. In column (3) of Table
3 we investigate the impact of e-procurement on the number of firms who express
an interest in bidding. These data are only available for Indonesia. For nearly every
works project, this process entails registering to be allowed to download the detailed
bid documents and participate in bid submission. For all consulting projects and a
small subset of works projects, expression of interest involves the submission of a
pre-qualification document on which firms are scored and a subset of those passing
are chosen to submit bids. The number of firms expressing interest in the case of
works projects more than doubles.
In column (4) we examine the number of firms submitting a complete bid. This
number is relatively low in India with the average manual procurement contract
receiving roughly 2.9 bids. This number is higher for Indonesia at over 7 bids per
works project and 3.2 per consulting project. However, in no instance does the
average number of bids increase due to e-procurement.
Column (5) examines whether e-procurement changes the likelihood that the
winning firm is based in the same area in which a project is tendered. While a
variable for contractor home province was available directly in the Indonesian data,
we proxy for firm default location in India with the modal district among those in
which the contractor was observed with contracts prior to e-procurement starting
anywhere in the country.9 In general, as with most construction projects, where
9In India, the only consistent firm identification data we observe is a unique ID within stateswhich does not link across states. Since some firms are not observed prior to the start of e-
23

moving equipment is quite costly and where there is often a need for local sources
of materials (e.g., hot asphalt), there is a strong tendency to be local: In India
nearly 60 percent of winning bids come from firms located in the same district and
in Indonesia over 80 percent of works contracts are won by firms from the same
province.
We observe a significant 11 percentage point decline in this variable in India and
a 23 percentage point decline for consultancy projects in Indonesia. Given that it
is much easier to move engineers geographically than to move heavy equipment and
asphalt plants, it is not surprising that the impacts for Indonesia – where cross-
provincial distances are much greater than the cross-district distances we observe in
India – are concentrated among consulting projects.
Finally, we examine in column (6) whether e-procurement changed entry of new
firms. Specifically, we examine whether the winning bidder was present and won a
contract bid in the first year of our data (2000 or 2001 for districts in India or 2004
for provinces in Indonesia). This regression is restricted to observations which fall in
years subsequent to these initial years. We observe a highly significant increase of 41
percentage points for consultancy projects in Indonesia, showing that e-procurement
leads to more contracts being won by pre-existing winning firms. Combined with
column (5), this suggests that e-procurement leads to projects being won by pre-
existing firms from other provinces.
One consistent explanation for these findings is that e-procurement improves
access to information for firms outside the area where procurement is taking place.
This is a relatively larger benefit for firms that are farther away and may also favor
pre-existing firms with a documented record of success.
procurement, the location variable is undefined for these firms and the associated observations areexcluded from this regression.
24
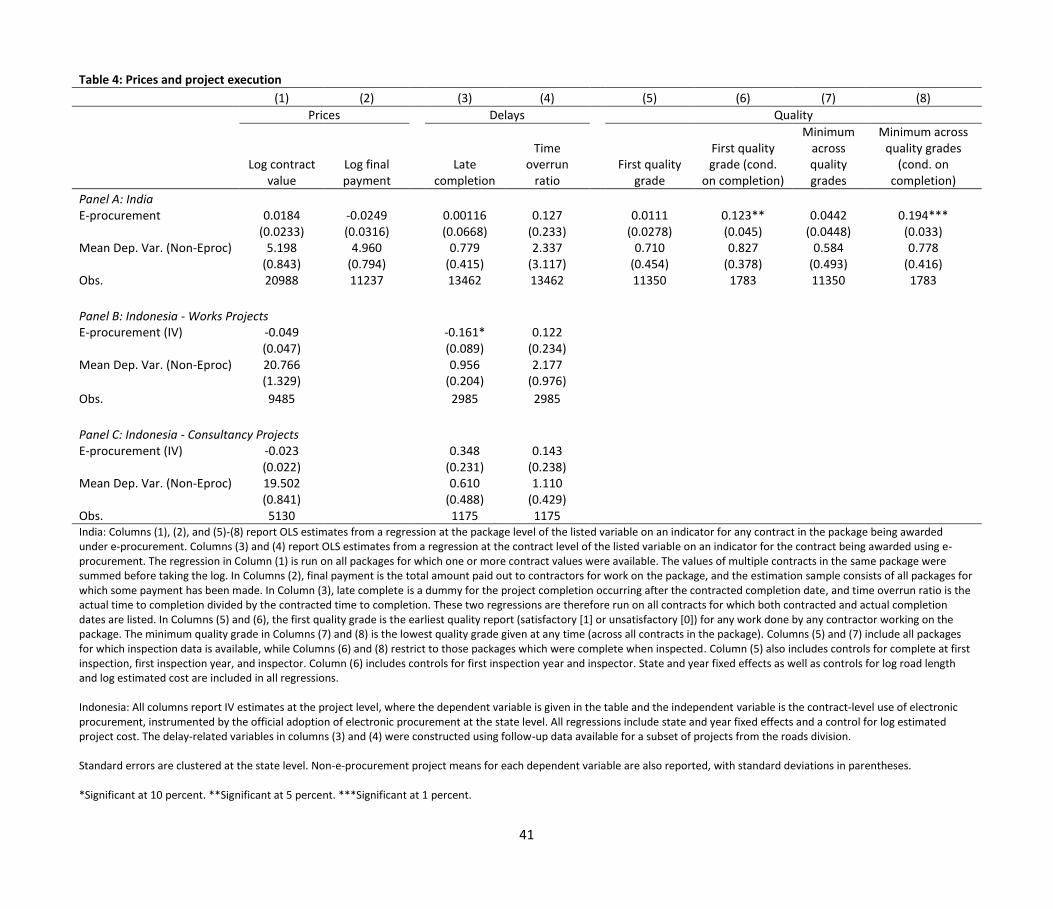
B Did E-Procurement Change Procurement Outcomes?
There are three main outcome variables about which the government cares when
procuring for the provision of a service/construction of a project: the price it pays
for the contract, the timeliness with which the contract is executed, and the quality
of work undertaken. In this section we examine the impact of e-procurement on
each of these three dimensions.
B.1 Prices
To examine the impact on prices paid, we first consider impacts in each country on
the contract value agreed upon between the winning bidder and the government.
Column (1) shows no statistically significant impact in India on log contract value,
conditional on the log length of the road and the log estimated cost of the road.
The point estimate is quite small – 0.02 – and the 95 percent confidence interval
ranges from -0.027 to 0.064. This means that we can reject the hypothesis that there
was more than 3 percent cost savings associated with e-procurement, based on the
original contract value. For Indonesia, conditional on the log estimated cost, the
point estimates for both works and consultancy projects suggest small reductions
in log contract value, though they are not statistically significant. The confidence
intervals suggest that, at 95 percent confidence, we can rule out price declines in
Indonesia of more than 14.1 percent for works projects and of more than 6.6 percent
for consulting projects.
Of course, the government does not care about the contract value, per se; rather,
the more important measure is the actual amount paid to the contractor. Cost
overruns are frequent, so as discussed above, the amount paid is typically higher
than the contract value. Column (2) examines the impact on the final amount
actually paid by the government, including any overruns or contract amendments.
25
Values for this variable are only available for India. Note that the observation count
falls substantially here since not all packages were complete at the time of data
collection.10 Again, no significant impact is observed. The point estimate for India
is a 2.5 percent drop in final payments, with the 95 percent confidence interval
ranging from a 8.7 percent decrease to a 3.7 percent increase. Given the uncertainly
around this point estimate and that of the effect on contract values, we are not able
to infer whether changes in final payments, if any, came through shifts in contract
values or changes in cost overruns. On net, the evidence in this section suggests
that there was no statistically detectable impact on prices paid for projects, and to
the extent there are effects we cannot detect, they are not overwhelming in size.
B.2 Project Timeliness
We next examine the first measure of quality of execution: delays in the execution
of projects. In column (3) of Table 4 we consider late completion – a dummy
taking value 1 if a project is finished after the contracted completion date and 0
otherwise.11 Late completion is very common in both countries. More than three
quarters of projects in India are completed late, while 95 percent of works projects
and more than half of consultancy projects in Indonesia are not finished on time.
In the case of Indonesian works projects, we see a significant 16 percentage point
decline in this variable associated with the adoption of e-procurement. We then
consider the time overrun ratio in column (4). This is the actual time to completion
divided by the contracted time to completion. For both India and Indonesian works
projects, we observe high levels of overrun – on average, actual time to completion
is more than double the contracted time. However, in neither country do we see a
10As we show subsequently, the date to completion is unaffected by e-procurement, so this typeof sample selection is unlikely to be of concern.
11We do not find significant effects of e-procurement on target timeline length in either India orIndonesia. Results can be found in Table 1 of the Online Appendix.
26
significant decline associated with adoption of e-procurement.12
B.3 Quality
In the final four columns of Table 4, we turn to package-level physical quality mea-
sures from a nation-wide auditing process. As described above, these data only
exist for the India sample. The Indian National Quality Monitoring process is co-
ordinated centrally, and inspectors audit a randomly selected bundle of roads (both
in progress and complete). Specifically, for auditing roads in a given season, the
national monitor is told how many of each type of project (complete and ongoing)
to sample and from which districts in a state. He then separately samples at ran-
dom from the lists of projects provided by the state road department. In addition,
inspectors are allocated follow-up audits for roads, and here, poorly graded roads
are oversampled.
Thus, only the first quality grade is randomly selected. We examine two vari-
ables: the first quality grade and the minimal quality grade for the road project given
by the national monitor. The minimum quality grade is the lowest quality grade
given during any of the inspector evaluations across all contracts in the package.
The quality score is measured as either 0 (unsatisfactory) or 1 (satisfactory). We
separately consider quality outcomes for all projects (including those in progress)
and for only completed roads.
In columns (6) and (8), we find highly significant impacts on both the first
and minimum quality grades for completed roads. E-procurement is associated
with increases of 12.3 and 19.4 percentage points in the first quality grade and
12Note that for Indonesian works, the point estimate on the time over-run ratio is positive whilethe dummy on late completion is negative. This is due to a few extreme outliers. If we trim thebottom and top 2.5 percent of observations, the coefficient and statistical significance in column (3)are essentially unchanged, but the point estimate in column (4) becomes -0.025, not statisticallysignificant.
27
worst quality grade, respectively. In contrast, we do not see any significant impacts
on incomplete works (columns 5 and 7). The evaluation of incomplete projects
may be inherently prone to greater measurement error because a project is behind
schedule, being revised, or is simply not far along enough to be accurately judged.
We see no evidence in the data that e-procurement leads to more abandoned (never
completed) contracts or to a differential number of incomplete projects at the time
of inspection, suggesting that the difference in significance of the quality estimates
cannot be explained by e-procurement driving low-quality contracts to an even lower
level that results in unfinished construction.
C Selecting Better Contractors, or Making Existing Contractors
Better?
We observe significant impacts of e-procurement on road quality in India and evi-
dence of reductions in delays in Indonesia. We also find that winning contractors
are more likely to come from outside areas. We now explore a potential channel
of influence: whether e-procurement changed the pool of contractors who bid and
caused better contractors to be selected.
To the extent that e-procurement improves outcomes, an important question
is whether it does so by selecting better contractors, or by encouraging existing
contractors to perform better. Selection effects would occur if the main effects
described above were primarily driven by e-procurement spurring new entrants, and
if those new entrants won; treatment effects on existing contractors could occur
if increased competition or lower corruption led these incumbent firms to submit
higher quality bids.
To investigate these possibilities, we conduct a two-stage strategy where we
first estimate a fixed effect for each firm in the data. This measures each firm’s
28

average quality. We then examine whether e-procurement leads to the selection of
higher quality firms. If it does – and if these coefficients match the overall effects
documented above – we can then conclude that selection effects play a large role.
On the other hand, if e-procurement does not change average firm quality, then
the quality and delay effects documented above must be arising through increased
performance from a given set of incumbent firms.
For each outcome of interest y, we initially estimate the following regression:
yicst = τc + αs + αt + δEPROCst +X ′icstγ + εicst (3)
where τc is a winning contractor fixed effect and EPROCst is a dummy for e-
procurement adoption in state s as of year t.13 We include state/province and year
fixed effects and controls as before. We generate a full set of contractor fixed effects
from this regression and then use them as the outcome variable in the following
regression:
τist = αs + αt + βEPROCst +X ′istγ + εist (4)
where τist is the estimated τc from the initial regression for the contractor winning
project ist. The estimation is weighted by the inverse variance of τc (as estimated
from the first stage). This regression asks how e-procurement affected the choice
of which contractors won a given package.14 Standard errors are clustered by both
state and winning contractor in each stage.
Examining prices in columns (1) and (2) of Table 5, we find no evidence sug-
gesting that the introduction of e-procurement was accompanied in either India or
13For Indonesia, we additionally include the dummy variable, EPROCPACKAGEicst, to ac-count for the fact that e-procurement adoption at the state level does not imply that all projectsin that province will be tendered using e-procurement.
14For Indonesia as before, we use EPROCPACKAGEist instrumented with EPROCst in thisregression.
29

Indonesia with the selection of winning firms that tend to make lower or higher
winning bid amounts for a given estimated cost.
We then examine delays. In column (3), we see that for works projects in
Indonesia, e-procurement was associated with firms that tended to be less late being
more likely to win. The magnitude of the coefficient – 0.058 – is about one-third
of the equivalent magnitude in column (3) of Table 4 – 0.161 – which suggests that
one-third of the effect is driven by changes in selection, while two-thirds of the effect
is driven by existing contractors performing better.
We also find substantial impacts on the average quality of contractors, as shown
in columns (6) and (8). The magnitudes of these coefficients are between fifty and
eighty percent of those for the overall quality effects in Table 4. This suggests that
the quality effect is driven primarily by higher quality contractors being selected
rather than by increased competition improving the quality of existing contractors.15
V Conclusion
This paper provides some of the first rigorous evidence on the impact of e-procurement
on contractual choice and subsequent contract outcomes. All told, the results present
a consistent story. E-procurement appears to have led to increased ability of firms
from outside the home region to win contracts. These firms, in turn, tended to be
higher quality firms in general, as measured by their average delay times (in Indone-
15In addition to improvements in terms of price and quality, ensuring the participation of smallerfirms may be an outcome that is desirable from the perspective of the government and influencedby the structure of procurement (Krasnokutsaya and Seim, 2011). To address the possibility ofsuch effects here, in Online Appendix Table 3 we examine whether winning contractors under e-procurement are more likely to be large firms, as proxied by whether they tend to be involvedwith larger projects. In India, e-procurement is associated with such a change when we considerthe outcome of log road length, but there is no significant impact for estimated project cost. InIndonesia, we see some increase in contractor size for works projects but it is very noisily estimated,while no effect is observed for consulting projects. These results suggest that e-procurement resultsin minor, if any, changes in the distribution of winning firm size.
30
sia) and average construction quality (in India). This led to improvements in the
quality of roads and timeliness but no detectable changes in price.
Following the increase in competition among firms for contracts brought about
by the adoption of e-procurement, a reduction in the rents accruing to winning firms
may be expected to occur either through an increase in quality for a given price or
a decrease in price for a given level of quality. In both the Indian and Indonesian
settings examined here, we see evidence in support of improvements in quality for
a given price. The fact that we observe changes on the quality margin, and that
it occurs through changing which contractors win rather than the performance of a
given set of winning contracts, suggests that the system prior to e-procurement was
not necessarily selecting the most efficient firms, and that e-procurement may have
improved efficiency even if it did not necessarily lower prices paid. It also suggests
that the practice of giving contracts to the lowest price bidder likely contributed to
greater inefficiencies on the quality margin.
Overall, our findings provide qualified support to the view that e-governance can
improve the provision of public services. E-procurement was a partial reform which
changed the application process but neither the rules for technical qualification
nor the requirement that the lowest price bidder receive the contract. Case-study
evidence suggests that official discretion in determining technical disqualification
is often an important way of limiting competition. Equally, emphasizing price over
quality (as occurs when lowest price bidder always wins) implies that bidders build in
their profit margins by cutting back on quality. E-procurement facilitated entry but
left significant discretion with officials in determining qualification, and the bidding
rules continued to prioritize low price over quality. Thus, it appears that the main
impact we see can be attributed to gains from trade associated with having reduced
barriers to entry. It is an open question whether a reform package which changes
31

both the application process and also the process of selecting among bidders could
lead to even larger gains in economic efficiency.
32

References
[1] Aker, Jenny C. (2010). Information from Markets Near and Far: The
Impact of Mobile Phones on Grain Markets in Niger. American Eco-
nomic Journal: Applied Economics, 2(3): 46-59.
[2] Aker, Jenny C., Christopher Ksoll, and Travis J. Lybbert (2012). Can
Mobile Phones Improve Learning? Evidence from a Field Experiment
in Niger. American Economic Journal: Applied Economics 4(4): 94-
120.
[3] Asker, John (2010). A Study of the Internal Organization of a Bidding
Cartel. American Economic Review 100(3): 724-62.
[4] Asker, John and Estelle Cantillon (2010). Procurement when price and
quality matter. RAND Journal of Economics 41(1), 1-34.
[5] Auriol, E. (2006). Corruption in Procurement and Public Purchase.
International Journal of Industrial Organization 24 (5), 867-885.
[6] Bandiera, O., A. Prat, and T. Valletti (2009). Active and Passive Waste
in Government Spending: Evidence from a Policy Experiment. Amer-
ican Economic Review 99(4), 1278-1308.
[7] Briceno-Garmendia, C., A. Estache, and N. Shafik (2004). Infrastruc-
ture Services in Developing Countries: Access, Quality, Costs and Pol-
icy Reform. World Bank Policy Research Working Paper No. 3468.
[8] Bobonis, G., L.C. Fuertes, and R. Schwabe (2010). Does Exposing Cor-
rupt Politicians Reduce Corruption? Unpublished paper, University of
Toronto.
33

[9] Burguet, Roberto and Yeon-Koo Che (2004). Competitive Procurement
with Corruption. RAND Journal of Economics 35(1), 50-68.
[10] Cai, Hongbin, J. Vernon Henderson, and Qinghua Zhang (2013).
China’s land market auctions: evidence of corruption? RAND Journal
of Economics 44(3), 488-521.
[11] Campante, Filipe, Ruben Durante, and Francesco Sobbrio (2014). Pol-
itics 2.0: The Multifaceted Effect of Broadband Internet on Political
Participation. NBER Working Paper 19029.
[12] Celentani, Marco and Juan-Jose Ganuza (2002). Corruption and Com-
petition in Procurement. European Economic Review 46(7), 1273-1303.
[13] Decarolis, Francesco (2014). Awarding Price, Contract Performance,
and Bids Screening: Evidence from Procurement Auctions. American
Economic Journal: Applied Economics 6(1): 108-132.
[14] Di Tella, Rafael and E. Schargrodsky (2003). The Role of Wages and
Auditing during a Crackdown on Corruption in the City of Buenos
Aires. Journal of Law and Economics 46(1), 269-292.
[15] Falck, Oliver, Robert Gold, and Stephan Heblich (2014). E-lections:
Voting Behavior and the Internet. American Economic Review, 104(7),
2238-65.
[16] Ferraz, Claudio and F. Finan (2008). Exposing Corrupt Politicians:
The Effect of Brazil’s Publicly Released Audits on Electoral Outcomes.
Quarterly Journal of Economics 123(2), 703-745.
[17] Freedom House (2012). Indonesia. Countries at the Crossroads, 2012
Edition.
34
[18] Government of Indonesia. (2003). Presidential Decree Number 80 of
2003. Retrieved from http://bumn.go.id/data/uploads/files/1/80.pdf.
[19] Gruber, Jonathan H. and Sendhil Mullainathan (2005). Do Cigarette
Taxes Make Smokers Happier. Advances in Economic Analysis and
Policy, v5(1), Article 4.
[20] Indonesia Procurement Watch (2011). “Laporan Survei: Je-
jak Suap Dalam Pengadaan Barang/Jasa Pemerintah. Avail-
able at http://www.iprocwatch.org/berita/utama/173-hasilsurvei-ipw-
qjejak-suap-dalam-pengadaan-barangjasa-pemerintahq.html.
[21] International Monetary Fund. International Financial Statistics.
Washington, DC.
[22] Jaber, Ahmed (2013). Broadband Internet and Political Behavior: Ev-
idence from the United States. Unpublished paper, Cornell University.
[23] Jensen, Robert (2007). The Digital Provide: Information (Technology),
Market Performance and Welfare in the South Indian Fisheries Sector.
Quarterly Journal of Economics 122(3), 879-924.
[24] Kenny, C. (2007). Construction, Corruption, and Developing Coun-
tries. World Bank Policy Research Working Paper No. 4271.
[25] Krasnokutskaya, E. and K. Seim (2011). Bid Preference Programs and
Participation Highway Procurement Auctions. American Economic Re-
view 101(6), 2653-86.
[26] Olken, B. (2007). Monitoring Corruption: Evidence from a Field Ex-
periment in Indonesia. The Journal of Political Economy 115(2), 200-
249.
35

[27] Onishi, Norimitsu (2009). “Corruption Fighters Rouse Resistance in
Indonesia.” The New York Times, July 26, 2009.
[28] Organisation for Economic Co-operation and Development. 2002. “The
Size of Government Procurement Markets.” OECD Journal on Budget-
ing 1(4), 8.
[29] Parlina, Ina (2011). “Graft Cases Show Need for Procurement Law:
Activists.” The Jakarta Post, July 25, 2011.
[30] Reinikka, R. and J. Svensson (2004). Local Capture: Evidence from
a Central Government Transfer Program in Uganda. The Quarterly
Journal of Economics 119(2), 678-704.
[31] Singer, Marcos, Garo Konstantinidis, Eduardo Roubik, and Eduardo
Beffermann (2009). Does e-procurement save the state money? Journal
of Public procurement 9(1), 58-78.
[32] Stromberg, David (2004). Radio’s Impact on Public Spending. The
Quarterly Journal of Economics 119(1), 189-221.
[33] Tran, A. (2008). Can Procurement Auctions Reduce Corruption? Ev-
idence from the Internal Records of a Bribe-Paying Firm. Harvard
Kennedy School job-market paper.
[34] United Nations Asia and Far East Institute (2008). Corruption Control
in Public Procurement. Second Regional Seminar on Good Governance
for Southeast Asian Countries.
[35] World Bank (2007). Electronic Government Procurement (e-GP): Op-
portunities and Challenges. World Bank Resources.
36

[36] World Bank and International Finance Corporation (2009). Enterprise
Surveys: Indonesia Country Profile 2009.
37
38
Table 1: Summary Statistics
India Indonesia
All All Works Consulting
Mean
Obs. Mean Obs.
Mean Obs.
Mean Obs.
(SD) (SD) (SD) (SD)
State/Province-year level Total projects 144.8 158
88.3 166
57.9 164
32.2 160
(184.9) (89.1) (40.3) (61.2)
Log total budget 9.610 158
25.674 166
25.610 164
22.886 160
(1.469) (0.944) (0.918) (1.156)
Package Level
Log estimated cost 5.211 22378
20.540 14657
20.952 9502
19.780 5155
(0.846)
(1.311) (1.350) (0.799)
Contracts in package 1.251 22378
(1.088)
Log total value of contracts in package 5.217 22378
(0.908)
Satisfactory quality at first inspection 0.715 11200
(0.451)
Contract level
Log contract value 4.529 26654
20.433 14623
20.826 9491
19.706 5132
(2.044) (1.322) (1.381) (0.799)
Log final payment 4.914 14813
(0.903)
Completion delay (days) 244.3 13781
(345.4)
Number of firms expressing interest 30.027 14665
35.104 9508
20.666 5157
(36.559) (43.389) (13.955)
Number of firms bidding 2.756 1628
6.031 14665
7.586 9508
3.165 5157
(3.075) (5.276) (5.904) (1.492)
Time notice to award 98.513 10410
83.579 6802
126.668 3608
(105.286) (97.552) (113.281)
Time bid open to award 29.066 9194
27.175 5973
32.572 3221
(17.648) (17.394) (17.581)
Winner won in first year 0.109 34126
0.282 9578
0.212 6896
0.463 2682
(0.312) (0.450) (0.408) (0.499)
Winner from same district/prov. 0.302 12871
0.734 6102
0.817 4152
0.556 1950
(0.459) (0.442) (0.387) (0.497)
Time overrun ratio 2.262 13628
1.876 4161
2.179 2986
1.083 1175
(3.018) (0.992) (0.991) (0.330)
Late 0.766 13628
0.832 4161
0.948 2986
0.537 1175
(0.423) (0.374) (0.223) (0.499)
39
Table 2: Budget Impact
State-year level
(1) (2)
Log (total estimated cost at state-year)
Number of projects in state-year
Panel A: India E-procurement -0.041 -54.39 (0.089) (60.72) Mean Dep. Var. (Non-Eproc) 9.55 139.20 (1.41) (184.07) Obs. 157 157 Panel B: Indonesia - Works Projects E-procurement (IV) 0.187 -3.559 (0.151) (7.069) Mean Dep. Var. (Non-Eproc) 25.211 45.102 (0.774) (28.803) Obs. 164 164 Panel C: Indonesia - Consultancy Projects E-procurement (IV) 0.374 7.641 (0.226) (8.486) Mean Dep. Var (Non-Eproc) 22.306 15.831 (0.888) (10.009) Obs. 160 160 India: Column (1) reports estimates from an OLS regression of log total estimated cost at the state-year level on an indicator for any contract being awarded under e-procurement in the respective state and year. Column (2) does the same using number of packages as the dependent variable. Log of road length and log of estimated cost are included as controls when not on the LHS. Indonesia: Columns (1) and (2) give results from OLS regressions at the state-year level, where the dependent variable is given in the table and the independent variable is the official adoption of electronic procurement at the state level. Column (2) includes a control for log total state-year estimated project cost. Both regressions include state and year fixed effects. Standard errors clustered at the state level are in parentheses below estimates. Means for each dependent variable are also reported, with standard deviations in parentheses. *Significant at 10 percent. **Significant at 5 percent. ***Significant at 1 percent.

40
Table 3: Contract Process
(1) (2) (3) (4) (5) (6)
Time elapsed
notice to award
Time elapsed
bid open to award
Number of firms
expressing interest
Number of firms bidding
Winner from same province/
district
Winner in first year
Panel A: India
E-procurement
0.364 -0.108*** 0.0222
[0.733] (0.029) (0.0218)
Mean Dep. Var. (Non-Eproc) 2.86 0.581 0.141
(3.52) (0.493) (0.348)
Obs.
1406 6545 26246
Panel B: Indonesia - Works Projects
E-procurement (IV) 48.75 -2.54 24.735* 0.420 -0.036 0.070
(38.24) (6.93) (13.657) (1.520) (0.057) (0.060)
Mean Dep. Var. (Non-Eproc) 64.89 25.33 17.456 7.005 0.816 0.245
(71.20) (29.43) (21.460) (5.057) (0.387) (0.430)
Obs. 6804 5974 9323 9408 4151 6895
Panel C: Indonesia - Consultancy Projects
E-procurement (IV) 54.15*** 9.88 -3.489 -0.242 -0.233* 0.414**
(19.10) (6.19) (2.561) (0.281) (0.133) (0.183)
Mean Dep. Var. (Non-Eproc) 98.00 26.13 11.069 3.178 0.650 0.446
(101.20) (48.53) (6.174) (1.468) (0.477) (0.497)
Obs. 3611 3223 5078 5107 1944 2682 India: All columns report OLS estimates from a regression at the contract level of the listed variable on an indicator for the contract being awarded using e-procurement. Column (4) is estimated on a subset of contracts for which we have bidding data in the states of Andhra Pradesh, Chhattisgarh, Karnataka, and Uttar Pradesh. Column (5) defines the district which a contractor is from as the modal district of the contractor’s observed contracts prior to e-procurement starting anywhere in the country. This regression is therefore restricted to contracts won by the cohort of contractors who were awarded contracts prior to e-procurement. Winner in first year (Column (6)) is an indicator for the winner having been awarded a contract in 2000 or 2001. This regression is restricted to observations after the first year. State and year fixed effects as well as controls for log of road length and log of estimated cost are included. Indonesia: All columns report IV estimates at the project level, where the dependent variable is given in the table and the independent variable is the contract-level use of electronic procurement, instrumented by the official adoption of electronic procurement at the state level. Values of time elapsed in columns (1) and (2) were available for a subset of provinces in 2004 and all provinces in subsequent years. Column (5) defines the province where the contractor is from as the province as that directly indicated in the data. This regression therefore excludes contracts based out of the national headquarters. Column (6) defines winner in first year as an indicator for the winner having been awarded a contract in 2004. This regression is restricted to observations after the first year in the data. State and year fixed effects as well as a control for log of estimated cost are included. Standard errors are clustered at the state level. Where brackets are used, p-values are given using the wild bootstrap method. Non-e-procurement project means for each dependent variable are also reported, with standard deviations in parentheses. *Significant at 10 percent. **Significant at 5 percent. ***Significant at 1 percent.
41
Table 4: Prices and project execution (1) (2) (3) (4) (5) (6) (7) (8)
Prices Delays Quality
Log contract
value Log final payment
Late completion
Time overrun
ratio
First quality grade
First quality grade (cond.
on completion)
Minimum across quality grades
Minimum across quality grades
(cond. on completion)
Panel A: India
E-procurement 0.0184 -0.0249 0.00116 0.127 0.0111 0.123** 0.0442 0.194***
(0.0233) (0.0316) (0.0668) (0.233) (0.0278) (0.045) (0.0448) (0.033)
Mean Dep. Var. (Non-Eproc) 5.198 4.960 0.779 2.337 0.710 0.827 0.584 0.778
(0.843) (0.794) (0.415) (3.117) (0.454) (0.378) (0.493) (0.416)
Obs. 20988 11237 13462 13462 11350 1783 11350 1783
Panel B: Indonesia - Works Projects
E-procurement (IV) -0.049
-0.161* 0.122
(0.047)
(0.089) (0.234)
Mean Dep. Var. (Non-Eproc) 20.766
0.956 2.177
(1.329)
(0.204) (0.976)
Obs. 9485
2985 2985
Panel C: Indonesia - Consultancy Projects
E-procurement (IV) -0.023
0.348 0.143
(0.022)
(0.231) (0.238)
Mean Dep. Var. (Non-Eproc) 19.502
0.610 1.110
(0.841)
(0.488) (0.429)
Obs. 5130
1175 1175 India: Columns (1), (2), and (5)-(8) report OLS estimates from a regression at the package level of the listed variable on an indicator for any contract in the package being awarded under e-procurement. Columns (3) and (4) report OLS estimates from a regression at the contract level of the listed variable on an indicator for the contract being awarded using e-procurement. The regression in Column (1) is run on all packages for which one or more contract values were available. The values of multiple contracts in the same package were summed before taking the log. In Columns (2), final payment is the total amount paid out to contractors for work on the package, and the estimation sample consists of all packages for which some payment has been made. In Column (3), late complete is a dummy for the project completion occurring after the contracted completion date, and time overrun ratio is the actual time to completion divided by the contracted time to completion. These two regressions are therefore run on all contracts for which both contracted and actual completion dates are listed. In Columns (5) and (6), the first quality grade is the earliest quality report (satisfactory [1] or unsatisfactory [0]) for any work done by any contractor working on the package. The minimum quality grade in Columns (7) and (8) is the lowest quality grade given at any time (across all contracts in the package). Columns (5) and (7) include all packages for which inspection data is available, while Columns (6) and (8) restrict to those packages which were complete when inspected. Column (5) also includes controls for complete at first inspection, first inspection year, and inspector. Column (6) includes controls for first inspection year and inspector. State and year fixed effects as well as controls for log road length and log estimated cost are included in all regressions. Indonesia: All columns report IV estimates at the project level, where the dependent variable is given in the table and the independent variable is the contract-level use of electronic procurement, instrumented by the official adoption of electronic procurement at the state level. All regressions include state and year fixed effects and a control for log estimated project cost. The delay-related variables in columns (3) and (4) were constructed using follow-up data available for a subset of projects from the roads division. Standard errors are clustered at the state level. Non-e-procurement project means for each dependent variable are also reported, with standard deviations in parentheses. *Significant at 10 percent. **Significant at 5 percent. ***Significant at 1 percent.
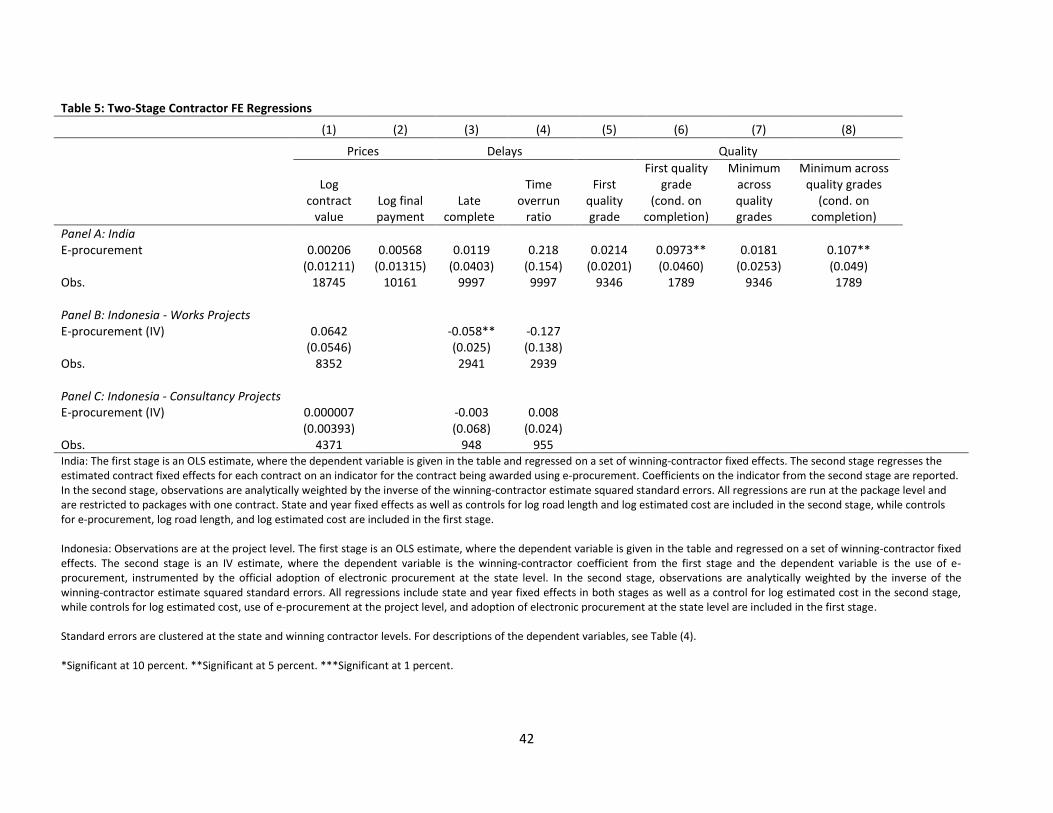
42
Table 5: Two-Stage Contractor FE Regressions
(1) (2) (3) (4) (5) (6) (7) (8)
Prices Delays Quality
Log contract
value Log final payment
Late complete
Time overrun
ratio
First quality grade
First quality grade
(cond. on completion)
Minimum across quality grades
Minimum across quality grades
(cond. on completion)
Panel A: India
E-procurement 0.00206 0.00568 0.0119 0.218 0.0214 0.0973** 0.0181 0.107**
(0.01211) (0.01315) (0.0403) (0.154) (0.0201) (0.0460) (0.0253) (0.049)
Obs. 18745 10161 9997 9997 9346 1789 9346 1789
Panel B: Indonesia - Works Projects
E-procurement (IV) 0.0642
-0.058** -0.127
(0.0546)
(0.025) (0.138)
Obs. 8352
2941 2939
Panel C: Indonesia - Consultancy Projects
E-procurement (IV) 0.000007
-0.003 0.008
(0.00393)
(0.068) (0.024)
Obs. 4371
948 955
India: The first stage is an OLS estimate, where the dependent variable is given in the table and regressed on a set of winning-contractor fixed effects. The second stage regresses the estimated contract fixed effects for each contract on an indicator for the contract being awarded using e-procurement. Coefficients on the indicator from the second stage are reported. In the second stage, observations are analytically weighted by the inverse of the winning-contractor estimate squared standard errors. All regressions are run at the package level and are restricted to packages with one contract. State and year fixed effects as well as controls for log road length and log estimated cost are included in the second stage, while controls for e-procurement, log road length, and log estimated cost are included in the first stage. Indonesia: Observations are at the project level. The first stage is an OLS estimate, where the dependent variable is given in the table and regressed on a set of winning-contractor fixed effects. The second stage is an IV estimate, where the dependent variable is the winning-contractor coefficient from the first stage and the dependent variable is the use of e-procurement, instrumented by the official adoption of electronic procurement at the state level. In the second stage, observations are analytically weighted by the inverse of the winning-contractor estimate squared standard errors. All regressions include state and year fixed effects in both stages as well as a control for log estimated cost in the second stage, while controls for log estimated cost, use of e-procurement at the project level, and adoption of electronic procurement at the state level are included in the first stage. Standard errors are clustered at the state and winning contractor levels. For descriptions of the dependent variables, see Table (4). *Significant at 10 percent. **Significant at 5 percent. ***Significant at 1 percent.

43
Appendix Table 1 State level
(1)
Difference in log contract value
Panel A: India E-procurement 0.0130
(0.0378)
Mean Dep. Var. (Non-Eproc) 0.202
(0.697)
Obs. 24
Panel B: Indonesia - Works Projects E-procurement (IV) -0.084
(0.115)
Mean Dep. Var. (Non-Eproc) -0.039
(0.538)
Obs. 30
Panel C: Indonesia - Consultancy Projects E-procurement (IV) 0.017
(0.235)
Mean Dep. Var (Non-Eproc) -0.491
(0.725)
Obs. 28 India: Column (1) reports an OLS estimate at the state level, where the dependent variable is the difference in log average contract value between 2000 and 2001. The independent variable is the year of official adoption of electronic procurement at the state level, conditional on adoption occurring after 2001. Indonesia: Column (1) reports OLS estimates at the state level, where the dependent variable is the difference in log average contract value between 2005 and 2004. The independent variable is the year of official adoption of electronic procurement at the state level, conditional on adoption occurring after 2005. Robust standard errors are in parentheses below estimates. Non-e-procurement project means for each dependent variable are also reported, with standard deviations in parentheses. *Significant at 10 percent. **Significant at 5 percent. ***Significant at 1 percent.

44
Figure 1: Number of Contracts by Number of Technical Disqualifications and Number of Bidders
Number of Bidders
Number of Technical Disqualifications
0 1 2 3 4
1 155 2 4 15 3 1 5 4 3 4 5 1 Total 163 15 5 4 1 This figure presents bidding data from a random sample of 190 road contracts issued between 2001 and 2006 in the Indian state of Uttar Pradesh (prior to e-procurement). Each cell is a count of tenders with the respective number of bidders and technical disqualifications. Technical disqualifications are intended to prevent a bidder who lacks the necessary expertise or equipment from competing. Blank cells indicate zeros. Note that the diagonal comprises all cases of all-but-one disqualified.
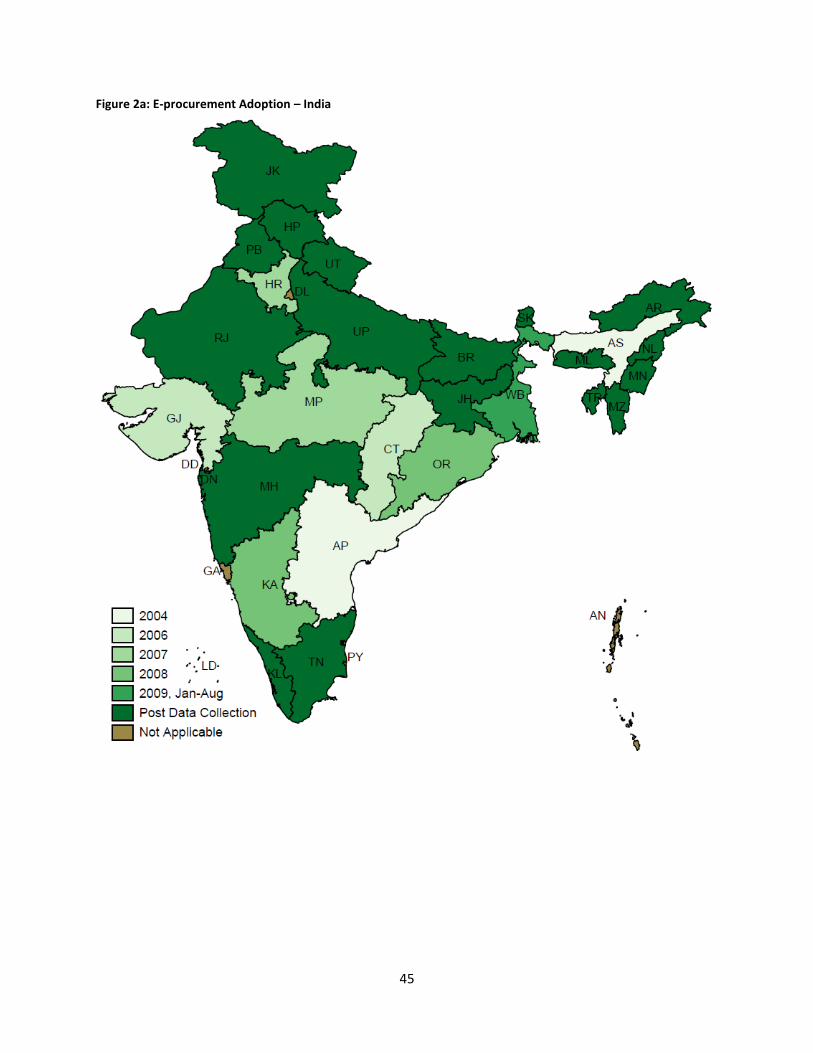
45
Figure 2a: E-procurement Adoption – India

46
Figure 2b: E-procurement Adoption – Indonesia