Can Brokers Have it All? On the Relation between Make-Take Fees … · · 2015-10-20On the...
51
Electronic copy available at: http://ssrn.com/abstract=2367462 This draft: March 31, 2015 Can Brokers Have it All? On the Relation between Make-Take Fees And Limit Order Execution Quality * Robert Battalio Mendoza College of Business University of Notre Dame [email protected] (574) 631-9428 Shane A. Corwin Mendoza College of Business University of Notre Dame [email protected] (574) 631-6026 Robert Jennings Kelley School of Business Indiana University [email protected] (812) 855-2696 Abstract We identify retail brokers that seemingly route orders to maximize order flow payments: selling market orders and routing limit orders to venues paying large liquidity rebates. Using a simple model, we demonstrate that this type of routing may not always be in customers’ best interests. For both proprietary limit order data and a broad sample of trades from TAQ, we document a negative relation between several measures of limit order execution quality and rebate/fee level. This finding suggests that order routing designed to maximize liquidity rebates does not maximize limit order execution quality and, thus, brokers cannot have it all. *The authors gratefully acknowledge research support from the Q-Group. We thank two anonymous referees, Jeff Bacidore, Peter Bottini, Bruno Biais (the editor), Colin Clark, Joe Gawronski, Alex Green, Larry Harris, Dave Lauer, Katya Malinova, Chris Nagy, Maureen O’Hara, Steve Poser, Paul Schultz, Jamie Selway, Jeff Smith, Chester Spatt, John Standerfer, Ingrid Werner, brownbag participants at Indiana University and the University of Notre Dame, seminar participants at Goldman Sachs, Cornell, Cubist Systematic Strategies, the University of Arizona, Vanderbilt University, Jump Trading, the Securities and Exchange Commission, and Nasdaq, and participants at the 2014 NOIP Conference, the 2014 FIRS Conference, the 2014 Florida State University SunTrust Beach Conference, and the 2014 Mid-Atlantic Research Conference in Finance for their comments.
Transcript of Can Brokers Have it All? On the Relation between Make-Take Fees … · · 2015-10-20On the...
Electronic copy available at: http://ssrn.com/abstract=2367462
This draft: March 31, 2015
Can Brokers Have it All? On the Relation between Make-Take Fees
And Limit Order Execution Quality*
Robert Battalio Mendoza College of Business
University of Notre Dame [email protected] (574) 631-9428
Shane A. Corwin
Mendoza College of Business University of Notre Dame
[email protected] (574) 631-6026
Robert Jennings
Kelley School of Business Indiana University
[email protected] (812) 855-2696
Abstract
We identify retail brokers that seemingly route orders to maximize order flow payments: selling market orders and routing limit orders to venues paying large liquidity rebates. Using a simple model, we demonstrate that this type of routing may not always be in customers’ best interests. For both proprietary limit order data and a broad sample of trades from TAQ, we document a negative relation between several measures of limit order execution quality and rebate/fee level. This finding suggests that order routing designed to maximize liquidity rebates does not maximize limit order execution quality and, thus, brokers cannot have it all. *The authors gratefully acknowledge research support from the Q-Group. We thank two anonymous referees, Jeff Bacidore, Peter Bottini, Bruno Biais (the editor), Colin Clark, Joe Gawronski, Alex Green, Larry Harris, Dave Lauer, Katya Malinova, Chris Nagy, Maureen O’Hara, Steve Poser, Paul Schultz, Jamie Selway, Jeff Smith, Chester Spatt, John Standerfer, Ingrid Werner, brownbag participants at Indiana University and the University of Notre Dame, seminar participants at Goldman Sachs, Cornell, Cubist Systematic Strategies, the University of Arizona, Vanderbilt University, Jump Trading, the Securities and Exchange Commission, and Nasdaq, and participants at the 2014 NOIP Conference, the 2014 FIRS Conference, the 2014 Florida State University SunTrust Beach Conference, and the 2014 Mid-Atlantic Research Conference in Finance for their comments.

Electronic copy available at: http://ssrn.com/abstract=2367462
1
Today, every U.S. stock exchange levies fees or pays rebates that are a function of an order’s
attributes. In the standard model, exchanges charge liquidity demanding orders (i.e., marketable orders) a
‘take fee’ that exceeds the ‘make rebate’ they offer liquidity supplying orders (i.e., nonmarketable limit
orders). More recently, a few exchanges began using inverted fee schedules, charging liquidity suppliers a
fee that exceeds the rebate they pay to liquidity demanders.1 Although these differential fee schedules
give traders increased flexibility, they are controversial. As noted by the Investment Company Institute in
their April 2010 letter to the Securities and Exchange Commission (SEC), “brokers may refrain from
posting limit orders on a particular exchange because it offers lower liquidity rebates than other markets,
even though that exchange offers the best possibility of an execution for those limit orders.”2
Although the SEC’s Order Protection Rule establishes price priority in U.S. equity markets, the
rule does not specify who trades first when multiple venues have the best posted price. Angel, Harris, and
Spatt (2010) note that across-exchange differences in fee schedules create situations in which equally
priced, nonmarketable limit orders resting on separate exchanges have different ‘net price’ priority.3 All
else equal, when two venues offer the best price, one expects liquidity demanders to route their orders to
the venue with the lower take fee. Consider the case where two exchanges are at the national best bid. If
sufficient selling supply arrives (perhaps because the seller is informed), liquidity will be exhausted as the
sell order walks down the limit order books at both exchanges. In this situation, limit orders on both
exchanges purchase shares at the bid price and suffer a short-term loss as the price falls. However, if the
price rises before liquidity is exhausted at the national best bid, only limit orders on the low-fee venue fill
and limit orders on the high-fee venue miss a profitable trading opportunity. We show that, on average,
limit orders routed to venues with high make rebates (and thus high take fees) execute less frequently and
are less likely to trade when prices move in their favor. This finding suggests that brokers routing limit
1 The difference between the fee and the rebate is an important source of exchange revenue. Given the competition between U.S. exchanges, there is a high correlation between the level of an exchange’s fee and its rebate. Fee structures at the various exchanges are described in more detail below. 2 See http://www.sec.gov/comments/s7-02-10/s70210-138.pdf. 3 As noted in Harris (2013), the ‘net’ prices resulting from maker-taker fees provide a form of sub-penny pricing which sophisticated electronic traders can use to step in front of other traders.

Electronic copy available at: http://ssrn.com/abstract=2367462
2
orders to venues with the highest make rebates may not be obtaining best execution for their clients.4
Why might brokers’ and clients’ interests diverge? Angel et al. (2010) claim that if fees and
rebates were passed through to clients, brokers would generally send limit orders to the venue that
maximizes the likelihood of execution, as brokers receive commissions only when orders execute. The
typical situation, however, is for the broker to retain any rebates and charge a fixed commission that
covers all fees and other costs of doing business. In a competitive market, brokers that receive the highest
rebates and/or pay the lowest fees to exchanges can offer the lowest commissions, all else equal. If
investors choose brokers based primarily on commissions, perhaps because they lack the sophistication
and/or information necessary to evaluate limit order execution quality, then brokers might use this
informational asymmetry to their advantage. In particular, brokers may choose to maximize revenue by
focusing on liquidity rebates when making order routing decisions.
Although we expect fee structure to have an important impact on limit order routing and the
arrival rate of marketable orders, fees may not be the only determinant of limit order execution quality.
For example, limit orders in volatile stocks, stocks with short limit order queues, or high-priced stocks
where the penny tick size is not binding, are likely to execute regardless of where they are routed.
Moreover, brokers may find it optimal to route marketable orders to venues with high take fees if those
venues offer sufficient price/depth improvement or provide other services such as competitively priced
co-location.5 It is also possible that the marginal broker/investor makes routing decisions such that limit
order execution quality is unrelated to a venue’s fee schedule. These considerations suggest that the link
between make/take fee schedules and limit order execution quality is an empirical issue. In this paper, we
analyze the relationship between fees and limit order execution quality using several alternative empirical
tests based on both proprietary limit order data and the NYSE’s TAQ database.
4 NASD NTM 01-22, which governs broker best execution obligations, notes that “in evaluating its procedures for handling limit orders, the broker dealer must take into account any material differences in execution quality (e.g., the likelihood of execution) among various market centers to which limit orders may be routed” and “must not allow an order routing inducement, such as payment for order flow … to interfere with its duty of best execution.” 5 Price improvement occurs when a marketable order trades at a price that is better than the posted quote. Depth improvement occurs when a marketable order trades against non-displayed liquidity at a price that is no worse than the posted quote. For a discussion, see UBS’s Best Execution Statement at http://www.ubs.com/content/dam/static/wmamericas/bestexecution.pdf.
3
We examine the order routing decisions of ten well-known national brokerages, using SEC-
mandated Rule 606 reports from the fourth quarter of 2012. The routing reports suggest that four of these
brokers route orders to capture liquidity rebates. In particular, these brokers sell market orders to market
makers and route limit orders exclusively to either market makers or the exchanges offering the highest
liquidity rebates (and charging the highest take fees) during our sample period.
To better understand the relationship between fees and limit order execution quality, we develop
a simple model formalizing the arguments of Angel et al. (2010). The model predicts that limit orders
resting on low-fee venues execute more frequently and in more favorable conditions than similarly priced
limit orders resting on high-fee venues. As a result, the expected realized spreads generated by standing
limit orders is lower on venues with higher take fees (and make rebates).6
To test the predictions of our model, we examine the relation between take fees and three
measures of limit order execution quality: the likelihood of a fill, the speed of fills, and the realized spread
associated with fills. We begin by analyzing proprietary limit order data obtained from a major investment
bank that uses a sophisticated algorithm to route orders. Univariate statistics from these data point to a
negative relation between take fees and limit order execution quality. However, as noted by Peterson and
Sirri (2002), univariate summary statistics ignore other factors that may affect both the order routing
decision and limit order execution quality.
To control for stock and market conditions that may affect limit order execution quality, we
identify identically-priced limit orders to buy (or sell) shares of the same stock displayed concurrently on
multiple venues. For these concurrent orders, market conditions are held constant and differences in fill
rates, execution speeds, and realized spreads can be linked directly to exchange characteristics such as the
rebate/fee schedule. Using these order pairs, we conduct ‘horseraces’ between different exchanges. In
6 Following prior literature and the definition codified in SEC Rule 11Ac1-5, we define the realized spread for an executed limit sell order as twice the difference between the execution price and the midpoint of the spread prevailing five minutes after the trade. For limit buy orders, we multiply by negative one. As noted by the SEC and illustrated in our model below, the average realized spread provides a summary measure that reflects both the probability of execution and the conditions in which orders execute. For a discussion and a more comprehensive list of execution quality considerations, see SEC Release 34-43590 (November 18, 2000).

4
nearly every comparison we make, the low-fee venue wins more horseraces (i.e., fills when the high-fee
venue does not or fills more rapidly) and has higher average realized spreads than the high-fee venue.
The results of the horseraces demonstrate that there are instances in which routing to the high-fee
venue provides diminished limit order execution quality. However, because simultaneous order display is
endogenously determined by the smart router, it is not clear whether these results can be generalized to a
broader sample of orders and trades. To analyze more general market conditions and order characteristics,
we provide a multivariate analysis of the association between take fees and execution quality. All else
equal, we find that fill rates for displayed limit orders are lower on exchanges with higher fees. In
addition, for filled limit orders, executions take longer on high-fee venues than low-fee venues and
generate lower realized spreads. These results confirm the negative relation between take fees and limit
order execution quality suggested by the horseraces and the univariate results.
The results from our proprietary data analysis suggest that routing all limit orders to a single
exchange that offers the highest liquidity rebate is inconsistent with maximizing limit order execution
quality. However, one might question the generalizability of these results, given that our order data
consist of institutional orders from a single broker and constitute only 1.5% of average daily trading
volume. Further, the fact that the proprietary orders are the product of the broker’s smart router may lead
to potential endogeneity issues. For these reasons, we also use the NYSE’s TAQ database to make
inferences regarding the across-venue execution quality of at-the-quote limit orders. Assuming that limit
orders set the displayed quotes on each venue, we can use TAQ data to examine whether take fees
influence where limit orders execute when multiple venues are at the inside quote, as well as the realized
spreads associated with these executions.
Consistent with our model’s predictions and the results of our order data analysis, we find that
average realized spreads for TAQ trades generally decrease in take fees. This result holds even after
controlling for trade characteristics, market conditions, and time-of-day effects. The exception to this
general pattern is the NYSE, which does better than expected given its fee structure. The NYSE results
suggest that fees are not the only determinant of cross-venue differences in limit order execution quality.
5
Consistent with Harris (2013), we find that the negative relation between fees and realized spreads is
stronger in low-priced stocks and when the aggregate depth at the relevant quote is large. Further, we find
that the impact of take fees is most pronounced at those times when the smart router executes trades on
inverted venues. This latter finding suggests that the smart router chooses to route to inverted venues
precisely when the benefits to doing so are most pronounced.
In general, brokers do not pass fees/rebates directly through to their customers. However, there
are a few exceptions. If rebates are passed through, the cum-rebate realized spread (i.e., realized spread
plus rebate) may be a more appropriate measure of execution quality. Our model demonstrates that
whether an investor who pays fees/earns rebates is indifferent to the broker’s order routing decision
depends crucially on the investor’s ultimate trading intentions. If the investor leaves the market when her
limit order goes unfilled, she is indifferent to the broker’s routing decision if expected cum-rebate realized
spreads are equal across venues. However, if the investor is committed to trade and converts unfilled limit
orders to marketable orders, she incurs additional trading costs on the higher fee venue that we refer to as
cleanup costs. As a result, the expected cum-rebate realized spread must be increasing in take fee for
committed investors to be indifferent to the broker’s routing decision. We find that average cum-rebate
realized spreads are increasing in take fee for both TAQ trades and trades in our proprietary dataset.
However, the relationship between cum-rebate realized spreads and take fees varies depending upon stock
characteristics and market conditions. For example, we find that the positive relation between cum-rebate
realized spreads and take fee is most pronounced for low-priced stocks and the relation turns negative for
those TAQ trades executed in the same second that a proprietary limit order executes on an inverted
venue. Overall, our analysis of cum-rebate realized spreads suggests that all investors, even those using
brokers that pass fees/rebates directly through to their customers, can benefit from informed order routing.
We document a strong negative relation between take fees and several measures of limit order
execution quality. Based on this evidence, we conclude that the decision of some national brokerages to
route all nonmarketable limit orders to a single exchange paying the highest rebate is not consistent with
the broker’s responsibility to obtain best execution for customers. We therefore propose several policy

6
prescriptions designed to mitigate the conflicts of interest inherent in the broker’s routing decisions when
execution venues employ make-take fee models.
The remainder of this paper is organized as follows. In Section I, we provide a brief literature
review. In Section II, we develop our hypotheses using a simple analytical model. In Section III, we use
publicly available data to investigate broker routing decisions. Section IV presents evidence on the
relationship between make-take fees and limit order execution quality based on proprietary order data. In
Section V, we use the NYSE’s TAQ database to investigate this relationship in a more general setting and
for a broader sample of stocks. Section VI concludes and provides policy prescriptions.
I. Related Literature
When an asset’s trading volume is concentrated on one venue, the limit order routing decision is
trivial. For U.S. equity markets, the order routing decision became more substantive after the
Consolidated Tape introduced pre-trade transparency in 1982. By allowing trading venues to benchmark
their trades against each other’s quotes, competition for retail order flow became more intense, with
venues competing along different dimensions to attract orders. According to the SEC (2000), broker-
dealers making order routing decisions “must consider several factors affecting the quality of execution,
including, for example, the opportunity for price improvement, the likelihood of execution (which is
particularly important for customer limit orders), the speed of execution, and the trading characteristics of
the security, together with other non-price factors such as reliability and service.”
Increased competition for customer orders leads naturally to the question of whether execution
quality differs across venues. The SEC’s (1997) “Report on the Practice of Preferencing,” contains one of
the first cross-venue analyses of retail limit order execution quality. In this study, the SEC documents fill
rates, time-to-execution, and realized spreads for limit orders that execute on various U.S. exchanges.
Their analysis does not, however, control for the endogeneity of order routing decisions.
To ensure that routing retail limit orders away from the NYSE did not degrade execution quality,
regional exchanges implemented rules that benchmarked their limit order executions to NYSE limit order
executions. Using a methodology that allows them to control for market conditions and order submission

7
strategies, Battalio et al. (2002) find that these rules were effective at producing limit order execution
quality that was competitive with the NYSE.
Concerned that some brokers might maximize order flow payments rather than execution quality,
the SEC passed Rule 11Ac1-5 (now Rule 605) and Rule 11Ac1-6 (now Rule 606) in 2001. Together,
these rules are intended to bring sufficient transparency for investors to determine whether their brokers
are making optimal order routing decisions. Rule 605 requires exchanges to produce execution quality
statistics on a monthly basis. Rule 606 requires brokers to reveal on a quarterly basis the destinations to
which they route orders and whether they receive compensation for their routing choices. Consistent with
the rules’ objectives, Boehmer, Jennings and Wei (2007) find that the routing of marketable order flow
became more sensitive to cross-venue changes in execution quality after Rule 605 execution quality
statistics became available.
More recently, Foucault and Menkveld (2008) examine how market fragmentation and fee
differentials affect limit order execution quality when price priority is not enforced across markets. When
the two markets they examine are both at the inside quote, they find that smart routers predominately send
orders to the market with the lowest fee. They also find evidence that violations of price priority across
the two markets adversely affect liquidity provision. Consistent with the idea that marketable order flow
is sensitive to take fees, Cardella, Hao and Kalcheva (2013) find that reductions in relative take fees in
U.S. equity markets are associated with increased market share.
Colliard and Foucault (2012), Foucault, Kadan and Kandel (2013), and O’Donoghue (2014)
theoretically model how make-take fees affect liquidity supply. Colliard and Foucault consider how an
exchange competing with a dealer market should optimally set its make-take fee schedule. They conclude
that, although competition among exchanges leads to reduced trading fees, investors can be worse off if
the lower trading costs induce them to post orders with a lower probability of execution. Foucault et al.
(2013) examine whether it is the net fee or the relative levels of the make and take fees that matter. They
argue that exchanges can maximize their trading volume by differentiating their make and take fees. If
there is not enough liquidity demand (supply), the venue can decrease (increase) its take fee and its make

8
rebate. O’Donoghue (2014) finds that adding a broker to the Colliard and Foucault (2012) model makes
investor decisions and market equilibria sensitive to the level of rebates/fees in addition to the net fee.
Perhaps due to the availability of superior data, the relation between limit order execution quality
and make-take fees has received more attention in the practitioner arena than in academic research.7
Sofianos, Xiang, and Yousefi (2010) use nonmarketable limit orders placed on six exchanges by the
Goldman Sachs smart router, SIGMA, to examine the relation between take fees and limit order execution
quality. Using only those limit orders split between two exchanges, Sofianos et al. make pairwise
comparisons of execution quality across exchanges. As all non-venue specific factors are the same, they
note that differences in execution quality are either due to adverse selection risk or differences in fill rates.
They find the venue utilizing an inverted make-take schedule has larger realized spreads, faster fills, and
higher fill rates than the other five exchanges. Ignoring fees, these results suggest that brokers routing all
nonmarketable limit orders to venues with high take fees disadvantage their clients.
Using a proprietary dataset of orders generated from a Goldman Sachs execution algorithm,
Bacidore, Otero and Vasa (2011) investigate the benefits of smart routing using six order routing
strategies. For limit orders, they examine one strategy that follows the ‘naïve’ approach of maximizing
rebates and two strategies that attempt to maximize fill rates. For marketable order flow, they analyze one
algorithm that minimizes take fees and two that consider both take fees and hidden liquidity. For limit
orders, they find that the naïve strategy delivers inferior execution quality, even after accounting for
rebates. For marketable orders, they find smaller differences in execution quality across algorithms, which
they argue is “intuitive given the Reg. NMS protections on market orders.” For large capitalization stocks,
they find some benefit to routing on the basis of both fees and the prospect of hidden liquidity.
Finally, Pragma Trading (2013) illustrates a broker-customer agency issue related to the conflict
we examine. Their focus is the broker’s choice of order type rather than the broker’s venue choice that we
study. After identifying “trading opportunities” based on order imbalances, they consider the decision to
7 One exception is Yim and Brzezinski (2012), who construct an empirical model that uses publicly available trade and quote data to estimate average limit and market order arrival rates, limit order cancelation rates, and limit order queue lengths for three stocks in April of 2011. For these stocks, the authors find that inverted venues generally have shorter times-to-execution.
9
trade aggressively by reaching across the quote with a market order versus simply joining the quote with a
limit order and altering the limit price if the quote changes. The customer is focused on implementation
shortfall, which is fixed for the aggressive order, but the broker also considers the rebates/fees, which
vary based on the trading signal’s strength for the aggressive order. Thus, the broker sometimes pursues
the passive strategy to capture rebates instead of minimizing shortfall.
We contribute to this literature along a number of dimensions. First, we identify several retail
brokerages whose order routing decisions appear consistent with the objective of maximizing rebates and
examine whether this type of order routing appears to disadvantage limit order traders. In addition to
extending the analysis of Sofianos et al. (2010), we use both proprietary and publicly available data to
investigate these issues in more general settings. We also provide a comparison of results between
proprietary order data and the broader sample of TAQ trades and examine whether the conclusions
change when fees/rebates are passed through to customers. Overall, we provide strong empirical evidence
of a negative relation between take fees and multiple dimensions of limit order execution quality.
II. Hypothesis Development
A. Make/take fees and limit order execution quality
Consider an asset trading on two exchanges, each operating as an electronic limit order book.8
The first exchange is a high-fee venue that charges liquidity demanders a take fee of R > 0 per share on
trades and uses this revenue to pay liquidity suppliers a make rebate of R per share when their orders
execute. The second exchange is a low-fee venue that does not charge take fees or offer make rebates.
There are two investors and each would like to buy Q shares at a limit price P that establishes the
National Best Bid (NBB) for the asset, which has an uncertain terminal value of V per share. We take the
National Best Offer (NBO) as given. Without loss of generality, we assume Q = 1 and NBB < E[V] <
NBO. The first investor’s broker routes her order to the high-fee venue, while the second investor’s
broker routes his order to the low-fee venue.
8 We thank the editor, Bruno Biais, and an anonymous referee for suggesting this modeling framework, which is motivated by Glosten (1994) and Biais, Martimort, and Rochet (2000).

10
Assume that an impatient seller arrives in the market. In the spirit of Easley and O’Hara (1987),
the seller places a market order to sell Z = 1 share if he is uninformed and trading for liquidity reasons,
and Z = 2 shares if he is motivated by private information. Thus, E[V|Z=1] = E[V] and E[V|Z=2] < NBB.
When the seller is uninformed, we assume that he (or his broker) seeks to minimize take fees and
therefore routes to the low-fee venue. If the seller is informed, his large market order exhausts all depth at
the NBB and the limit orders on both venues fill.
What are the economic implications of displaying a nonmarketable limit order on the low- or the
high-fee venue? Harris (2003) asserts that the two risks associated with using standing limit orders are
execution uncertainty and adverse selection. In our simple model, the standing buy order displayed on the
low-fee venue faces less execution uncertainty, as it fills regardless of the motivation behind the impatient
trader’s decision to sell shares. The standing buy order on the high-fee venue, however, executes only
when the seller is informed. Thus, the limit order on the high-fee venue faces more execution risk and
more adverse selection than the limit order on the low-fee venue.
This framework allows us to illustrate that the expected (or average) realized spread captures both
execution uncertainty and adverse selection risk. For limit orders, we define the expected realized spread
as the signed difference between the value of the asset prevailing sometime after the trade and the limit
price.9 The expected realized spread for a limit buy order on the low-fee exchange is
E[Realized Spread Low Fee] = Pr(Z=1) x (E[V] – NBB) + Pr(Z=2) x (E[V|Z=2] – NBB), (1)
and the expected realized spread for a limit buy order on the high-fee exchange is
E[Realized Spread High Fee] = Pr(Z=2) x (E[V|Z=2] – NBB). (2)
Thus, the expected realized spread depends on losses suffered when trading against better informed
individuals and, for the order on the low-fee venue, gains from supplying liquidity to uninformed
individuals. Because (E[V] – NBB) is greater than zero, equations (1) and (2) suggest that, for similarly
9 As noted earlier, our empirical measure of the realized spread on an executed limit sell (buy) order is two (negative two) times the difference between the execution price and the subsequent midpoint. We drop the ‘2’ here to simplify the presentation.
11
priced standing limit orders, the expected realized spread is higher on the low-fee venue. Assuming that
liquidity demanders trade first on the low-fee venue, this leads to our first testable hypothesis.
Hypothesis 1: The average realized spread generated by standing limit orders is decreasing in take fee.
Some might argue that liquidity rebates, if passed through to investors, provide just compensation
for the increased execution risks encountered on high-fee exchanges. To evaluate this argument, we must
make an assumption about what investors do when their limit orders are not executed. We first assume
that investors leave the market if their orders go unfilled, and thus, do not incur cleanup costs. For such
investors to be indifferent to having their standing orders rest on the low-fee or high-fee venue, the
expected cum-rebate realized spread (i.e., realized spread plus rebate) must be equal across venues. For
buy orders, we have:
Pr(Z=1) x (E[V] – NBB) + Pr(Z=2) x (E[V|Z=2] – NBB) = Pr(Z=2) x (E[V|Z=2] – NBB + R). (3)
More formally, this gives:
Hypothesis 2a: If there are no cleanup costs associated with unfilled limit orders and investors are indifferent as to the venue on which their order is displayed, the average cum-rebate realized spread generated by similarly priced limit orders is equal across high- and low-fee venues.
Assuming the investor submitting the limit buy order is committed to owning the asset, one might
expect her to cancel an unexecuted limit order and replace it with a more aggressively priced order. In the
spirit of Harris and Hasbrouck (1996), we assume that unfilled limit orders are cancelled and replaced
with marketable orders. We further assume that, if placed, the marketable order executes against a
standing limit sell order resting on the low-fee venue at a price P = NBO > E[V].
For the committed investor to be indifferent to having their limit buy order displayed on the low-
fee or high-fee venue, the expected cum-rebate realized spread on the low-fee venue must equal the
expected cum-rebate realized spread on the high-fee venue net of expected cleanup costs. By assumption,
expected cleanup costs are Pr(Z=1) x (E[V] – NBO) on the high-fee venue and zero on the low-fee venue.
Incorporating these cleanup costs into equation (3) gives:

12
Pr(Z=1) x (E[V] – NBB) = Pr(Z=2) x R + Pr(Z=1) x (E[V] – NBO). (4)
Equation (4) shows that the expected rebate offered by the high-fee venue must be large enough to offset
the costs associated with cancelling unexecuted orders and replacing them with marketable orders that
execute at the offer price. Noting that E[V] – NBO < 0, we obtain our final hypothesis:
Hypothesis 2b: If investors replace unfilled limit orders with marketable orders and are indifferent as to the venue on which their order is displayed, the average cum-rebate realized spread generated by similarly priced limit orders is increasing in take fee.
B. Broker routing under the objective of maximizing rebate and commission revenue
In this section, we extend our model to include a broker that makes the order routing decision.
Consistent with the premise of Angel et al. (2010), we assume that the broker’s customers lack the
sophistication/information to properly consider limit order execution quality when evaluating their broker
and instead choose the broker with the lowest commission. We further assume that the broker charges a
fixed commission, C, and does not pass fees and rebates through to the customer. The broker receives a
limit order to buy Q shares with a limit price of P = NBB and can route the order either to the high-fee
venue, which offers a make rebate and a take fee of R, or to the low-fee venue, with no make rebates or
take fees. Drawing on the discussion in the prior section, the fill rate for at-the-quote limit orders routed to
the low-fee venue is defined as FLowFee and the fill rate for similar limit orders routed to the high-fee venue
is defined as FHighFee, where FLowFee > FHighFee. Finally, we assume investors cleanup unfilled limit orders
by placing marketable orders with probability δ.
The broker expects to earn FLowFee x C + (1- FLowFee) x δ x C if it routes the order to the low-fee
venue and FHighFee x C + (1 - FHighFee) x δ x C + FHighFee x R x Q if it routes to the high-fee venue. Thus, if
the broker’s goal is to maximize revenue, it is straightforward to show that the broker should route the
order to the high-fee venue if
FHighFee x Q x R > (FLowFee – FHighFee) (1 – δ) C. (5)
The left hand side of this inequality represents the make rebate revenue the broker earns on every
standing limit order executed on the high-fee venue. The right hand side represents the opportunity cost of
routing to the high-fee venue (i.e., the lost commission).
13
Suppose investors always cleanup missed executions (i.e., δ = 1). In this case, there is no broker
opportunity cost associated with routing limit orders to the high-fee venue, as all unfilled limit orders are
converted to market orders and brokers always earn the commission. Under these conditions, brokers
seeking to maximize rebate and commission revenue always send limit orders to the high-fee venue.
Even when investors never clean up missed executions (i.e., δ = 0), the broker might prefer the
high-fee venue. In this situation, the routing decision depends on the size of the order, the size of the
rebate, the size of the commission, and the difference in fill rates between the low-fee and high-fee
venues. For example, if we set C = $8.00 (a typical commission), R = $0.0032 (the highest quoted
liquidity rebate during our sample period), FHighFee = 75%, and Q = 100 shares, equation (5) suggests that
the broker routes to the high-fee venue if (FLowFee – FHighFee) < 3%. If we increase Q to 500 shares, the
broker chooses the high-fee venue as long as (FLowFee – FHighFee) < 15%.
This numerical example illustrates that even when a revenue-maximizing broker loses
commissions on unexecuted orders, the rebate revenue available on the high-fee venue can entice the
broker to route orders to this venue, despite the lower fill rate. As the percentage of investors that clean up
unfilled orders grows, it becomes more likely that a revenue-maximizing broker finds it optimal to choose
higher rebates over higher fill rates.
III. SEC Rule 606 Data and Observed Broker Routing Decisions
Market makers profit by selectively purchasing and executing market orders and marketable limit
orders from multiple brokers. One constraint on a market maker’s ability to interact with purchased order
flow is FINRA Rule 5320, which states that a market maker holding a nonmarketable limit order “is
prohibited from trading that security on the same side of the market for its own account at a price that
would satisfy the customer order.”10 Thus, because market makers pay for orders only when they can
trade against them, brokers can obtain higher order flow payments by segregating their marketable and
nonmarketable orders. One such strategy is to sell marketable orders to market makers and to route
nonmarketable limit orders to venues offering high make rebates. In this section, we present evidence that 10 See FINRA’s May 2011 Regulatory Notice 11-24.
14
several U.S. retail brokerages make order routing decisions that appear consistent with this strategy of
capturing rebates. In subsequent analyses, we examine the potential impact of these routing decisions on
limit order execution quality.
We begin by identifying ten popular brokers appearing in Barron’s or Smart Money’s 2012
broker surveys. From these brokers’ websites, we collect Rule 606 reports for the fourth quarter of 2012.
Rule 606 requires that brokers reveal the fraction of their orders that were non-directed (i.e., the customer
did not choose the routing destination) and to report the percentage of these orders that were market
orders, limit orders, and other orders. Furthermore, for each of its top ten routing destinations and for any
venue receiving at least 5% of its non-directed orders, Rule 606 requires brokers to report the percentage
of market, limit, and other orders routed to that venue. SEC clarification on this requirement states that a
broker “is not required to identify execution venues that received less than 5% of non-directed orders” as
long as the broker “has identified the top execution venues that in the aggregate received at least 90%” of
its total non-directed orders.11 Consequently, while Rule 606 filings identify the most important venues
utilized by each broker, they may not provide a complete record of a broker’s order routing decisions.
We summarize the self-reported routing decisions of the sample brokers in Table 1, with results
for NYSE-listed securities in Panel A and results for Nasdaq-listed securities in Panel B. For brevity, we
focus our discussion on the results for NYSE-listed securities. The results for Nasdaq-listed securities are
similar. The brokers in our sample route to six venues that utilize standard fee schedules. For each of
these venues, and for three inverted venues that are not utilized by our sample brokers, the table lists the
range of published rebates and fees obtained from Traders Magazine and the SEC. The three venues that
charge SEC Rule 610’s maximum permissible take fee of $0.30 per hundred shares as their base fee are
DirectEdge X (EDGX), the Nasdaq Stock Market (NDAQ), and the NYSE-Arca Exchange (ARCA). Of
these venues, EDGX offered the highest published liquidity rebate ($0.32 per hundred shares). In contrast,
the Nasdaq OMX BX (BX) used an inverted fee schedule, paying liquidity demanders $0.14 per hundred
11 See the SEC’s Division of Market Regulation: Staff Legal Bulletin No. 13A, “Frequently Asked Questions About Rule 11Ac1-6,” which can be found at http://www.sec.gov/interps/legal/mrslb13a.htm#P81_9811.

15
shares and charging liquidity suppliers $0.15 to $0.18 per hundred shares.
[Insert Table I about here.]
Nine of the brokers route at least a portion of their orders to market makers that offer payment for
marketable orders. Moreover, Charles Schwab, Morgan Stanley, Edward Jones, Just2Trade, and
LowTrade route all non-directed market and limit orders to market makers that purchase order flow
(although LowTrade and Just2Trade indicate that they do not accept payment for order flow, Edward
Jones reports “no material economic relationship” with the market makers, and Morgan Stanley reveals
no payment for order flow). By routing all of their orders to market makers, these brokers ensure that their
limit orders can trade against both their own and the purchaser’s marketable orders. Whether or not this
routing strategy is preferable to alternative strategies is a question that we cannot address with our data.
The five brokers that do not delegate the handing of customer limit orders to market makers route
their limit orders to one or more of the exchanges with a standard fee schedule. Of these, Interactive
Brokers (IB) was the only broker to utilize more than one exchange, routing 30% of its limit orders to two
exchanges that charged the maximum permissible take fee (NDAQ and ARCA), 14% to the venue with
the second highest take fee (BZX), and 47% to the standard exchange with the lowest take fee (NYSE). In
its Rule 606 filing, IB states that its smart routing system “continually scans competing market centers
and automatically seeks to route orders to the best market, taking into account factors such as quote size,
quote price, liquidity-taker costs, liquidity-provider rebates and the availability of automatic order
execution.” Depending on the quality of its order router, IB’s Rule 606 filing could provide an example of
‘optimized’ order routing.
Four sample brokers, Ameritrade, E*Trade, Fidelity, and Scottrade, route orders in a manner that
suggests a focus on liquidity rebates. Each of these brokers charges a fixed commission and none pass
order flow inducements directly through to their customers.12 Three of these brokers sell the vast majority
of their market orders to market makers and route their limit orders either to market makers or to the 12 The 2013 broker review on the website stockbrokers.com notes that none of these four brokers pass rebates through to customers. E*Trade’s brokerage agreement states that “I understand that this remuneration, known as ‘payment for order flow,’ is considered compensation to E*Trade.” Two of the other brokers have similar statements in their brokerage agreements, while the third states “we (the broker) may receive rebates” and does not mention that the customer receives anything.
16
venue offering the most lucrative published liquidity rebates, EDGX. Ameritrade routes 49% of its limit
orders to EDGX and 45% to market makers, E*Trade routes 46% of its limit orders to EDGX and 51% to
market makers, and Fidelity routes 57% of its limit orders to EDGX and 28% to market makers.13 Finally,
Scottrade routed 28% of its limit orders to EDGX, 51% to the Lava ATS (a venue with high rebates), and
the remainder to market makers. Since Rule 606 data do not distinguish between marketable and non-
marketable limit orders, we cannot separate routing decisions based on marketability. However, given that
these brokers choose to sell their market orders to market makers rather than route them to venues with
take fees, it is likely that the majority of limit orders routed by these brokers to market makers are also
marketable and the majority of their limit orders routed to EDGX and Lava are nonmarketable.14
The evidence in Table I points to heterogeneity in order routing decisions across brokers. The
routing decisions of five brokers suggest that they delegate the handling of their limit orders to market
makers. Interactive Brokers’ routing suggests that it found the NYSE, the venue with the lowest non-
negative make rebate and the smallest positive take fee, to be an attractive venue for a large fraction of its
limit orders. However, for four of the brokers we examine, it appears that rebates are a significant
determinant in where they route orders. In particular, it appears that these brokers route 100% of their
nonmarketable limit orders to the venue(s) offering the highest rebate.
IV. Make-Take Fees and Limit Order Execution Quality: Proprietary Order Data
A. Data
To examine limit order execution quality, we obtain order data from a major broker-dealer’s
smart order routing system for October and November 2012. The data contain 28,627,467 orders,
including orders from the broker-dealer’s algorithmic trading system and orders entered directly by 13 Notably, while the routing percentages for Ameritrade’s and E*Trade sum to 94% and 97%, respectively, Fidelity’s percentages sum to only 85%. These values suggests that the remaining 15% of Fidelity’s limit orders were routed to venues that received less than 5% of the firm’s non-directed orders. Thus, although Fidelity’s routing appears consistent with maximizing liquidity rebates, without better (non-public) data we cannot rule out the possibility that the remaining 15% of Fidelity’s limit orders were routed based on other considerations. Notably, Fidelity’s Rule 606 filing for not-held institutional orders for fewer than 10,000 shares reveals a limit order routing strategy that is very different from its retail limit order routing strategy. In the fourth quarter of 2012, Fidelity routed 23% of its institutional limit orders to market makers, 35% to the NYSE (take fee of $0.23), 17% to the BZX (take fee of $0.29), 9% to NDAQ (take fee of $0.30) and 8% to EDGX (take fee of $0.30). 14 In his testimony before the Senate’s Permanent Subcommittee on Investigations, an executive from Ameritrade stated that his firm routed virtually every order to the market that offered the largest inducement. See the June 17, 2014 New York Times article, “At Senate Hearing, Brokerage Called Out for Conflicts,” by William Alden.

17
customers. These orders are almost exclusively from institutional investors (e.g., hedge funds, mutual
funds, etc.). Furthermore, the vast majority are the result of the broker-dealer’s order routing algorithm,
which breaks the original (parent) order into many smaller (child) orders and routes them to various
exchanges based on proprietary criteria established by the broker-dealer. Even if the arrival of a parent
order is random, we expect that the routing of child orders is sensitive to order characteristics and market
conditions.15 We therefore attempt to control for these factors in our analysis to follow.
Each record contains data about the order, the destination venue, a time-stamped order history,
and information about the order outcome. The order is defined by the ticker symbol, date, order side (buy,
sell, and short sell), order size, the amount of that size to be displayed, time in force (all orders are day
orders), order type (market, market on open, market on close, limit, limit or better, limit on open, and
limit on close), and limit price if applicable. Events in the order’s life are time-stamped in microseconds
(µs - millionths of a second). Recorded events are order submission time and, if applicable, reject time,
first fill time, last fill time, replace time, and cancel time. Should an order receive a full or partial fill, the
order history also contains the quantity of shares done and the average fill price.
We examine orders arriving during regular market hours and, if filled, filling by 4:02 p.m. These
restrictions reduce the sample to 28,456,733 orders (99.4% of the original sample). The data appear to be
of high quality. Checking for obvious data errors (e.g., outcome time before order time, negative size or
quantity done, or quantity done exceeding order size), we exclude only 29 orders. To focus on straight
limit orders, we remove 125,565 orders that are not classified as simple limit orders and 11,988 orders
with an average trade price worse (higher for buy orders or lower for sell orders) than the limit price.
Finally, we focus on orders for NYSE and Nasdaq listed common stocks (CRSP share code 10 or 11) with
a price of at least $1.00 during the sample period.
We use Daily TAQ data to match quote data to order arrival time using the Holden and Jacobsen
(2013) corrections. We subjectively discard 97,637 orders with limit prices more than ten percent from
15 As our data do not allow us to link parent and child orders, we treat each order routed to a venue as an independent order.

18
the quoted spread midpoint (ask price plus bid price divided by two). The resulting sample includes
19,551,459 limit orders involving 2,758 unique ticker symbols.
[Insert Table II about here.]
Table II describes order characteristics. Typical order size is small (median 100 shares, mean 568
shares), but we have some large orders (the 95th percentile is 1,590 shares). The mean display size is 75
shares, or about 13% of mean order size, and the majority of orders are fully non-displayed. Panel B
provides additional detail on display choice and order side. About 51% of the broker’s limit orders are
buy orders, 27% are sell orders, and 22% are short sell orders. Overall, about 62% of orders are non-
displayed, 31% are fully displayed, and 7.5% are partially displayed. As there might be substantial
differences in execution quality between hidden and displayed orders, we restrict the sample in the
remaining analysis to orders that are at least partially displayed (referred to henceforth as ‘displayed
orders’). This restriction reduces our sample size to 7,443,718 orders across 2,728 stock symbols.
To analyze displayed order aggressiveness, we assign each order to one of four mutually
exclusive categories: marketable, inside-the-quote, at-the-quote, and behind-the-quote. A limit order to
buy (sell) shares at a price greater than or equal to (less than or equal to) the National Best Offer (Bid) is
marketable. Inside-the-quote orders have limit prices that improve prevailing quotes but are not
marketable. A limit order to buy (sell) shares at the National Best Bid (Offer) is at-the-quote. A limit
order seeking to buy (sell) shares at a price lower (higher) than the prevailing quotes is behind-the-quote.
Panel C of Table II describes order aggressiveness for all orders and conditional on destination
venue. Across all sample limit orders, approximately 17.5% of orders establish a new National Best Bid
or Offer, 64.6% join the NBBO, and 16.5% are at prices worse than the current inside quote. For venues
other than the NYSE, the most frequent order aggressiveness choice is an at-the-quote order. In contrast,
the NYSE exhibits high frequencies for both behind-the-quote and at-the-quote orders. There is a clear
difference in the types of limit orders sent to standard versus inverted venues. Consistent with the idea
that inverted venues can be used to gain priority at a price, almost all of the displayed orders routed to the
inverted venues are at-the-quote.

19
We provide summary statistics related to order outcomes for displayed orders in Panel A of Table
III. There are four explicit possibilities coded in the data: cancel, fill, replace and reject (the venue rejects
the order). As all orders are day orders, we assume that any order not coded with one of these four
outcomes expires at the end of the day. A given order might have more than one outcome. For example, it
is common to have an order fill partially and then have the remainder cancel or expire. Just over 49% of
the displayed orders receive at least a partial fill and the average sample order executes 141 shares
(around 25% of average order size). Ignoring orders with zero executed shares, the mean executed shares
increases to 288 shares, compared to an average order size of 357 shares (not reported). The average
(median) time to first fill is 65 (10) seconds. For orders with multiple executions, the average (median)
time until the last fill is 97 (17) seconds. A majority of orders are cancelled, while very few orders are
replaced or rejected by the destination venue. Highlighting the fact that our orders were placed and
monitored by a smart router, the mean (median) time to cancel is 156 (36) seconds.
[Insert Table III about here.]
Panel B of Table III provides more detail on order outcomes conditional on whether displayed
limit orders are unfilled, partially filled, or completely filled. Of the 3,795,342 orders receiving no fills,
over 99% are cancelled. Over 46% of our sample limit orders fill completely and another 3% fill partially.
Of the 3,648,376 orders receiving at least a partial fill, about 71% have a single execution. The remaining
shares in almost all partially filled orders are cancelled.
B. Univariate Analysis
Hypothesis 1 suggests that limit order execution quality is negatively related to take fees. As an
initial test of this hypothesis, Table IV provides several univariate execution-quality statistics for
displayed at-the-quote limit orders by venue. We focus on at-the-quote orders, as it is difficult to control
for the pricing aggressiveness of behind- or inside-the-quote limit orders in this univariate analysis. For
each venue, we list the take fee (positive) or rebate (negative) and, in Colliard and Foucault’s (2012)
terminology, the total fee (take fee/rebate + the most favorable published liquidity rebate/fee). As noted
earlier, ARCA, EDGX, and NDAQ charged a take fee of $0.30 per hundred shares during our sample
20
period, BATS charged $0.29 per hundred, and the NYSE charged $0.23 per hundred. In contrast, BX and
EDGA used inverted fee schedules and paid a rebate to liquidity demanders. Rebate and fee levels are
highly correlated, leaving little variation in the total fee across venues.
The execution quality measures we provide include fill rate, time to execution, realized spread,
and good fill ratio. To shed light on Hypothesis 2, we also present summary statistics for cum-rebate
realized spreads. Fill rates are order weighted, where an order is considered filled if any part of the order
fills. Execution speeds are in seconds from the order submission time until first fill time, conditional on
an order at least partially filling. As noted earlier, we define the realized spread for executed limit sell
orders as twice the difference between the execution price (i.e., the order’s limit price) and the midpoint
of the bid-ask spread prevailing five minutes later. For limit buy orders, we multiply by -1. Following
Sofianos and Yousefi (2010), we classify a limit order execution as a good fill if the order’s realized
spread is positive (i.e., the price moves in the limit order trader’s favor after their order executes). Finally,
cum-rebate realized spreads are defined as the realized spread plus twice the executing venue’s most
favorable liquidity rebate.16
[Insert Table IV about here.]
Focusing on fill rates for displayed at-the-quote orders, we find that orders on the BX fill most
frequently and orders on the high-fee venues (EDGX, NDAQ and ARCA) fill least frequently. Thus, fill
rates are negatively correlated with take fees, as expected. Likewise, the mean realized spread and the
good fill ratio are negatively correlated with take fees. Consistent with the idea that informed limit order
traders use inverted venues to gain priority before prices move, only the inverted venues have positive
mean realized spreads. Thus, our initial empirical results support Hypothesis 1.
Average cum-rebate realized spreads are generally increasing in take fee and are positive on all
venues except the inverted BX. Consistent with Hypothesis 2b, the smart order router appears to obtain
16 As make rebates are a function of the volume of liquidity supplying orders routed by a broker to an exchange over a pre-specified period of time, it is unlikely that any broker qualifies for the most favorable liquidity rebate at all exchanges. The conclusions of the paper are unchanged when we compute cum-rebate realized spreads using the least favorable make rebate (most favorable make fee) offered by each of the traditional (inverted) venues.
21
larger cum-rebate realized spreads to offset the increased expected cleanup costs on venues with higher
take fees. Together, the positive average realized spread, good fill ratio of 54.9%, and negative average
cum-rebate realized spreads for limit orders executed on BX suggest that the order router displays orders
on the venue with the lowest (negative) take fee and make rebate when the expected cleanup costs
associated with missed executions are high.
C. Horseraces
While the univariate results above are consistent with a negative relation between take fees and
limit order execution quality, they do not control for other factors that may affect execution quality. Our
proprietary data allow for a powerful approach to examining differences in across-venue limit order
execution quality, while controlling for other factors. Specifically, we find that pairs of identically priced
orders from the broker’s order routing system are frequently displayed concurrently on multiple venues.
For each pair of concurrent orders, we begin a “horserace” at the time the orders first co-exist on different
venues. As detailed below, we define the winner of the horserace as the venue filling the order first while
the competing venue still holds the paired order. To shed light on the economic implications of winning a
set of horseraces, we compute the average realized spread and good fill ratio on each of the paired venues.
Our model predicts that limit orders on the low-fee venue have a higher likelihood of filling and higher
average realized spreads than orders on high-fee venues.
To construct the horseraces, we sort displayed orders by order date, stock symbol, order side (buy
or sell), limit price, and order time. We then identify consecutive orders with the same date, stock symbol,
order side, and limit price, but different destination venues. We allow order times to differ, but require
that the first order in the pair still be active when the second order is submitted. As an example, suppose
that the first order is submitted at 10:01:00 a.m. and is first acted upon at 10:02:00 a.m. If the second
order is submitted at, say 10:01:30 a.m., then the two orders overlapped for 30 seconds and are compared.
By design, these paired orders are associated with identical stock characteristics and market conditions,
allowing us to attribute differences in outcomes to venue characteristics such as fees. For a horserace to
produce a winner, we require that: (1) at least one of the two orders fills (at least partially), and (2) both

22
orders in the pair be outstanding at the time of the first fill. Should both orders fill, a venue wins if it fills
the order at least 500µs before the second order executes. If both orders execute and the time between
executions is less than 500µs, the horserace is classified as a tie.17 Should one order fill and the other be
cancelled or replaced subsequent to this execution, the venue filling the order wins. If one order in the
pair is rejected, replaced, or cancelled prior to its paired order filling, then we eliminate that pair from our
sample. This allows us to focus on order pairs where the losing order retained an apparent trading interest
at the time the competing order filled. Using this methodology, we construct 205,171 horseraces.
We summarize the results of the horseraces in Table V. To emphasize the effects of fee structure,
we aggregate results based on the difference in take fees between the two venues in a pair.18 For example,
the first row in Table V reports results for the 14,931 horseraces involving venue pairs with a fee
difference of $0.44 per hundred shares. These results include three venues pairs: ARCA vs. BX, EDGX
vs. BX, and NDAQ vs. BX. For these venue-pairs, the high-fee venue (ARCA, EDGX, or NDAQ) fills
about 73% of its orders in the pairs, the low-fee venue (BX) fills over 99%, and both orders fill in nearly
73% cases.19 More importantly, the low-fee venue in this comparison (BX) wins 77% of the horseraces
and the high-fee venue wins less than 4%, with 19% of the horseraces classified as ties. The fact that the
across-venue difference in the percentage of horseraces won exceeds the difference in fill rates suggests
that the low-fee venue not only fills more orders than the high-fee venue, but also executes orders more
quickly when both orders fill. Finally, the low-fee venue’s good fill ratio (60%) exceeds the good fill ratio
of the high-fee venue (54%) and the mean realized spread is $0.0024 per share higher on the low-fee
venue than the high-fee venue. Thus, we conclude that the lower fee venue has better limit order
execution quality than the higher fee venue.
[Insert Table V about here.]
17 We use 500µs based on conversations with our data provider. Our results are insensitive to the exact definition of a tie. 18 We report detailed horserace results by individual venue and conditional on which venue receives the first order in Appendix Table I. In each pairwise comparison, the conclusions are similar regardless of which venue receives the first order. 19 Overall, the average fill rate for displayed limit orders participating in the horseraces (Table V) is considerably higher than the fill rate for the broader sample of displayed at-the-quote limit orders (Table IV). The differences in fill rates suggests that the market conditions in which the order router conducts horseraces are different than the market conditions in which the order router displays trading interest on a single venue.

23
The remaining rows in Table V provide results for horseraces involving other levels of take fee
differences. In each row, we find similar results. The lower fee venue fills a greater percentage of the
orders, wins a greater percentage of the horseraces, has a higher average realized spread (except in the
BZX-EDGA comparison), and has a larger fraction of good fills than the higher fee venue. Of interest is
the relation between the fee differential and the advantage the low-fee venue enjoys relative to the high-
fee venue. The difference in fill rates declines from nearly 26% when the fee difference is $0.44 to only
7% when the fee difference is $0.01. Similarly, the difference in horserace winning percentage is over
74% when the fee difference is $0.44, compared to 23% when the fee difference is $0.01. Although less
well behaved overall, the difference in average realized spreads is larger in magnitude for the large fee
differential comparisons (> $0.27) than for small fee differential comparisons (< $0.27). Likewise the
difference in the good fill ratio declines from 6% to 1.5% as the fee differential declines. At the same
time, the fraction of the order-pairs where both orders fill increases from nearly 73% to almost 83% and
the fraction of tied horseraces increases from 19% to 49% as the fee difference declines from $0.44 to
zero. Although the relation is not always monotonic, there is clear evidence that the difference in
execution quality across venues increases as the difference in take fees grows.
By construction, each horserace represents a situation in which the order router places identically
priced orders on different venues. Assuming the order router seeks to minimize all-in trading costs and
cleans up unfilled limit orders by replacing them with marketable orders, our model predicts that limit
orders executed on high-fee venues generate larger average cum-rebate realized spreads than identical
orders executed on low-fee venues (Hypothesis 2b). Although not reported, we find average cum-rebate
realized spreads are larger on the high-fee venue for horseraces involving venues with take fee
differentials of at least $0.10 per hundred shares. A more detailed analysis of cum-rebate realized spreads
is provided below.
D. Multivariate Analysis
It is unlikely that the sample limit orders are distributed randomly across trading venues in either
our unconditional analysis or our horseraces. Presumably, the broker’s order routing decisions are made

24
conditional on several factors including stock characteristics, market conditions, and fees. To address this
concern, we conduct multivariate analyses to investigate the determinants of execution quality.
We examine four dependent variables. First, we estimate a probit model to examine the likelihood
of a fill, where Fill equals one if any part of the order fills and zero otherwise. We then use OLS
regressions to analyze Time to Execution, defined as the number of seconds between Order Time and First
Fill Time conditional on at least a partial fill, %Realized Spread, and %Cum-Rebate Realized Spread. We
conjecture that the relevant independent variables are order characteristics, stock attributes, venue traits,
and time of day. The general specification for the models is as follows:
,
)(13
29876
543210
εδββββ
ββββββ
++⋅+⋅⋅+⋅+⋅+
⋅+⋅+⋅+⋅+⋅+=
∑=i
ii PeriodTakeFeeseTimeMeanResponVolatilityPrice
VolumeLogMoneynessOrderSizeShortSellSelleDepVariabl (6)
where Sell equals one if the order side is “Sell” and zero otherwise; Short Sell equals one if the order side
is “Short Sell” and zero otherwise; Order Size is the number of shares specified in the order divided by
the relevant quoted size; Moneyness equals 100*((Limit Price/Ask Price) – 1) for sell orders and
100*((Bid Price/Limit Price) – 1) for buy orders; Volume equals the stock’s average daily share volume
during the sample period; Price equals the stock’s mean closing price during the sample period; Volatility
equals the stock’s average daily squared return during the sample period; Mean Response Time for each
venue equals the average across all canceled trades on that venue of the difference between Out Time
from the venue and Cancel Time from the broker20; and Take Fee equals the venue’s take fee during the
sample period in dollars per hundred shares. We also include intraday dummy variables identifying each
30-minute Period from 10:00am to 4:00pm.
[Insert Table VI about here.]
We present the regression results in Table VI.21 Given the sample size, most coefficients are
statistically significant at beyond the .01 level. For the analysis of fill probability, we report both 20 Response time is intended to proxy for the technological connectivity between the broker and the exchange. 21 In untabulated results that are available upon request, we estimate each of the regressions presented in the paper separately for NYSE- and Nasdaq-listed securities and obtain qualitatively similar results. For brevity, we present results for the pooled sample throughout the paper.
25
coefficients from the probit model and the associated marginal probabilities calculated at the mean values
of all explanatory variables. We find that sell (short sell) orders are about three percent more (less) likely
to fill than are buy orders. Consistent with the univariate results, more aggressively priced orders are more
likely to fill, as are orders in stocks with higher prices, greater volume, and higher volatility. Although not
reported, coefficients on time-of-day binary variables suggest that orders submitted later in the trading
day are more likely to fill, with the effect being particularly pronounced during the last 30 minutes of
trading. Examining the marginal probabilities, we find that for a one standard deviation increase in price,
volume, and volatility, the likelihood of filling rises by 3, 3.5, and 0.5 percent, respectively. Of particular
interest is the association between take fees and the likelihood of filling. For the displayed orders used in
this analysis, the higher the take fee, the less likely the order is to fill. Using the largest possible fee
difference (ARCA/EDGX/NDAQ vs. BX), the probit model suggests a 6% increase in fill likelihood,
which is considerably less than the unconditional fill rate differences reported in Table IV.
Results for time to execution are provided in the third column of Table VI. Buy orders fill faster
than sell orders and slower than short sells. Aggressively priced orders fill faster than passive orders and
stocks with higher prices and greater trading volumes have faster fills. Venues with faster connections to
the broker fill orders in less time than those with slower connections. Fills are also faster early and late in
the day, with the effect most pronounced in the last 30 minutes of trading. Focusing on take fees, we find
that orders routed to low-fee venues fill faster than orders routed to high-fee venues.
We present the results for %Realized Spreads and %Cum-Rebate Realized Spreads in the last two
columns of Table VI. The results show that less aggressive orders (Moneyness > 0) and orders in stocks
with higher prices and volatility have larger realized spreads and cum-rebate realized spreads. Of direct
interest to our study, we find that venues with high take fees are characterized by lower realized spreads
than low-fee venues. In contrast, Take Fee is positively associated with cum-rebate realized spreads.
Overall, the multivariate results support the hypothesis that limit order execution quality is
inversely related to the destination venue’s take fee. Specifically, we find that orders displayed on high-
fee venues fill less often than similar orders on low-fee venues and, conditional on filling, fill more

26
slowly. Consistent with Hypothesis 1, we find that orders filled on high-fee venues have lower realized
spreads than orders executed on low-fee venues. Combined with the horserace results, these findings
suggest that routing all limit orders to the exchange with the highest make rebate (and correspondingly
high take fee) is not consistent with best execution. Finally, our finding that cum-rebate realized spreads
are increasing in take fee is consistent with Hypothesis 2b and suggests that smart order routers can be
used to manage the tradeoff between obtaining higher fill rates and generating higher liquidity rebates.
E. Caveats
The advantage of our proprietary data is that they allow us to study orders and, therefore,
compute fill rates and fill times. However, there are a few reasons why one might be concerned about the
generalizability of our results. First, the order data are from a single broker and the related executions
comprise only 1.5% of average daily volume. Second, the order data do not span the thirteen U.S. stock
venues that utilize rebates and fees. Specifically, our data provider uses inverted venues relatively
sparingly. Third, our orders are generated by institutional trading interest and might differ in important
ways from typical retail orders. Finally, the proprietary data are generated by an order routing algorithm
presumably designed to provide high-quality executions. Given these considerations, it is difficult to
generalize our proprietary data results to the typical limit order. To address these concerns, we next
provide an analysis based on the NYSE’s TAQ database.
V. Make-Take Fees and Limit Order Execution Quality: NYSE TAQ Data
The NYSE’s monthly TAQ database contains a time-stamped recording of every trade and every
instance that a trading venue’s quote changes. Because exchanges today predominately operate as
electronic limit order books, marketable orders typically execute against standing limit orders.22 As a
result, TAQ data are well suited to making general inferences regarding the execution quality received by
executed limit orders. In addition, TAQ data can be used to analyze the relation between take fees and 22 A notable exception is the NYSE, which allows quotes from floor brokers and the designated market maker (DMM) to trade on parity with orders displayed on the limit order book in some situations. Thus, floor brokers and/or the DMM are allowed to violate time priority at a price. If, as suggested by Ready (1999) and others, floor brokers and the DMM choose to selectively display quotes based upon market conditions, inferences made using realized spreads computed using all at-the-quote trades on the NYSE may be biased upward. However, the conclusions from the multivariate analysis are similar if trades executed on the NYSE are excluded.

27
limit order execution quality for those stock characteristics and market conditions for which limit order
routing is likely to be more important. To avoid executions occurring against non-displayed limit orders,
we focus throughout the remaining analysis on TAQ trades that occur at the best available quoted price
(i.e., we ignore price-improved trades).
A. Summary Statistics
From TAQ, we collect all trade and quote data for common stocks listed on the NYSE and
Nasdaq during October and November 2012. After eliminating stocks that trade below $1 during this
period, the resulting sample includes 3,091 stocks. For each stock, we determine the best bid and offer for
each trading venue and the resulting National Best Bid and Offer (NBBO) at each point in time during the
trading day.23 We then employ the Lee-Ready algorithm to determine whether each trade is buyer- or
seller-initiated and therefore whether the passive side of the trade sold or purchased shares. As we are
interested in differences in limit order execution quality across exchanges, we eliminate sweep trades,
which are designed to trade against all orders posted at the best quote.24 Finally, we eliminate the Nasdaq
TRF from our analysis as most of its trades are internalized.
Table VII presents summary statistics for time at the quote, market share, and realized spread by
venue. Venues are ordered based on their take fee/rebate. The first four rows of each panel describe the
fraction of the trading day that each venue’s quotes are equal to the NBB, the NBO, either side of the
NBBO, and both sides of the NBBO, respectively. The NYSE does not trade Nasdaq-listed stocks and the
NYSE MKT (AMEX) does not trade NYSE-listed stocks. For these two venues, time at the inside and
average realized spread are based on only those stocks that trade on the venue, while market share is
based on all sample stocks.25 Five standard exchanges are at one side of the NBBO at least half of the
trading day in the stocks that they trade: ARCA, EDGX, NDAQ, BZX, and NYSE. For inverted venues,
the percentage of time spent at either the NBB or the NBO ranges from a low of 19.9% for EDGA to a 23 We apply standard screens to the trade and quote data. See Corwin and Schultz (2012) for a complete description. 24 Regulation NMS allows an investor to walk up (down) a venue’s limit order book if the investor first sends an intermarket sweep order (ISO) to each venue whose bid (offer) is equal to or better than the venue’s best bid (offer). The execution quality of at-the-quote limit orders that provide liquidity to ISOs is identical since ISOs consume all of the liquidity at a price point. For an in-depth analysis of ISOs, see Chakravarty et al. (2012). 25 For the NYSE-listed stocks in our sample, NYSE market share equals 11.86% of trades and 13.63% of volume.

28
high of 37.2% for BYX.
[Insert Table VII about here.]
The middle rows of Table VII describe the percentage of sample trades and share volume
executed by each trading venue. Five standard venues have trade and volume market shares of at least
5%: the NYSE, ARCA, NDAQ, BZX, and EDGX. The remaining standard venues and the CBSX all have
market shares of less than 1% and are excluded from the analysis to follow. The included inverted venues
are BX, BYX, and EDGA, and market shares on these venues range from 2.5% (1.9%) of trades (volume)
on EDGA to 4.4% (2.9%) of trades (volume) on BYX. Overall, the venues with larger market shares are
also the venues with quotes most frequently at the NBBO.
The final two rows of Table VII present unconditional averages for both dollar and percentage
realized spreads. Consistent with Hypothesis 1 and our proprietary order data results, we find that average
realized spreads are generally decreasing in take fees. The BX, with a take rebate of $0.14 per hundred,
has an average realized spread of $0.0074. In contrast, the three venues charging the maximum
permissible take fee have average realized spreads ranging between -$0.0039 and -$0.0061. In all cases
with meaningful market share, average realized spreads are negative on the standard venues and positive
on the inverted venues.
The univariate statistics based on TAQ trades provide additional evidence that limit order
execution quality is decreasing in the size of the take fee. Again, this evidence suggests that routing all
limit orders to a single venue offering the highest rebates (and charging the maximum take fee) is
inconsistent with the pursuit of best execution.
B. Across-venue limit order executions when all venues are at the inside quote
When multiple venues are at the best quote, marketable orders can choose where to obtain
liquidity. It is in these situations that we expect limit order routing decisions to be particularly important.
Thus, we next examine whether fees influence which venue receives a marketable order (as evidenced by
trades) and the resulting limit order execution quality when all sample venues are at the best quote.
Highlighting the potential importance of the order routing decision, we find that 11.0% of sample trades
29
take place when all venues are at the inside quote.26 Using this subsample, we compute the following
statistics by venue: market share of trades, average depth at the relevant quote across all trades, average
depth at the relevant quote for own-venue trades, average realized spread, average cum-rebate realized
spread, and good fill ratio.27
[Insert Table VIII about here.]
The results are presented in Table VIII. When we require all venues to be at the inside quote, the
market shares of inverted venues increase and the market shares of standard venues fall. For example,
while BX’s unconditional market share of trades is 3.2% (see Table VII), it climbs to over 9% in Table
VIII. Indeed, the aggregate market share of trades executed by the three inverted venues increases from an
unconditional 10.1% to 23.3% when all venues are at the best quote. In part, this difference in market
share may reflect the market conditions that result in all venues being at the inside quote. However, the
results are also consistent with the predictions of our model and with Cardella et al. (2012), who find that
fees influence the routing of marketable orders.
The average depth at the inside quote is at least 2.5 times higher on standard venues than inverted
venues. In addition, inverted (standard) venues tend to have more (less) quoted depth when they execute
trades than when trades print on other venues. Thus, unless the market order arrival rate is more intense
on standard venues, which does not generally appear to be the case, limit order traders face longer wait
times and trade in less favorable conditions on standard exchanges than on the inverted exchanges.
As in Table VII, realized spreads are positive for the inverted venues and, with the exception of
the NYSE, negative on the standard venues. A comparison of the realized spreads in Tables VII and VIII
reveals that the difference in realized spreads between standard and inverted venues increases when we
require all venues to be at the inside quote. The across-venue range in average realized spreads increases
from 7.6 bps for all sample trades to 10.24 bps when all venues are at the inside quote. This difference
26 Among stocks with at least 10,000 trades during our sample period, only 54 have no trades executed when all venues are at the inside quote, while 194 stocks have at least 20% of their trades executed in these conditions. Nine sample stocks (AMD, BAC, CTIC, F, HBAN, S, SIRI, SNV, and ZNGA) have more than half of their trades executed when all venues are at the inside quote. 27Our data do not allow us to determine the original placement of these limit orders relative to the quotes. It seems likely, however, that a nontrivial percentage of at-the-quote limit orders began their lives as behind-the-quote limit orders.

30
suggests that when queue lengths are longer, as evidenced by all venues being at the best quote, order
routing has a greater impact on the quality of limit order executions.28
The results for both realized spreads and the good fill ratio generally support a negative relation
between take fees and limit order execution quality. The one exception is the NYSE. When we require all
venues to be at the inside quote, we find higher average realized spreads on the NYSE than on EDGA, an
inverted venue. In fact, the NYSE is the only standard venue that exhibits positive average realized
spreads and a good fill ratio greater than 50%. The results for NYSE executions highlight the fact that
routing decisions and execution quality may be driven by factors other than take fees. However, even
these results could be driven by take fees if some market participants choose not to connect or route to
inverted venues. The NYSE charges a take fee of $0.23 per hundred shares, making it the lowest-fee
option by a significant margin for participants that choose to utilize only standard fee venues.29
We next examine cum-rebate realized spreads to ascertain whether rebates, if passed through to
customers, provide adequate compensation for reduced execution quality on high-fee venues. Hypotheses
2a and 2b suggest that an investor who receives rebates/pays fees may be indifferent to order routing if
average cum-rebate realized spreads are non-decreasing in take fee. In contrast to the results from the
proprietary data, there appears to be no clear pattern in average cum-rebate realized spreads for TAQ
trades as one moves from lower to higher take fees. Among the venues we examine, average cum-rebate
realized spreads are lowest on NDAQ, one of the three venues charging the maximum permissible take
fee, and highest on the NYSE, the standard venue with the lowest take fee. These results are inconsistent
with Hypotheses 2b and suggest that rebates, even if passed through to the customer, may not provide
adequate compensation for the reduced execution quality on high-fee venues. We address this issue in
28 In untabulated results, we repeat the analysis from Table VIII for at-the-quote trades executed when each venue is both at the inside quote and quoting a minimum level of depth (e.g., 2,000 shares). For both NYSE and Nasdaq-listed stocks, the difference between good fill ratios and average realized spreads on the inverted and the standard venues (with the exception of the NYSE) becomes more pronounced when we require large quoted depth, providing additional evidence that routing decisions matter more when queue lengths are long. 29While we cannot determine which, if any, liquidity demanders are not connected to the inverted venues, we can provide illustrative evidence based on participation on the various Nasdaq exchanges. An examination of market participants with memberships on Nasdaq as of February 27, 2014 reveals that of the 341 members of NDAQ (based on unique member names), only 75 are members of BX. In contrast, every member of BX is also a member of NDAQ.
31
more detail in the multivariate analysis to follow.
C. Multivariate analysis of take fees and realized spreads
Although the univariate analysis in the prior section suggests that limit order execution quality is
negatively related to take fees, that analysis does not control for other characteristics that may affect
execution quality. In this section, we use multivariate regressions to analyze the relation between
execution quality and take fees, after controlling for stock characteristics and market conditions. We
continue to focus on at-the-quote trades, providing separate results for all such trades and those that occur
when all relevant venues are at the inside quote.
In our initial tests, the dependent variable is the percentage realized spread. The independent
variables include average daily volume, trade price, trade size, daily volatility (as measured by the log
daily high-low price ratio), and intraday dummies to identify the twelve 30-minute period from 10:00 a.m.
through 4:00 p.m. The main variables of interest are related to the take fee on the venue that executes the
trade. The primary variable related to take fee is a continuous variable defined as the venue’s take fee in
dollars per hundred shares (Take Fee). In addition, we define three interaction terms based on stock and
venue characteristics. Following Harris (2013), we expect the impact of take fees to be most pronounced
for stocks with low prices and large quoted depths. To identify the effects of low-priced stocks, we
interact Take Fee with a binary variable equal to one if the trade price is less than six dollars (Low_Price).
To proxy for situations when queue lengths are long, we interact Take Fee with a binary variable equal to
one if aggregate depth at the inside quotes is greater than 20,000 shares (High_Depth). We expect the
impact of take fees to be reduced if a venue has the lowest take fee among venues that are currently
offering the best quote. Thus, in models for all sample trades, we include an interaction between Take Fee
and a dummy variable equal to one if the executing venue has the lowest take fee among all venues at the
inside quote (Min_Fee).30 We expect the coefficient on this interaction to be positive.
As noted in our discussion of the proprietary data in Section IV, orders in that dataset may trade
30 When we impose the restriction that all venues are simultaneously at the inside quote, the lowest fee venue is always BX. As a result, we do not include the Min_Fee interaction term in the models with all venues at the inside.

32
under different conditions than the typical order. In particular, we expect the broker-dealer’s smart router
to send orders to inverted venues precisely when it is most advantageous to do so. To better understand
the market conditions in which our proprietary orders execute on inverted venues, we define a binary
variable that equals one for each TAQ trade that executes during the same second that a limit order in the
same stock from our proprietary dataset executes on an inverted venue, and zero otherwise
(SmartRouterInverted). We then interact this binary variable with Take Fee. If the broker-dealer’s algorithm
routes to inverted venues when it is most advantageous to do so, we expect the coefficient on this
interaction term to be negative.
[Insert Table IX about here.]
The regression results for realized spreads are presented in the first four columns of Table IX,
with results for all at-the-quote trades in columns (1) and (2) and results for at-the-quote trades when all
relevant venues are at the inside quote in columns (3) and (4). In all specifications, realized spreads tend
to be higher for trades that are smaller, in lower priced stocks, in more actively traded securities, and in
stocks with lower daily volatility.
Turning to the take fee variables, we again find that realized spreads are decreasing in take fee.
This finding confirms our earlier results and shows that the predicted negative relation between take fees
and execution quality holds after controlling for stock characteristics and market conditions. In the second
specification in each set of regressions (columns [2] and [4]), we include the four take fee interaction
terms. The positive coefficient on the minimum fee interaction suggests that, conditional on the size of the
take fee, the impact of take fees is reduced when the venue has the lowest take fee among venues at the
inside quote. As expected, the negative relation between take fees and execution quality is more
pronounced for low priced stocks and when queue lengths are long. The coefficients on the low price and
high depth interaction terms are negative and significant in all specifications. Finally, the coefficient on
the smart router interaction term is consistently negative and significant, suggesting that the broker-
dealer’s smart order router tends to use inverted venues when the advantages to doing so are greatest.
As noted earlier, some argue that rebates compensate for differences in execution quality across

33
venues. To test Hypotheses 2a and 2b, we repeat the regression analyses using percentage cum-rebate
realized spreads. The results of this analysis are reported in the last four columns of Table IX.
Consistent with Hypothesis 2b, the results in columns [5] and [7] of Table IX show that cum-
rebate realized spreads are increasing in take fee. Thus, on average, the few investors who directly receive
liquidity rebates from their brokers are at least partially compensated for the increased cleanup costs
associated with displaying limit orders on high-fee venues. However, the results from the take fee
interactive variables (columns [6] and [8]) show that the positive relation between take fees and cum-
rebate realized spreads is sensitive to stock characteristics and market conditions. As posited by Harris
(2013), share price and limit order queue length are important. Specifically, the positive association
between take fee and cum rebate realized spread is amplified in low-priced stocks and diminished when
quoted depth is large. Importantly, the interaction results also suggest that there are market conditions
under which the relation between Take Fee and cum-rebate realized spreads is not positive. In particular,
the smart router interaction has a significant negative coefficient, suggesting that even those customers
who receive rebates can benefit from smart order routing.
Overall, the results for cum-rebate realized spreads suggest that, on average, the most favorable
liquidity rebates offered by exchanges at least partially offset the increased clean-up costs associated with
displaying limit orders on high-fee venues. However, the results also suggest that smart routers can be
used to identify situations where displaying orders on inverted venues enhances limit order execution
quality. Perhaps this explains why Interactive Brokers, one of the few brokers that passes fees/rebates
through to some customers, utilizes a smart router even though average cum-rebate realize spreads appear
to be increasing in take fee. Regardless, for the vast majority of retail investors who do not receive
rebates, cum-rebate realized spreads are irrelevant. For these investors, the fact that realized spreads are
decreasing in take fee suggests that limit order execution quality cannot be maximized by routing all
orders to a high fee venue.31
31 As an alternative specification, we repeated the regressions for realized spreads and cum-rebate realized spreads after replacing the continuous take fee variable and related interaction terms with a series of binary variables to identify each level of take fee.

34
VI. Conclusion
The maker-taker pricing model currently used by U.S. exchanges creates a potential agency
problem between brokers and their customers; Because most brokers do not pass rebates/fees through to
their customers, they may make order routing decisions to maximize revenue rather than limit order fill
rates (see Angel et al. (2010)). We develop a simple model to formalize these arguments. The model
motivates the use of the realized spread as a summary statistic that reflects both the likelihood of
execution and the conditions under which orders execute and predicts that the fill rates and realized
spreads of nonmarketable limit orders are decreasing in the level of a venue’s take fee.
Using data from the fourth quarter of 2012, we present evidence that four popular retail brokers
appear to route all nonmarketable limit orders to the venue offering the largest rebate. If, as our model
suggests, limit order execution quality is decreasing in the level of the rebate/fee, then this routing
exclusivity is not optimal from the customer’s perspective. Using proprietary limit order data, we find that
several measures of limit order execution quality (including fill rates, execution speed, and realized
spreads) are negatively related to the level of an exchange’s take fee. These results hold in univariate
tests, as well as in horseraces and multivariate regressions controlling for other factors that may affect
execution quality. Using TAQ data, we show that the conclusions generalize to the broader sample of
trades in NYSE- and Nasdaq-listed stocks, and demonstrate that the impact of take fees is most
pronounced in low-priced stocks, when queue lengths are long, and during those periods when proprietary
limit orders execute on an inverted venue. Together, our results point to the potential benefits of smart
order routing and suggest that brokers who route all of their nonmarketable limit orders to a single venue
offering the highest liquidity rebate (and charging the maximum permissible take fee) are not maximizing For realized spreads, the results indicate a nearly monotonic negative relation in take fee for both the proprietary order data and the TAQ data. These findings are consistent with Hypothesis 1 and the results reported above. For cum-rebate realized spreads, the results point to a contrast between trades in the proprietary data and TAQ trades. Consistent with Hypothesis 2b and the results presented above for proprietary orders, the binary variable regressions show a nearly monotonic increase in cum-rebate realized spreads as take fee increases. These results are what one would expect if the smart router is designed to minimize all in trading costs. For TAQ trades, however, the regressions based on take fee level dummy variables point to a non-monotonic relation between cum-rebate realized spreads and take fees. The contrast in results across the two datasets reinforces the conclusion from above that all investors, even those who receive the rebates associated with their orders, may benefit from smart order routing. These results are available from the authors upon request.

35
limit order execution quality.
Does the order routing decision matter if fees/rebates are passed through to the customer? Our
simple model predicts that cum-rebate realized spreads must be non-decreasing in take fees for customers
that receive rebates and pay fees to be indifferent to how their limit orders are routed. For both TAQ
trades and trades in our proprietary dataset, we find that the cum-rebate realized spreads computed using
each venue’s most favorable liquidity rebate are generally increasing in take fee. While this suggests that
rebates, if passed through to customers, may provide at least some compensation for the reduced fill rates
and associated clean-up costs on high-fee venues, the analysis also suggests that there are conditions in
which cum-rebate realized spreads are decreasing in take fee. Thus, even if rebates are passed through to
customers, our results suggest that execution quality can be enhanced by smart order routing.
As with all empirical studies, several caveats are in order. First, we focus on an important, but
non-exhaustive set of execution quality statistics. We examine the probability of getting a trade done,
which is likely to be of first-order importance and is in the SEC’s definition of limit order execution
quality, as well as the speed of execution and realized spread earned by limit order traders. Other metrics
might also matter to some limit order traders. Second, although most brokers do not pass rebates/fees
through to customers, commissions are likely based on the broker’s total revenue. As a result, maximizing
rebates might allow brokers to reduce commissions for executed orders. It is important to note, however,
that lower commissions do not compensate investors who miss profitable limit order executions.
Despite these caveats, our results suggest that order routing decisions have an important impact
on limit order execution quality and that routing decisions based primarily on rebates/fees are inconsistent
with best execution. For limit order traders, there are significant opportunity costs associated with routing
all nonmarketable limit orders to a single venue offering the highest liquidity rebates. Thus, we conclude
that brokers cannot have it all.
What are the policy prescriptions suggested by our analysis? Angel et al. (2010) suggest that
requiring brokers to pass fees/rebates through to their customers would “ensure that brokers route all
orders to best serve their clients, and not to enrich themselves.” However, such a requirement may induce
36
brokers to route all nonmarketable limit orders to the inverted venue offering the largest take rebate (and
charging the largest liquidity make fee). While this type of order routing would maximize expected fill
rates, our analysis suggests that it could lead to added costs for investors in those stocks and/or conditions
when orders have a high likelihood of execution on the high-fee venue.
To facilitate future study, we suggest that the SEC consider two relatively minor changes to the
data requirements currently imposed on brokers. First, we believe the SEC should change the Rule 606
reporting requirements to separate routing information for marketable and non-marketable limit orders.
As the execution quality of marketable limit orders is most comparable to market orders, these orders
should be separated from standing limit orders that are not immediately executable. Second, we believe
the SEC should either maintain a database of historical order routing reports for all brokers or require
individual brokers to provide a time series of Rule 606 order routing reports. Currently, brokers are only
required to post the most recent quarterly Rule 606 report, making it virtually impossible to study how
order routing decisions change through time or in response to various events.
We have two more substantive policy prescriptions. First, because our analysis suggests that
across-venue differences in execution quality vary with a stock’s trading characteristics (e.g., price,
volume, and volatility), we believe brokers should be expected to make order routing decisions on a
stock-by-stock basis and, where possible, to utilize ‘smart’ routers. Second, we believe that the monthly
execution quality (Rule 605) reports currently produced by executing venues should also be disclosed on
a broker-by-broker basis. The inability of customers to assess a broker’s execution quality lies at the heart
of the conflict of interest we study. Joe Ratterman, CEO of BATS Exchange, notes that in the current
trading environment, investors “cannot in any meaningful way tie this information [the Rule 605 and Rule
606 data] together to ascertain the execution quality their broker is achieving on their behalf.”32 With the
appropriate execution quality statistics presented on a broker-by-broker basis, investors will be better able
to compare and evaluate brokers.
32 See http://cdn.batstrading.com/resources/newsletters/OpenLetter010615.pdf.

37
References Angel, James, Lawrence Harris, and Chester Spatt, 2010, Equity trading in the 21st century, USC Marshall School of Business working paper 09-10. Bacidore, Jeff, Hernan Otero, and Alak Vasa, 2011, Does smart routing matter?, Journal of Trading 6, 32-37. Battalio, Robert, Jason Greene, and Robert Jennings, 2002, Does the limit order routing decision matter?, Review of Financial Studies 15, 159-194. Biais, Bruno, David Martimort, and Jean-Charles Rochet, 2000, Competing mechanisms in a common value environment, Econometrica 68, 799-837. Boehmer, Ekkehart, Robert Jennings, and Li Wei, 2007, Public disclosure and private decisions: Equity market execution quality and order routing, Review of Financial Studies 20, 315-358. Chakravarty, Sugato, Pankaj Jain, James Upson, and Robert Wood, 2012, Clean sweep: Informed trading through intermarket sweep orders, Journal of Financial and Quantitative Analysis 47, 415-435. Cardella, Laura, Jia Hao, and Ivalina Kalcheva, 2013, Make and take fees in the U.S. equity market, University of Arizona working paper. Colliard, Jean-Edouard, and Thierry Foucault, 2012, Trading fees and efficiency in limit order markets, Review of Financial Studies 25, 3389-3421. Corwin, Shane and Paul Schultz, 2012, A simple way to estimate bid-ask spreads from daily high and low prices, Journal of Finance 67, 719-760. Easley, David, and Maureen O’Hara, 1987, Price, trade size and information in security markets, Journal of Financial Economics 19, 69-90. Foucault, Thierry, Ohad Kadan, and Eugene Kandel, 2013, Liquidity cycles and make/take fees in electronic markets, Journal of Finance 68, 299-341. Foucault, Thierry, and Albert Menkveld, 2008, Competition for order flow and smart order routing systems, Journal of Finance 63, 119-158. Glosten, Lawrence, 1994, Is the electronic limit order book inevitable, Journal of Finance 49, 1122-1161. Harris, Lawrence, and Joel Hasbrouck, 1996, Market versus limit orders: The SuperDOT evidence on order submission strategy, Journal of Financial and Quantitative Analysis 31, 213-231. Harris, Larry, 2003, Trading & Exchanges: Market Microstructure for Practitioners, Oxford University Press, New York, New York. Harris, Larry, 2013, Maker-taker pricing effects on market quotations, working paper, USC Marshall School of Business. Holden, Craig and Stacey Jacobsen, 2014, Liquidity measurement problems in fast, competitive markets: Expensive and cheap solutions, Journal of Finance 69, 1747-1785.
38
O’Donoghue, Shawn, 2014, The effect of maker-taker fees on investor order choice and execution quality in U.S. security markets, unpublished paper Indiana University. Peterson, Mark and Erik Sirri, 2002, Order submission strategy and the curious case of marketable limit orders, Journal of Financial and Quantitative Analysis 37, 221-241. Pragma Trading, 2013, A Conflict Inherent in the Maker-Taker Model: Equities vs. Futures, Pragma Research Note No. 6, July. Securities and Exchange Commission, 1997, Report on the Practice of Preferencing, SEC, Washington, DC.
Securities and Exchange Commission, 2000, Final Rule: Disclosure of Order Execution and Routing Practices, Release 34-43590, November 18, 2000, Washington, DC.
Sofianos, George and Ali Yousefi, 2010, Smart routing: Good fills, bad fills and venue toxicity, Goldman Sachs Equity Execution Strategies Street Smart 40, 1-9.
Sofianos, George, JuanJuan Xiang, and Ali Yousefi, 2010, Smart routing going to the races: Venue toxicity comparisons, Goldman Sachs Equity Execution Strategies Street Smart 41, 1-8. Weber, Bruce, 2003, What holds online markets back? An examination of U.S. stockbrokers’ Rule 11Ac1-6 reports, University of Delaware working paper. Yim, Raymond and Andrew Brzezinski, 2012, Limit order placement across multiple exchanges, Computational Intelligence for Financial Engineering & Economics, 2012 IEEE Conference on March 29-30, 2012.

39
Table I The Order Routing Decisions of Ten Retail Brokers
The table describes order routing decisions for ten retail brokers, with results for NYSE-listed securities in Panel A and results for Nasdaq-listed securities in Panel B. Data are from Rule 606 reports for the fourth quarter of 2012. %Mkt (%Lmt) refers to the percentage of a broker’s non-directed market (limit) orders routed to the destination. %Lmt includes both marketable and non-marketable limit orders. Brokers are responsible for deciding where non-directed orders are routed. Brokers do not have to disclose destination venues that receive less than 5% of their orders. As a result, percentages may not sum to 100%. Purchasers include Citadel, Knight, Citigroup, G1 Execution Services, UBS Securities, National Financial Services, Goldman Global Markets, Two Sigma Securities, and Getco. In the first (second) row under each venue, we provide the venue’s published take fee and most and least attractive published make rebate, where positive values are payments to the exchange and negative values are payments from the exchange. These fees are expressed in dollars per hundred shares.
Venue Take Range Make Range
Order Mix
Charles Schwab, Morgan Stanley,
Just2Trade, Edward Jones, & LowTrade
Ameritrade E*Trade Fidelity Scottrade Interactive Brokers
Panel A – NYSE Stocks EDGX +$0.30
-$0.23 to -$0.32
% Mkt 0% 0% 0% 0% % Lmt 49% 46% 28% 28%
NDAQ +$0.30
-$0.20 to -$0.29
% Mkt 3% % Lmt 7%
ARCA +$0.30
-$0.21 to -$0.30
% Mkt 2% % Lmt 23%
BZX +$0.29
-$0.25 to -$0.29
% Mkt 5% % Lmt 14%
Lava +0.28
-$0.24 to -$0.27
% Mkt 0% % Lmt 51%
NYSE -$0.23
-$0.15 to -$0.21
% Mkt 23% % Lmt 47%
Purchasers $0.0/<$0.0 $0.0/<$0.0
% Mkt 100% 96% 98% 97% 66% % Lmt 100% 45% 51% 57% 21%
BYX -$0.02
+$0.03 to +$0.02
% Mkt % Lmt
EDGA -$0.04
+$0.06 to +$0.05
% Mkt % Lmt
BX -$0.14
+$0.18 to +$0.15
% Mkt % Lmt
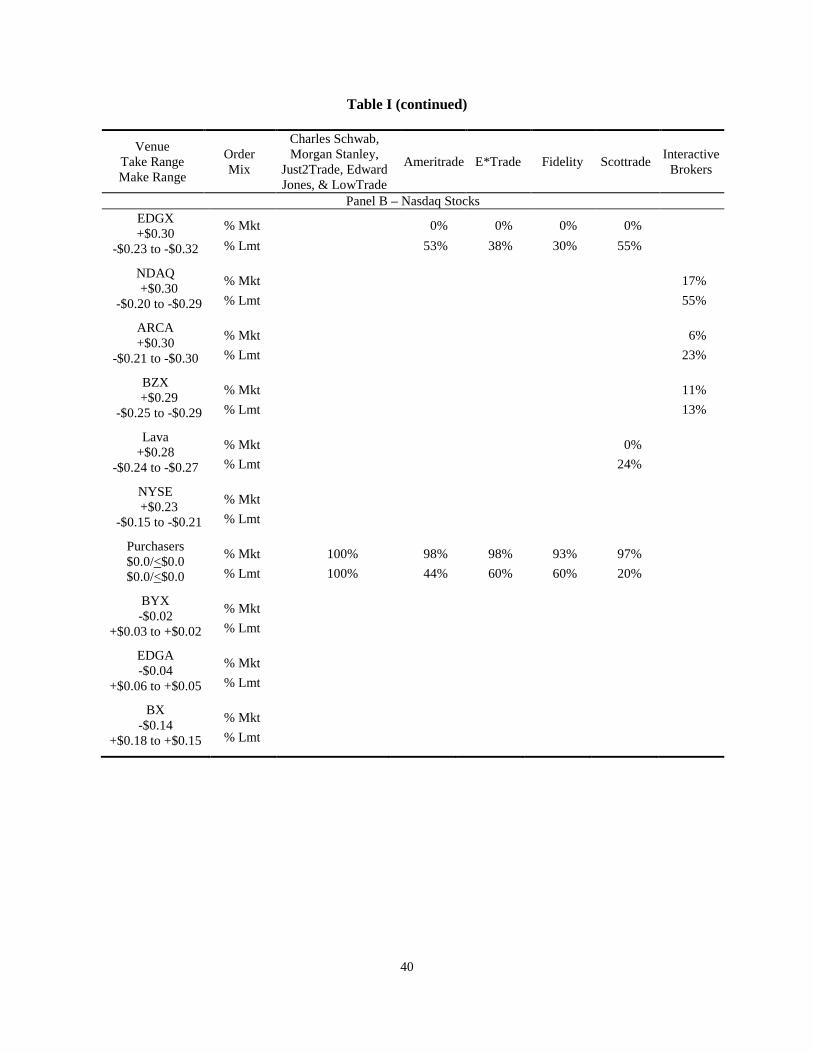
40
Table I (continued)
Venue Take Range Make Range
Order Mix
Charles Schwab, Morgan Stanley,
Just2Trade, Edward Jones, & LowTrade
Ameritrade E*Trade Fidelity Scottrade Interactive Brokers
Panel B – Nasdaq Stocks EDGX +$0.30
-$0.23 to -$0.32
% Mkt 0% 0% 0% 0% % Lmt 53% 38% 30% 55%
NDAQ +$0.30
-$0.20 to -$0.29
% Mkt 17% % Lmt 55%
ARCA +$0.30
-$0.21 to -$0.30
% Mkt 6% % Lmt 23%
BZX +$0.29
-$0.25 to -$0.29
% Mkt 11% % Lmt 13%
Lava +$0.28
-$0.24 to -$0.27
% Mkt 0% % Lmt 24%
NYSE +$0.23
-$0.15 to -$0.21
% Mkt % Lmt
Purchasers $0.0/<$0.0 $0.0/<$0.0
% Mkt 100% 98% 98% 93% 97% % Lmt 100% 44% 60% 60% 20%
BYX -$0.02
+$0.03 to +$0.02
% Mkt % Lmt
EDGA -$0.04
+$0.06 to +$0.05
% Mkt % Lmt
BX -$0.14
+$0.18 to +$0.15
% Mkt % Lmt

41
Table II Descriptive Statistics – Proprietary Limit Order Data
The table summarizes order characteristics for a sample of over 19.5 million orders for common stocks priced at greater than or equal to $1.00 from a major broker-dealer’s smart order routing system during October and November 2012. Order size and price are described in Panel A. Order display characteristics and order side are described in Panel B. Panel C provides additional information related to the order aggressiveness of displayed orders (i.e., orders with a non-zero displayed component). A marketable order is a limit order to buy (sell) shares at a price greater than or equal to (less than or equal to) the National Best Offer (Bid). Inside-the-quote limit orders have limit prices that improve prevailing quotes. A limit order to buy (sell) shares at the National Best Bid (Offer) is at-the-quote, and a limit order seeking to buy (sell) shares at prices that are more advantageous than the prevailing quotes are behind-the-quote. Standard (inverted) venues charge (pay) liquidity demanders and charge (pay) liquidity suppliers. Under each venue, we provide the take fee/rebate expressed in dollars per 100 shares.
Panel A. Order Time, Size, and Price Variable Average Minimum 25th Median 75th Maximum
Order Size (shares) 568 1 100 100 201 999,000
Display Size (shares) 75 0 0 0 100 250,000
Limit Price (dollars) $43.29 $0.99 $18.44 $33.52 $54.48 $949.88 Panel B. Order Display and Order Side Order Display % of Orders Order Side % of Orders
Full Display 30.58% Buy 51.34%
Partial Display 7.50% Sell 26.65%
No Display 61.93% Short Sell 22.01% Panel C. Order Aggressiveness for Displayed Limit Orders Conditional on Destination Venue
Standard Venue Inverted Venue
Order Placement All Orders
EDGX $0.30
NDAQ $0.30
ARCA $0.30
NYSE $0.23
BZX $0.29 EDGA
-$0.04 BX
-$0.14 Behind-the-quote 16.49% 5.69% 10.96% 9.18% 40.07% 3.36% 0.11% 0.23%
At-the-Quote 64.62% 82.08% 62.56% 66.70% 38.76% 93.75% 99.87% 99.41%
Inside-the-Quote 17.53% 11.31% 24.09% 22.44% 20.53% 0.85% 0.00% 0.23%
Marketable 1.36% 1.00% 2.68% 1.95% 0.72% 2.50% 0.04% 0.26%

42
Table III Order Outcomes
The table provides summary statistics related to order outcomes. The initial sample includes over 19.5 million orders for common stocks priced greater than or equal to $1.00 from a major broker-dealer’s smart order routing system during October and November 2012. Orders that include no displayed component are excluded. By sample construction, outcome time is later than order placement time, no executions take place after 4:02pm, and the number of shares executed cannot be greater than an order’s size. When computing seconds to cancellation for all orders, we assume open day orders are cancelled at 6:00pm. Panel B describes order outcomes conditional on fill status, where an order can have multiple outcomes.
Panel A. Summary statistics. # of Orders Average Min. 25th Median 75th Max.
# Shares Executed: All Orders 7,443,718 141 0 0 3 100 745,547
# Shares Executed: (Partially) Filled Orders 3,648,376 288 1 100 100 200 745,547
Average Execution Price 3,648,376 $43.29 $1.00 $17.61 $33.29 $54.01 $920.36
Seconds to First Execution 3,648,376 65 < 1 2 10 41 23,399
Seconds to Last Execution ( > 1 Fills) 1,066,049 97 < 1 4 17 56 23,396
Seconds to Cancellation or Expiration 4,006,375 160 < 1 8 32 77 30,486
Seconds to Cancellation 3,982,560 156 < 1 9 36 80 23,394
Seconds to Order Rejection 473 < 1 < 1 < 1 < 1 < 1 167
Seconds until Order is Replaced 4,499 8 < 1 < 1 2 7 1,322
Panel B. Order outcome conditional on fill status. Fill Status # of Orders Rejected Replaced Cancelled One Fill Expired No Fill 3,795,342 473 4,497 3,767,404 NA 22,968
Complete Fill 3,432,371 0 0 NA 2,451,342 NA
Partial Fill 216,005 0 2 215,156 130,985 847
All Orders 7,443,718 473 4,499 3,982,560 2,582,327 23,815
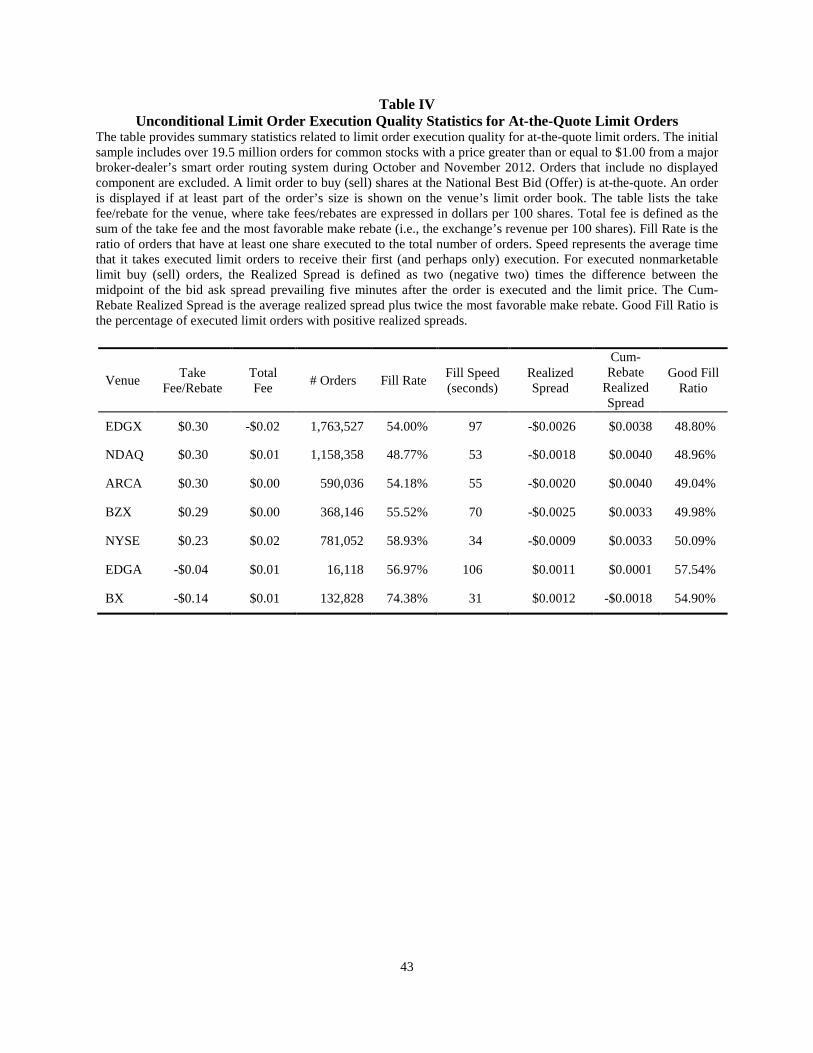
43
Table IV Unconditional Limit Order Execution Quality Statistics for At-the-Quote Limit Orders
The table provides summary statistics related to limit order execution quality for at-the-quote limit orders. The initial sample includes over 19.5 million orders for common stocks with a price greater than or equal to $1.00 from a major broker-dealer’s smart order routing system during October and November 2012. Orders that include no displayed component are excluded. A limit order to buy (sell) shares at the National Best Bid (Offer) is at-the-quote. An order is displayed if at least part of the order’s size is shown on the venue’s limit order book. The table lists the take fee/rebate for the venue, where take fees/rebates are expressed in dollars per 100 shares. Total fee is defined as the sum of the take fee and the most favorable make rebate (i.e., the exchange’s revenue per 100 shares). Fill Rate is the ratio of orders that have at least one share executed to the total number of orders. Speed represents the average time that it takes executed limit orders to receive their first (and perhaps only) execution. For executed nonmarketable limit buy (sell) orders, the Realized Spread is defined as two (negative two) times the difference between the midpoint of the bid ask spread prevailing five minutes after the order is executed and the limit price. The Cum-Rebate Realized Spread is the average realized spread plus twice the most favorable make rebate. Good Fill Ratio is the percentage of executed limit orders with positive realized spreads.
Venue Take Fee/Rebate
Total Fee # Orders Fill Rate Fill Speed
(seconds) Realized Spread
Cum-Rebate
Realized Spread
Good Fill Ratio
EDGX $0.30 -$0.02 1,763,527 54.00% 97 -$0.0026 $0.0038 48.80%
NDAQ $0.30 $0.01 1,158,358 48.77% 53 -$0.0018 $0.0040 48.96%
ARCA $0.30 $0.00 590,036 54.18% 55 -$0.0020 $0.0040 49.04%
BZX $0.29 $0.00 368,146 55.52% 70 -$0.0025 $0.0033 49.98%
NYSE $0.23 $0.02 781,052 58.93% 34 -$0.0009 $0.0033 50.09%
EDGA -$0.04 $0.01 16,118 56.97% 106 $0.0011 $0.0001 57.54%
BX -$0.14 $0.01 132,828 74.38% 31 $0.0012 -$0.0018 54.90%
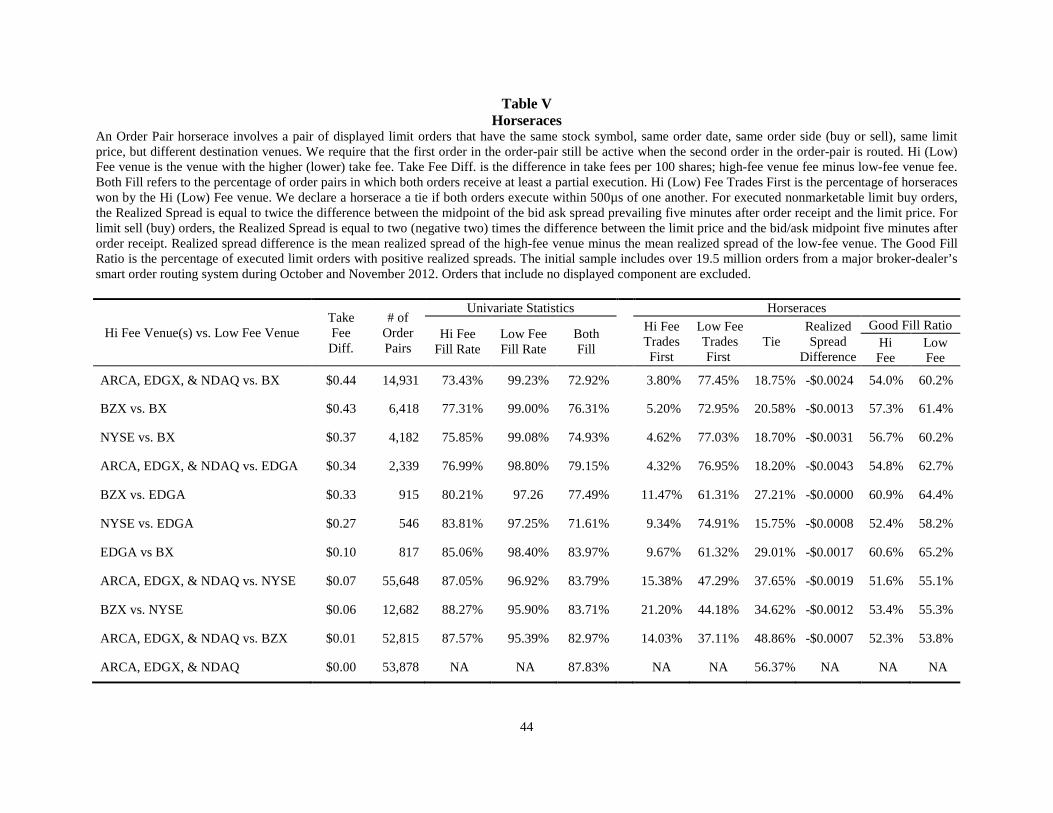
44
Table V Horseraces
An Order Pair horserace involves a pair of displayed limit orders that have the same stock symbol, same order date, same order side (buy or sell), same limit price, but different destination venues. We require that the first order in the order-pair still be active when the second order in the order-pair is routed. Hi (Low) Fee venue is the venue with the higher (lower) take fee. Take Fee Diff. is the difference in take fees per 100 shares; high-fee venue fee minus low-fee venue fee. Both Fill refers to the percentage of order pairs in which both orders receive at least a partial execution. Hi (Low) Fee Trades First is the percentage of horseraces won by the Hi (Low) Fee venue. We declare a horserace a tie if both orders execute within 500µs of one another. For executed nonmarketable limit buy orders, the Realized Spread is equal to twice the difference between the midpoint of the bid ask spread prevailing five minutes after order receipt and the limit price. For limit sell (buy) orders, the Realized Spread is equal to two (negative two) times the difference between the limit price and the bid/ask midpoint five minutes after order receipt. Realized spread difference is the mean realized spread of the high-fee venue minus the mean realized spread of the low-fee venue. The Good Fill Ratio is the percentage of executed limit orders with positive realized spreads. The initial sample includes over 19.5 million orders from a major broker-dealer’s smart order routing system during October and November 2012. Orders that include no displayed component are excluded.
Hi Fee Venue(s) vs. Low Fee Venue Take Fee Diff.
# of Order Pairs
Univariate Statistics Horseraces
Hi Fee Fill Rate
Low Fee Fill Rate
Both Fill
Hi Fee Trades First
Low Fee Trades First
Tie Realized Spread
Difference
Good Fill Ratio Hi
Fee Low Fee
ARCA, EDGX, & NDAQ vs. BX $0.44 14,931 73.43% 99.23% 72.92% 3.80% 77.45% 18.75% -$0.0024 54.0% 60.2%
BZX vs. BX $0.43 6,418 77.31% 99.00% 76.31% 5.20% 72.95% 20.58% -$0.0013 57.3% 61.4%
NYSE vs. BX $0.37 4,182 75.85% 99.08% 74.93% 4.62% 77.03% 18.70% -$0.0031 56.7% 60.2%
ARCA, EDGX, & NDAQ vs. EDGA $0.34 2,339 76.99% 98.80% 79.15% 4.32% 76.95% 18.20% -$0.0043 54.8% 62.7%
BZX vs. EDGA $0.33 915 80.21% 97.26 77.49% 11.47% 61.31% 27.21% -$0.0000 60.9% 64.4%
NYSE vs. EDGA $0.27 546 83.81% 97.25% 71.61% 9.34% 74.91% 15.75% -$0.0008 52.4% 58.2%
EDGA vs BX $0.10 817 85.06% 98.40% 83.97% 9.67% 61.32% 29.01% -$0.0017 60.6% 65.2%
ARCA, EDGX, & NDAQ vs. NYSE $0.07 55,648 87.05% 96.92% 83.79% 15.38% 47.29% 37.65% -$0.0019 51.6% 55.1%
BZX vs. NYSE $0.06 12,682 88.27% 95.90% 83.71% 21.20% 44.18% 34.62% -$0.0012 53.4% 55.3%
ARCA, EDGX, & NDAQ vs. BZX $0.01 52,815 87.57% 95.39% 82.97% 14.03% 37.11% 48.86% -$0.0007 52.3% 53.8%
ARCA, EDGX, & NDAQ $0.00 53,878 NA NA 87.83% NA NA 56.37% NA NA NA

45
Table VI Multivariate Analysis of Displayed Limit Order Execution Quality
We use Probit to examine the relationship between fees and the probability that a displayed limit order executes, where Fill equals one if any part of the order fills and zero otherwise. We use Ordinary Least Squares to examine the relationship between fees and Time-to-Execution, between fees and %Realized Spread, and between fees and %Cum-Rebate Realized Spread. Time-to-Execution equals the number of seconds between Order Time and First Fill Time conditional on at least a partial fill. For limit sell (buy) orders, the %Realized Spread is equal to two (negative two) times the difference between the limit price and the bid/ask midpoint five minutes after order receipt normalized by the trade price. The %Cum-Rebate Realized Spread is the average realized spread plus twice the most favorable make rebate normalized by the trade price. The initial sample includes over 28 million orders from a major broker-dealer’s smart order routing system during October and November 2012. Orders that include no displayed component are excluded. The independent variables are defined as follows: Long Sell equals 1 if the order side is “Sell” and 0 otherwise; Short Sell equals 1 if the order side is “Short Sell” and 0 otherwise; Moneyness equals [(Limit Price/Ask Price) – 1]*100 for sell orders and [(Bid Price/Limit Price) – 1]*100 for buy orders; Order Size is the number of shares specified in the order relative to the quoted size; Avg. Volume equals the stock’s average daily share volume during the sample period; Price equals the stock’s average closing price during the sample period; Volatility equals the stock’s average squared daily return during the sample period; Venue Response Time equals the average across all canceled trades on the venue of the difference between Out Time from the venue and Cancel Time from the broker; and Take Fee is defined as the executing venue’s take fee, expressed in dollars per 100 shares. Indicator variables are added for each of the 30 minute-periods from 10:00 a.m. to 4:00 p.m. * indicates that the coefficient is significant at the .01 level.
Probability of Fill Time-to-Execution %Realized
Spread %Cum-Rebate Realized Spread
Coefficient Estimate
Marginal Probability
Coefficient Estimate
Coefficient Estimate
Coefficient Estimate
Intercept -0.6632* 231.3392* 0.0502* 0.0460*
Long Sell 0.0741* 0.0283 0.0908* -0.0040* -0.0017*
Short Sell -0.0773* -0.0295 - 9.7167* -0.0049* -0.0043*
Moneyness -2.3683* -0.9046 480.8031* 0.2390* 0.1968*
Order Size 0.0023* 0.0009 1.3396* 0.0014* 0.0014*
Log (Avg. Volume) 0.0387* 0.0148 - 15.1471* -0.0033* -0.0043*
Average Price 0.0017* 0.0007 - 0.3931* 0.0001* -0.0002*
Volatility 0.3199* 0.1222 444.2033* 0.0860* 0.4692*
Response Time 1.5618* 0.5965 - 373.7604* 0.0688* -0.0930*
Take Fee -0.3201* -0.1223 133.2177* -0.0409* 0.1369* Intraday Dummies Yes Yes Yes Yes N 7,443,376 3,648,376 3,648,376 3,648,376
R2 0.0689 0.0431 0.0053 0.0053
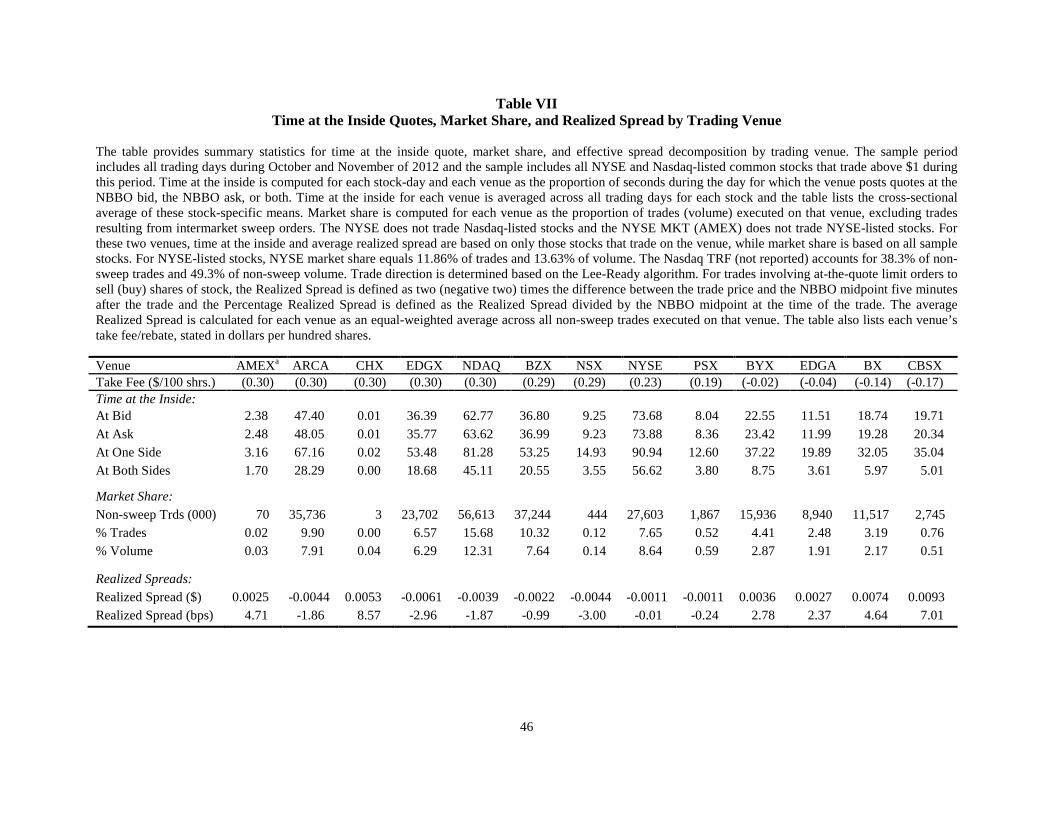
46
Table VII Time at the Inside Quotes, Market Share, and Realized Spread by Trading Venue
The table provides summary statistics for time at the inside quote, market share, and effective spread decomposition by trading venue. The sample period includes all trading days during October and November of 2012 and the sample includes all NYSE and Nasdaq-listed common stocks that trade above $1 during this period. Time at the inside is computed for each stock-day and each venue as the proportion of seconds during the day for which the venue posts quotes at the NBBO bid, the NBBO ask, or both. Time at the inside for each venue is averaged across all trading days for each stock and the table lists the cross-sectional average of these stock-specific means. Market share is computed for each venue as the proportion of trades (volume) executed on that venue, excluding trades resulting from intermarket sweep orders. The NYSE does not trade Nasdaq-listed stocks and the NYSE MKT (AMEX) does not trade NYSE-listed stocks. For these two venues, time at the inside and average realized spread are based on only those stocks that trade on the venue, while market share is based on all sample stocks. For NYSE-listed stocks, NYSE market share equals 11.86% of trades and 13.63% of volume. The Nasdaq TRF (not reported) accounts for 38.3% of non-sweep trades and 49.3% of non-sweep volume. Trade direction is determined based on the Lee-Ready algorithm. For trades involving at-the-quote limit orders to sell (buy) shares of stock, the Realized Spread is defined as two (negative two) times the difference between the trade price and the NBBO midpoint five minutes after the trade and the Percentage Realized Spread is defined as the Realized Spread divided by the NBBO midpoint at the time of the trade. The average Realized Spread is calculated for each venue as an equal-weighted average across all non-sweep trades executed on that venue. The table also lists each venue’s take fee/rebate, stated in dollars per hundred shares.
Venue AMEXa ARCA CHX EDGX NDAQ BZX NSX NYSE PSX BYX EDGA BX CBSX Take Fee ($/100 shrs.) (0.30) (0.30) (0.30) (0.30) (0.30) (0.29) (0.29) (0.23) (0.19) (-0.02) (-0.04) (-0.14) (-0.17) Time at the Inside: At Bid 2.38 47.40 0.01 36.39 62.77 36.80 9.25 73.68 8.04 22.55 11.51 18.74 19.71 At Ask 2.48 48.05 0.01 35.77 63.62 36.99 9.23 73.88 8.36 23.42 11.99 19.28 20.34 At One Side 3.16 67.16 0.02 53.48 81.28 53.25 14.93 90.94 12.60 37.22 19.89 32.05 35.04 At Both Sides 1.70 28.29 0.00 18.68 45.11 20.55 3.55 56.62 3.80 8.75 3.61 5.97 5.01 Market Share: Non-sweep Trds (000) 70 35,736 3 23,702 56,613 37,244 444 27,603 1,867 15,936 8,940 11,517 2,745 % Trades 0.02 9.90 0.00 6.57 15.68 10.32 0.12 7.65 0.52 4.41 2.48 3.19 0.76 % Volume 0.03 7.91 0.04 6.29 12.31 7.64 0.14 8.64 0.59 2.87 1.91 2.17 0.51 Realized Spreads: Realized Spread ($) 0.0025 -0.0044 0.0053 -0.0061 -0.0039 -0.0022 -0.0044 -0.0011 -0.0011 0.0036 0.0027 0.0074 0.0093 Realized Spread (bps) 4.71 -1.86 8.57 -2.96 -1.87 -0.99 -3.00 -0.01 -0.24 2.78 2.37 4.64 7.01
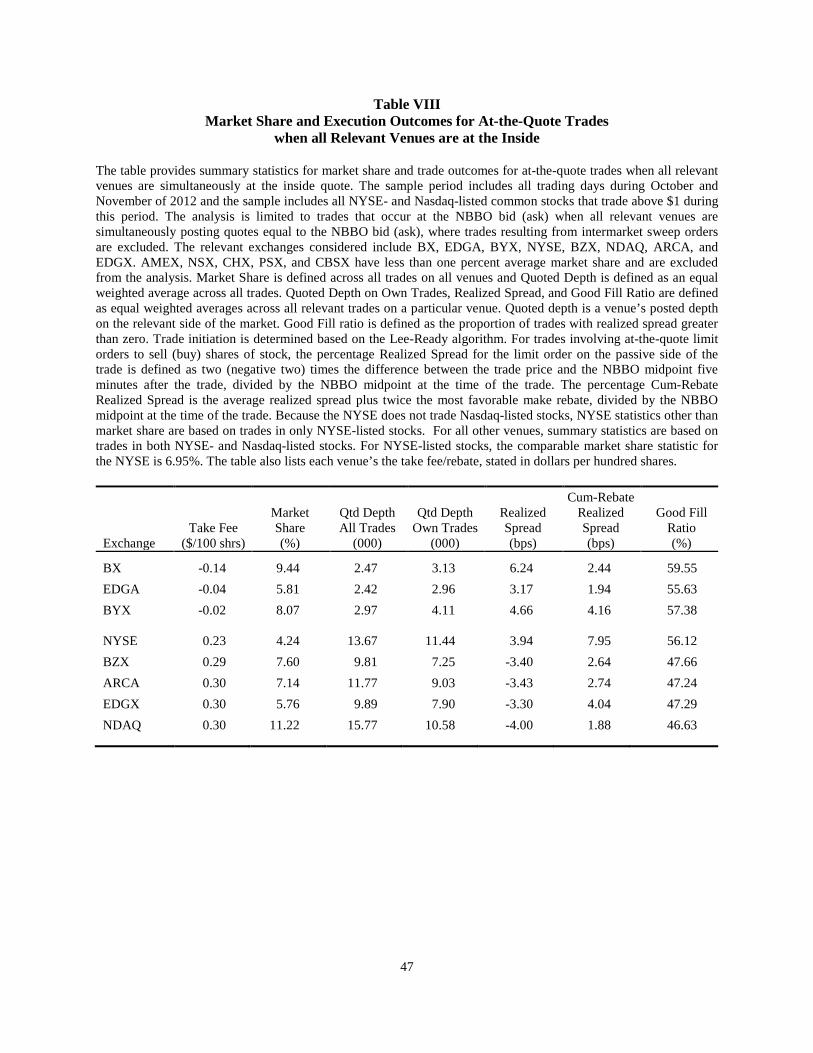
47
Table VIII Market Share and Execution Outcomes for At-the-Quote Trades
when all Relevant Venues are at the Inside
The table provides summary statistics for market share and trade outcomes for at-the-quote trades when all relevant venues are simultaneously at the inside quote. The sample period includes all trading days during October and November of 2012 and the sample includes all NYSE- and Nasdaq-listed common stocks that trade above $1 during this period. The analysis is limited to trades that occur at the NBBO bid (ask) when all relevant venues are simultaneously posting quotes equal to the NBBO bid (ask), where trades resulting from intermarket sweep orders are excluded. The relevant exchanges considered include BX, EDGA, BYX, NYSE, BZX, NDAQ, ARCA, and EDGX. AMEX, NSX, CHX, PSX, and CBSX have less than one percent average market share and are excluded from the analysis. Market Share is defined across all trades on all venues and Quoted Depth is defined as an equal weighted average across all trades. Quoted Depth on Own Trades, Realized Spread, and Good Fill Ratio are defined as equal weighted averages across all relevant trades on a particular venue. Quoted depth is a venue’s posted depth on the relevant side of the market. Good Fill ratio is defined as the proportion of trades with realized spread greater than zero. Trade initiation is determined based on the Lee-Ready algorithm. For trades involving at-the-quote limit orders to sell (buy) shares of stock, the percentage Realized Spread for the limit order on the passive side of the trade is defined as two (negative two) times the difference between the trade price and the NBBO midpoint five minutes after the trade, divided by the NBBO midpoint at the time of the trade. The percentage Cum-Rebate Realized Spread is the average realized spread plus twice the most favorable make rebate, divided by the NBBO midpoint at the time of the trade. Because the NYSE does not trade Nasdaq-listed stocks, NYSE statistics other than market share are based on trades in only NYSE-listed stocks. For all other venues, summary statistics are based on trades in both NYSE- and Nasdaq-listed stocks. For NYSE-listed stocks, the comparable market share statistic for the NYSE is 6.95%. The table also lists each venue’s the take fee/rebate, stated in dollars per hundred shares.
Exchange Take Fee
($/100 shrs)
Market Share (%)
Qtd Depth All Trades
(000)
Qtd Depth Own Trades
(000)
Realized Spread (bps)
Cum-Rebate Realized Spread (bps)
Good Fill Ratio (%)
BX -0.14 9.44 2.47 3.13 6.24 2.44 59.55 EDGA -0.04 5.81 2.42 2.96 3.17 1.94 55.63 BYX -0.02 8.07 2.97 4.11 4.66 4.16 57.38 NYSE 0.23 4.24 13.67 11.44 3.94 7.95 56.12 BZX 0.29 7.60 9.81 7.25 -3.40 2.64 47.66 ARCA 0.30 7.14 11.77 9.03 -3.43 2.74 47.24 EDGX 0.30 5.76 9.89 7.90 -3.30 4.04 47.29 NDAQ 0.30 11.22 15.77 10.58 -4.00 1.88 46.63

48
Table IX Realized Spread Regressions
The table describes results from OLS regressions of realized spreads and cum-rebate realized spreads on stock and trade characteristics. The sample period includes all trading days during October and November of 2012 and the sample includes all NYSE- and Nasdaq-listed common stocks that trade above $1 during this period. The initial trade sample includes all non-sweep trades that execute on one of the relevant exchanges and for which the realized spread could be calculated. The relevant exchanges considered include BX, EDGA, BYX, NYSE, BZX, NDAQ, ARCA, and EDGX. AMEX, NSX, CHX, PSX, and CBSX have less than one percent average market share and are excluded from the analysis. We then focus on the subset of trades that take place at the quotes and the subset of at-the-quote trades that occur when all relevant venues are at the inside quote. Trade initiation is determined based on the Lee-Ready algorithm. For trades involving at-the-quote limit orders to sell (buy) shares of stock, the percentage Realized Spread for the limit order on the passive side of the trade is defined as two (negative two) times the difference between the trade price and the NBBO midpoint five minutes after the trade, divided by the NBBO midpoint at the time of the trade. The percentage Cum-Rebate Realized Spread is the average realized spread plus twice the most favorable make rebate, divided by the NBBO midpoint at the time of the trade. Average Volume is the average daily share volume computed over the six months prior to the sample period. Trade Price and Trade Size are the price and number of shares in the current trade. Daily High/Low is defined for each stock-day as the ratio of the highest and lowest trade price for the stock on that trading day. Take Fee is the fee charged (per hundred shares) to liquidity takers by the venue associated with the current trade, where rebates are defined as negative fees. Min_Fee is a dummy variable equal to one if the trade venue has the lowest take fee of all venues at the inside quote at the time of the trade. High_Depth is a dummy variable equal to one if the aggregate depth at the relevant inside quote is at least 20,000 shares. Low_Price is a dummy variable equal to one if the trade price is less than $6. SmartRouterInverted is a dummy variable equal to one if the proprietary order data includes a trade on an inverted venue during the same firm-second as the current TAQ trade. Intraday dummy variables are used to define 30-minute intervals within the trading day. Each coefficient estimate has a p-value of 0.000.
%Realized Spreads %Cum-Rebate Realized Spreads
At-the-Quote Trades At-the-Quote Trades with All Venues at the Inside At-the-Quote Trades At-the-Quote Trades with
All Venues at the Inside Intercept 0.0826 0.0835 0.0718 0.0899 0.1806 0.1511 0.1641 0.1402 Ln(Avg. Volume) 0.0020 0.0028 0.0051 0.0060 0.0006 0.0014 0.0037 0.0045 Ln(Trade Price) -0.0029 -0.0102 -0.0196 -0.0351 -0.0348 -0.0274 -0.0504 -0.0460 Ln(Trade Size) -0.0129 -0.0115 -0.0139 -0.0132 -0.0111 -0.0115 -0.0140 -0.0139 Ln(Daily High/Low) -0.5899 -0.5688 -0.2506 -0.2124 -0.4671 -0.5110 -0.1288 -0.1539 Take Fee -0.1562 -0.1294 -0.1972 -0.1080 0.0135 -0.0099 0.0408 0.0274 Take Fee * Low_Price - -0.1535 - -0.2903 - 0.2011 - 0.1106 Take Fee * High_Depth - -0.0585 - -0.0496 - -0.0156 - -0.0152 Take Fee * Min_Fee - 0.0072 - - - 0.0062 - - Take Fee * SmartRouterInverted - -0.1014 - -0.1956 - -0.1038 - -0.1988 Intraday Dummies Yes Yes Yes Yes Yes Yes Yes Yes N 160.5M 160.5M 23.9M 23.9M 160.5M 160.5M 23.9M 23.9M Adjusted R2 0.0020 0.0023 0.0049 0.0064 0.0019 0.0023 0.0042 0.0045
49
Appendix Table I Detailed Horserace Results
An Order Pair Horserace involves a pair of displayed limit orders that have the same stock symbol, same order date, same order side (buy or sell), same limit price, but different destination venues. We require that the first order in the order-pair still be active when the second order in the order-pair is routed. The 1st (2nd) venue receives the first (second) order of the order pair. Take fee is the cost of accessing 100 shares of liquidity on the given venue. % Both Fill refers to the percentage of order pairs in which both orders receive at least a partial execution. For the order pairs where both orders execute, Difference in Time to 1st Fill is the difference in times to execution for each of the two orders in the order pair. If the order resting at the first venue executes before (after) the order on the second venue’s order book fills, this difference is negative (positive). % 1st Venue Trades First (% 2nd Venue Trades First) is the percentage of horseraces won by the first (second) venue. We declare a horserace a tie if both orders execute within 500 µs of one another. The Good Fill Ratio is the percentage of executed limit orders with positive realized spreads. Take fees are expressed in dollars per 100 shares.
Order Pair # of Order Pairs
1st Venue Fill Rate
2nd Venue Fill Rate
Both Fill
1st Venue Trades First
2nd Venue Trades First
Tie 1st Venue Realized Spread
2nd Venue Realized Spread
1st Venue Good Fill
Ratio
2nd Venue Good Fill
Ratio 1st Venue (take fee)
2nd Venue (take fee)
ARCA ($0.30) BX (-$0.14) 3,996 74.82% 99.07% 73.89% 4.90% 75.90% 19.19% -0.0022 -0.0026 54.4 60.3 BX (-$0.14) ARCA ($0.30) 1,956 98.72% 75.41% 74.13% 73.52% 6.54% 19.94% 0.0022 -0.0017 63.4 56.5 NDAQ ($0.30) BX (-$0.14) 4,031 72.91% 99.18% 72.09% 3.65% 75.34% 21.01% -0.0004 0.0020 54.1 59.1 BX (-$0.14) NDAQ ($0.30) 1,578 99.17% 71.03% 72.75% 72.75% 4.24% 23.00% 0.0027 0.0001 63.7 54.3 EDGX ($0.30) BX (-$0.14) 3,369 72.40% 99.79% 72.19% 0.86% 86.35% 12.79% -0.0056 -0.0007 50.6 57.8 BX (-$0.14) EDGX($0.30) 1,463 99.66% 71.43% 71.09% 81.89% 1.44% 16.67% -0.0012 -0.0066 58.3 45.6 BZX ($0.29) BX (-$0.14) 3,726 75.85% 99.08% 74.93% 4.26% 77.03% 18.70% 0.0005 0.0023 56.7 60.2 BX (-$0.14) BZX ($0.29) 2,692 98.89% 79.34% 78.23% 67.31% 6.50% 26.19% 0.0013 0.0007 63.1 58.2 NYSE ($0.23) BX (-$0.14) 3,163 77.30% 99.14% 76.45% 6.42% 74.98% 18.60% 0.0002 0.0033 54.6 59.2 BX (-$0.14) NYSE ($0.23) 1,019 99.01% 74.59% 73.60% 80.67% 4.61% 14.72% 0.0027 -0.0005 63.6 55.5 ARCA ($0.30) EDGA (-$0.04) 290 74.48% 97.93% 72.41% 11.72% 69.66% 18.62% -0.0037 0.0037 62.0 66.9 EDGA (-$0.04) ARCA ($0.30) 218 97.25% 77.06% 74.31% 67.43% 8.72% 23.85% 0.0041 -0.0033 72.2 61.9 NDAQ ($0.30) EDGA (-$0.04) 431 73.78% 97.91% 79.81% 4.18% 79.81% 16.01% 0.0003 0.0027 56.3 62.6 EDGA (-$0.04) NDAQ ($0.30) 307 99.67% 73.94% 73.62% 81.75% 1.30% 16.94% 0.0044 0.0002 63.4 52.4 EDGX ($0.30) EDGA (-$0.04) 641 78.78% 99.53% 78.32% 2.96% 77.22% 19.81% -0.0009 0.0024 53.5 58.6 EDGA (-$0.04) EDGX ($0.30) 452 99.33% 77.21% 76.55% 79.87% 1.55% 18.58% 0.0029 -0.0014 61.0 48.7 BZX ($0.29) EDGA (-$0.04) 532 80.63% 97.18% 77.82% 11.65% 59.96% 28.38% 0.0023 0.0025 61.4 61.7 EDGA (-$0.04) BZX ($0.29) 383 97.38% 79.63% 77.02% 63.18% 11.23% 25.58% 0.0006 0.0009 68.3 60.3
50
Appendix Table I (Continued)
Order Pair # of Order Pairs
1st Venue Fill Rate
2nd Venue Fill Rate
Both Fill
1st Venue Trades First
2nd Venue Trades First
Tie 1st Venue Realized Spread
2nd Venue Realized Spread
1st Venue Good Fill
Ratio
2nd Venue Good Fill
Ratio 1st Venue (take fee)
2nd Venue (take fee)
NYSE ($0.23) EDGA (-$0.04) 321 75.71% 95.64% 72.27% 11.53% 72.27% 16.20% 0.0022 0.0010 55.3 58.3 EDGA (-$0.04) NYSE ($0.23) 225 99.55% 71.11% 70.66% 78.67% 6.22% 15.11% -0.0010 -0.0046 58.0 48.2 EDGA (-$0.04) BX (-$0.14) 352 88.07% 97.43% 85.51% 12.78% 59.94% 27.27% 0.0011 0.0011 64.2 65.0 BX (-$0.14) EDGA(-$0.04) 465 99.14% 82.79% 82.80% 62.37% 7.31% 30.32% 0.0034 0.0004 65.3 57.9 ARCA ($0.30) NYSE ($0.23) 8,677 88.50% 97.15% 85.65% 16.99% 45.29% 37.72% 0.0031 0.0037 54.1 55.6 NYSE ($0.23) ARCA ($0.30) 8,290 96.56% 86.51% 83.07% 47.50% 17.62% 34.87% 0.0031 -0.0001 56.8 54.2 NDAQ ($0.30) NYSE ($0.23) 11,001 86.46% 96.54% 82.99% 16.24% 43.74% 40.01% 0.0028 0.0040 52.6 54.1 NYSE ($0.23) NDAQ ($0.30) 11,962 96.78% 86.37% 83.15% 45.86% 16.26% 37.87% 0.0031 0.0010 55.6 52.7 EDGX ($0.30) NYSE ($0.23) 8,073 87.84% 97.51% 85.34% 11.55% 53.56% 34.89% -0.0021 -0.0001 49.8 52.5 NYSE ($0.23) EDGX ($0.30) 7,645 97.19% 87.10% 84.29% 50.09% 12.57% 37.34% -0.0021 -0.0044 52.8 47.8 BZX ($0.29) NYSE ($0.23) 5,843 88.46% 96.23% 83.69% 20.50% 45.31% 34.19% -0.0008 -0.0007 54.4 55.1 NYSE ($0.23) BZX ($0.29) 6,839 95.62% 88.10% 83.73% 43.22% 21.80% 34.98% -0.0006 -0.0028 55.5 52.5 NDAQ ($0.30) BZX ($0.29) 9,520 91.27% 96.00% 87.28 14.57% 31.58% 53.86% -0.0001 -0.0002 53.7 53.3 BZX ($0.29) NDAQ ($0.30) 6,245 97.13% 86.42% 83.55% 38.16% 10.82% 51.02% 0.0011 0.0002 58.4 54.4 EDGX ($0.30) BZX ($0.29) 8,346 78.31% 92.40% 70.72% 12.56% 44.36% 43.09% -0.0093 -0.0087 48.9 49.8 BZX ($0.29) EDGX ($0.30) 4,429 97.36% 88.00% 85.36% 43.15% 8.09% 48.76% -0.0038 -0.0054 52.7 48.6 ARCA ($0.30) BZX ($0.29) 15,259 90.40% 95.24% 85.64% 16.61% 34.09% 49.30% -0.0004 0.0001 53.9 53.7 BZX ($0.29) ARCA ($0.30) 9,016 95.59% 88.05% 83.64% 37.68% 15.59% 46.73% -0.0008 -0.0022 55.7 51.7 NDAQ ($0.30) EDGX ($0.30) 8,863 94.57% 93.83% 88.78% 23.11% 17.62% 59.27% -0.0005 -0.0010 51.9 50.0 EDGX ($0.30) NDAQ ($0.30) 8,261 93.40% 94.86% 88.26% 19.08% 25.19% 55.73% 0.0035 0.0031 53.4 52.0 NDAQ ($0.30) ARCA ($0.30) 15,284 94.16% 93.56% 87.72% 23.09% 20.12% 56.79% 0.0040 0.0025 54.7 53.8 ARCA ($0.30) NDAQ ($0.30) 10,433 94.57% 92.75% 87.33% 22.72% 21.22% 56.06% 0.0049 0.0051 56.5 54.9 EDGX ($0.30) ARCA ($0.30) 4,952 91.72% 95.50% 87.22% 16.68% 29.50% 53.81% -0.0042 -0.0047 49.6 48.7 ARCA ($0.30) EDGX ($0.30) 6,345 95.29% 92.07% 87.50% 26.98% 18.44% 54.58% -0.0009 -0.0026 52.0 49.3


![Student Statements.ppt [Read-Only] · • Tuition • Room & Board fees • Online fees • Course fees • Other applicable fees (parking decals, replacement ID cards, etc.) •](https://static.fdocuments.us/doc/165x107/60135b64702c204ada709501/student-read-only-a-tuition-a-room-board-fees-a-online-fees-a-course.jpg)