CalPERS Supplemental Income 457 Plan · CalPERS Investment Policy for Supplemental Income Plans ......
27
Fund Fact Sheets CalPERS Supplemental Income 457 Plan As of March 31, 2018
-
Upload
trinhthien -
Category
Documents
-
view
217 -
download
2
Transcript of CalPERS Supplemental Income 457 Plan · CalPERS Investment Policy for Supplemental Income Plans ......
Fund Fact Sheets
CalPERS SupplementalIncome 457 Plan
As of March 31, 2018
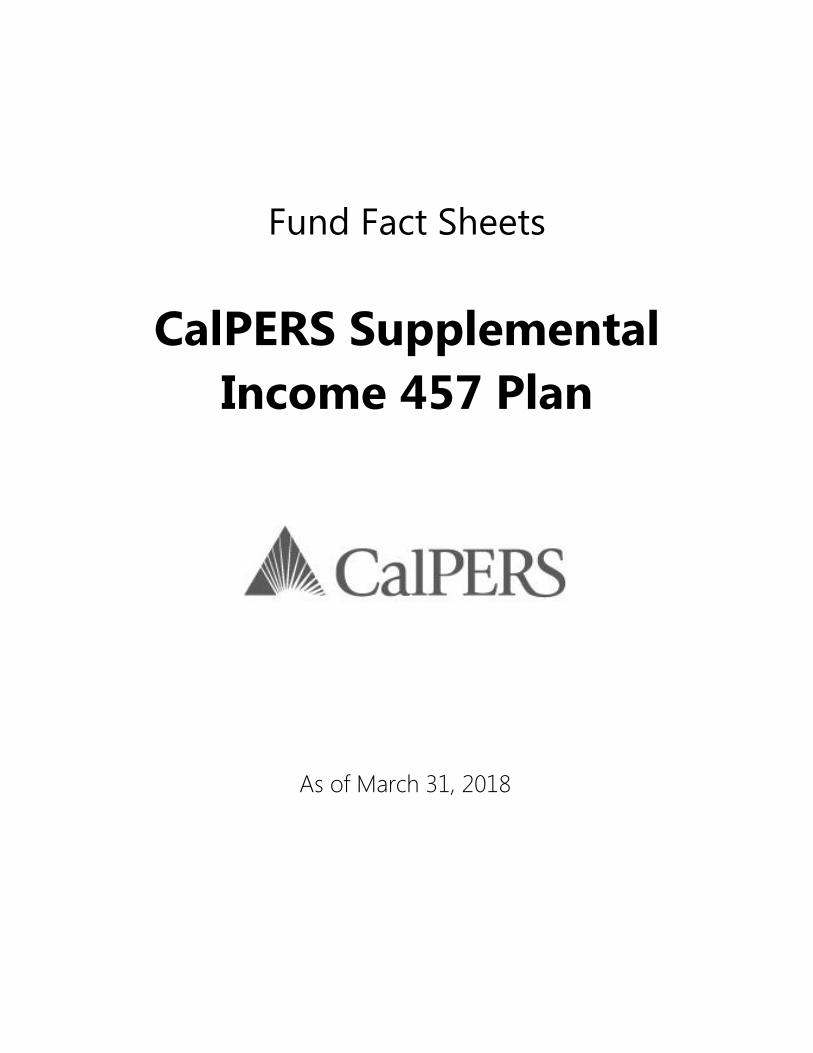
Target Retirement Date Funds Glidepath
Approximate Number of Years to Retirement
41 36 31 26 21 16 11 6 1 0
Less Conservative More Conservative
CalPERS 457 Plan
Target Retirement Date Funds
March 31, 2018
Ass
et
All
oc
ati
on
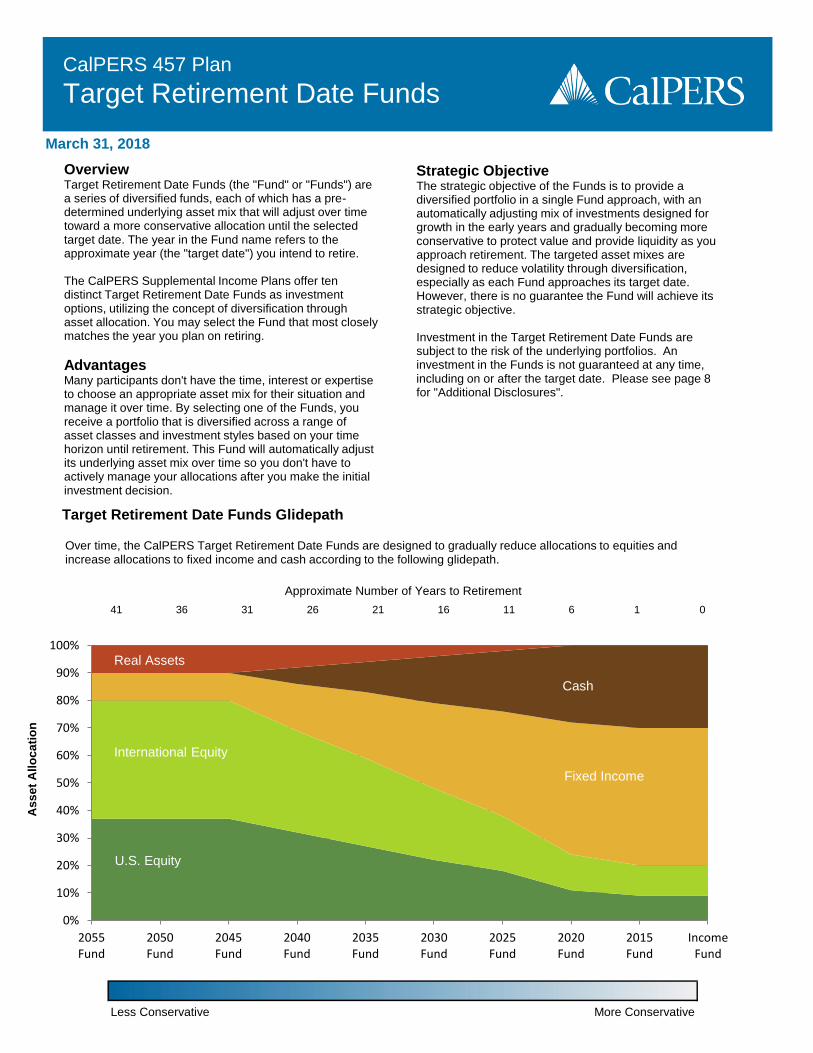
OverviewTarget Retirement Date Funds (the "Fund" or "Funds") are a series of diversified funds, each of which has a pre-determined underlying asset mix that will adjust over time toward a more conservative allocation until the selected target date. The year in the Fund name refers to the approximate year (the "target date") you intend to retire.
The CalPERS Supplemental Income Plans offer ten distinct Target Retirement Date Funds as investment options, utilizing the concept of diversification through asset allocation. You may select the Fund that most closely matches the year you plan on retiring.
AdvantagesMany participants don't have the time, interest or expertise to choose an appropriate asset mix for their situation and manage it over time. By selecting one of the Funds, you receive a portfolio that is diversified across a range of asset classes and investment styles based on your time horizon until retirement. This Fund will automatically adjust its underlying asset mix over time so you don't have to actively manage your allocations after you make the initial investment decision.
Strategic Objective The strategic objective of the Funds is to provide a diversified portfolio in a single Fund approach, with an automatically adjusting mix of investments designed for growth in the early years and gradually becoming more conservative to protect value and provide liquidity as you approach retirement. The targeted asset mixes are designed to reduce volatility through diversification, especially as each Fund approaches its target date. However, there is no guarantee the Fund will achieve its strategic objective.
Investment in the Target Retirement Date Funds are subject to the risk of the underlying portfolios. An investment in the Funds is not guaranteed at any time, including on or after the target date. Please see page 8 for "Additional Disclosures".
Over time, the CalPERS Target Retirement Date Funds are designed to gradually reduce allocations to equities and increase allocations to fixed income and cash according to the following glidepath.
0%
10%
20%
30%
40%
50%
60%
70%
80%
90%
100%
2055Fund
2050Fund
2045Fund
2040Fund
2035Fund
2030Fund
2025Fund
2020Fund
2015Fund
IncomeFund
Real Assets
Fixed Income
Cash
International Equity
U.S. Equity
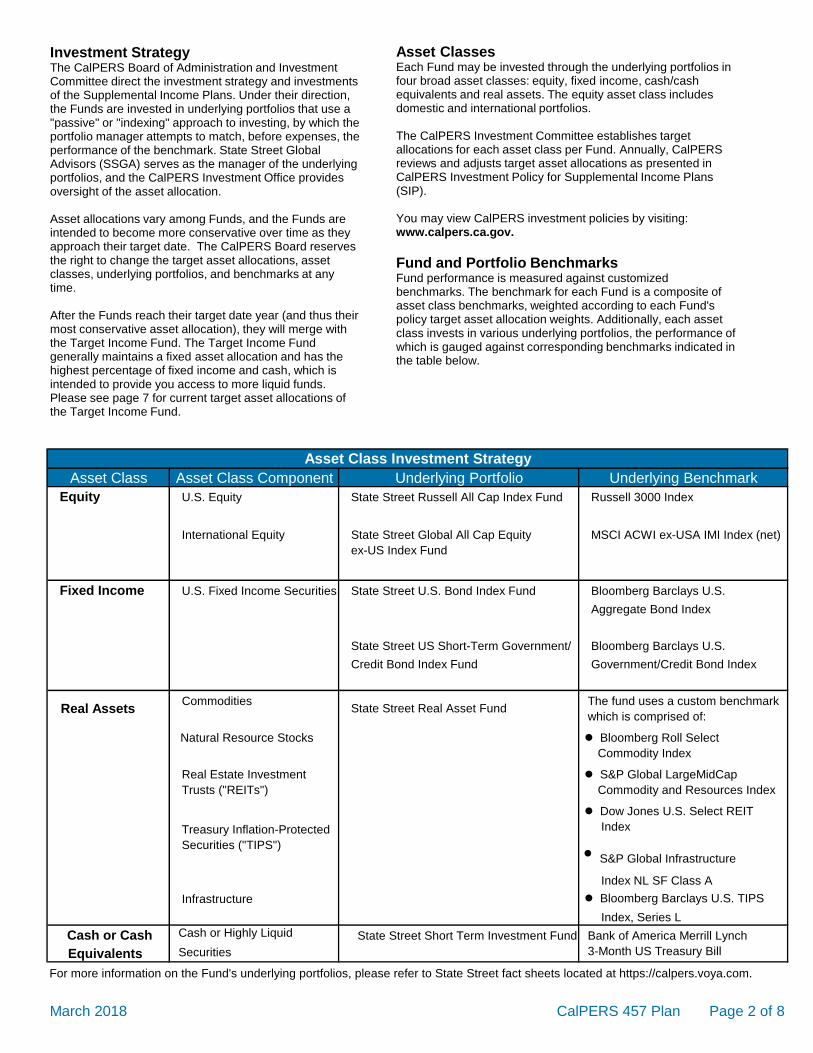
Equity U.S. Equity State Street Russell All Cap Index Fund Russell 3000 Index
International Equity State Street Global All Cap Equity MSCI ACWI ex-USA IMI Index (net)
ex-US Index Fund
Fixed Income State Street U.S. Bond Index Fund Bloomberg Barclays U.S.
Aggregate Bond Index
State Street US Short-Term Government/ Bloomberg Barclays U.S.
Credit Bond Index Fund Government/Credit Bond Index
Commodities
Natural Resource Stocks
Real Estate Investment
Treasury Inflation-Protected
• S&P Global Infrastructure
Index NL SF Class A
Infrastructure l Bloomberg Barclays U.S. TIPS
Index, Series L
Cash or Cash Cash or Highly Liquid
Equivalents
March 2018 CalPERS 457 Plan Page 2 of 8
Asset Class Investment Strategy
Asset Class Asset Class Component Underlying Portfolio Underlying Benchmark
U.S. Fixed Income Securities
Real Assets State Street Real Asset Fund The fund uses a custom benchmark
which is comprised of:
l Bloomberg Roll Select
Commodity Index
l S&P Global LargeMidCap
Commodity and Resources Index
l Dow Jones U.S. Select REIT
Trusts ("REITs")
Index
Securities ("TIPS")
State Street Short Term Investment Fund Bank of America Merrill Lynch
Securities 3-Month US Treasury Bill
For more information on the Fund's underlying portfolios, please refer to State Street fact sheets located at https://calpers.voya.com.
Investment StrategyThe CalPERS Board of Administration and Investment Committee direct the investment strategy and investments of the Supplemental Income Plans. Under their direction, the Funds are invested in underlying portfolios that use a "passive" or "indexing" approach to investing, by which the portfolio manager attempts to match, before expenses, the performance of the benchmark. State Street Global Advisors (SSGA) serves as the manager of the underlying portfolios, and the CalPERS Investment Office provides oversight of the asset allocation.
Asset allocations vary among Funds, and the Funds are intended to become more conservative over time as they approach their target date. The CalPERS Board reserves the right to change the target asset allocations, asset classes, underlying portfolios, and benchmarks at any time.
After the Funds reach their target date year (and thus their most conservative asset allocation), they will merge with the Target Income Fund. The Target Income Fund generally maintains a fixed asset allocation and has the highest percentage of fixed income and cash, which is intended to provide you access to more liquid funds. Please see page 7 for current target asset allocations of the Target Income Fund.
Asset ClassesEach Fund may be invested through the underlying portfolios in four broad asset classes: equity, fixed income, cash/cash equivalents and real assets. The equity asset class includes domestic and international portfolios.
The CalPERS Investment Committee establishes target allocations for each asset class per Fund. Annually, CalPERS reviews and adjusts target asset allocations as presented in CalPERS Investment Policy for Supplemental Income Plans (SIP).
You may view CalPERS investment policies by visiting: www.calpers.ca.gov.
Fund and Portfolio BenchmarksFund performance is measured against customizedbenchmarks. The benchmark for each Fund is a composite of asset class benchmarks, weighted according to each Fund's policy target asset allocation weights. Additionally, each asset class invests in various underlying portfolios, the performance of which is gauged against corresponding benchmarks indicated in the table below.
3 1 5 10
Months Year Years Years As a % Per $1000
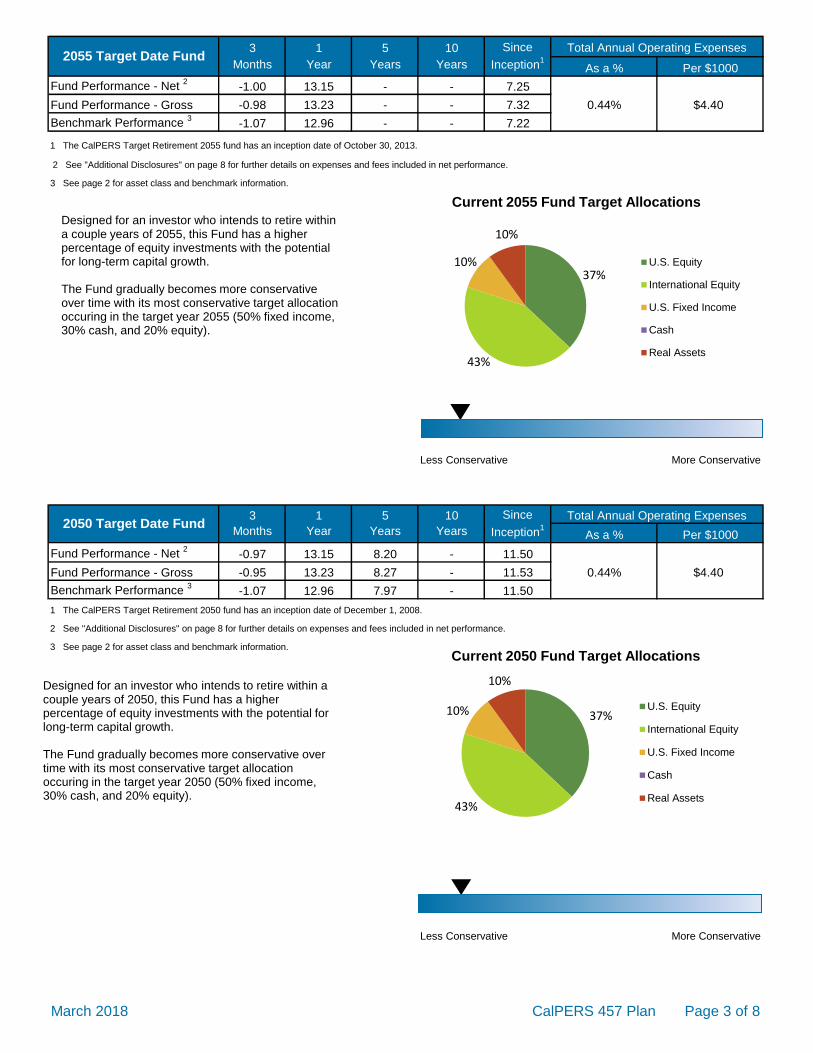
SKDU1Fund Performance - Net 2
-1.00 13.15 - - 7.25
Fund Performance - Gross -0.98 13.23 - - 7.32 0.44% $4.40
Benchmark Performance 3
-1.07 12.96 - - 7.22
1 The CalPERS Target Retirement 2055 fund has an inception date of October 30, 2013.
2 See "Additional Disclosures" on page 8 for further details on expenses and fees included in net performance.
3 See page 2 for asset class and benchmark information.
Less Conservative More Conservative
3 1 5 10
Months Year Years Years As a % Per $1000
SKF71Fund Performance - Net 2
-0.97 13.15 8.20 - 11.50
Fund Performance - Gross -0.95 13.23 8.27 - 11.53 0.44% $4.40
Benchmark Performance 3
-1.07 12.96 7.97 - 11.50
1 The CalPERS Target Retirement 2050 fund has an inception date of December 1, 2008.
2 See "Additional Disclosures" on page 8 for further details on expenses and fees included in net performance.
3 See page 2 for asset class and benchmark information.
Less Conservative More Conservative
CalPERS 457 Plan Page 2 of 8 March 2018 CalPERS 457 Plan Page 3 of 8
2055 Target Date FundSince
Inception1
Total Annual Operating Expenses
2050 Target Date FundSince
Inception1
Total Annual Operating Expenses
Designed for an investor who intends to retire within a couple years of 2055, this Fund has a higher percentage of equity investments with the potential for long-term capital growth.
The Fund gradually becomes more conservative over time with its most conservative target allocation occuring in the target year 2055 (50% fixed income, 30% cash, and 20% equity).
Designed for an investor who intends to retire within a couple years of 2050, this Fund has a higher percentage of equity investments with the potential for long-term capital growth.
The Fund gradually becomes more conservative over time with its most conservative target allocation occuring in the target year 2050 (50% fixed income, 30% cash, and 20% equity).
37%
43%
10%
10%
Current 2055 Fund Target Allocations
U.S. Equity
International Equity
U.S. Fixed Income
Cash
Real Assets
37%
43%
10%
10%
Current 2050 Fund Target Allocations
U.S. Equity
International Equity
U.S. Fixed Income
Cash
Real Assets
3 1 5 10
Months Year Years Years As a % Per $1000SK
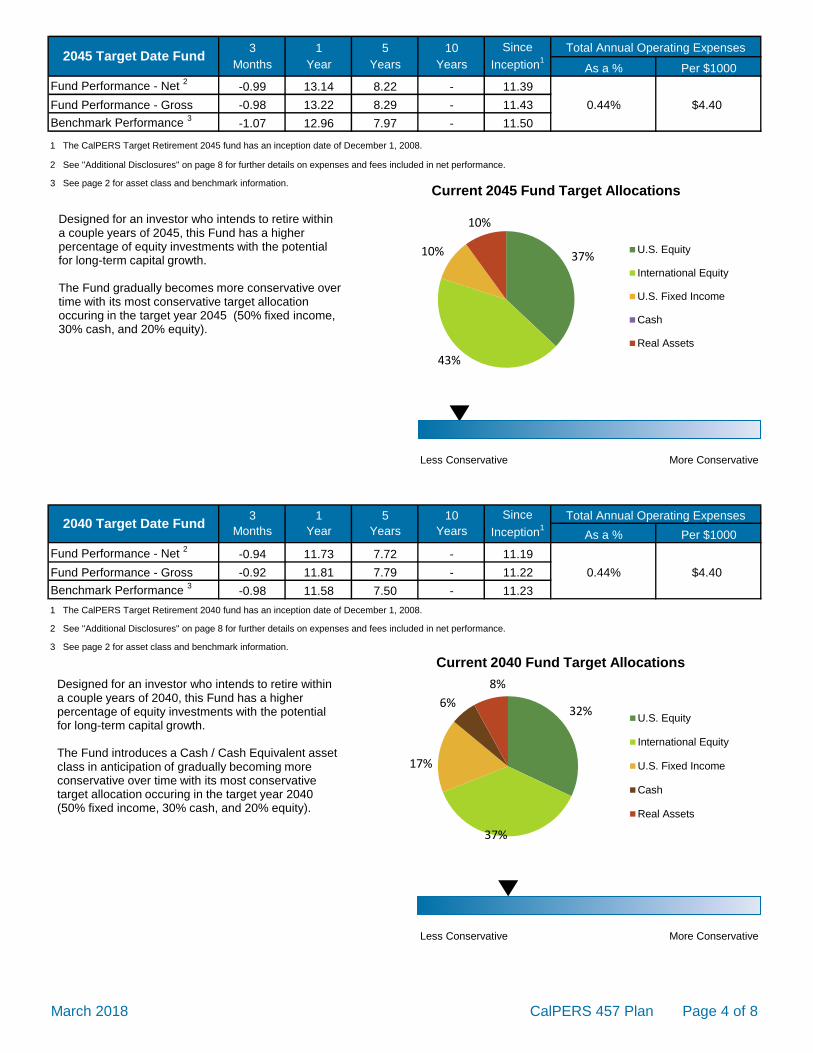
F6 Fund Performance - Net 2
-0.99 13.14 8.22 - 11.39
Fund Performance - Gross -0.98 13.22 8.29 - 11.43 0.44% $4.40
Benchmark Performance 3
-1.07 12.96 7.97 - 11.50
1 The CalPERS Target Retirement 2045 fund has an inception date of December 1, 2008.
2 See "Additional Disclosures" on page 8 for further details on expenses and fees included in net performance.
3 See page 2 for asset class and benchmark information.
Less Conservative More Conservative
3 1 5 10
Months Year Years Years As a % Per $1000
SKF51Fund Performance - Net 2
-0.94 11.73 7.72 - 11.19
Fund Performance - Gross -0.92 11.81 7.79 - 11.22 0.44% $4.40
Benchmark Performance 3
-0.98 11.58 7.50 - 11.23
1 The CalPERS Target Retirement 2040 fund has an inception date of December 1, 2008.
2 See "Additional Disclosures" on page 8 for further details on expenses and fees included in net performance.
3 See page 2 for asset class and benchmark information.
Less Conservative More Conservative
CalPERS 457 Plan Page 3 of 8 March 2018 CalPERS 457 Plan Page 4 of 8
2045 Target Date FundSince
Inception1
Total Annual Operating Expenses
2040 Target Date FundSince
Inception1
Total Annual Operating Expenses
Designed for an investor who intends to retire within a couple years of 2040, this Fund has a higher percentage of equity investments with the potential for long-term capital growth.
The Fund introduces a Cash / Cash Equivalent asset class in anticipation of gradually becoming more conservative over time with its most conservative target allocation occuring in the target year 2040 (50% fixed income, 30% cash, and 20% equity).
Designed for an investor who intends to retire withina couple years of 2045, this Fund has a higher percentage of equity investments with the potential for long-term capital growth.
The Fund gradually becomes more conservative over time with its most conservative target allocation occuring in the target year 2045 (50% fixed income, 30% cash, and 20% equity).
37%
43%
10%
10%
Current 2045 Fund Target Allocations
U.S. Equity
International Equity
U.S. Fixed Income
Cash
Real Assets
32%
37%
17%
6%
8%
Current 2040 Fund Target Allocations
U.S. Equity
International Equity
U.S. Fixed Income
Cash
Real Assets
3 1 5 10
Months Year Years Years As a % Per $1000SK
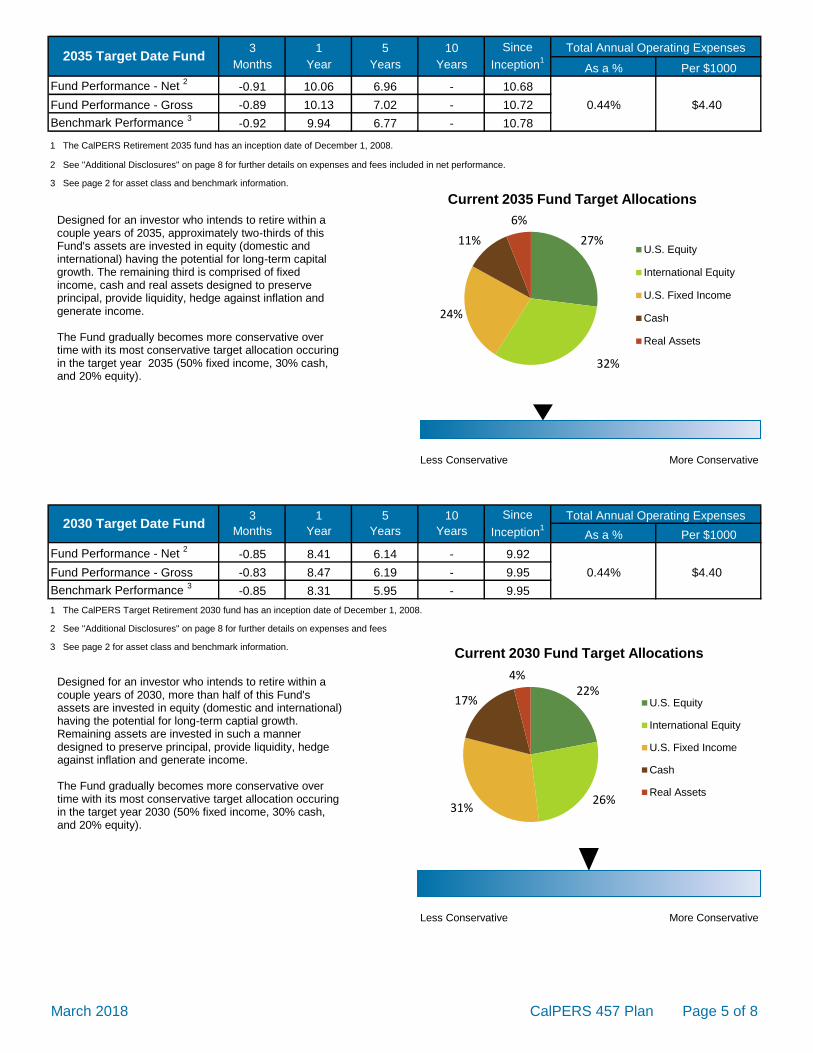
F4 Fund Performance - Net 2
-0.91 10.06 6.96 - 10.68
Fund Performance - Gross -0.89 10.13 7.02 - 10.72 0.44% $4.40
Benchmark Performance 3
-0.92 9.94 6.77 - 10.78
1 The CalPERS Retirement 2035 fund has an inception date of December 1, 2008.
2 See "Additional Disclosures" on page 8 for further details on expenses and fees included in net performance.
3 See page 2 for asset class and benchmark information.
Less Conservative More Conservative
3 1 5 10
Months Year Years Years As a % Per $1000
SKF31Fund Performance - Net 2
-0.85 8.41 6.14 - 9.92
Fund Performance - Gross -0.83 8.47 6.19 - 9.95 0.44% $4.40
Benchmark Performance 3
-0.85 8.31 5.95 - 9.95
1 The CalPERS Target Retirement 2030 fund has an inception date of December 1, 2008.
2 See "Additional Disclosures" on page 8 for further details on expenses and fees included in net performance.
3 See page 2 for asset class and benchmark information.
Less Conservative More Conservative
CalPERS 457 Plan Page 4 of 8 March 2018 CalPERS 457 Plan Page 5 of 8
2035 Target Date FundSince
Inception1
Total Annual Operating Expenses
2030 Target Date FundSince
Inception1
Total Annual Operating Expenses
Designed for an investor who intends to retire within a couple years of 2030, more than half of this Fund's assets are invested in equity (domestic and international) having the potential for long-term captial growth. Remaining assets are invested in such a manner designed to preserve principal, provide liquidity, hedge against inflation and generate income.
The Fund gradually becomes more conservative over time with its most conservative target allocation occuring in the target year 2030 (50% fixed income, 30% cash, and 20% equity).
Designed for an investor who intends to retire within a couple years of 2035, approximately two-thirds of this Fund's assets are invested in equity (domestic and international) having the potential for long-term capital growth. The remaining third is comprised of fixed income, cash and real assets designed to preserve principal, provide liquidity, hedge against inflation and generate income.
The Fund gradually becomes more conservative over time with its most conservative target allocation occuring in the target year 2035 (50% fixed income, 30% cash, and 20% equity).
27%
32%
24%
11%
6%
Current 2035 Fund Target Allocations
U.S. Equity
International Equity
U.S. Fixed Income
Cash
Real Assets
22%
26%31%
17%
4%
Current 2030 Fund Target Allocations
U.S. Equity
International Equity
U.S. Fixed Income
Cash
Real Assets
3 1 5 10
Months Year Years Years As a % Per $1000SK
F2 Fund Performance - Net 2
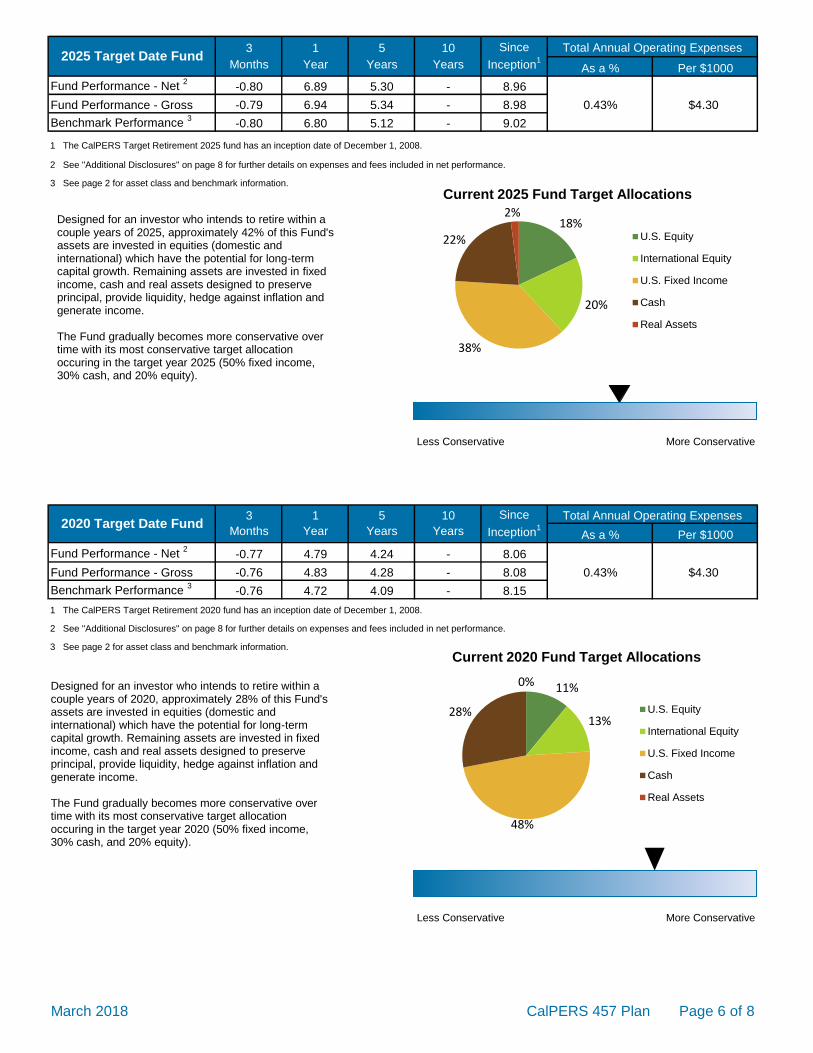
-0.80 6.89 5.30 - 8.96
Fund Performance - Gross -0.79 6.94 5.34 - 8.98 0.43% $4.30
Benchmark Performance 3
-0.80 6.80 5.12 - 9.02
1 The CalPERS Target Retirement 2025 fund has an inception date of December 1, 2008.
2 See "Additional Disclosures" on page 8 for further details on expenses and fees included in net performance.
3 See page 2 for asset class and benchmark information.
Less Conservative More Conservative
3 1 5 10
Months Year Years Years As a % Per $1000
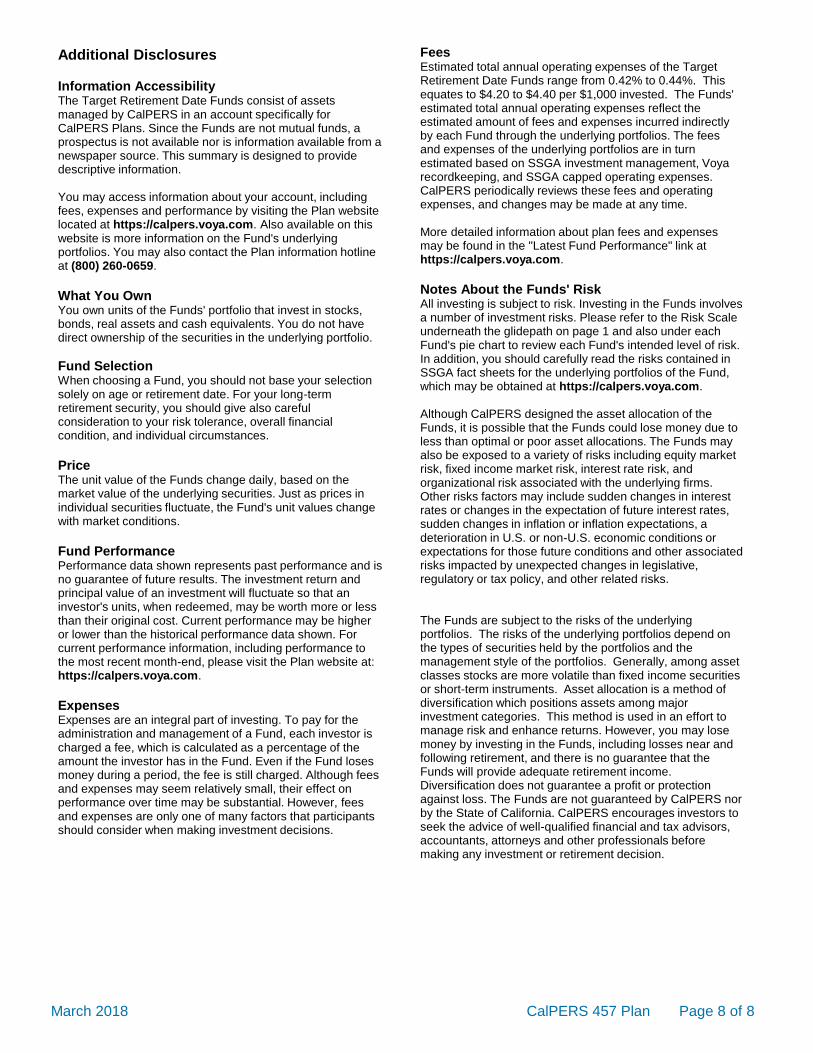
SKF11Fund Performance - Net 2
-0.77 4.79 4.24 - 8.06
Fund Performance - Gross -0.76 4.83 4.28 - 8.08 0.43% $4.30
Benchmark Performance 3
-0.76 4.72 4.09 - 8.15
1 The CalPERS Target Retirement 2020 fund has an inception date of December 1, 2008.
2 See "Additional Disclosures" on page 8 for further details on expenses and fees included in net performance.
3 See page 2 for asset class and benchmark information.
Less Conservative More Conservative
CalPERS 457 Plan Page 5 of 8 March 2018 CalPERS 457 Plan Page 6 of 8
2025 Target Date FundSince
Inception1
Total Annual Operating Expenses
2020 Target Date FundSince
Inception1
Total Annual Operating Expenses
Designed for an investor who intends to retire within a couple years of 2020, approximately 28% of this Fund's assets are invested in equities (domestic and international) which have the potential for long-term capital growth. Remaining assets are invested in fixed income, cash and real assets designed to preserve principal, provide liquidity, hedge against inflation and generate income.
The Fund gradually becomes more conservative over time with its most conservative target allocation occuring in the target year 2020 (50% fixed income, 30% cash, and 20% equity).
Designed for an investor who intends to retire within a couple years of 2025, approximately 42% of this Fund's assets are invested in equities (domestic and international) which have the potential for long-term capital growth. Remaining assets are invested in fixed income, cash and real assets designed to preserve principal, provide liquidity, hedge against inflation and generate income.
The Fund gradually becomes more conservative over time with its most conservative target allocation occuring in the target year 2025 (50% fixed income, 30% cash, and 20% equity).
18%
20%
38%
22%
2%
Current 2025 Fund Target Allocations
U.S. Equity
International Equity
U.S. Fixed Income
Cash
Real Assets
11%
13%
48%
28%
0%
Current 2020 Fund Target Allocations
U.S. Equity
International Equity
U.S. Fixed Income
Cash
Real Assets

3 1 5 10
Months Year Years Years As a % Per $1000SK
EZ Fund Performance - Net 2
-0.75 4.05 3.61 - 7.36
Fund Performance - Gross -0.75 4.08 3.64 - 7.37 0.42% $4.20
Benchmark Performance 3
-0.76 3.98 3.48 - 7.50
1 The CalPERS Target Retirement 2015 fund has an inception date of December 1, 2008.
2 See "Additional Disclosures" on page 8 for further details on expenses and fees included in net performance.
3 See page 2 for asset class and benchmark information.
Less Conservative More Conservative
3 1 5 10
Months Year Years Years As a % Per $1000
SKEW1Fund Performance - Net 2
-0.76 4.05 3.19 - 5.91
Fund Performance - Gross -0.75 4.08 3.21 - 5.92 0.42% $4.20
Benchmark Performance 3
-0.76 3.98 3.04 - 6.04
1 The CalPERS Target Income Fund has an inception date of December 1, 2008.
2 See "Additional Disclosures" on page 8 for further details on expenses and fees included in net performance.
3 See page 2 for asset class and benchmark information.
Less Conservative More Conservative
CalPERS 457 Plan Page 6 of 8 March 2018 CalPERS 457 Plan Page 7 of 8
2015 Target Date FundSince
Inception1
Total Annual Operating Expenses
Target Income FundSince
Inception1
Total Annual Operating Expenses
Designed for an investor who intends to retire within a couple years of 2015, approximately 80% of this Fund's assets are conservatively invested in fixed income and cash designed to preserve principal, provide liquidity, hedge against inflation and generate income. Approximately 20% of the Fund's assets are invested in equities (domestic and international) which have the potential for capital appreciation.
The Fund gradually becomes more conservative over time with its most conservative target allocation occuring in the target year 2015 (50% fixed income, 30% cash, and 20% equity).
Designed for an investor who has retired or has a very low risk tolerance. It is made up of primarily cash (or cash equivalents) and fixed income securities, with a smaller percentage of domestic and international equity for additional growth potential.
9%
11%
50%
30%
Current 2015 Fund Target Allocations
U.S. Equity
International Equity
U.S. Fixed Income
Cash
Real Assets
9%
11%
50%
30%
Current Income Fund Target Allocations
U.S. Equity
International Equity
U.S. Fixed Income
Cash
Real Assets
March 2018 CalPERS 457 Plan Page 8 of 8
Additional Disclosures
Information AccessibilityThe Target Retirement Date Funds consist of assets managed by CalPERS in an account specifically for CalPERS Plans. Since the Funds are not mutual funds, a prospectus is not available nor is information available from a newspaper source. This summary is designed to provide descriptive information.
You may access information about your account, including fees, expenses and performance by visiting the Plan website located at https://calpers.voya.com. Also available on this website is more information on the Fund's underlying portfolios. You may also contact the Plan information hotline at (800) 260-0659.
What You OwnYou own units of the Funds' portfolio that invest in stocks, bonds, real assets and cash equivalents. You do not have direct ownership of the securities in the underlying portfolio.
Fund SelectionWhen choosing a Fund, you should not base your selection solely on age or retirement date. For your long-term retirement security, you should give also careful consideration to your risk tolerance, overall financial condition, and individual circumstances.
PriceThe unit value of the Funds change daily, based on the market value of the underlying securities. Just as prices in individual securities fluctuate, the Fund's unit values change with market conditions.
Fund PerformancePerformance data shown represents past performance and is no guarantee of future results. The investment return and principal value of an investment will fluctuate so that an investor's units, when redeemed, may be worth more or less than their original cost. Current performance may be higher or lower than the historical performance data shown. For current performance information, including performance to the most recent month-end, please visit the Plan website at: https://calpers.voya.com.
ExpensesExpenses are an integral part of investing. To pay for the administration and management of a Fund, each investor is charged a fee, which is calculated as a percentage of the amount the investor has in the Fund. Even if the Fund loses money during a period, the fee is still charged. Although fees and expenses may seem relatively small, their effect on performance over time may be substantial. However, fees and expenses are only one of many factors that participants should consider when making investment decisions.
FeesEstimated total annual operating expenses of the Target Retirement Date Funds range from 0.42% to 0.44%. This equates to $4.20 to $4.40 per $1,000 invested. The Funds' estimated total annual operating expenses reflect the estimated amount of fees and expenses incurred indirectly by each Fund through the underlying portfolios. The fees and expenses of the underlying portfolios are in turn estimated based on SSGA investment management, Voya recordkeeping, and SSGA capped operating expenses. CalPERS periodically reviews these fees and operating expenses, and changes may be made at any time.
More detailed information about plan fees and expenses may be found in the "Latest Fund Performance" link athttps://calpers.voya.com.
Notes About the Funds' RiskAll investing is subject to risk. Investing in the Funds involves a number of investment risks. Please refer to the Risk Scale underneath the glidepath on page 1 and also under each Fund's pie chart to review each Fund's intended level of risk. In addition, you should carefully read the risks contained in SSGA fact sheets for the underlying portfolios of the Fund, which may be obtained at https://calpers.voya.com.
Although CalPERS designed the asset allocation of the Funds, it is possible that the Funds could lose money due to less than optimal or poor asset allocations. The Funds may also be exposed to a variety of risks including equity market risk, fixed income market risk, interest rate risk, and organizational risk associated with the underlying firms. Other risks factors may include sudden changes in interest rates or changes in the expectation of future interest rates, sudden changes in inflation or inflation expectations, a deterioration in U.S. or non-U.S. economic conditions or expectations for those future conditions and other associated risks impacted by unexpected changes in legislative, regulatory or tax policy, and other related risks.
The Funds are subject to the risks of the underlying portfolios. The risks of the underlying portfolios depend on the types of securities held by the portfolios and the management style of the portfolios. Generally, among asset classes stocks are more volatile than fixed income securities or short-term instruments. Asset allocation is a method of diversification which positions assets among major investment categories. This method is used in an effort to manage risk and enhance returns. However, you may lose money by investing in the Funds, including losses near and following retirement, and there is no guarantee that the Funds will provide adequate retirement income. Diversification does not guarantee a profit or protection against loss. The Funds are not guaranteed by CalPERS nor by the State of California. CalPERS encourages investors to seek the advice of well-qualified financial and tax advisors, accountants, attorneys and other professionals before making any investment or retirement decision.
The Fund is a collective investment trust and is not FDIC insured, nor is it an obligation or deposit of, or guaranteed by State Street Corporation, SSGA or its affiliates.Please see the Fee Disclosure section on the last page for a complete disclosure of the Fund's total operating expense ratio.The MSCI ACWI ex USA IMI is a free float-adjusted market capitalization weighted index that is designed to measure the equity market performance of developed and emerging markets. The Index consists of approximately 6,100 stocks in selected markets with emerging markets representing approximately 20%. MSCI attempts to capture approximately 99% of the total market capitalizations in each country. The MSCI ACWI ex USA IMI is a trademark of MSCI Inc.This fact sheet provides summary information about the Fund and is provided by the CalPERS Supplemental Income 457 Plan. It should be read in conjunction with the Fund's applicable Strategy Disclosure Document, which is available upon request. The Disclosure Document contains important information about the Fund, including a description of a number of risks associated with investing in the Fund.
The Fund seeks to offer broad, low cost exposure to stocks of companies ranging from small to large cap in developed and emerging countries excluding the United States.
Investment ObjectiveThe Fund seeks an investment return that approximates as closely as practicable, before expenses, the performance of the MSCI ACWI ex USA IMI (the "Index") over the long term.
Investment StrategyThe Fund is managed using a "passive" or "indexing" investment approach, by which SSGA attempts to match, before expenses, the performance of the Index. SSGA will typically attempt to invest in the equity securities comprising the Index, in approximately the same proportions as they are represented in the Index. Equity securities may include common stocks, preferred stocks, depository receipts, or other securities convertible into common stock. Equity securities held by the Fund may be denominated in foreign currencies and may be held outside the United States. In some cases, it may not be possible or practicable to purchase all of the securities comprising the Index, or to hold them in the same weightings as they represent in the Index. In those circumstances, SSGA may employ a sampling or optimization technique to construct the portfolio in question.
From time to time securities are added to or removed from the Index. SSGA may sell securities that are represented in the Index, or purchase securities that are not yet represented in the Index, prior to or after their removal or addition to the Index. SSGA may also utilize other pooled investment vehicles, including those managed by SSGA and its affiliates, as substitutes for gaining direct exposure to securities or a group of securities in the Index.
The Fund may at times purchase or sell index futures contracts, or options on those futures, or engage in other transactions involving the use of derivatives, in lieu of investment directly in the securities making up the Index or to enhance the Fund's replication of the Index return. The Fund's return may not match the return of the Index.
SSGA may implement the Fund's asset allocations through investments in passive investment vehicles, which typically attempt to replicate the returns of a specific index or group of indices. These will typically include investment pools (which may, but will not necessarily, be registered under the U.S. Investment Company Act of 1940, as amended) managed or sponsored by SSGA or an affiliate. Because of the unit issuance processes employed by the various underlying investment pools, allocations by the Fund to certain pools on a given trading day may be invested in such pools at the next trading day's net asset value per unit. This will result in the portion of the Fund's assets being invested in such investment pools being held in cash for the trading day and may result in increased active risk. This could adversely impact the return to any investor.
State Street Global All Cap Equity ex-U.S. Index Fund Class I (the "Fund") represents units of ownership in the State Street Global All Cap Equity ex-U.S. Index Securities Lending Series Fund.
Performance
Total Returns Fund Benchmark
1 Month -0.82% -1.67%Q1 2018 -0.90% -1.06%YTD -0.90% -1.06%1 Year 17.14% 17.10%3 Year 6.65% 6.75%5 Year 5.99% 6.24%7 Year 4.31% 4.52%10 Year N/A N/ASince Inception (4/30/2010) 5.56% 5.80%Best Year Since Inception (2012) 17.70% 17.04%Worst Year Since Inception (2011) -14.39% -14.31%
The model returns are provided net of the Fund’s expenses (described on the last page under the fee disclosure section of the fact sheet) and then further adjusted to reflect the deduction of the plan level expenses, which may include, among others, investment management, recordkeeping, account administration, account manager, administrative, investment services and contingency reserve fees, of 0.46% (as specified by the CalPERS Supplemental Income 457 Plan). All returns greater than 1 year are annualized. Performance shown represents past performance. Past performance is not a guarantee of future results. Current performance may be lower or higher than the performance shown above. Index returns are unmanaged and do not reflect the deduction of any fees or expenses. Index returns reflect all items of income, gain and loss and the reinvestment of dividends and other income.
The performance figures listed above do not take into account the mark-to-market unit value of the securities lending cash collateral pool held by the Fund. If the Fund marked-to-market units in the securities lending cash collateral pool, performance may be lower. Please see the last page for additional information about securities lending.
Growth of $10,000
'11 '12 '13 '14 '15 '16 '17 '18$0
$2,000
$4,000
$6,000
$8,000
$10,000
$12,000
$14,000
$16,000
$18,000 $17,371
The hypothetical $10,000 investment chart is plotted quarterly, and includes reinvestment of dividends and capital gains. There is no direct correlation between a hypothetical investment and the anticipated performance of the Fund.
Key Facts y The Fund is passively managed y The Fund may use futures and other derivatives y The Fund may lend its portfolio and enter into repurchase agreements
(See applicable governing documents for a Portfolio’s authority to lend. Participation in a securities lending program may adversely affect the investment returns and risk profile of the Portfolio)
y The Fund may invest in other investment pools, including those managed by SSGA and its affiliates
y The Fund is not leveraged y The Fund will not sell securities short
State Street Global All Cap Equity ex-U.S. Index Fund - Class I31 March 2018
CalPERS Supplemental Income 457 Plan
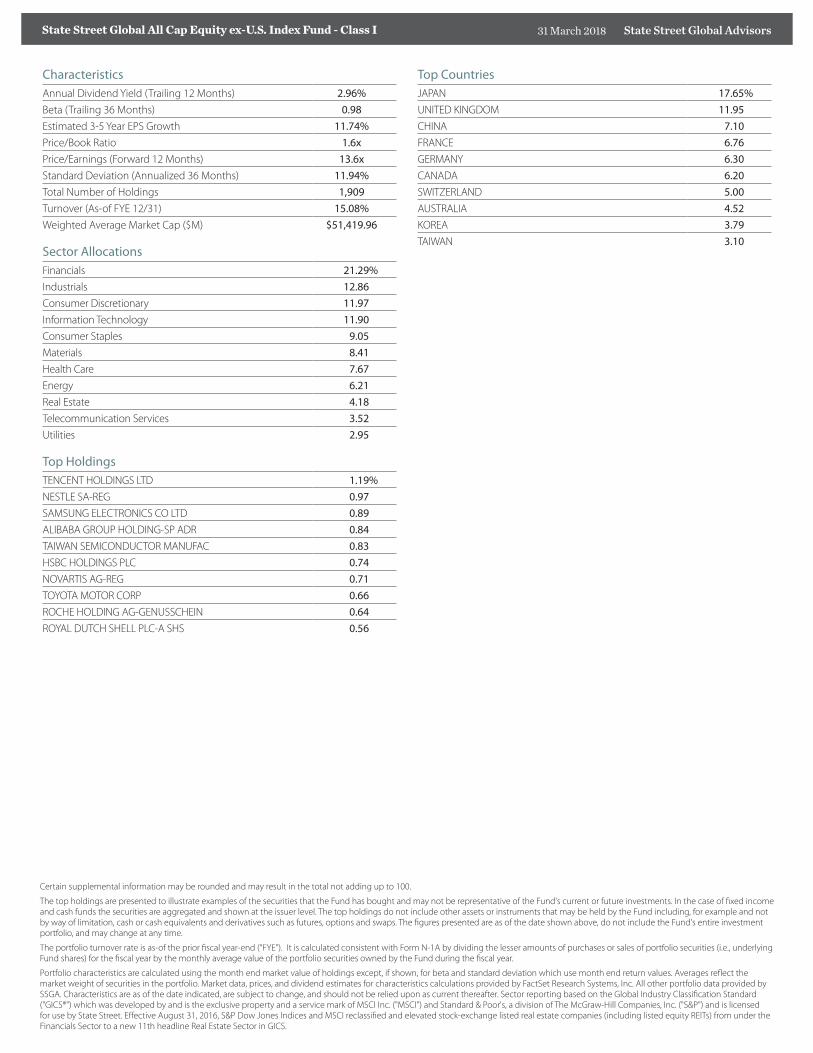
CharacteristicsAnnual Dividend Yield (Trailing 12 Months) 2.96%Beta (Trailing 36 Months) 0.98Estimated 3-5 Year EPS Growth 11.74%Price/Book Ratio 1.6xPrice/Earnings (Forward 12 Months) 13.6xStandard Deviation (Annualized 36 Months) 11.94%Total Number of Holdings 1,909Turnover (As-of FYE 12/31) 15.08%Weighted Average Market Cap ($M) $51,419.96
Sector AllocationsFinancials 21.29%Industrials 12.86Consumer Discretionary 11.97Information Technology 11.90Consumer Staples 9.05Materials 8.41Health Care 7.67Energy 6.21Real Estate 4.18Telecommunication Services 3.52Utilities 2.95
Top HoldingsTENCENT HOLDINGS LTD 1.19%NESTLE SA-REG 0.97SAMSUNG ELECTRONICS CO LTD 0.89ALIBABA GROUP HOLDING-SP ADR 0.84TAIWAN SEMICONDUCTOR MANUFAC 0.83HSBC HOLDINGS PLC 0.74NOVARTIS AG-REG 0.71TOYOTA MOTOR CORP 0.66ROCHE HOLDING AG-GENUSSCHEIN 0.64ROYAL DUTCH SHELL PLC-A SHS 0.56
Certain supplemental information may be rounded and may result in the total not adding up to 100.
The top holdings are presented to illustrate examples of the securities that the Fund has bought and may not be representative of the Fund's current or future investments. In the case of fixed income and cash funds the securities are aggregated and shown at the issuer level. The top holdings do not include other assets or instruments that may be held by the Fund including, for example and not by way of limitation, cash or cash equivalents and derivatives such as futures, options and swaps. The figures presented are as of the date shown above, do not include the Fund's entire investment portfolio, and may change at any time.
The portfolio turnover rate is as-of the prior fiscal year-end (“FYE”). It is calculated consistent with Form N-1A by dividing the lesser amounts of purchases or sales of portfolio securities (i.e., underlying Fund shares) for the fiscal year by the monthly average value of the portfolio securities owned by the Fund during the fiscal year.
Portfolio characteristics are calculated using the month end market value of holdings except, if shown, for beta and standard deviation which use month end return values. Averages reflect the market weight of securities in the portfolio. Market data, prices, and dividend estimates for characteristics calculations provided by FactSet Research Systems, Inc. All other portfolio data provided by SSGA. Characteristics are as of the date indicated, are subject to change, and should not be relied upon as current thereafter. Sector reporting based on the Global Industry Classification Standard ("GICS®") which was developed by and is the exclusive property and a service mark of MSCI Inc. ("MSCI") and Standard & Poor's, a division of The McGraw-Hill Companies, Inc. ("S&P") and is licensed for use by State Street. Effective August 31, 2016, S&P Dow Jones Indices and MSCI reclassified and elevated stock-exchange listed real estate companies (including listed equity REITs) from under the Financials Sector to a new 11th headline Real Estate Sector in GICS.
Top CountriesJAPAN 17.65%UNITED KINGDOM 11.95CHINA 7.10FRANCE 6.76GERMANY 6.30CANADA 6.20SWITZERLAND 5.00AUSTRALIA 4.52KOREA 3.79TAIWAN 3.10
State Street Global AdvisorsState Street Global All Cap Equity ex-U.S. Index Fund - Class I 31 March 2018
State Street Global AdvisorsState Street Global All Cap Equity ex-U.S. Index Fund - Class I 31 March 2018
Important Message About RiskThis section explains some of the general risks involved with investing in the Fund, including possible loss of principal. Generally, among asset classes, stocks are more volatile than bonds or short-term instruments. Stock values fluctuate in response to the activities of individual companies and general market and economic conditions and at times the risk level of the Fund may be greater than that of the U.S. stock market in general. In addition, the Fund may use derivative instruments which may involve additional risks such as potential illiquidity of the markets, credit risk, currency risk, leverage risk and counterparty risk.
This section does not purport to be a complete explanation; rather, an investment in the Fund is subject to a number of other risks, which are described in more detail in the Fund's Strategy Disclosure Document. Carefully review the complete description of the risks prior to investing in the Fund.
Further, there can be no guarantee that the Investment Objective of the Fund will be met. Risk management does not promise any level of performance or guarantee against loss of principal. SSGA encourages investors to seek the advice of well-qualified financial and tax advisors, accountants, attorneys and other professionals before making any investment or retirement decision.
Risk ManagementSSGA monitors the overall risk of the Fund, in order to avoid unintended risk relative to the Index. SSGA manages portfolio characteristics and transaction costs in a manner intended to provide a return as close as practicable to the benchmark return.
Fee DisclosureThe Fund seeks to achieve its investment objective by making direct investments in securities or by making investments in other investment funds, including those managed by SSGA and its affiliates ("SSGA Funds"). The Fund indirectly bears a proportional share of the fees and expenses of the SSGA Funds in which the Fund invests ("Indirect Expenses") which may include, among others, administration, investment management, audit, index and legal fees. Additionally, the Fund incurs direct fees and expenses ("Direct Expenses") which may include, among others, administration, audit, index, service and legal fees. The Indirect Expenses combined with the Direct Expenses of the Fund (the "Total Annual Operating Expense Ratio" (TAOER)) will equal .025% annually. The investment management fee for the Fund is assessed outside the Fund. A portion, which may vary, may be paid to third-parties or intermediaries for recordkeeping, asset servicing, sub-accounting and communication services to plans invested in the Fund. It is not included as part of the TAOER of the Fund.
You should contact your Plan Administrator for a complete description of the fees and expenses applicable to the Fund, including both the Fund’s expenses and plan-level expenses, including the investment management fee.
The TAOER of .025% reflects all indirect and direct fees and expenses associated with the Fund. Transaction costs (including, for example, brokerage costs and taxes, if any) are not reflected in the TAOER but are reflected in the net performance returns of the Fund. The investment manager does not assess or charge any fee in connection with the purchase or redemption of units of the Fund. To the extent the Fund invests in one or more Collective Funds, the Fund itself may incur such Transaction Charges as a result of such investment, which will be reflected in the Fund's net asset value.
The following example is intended to help illustrate the impact of fees and expenses associated with an investment in the Fund (based upon the Fund’s expenses of .025% and plan-level expenses of .46%, as specified by CalPERS Supplemental Income 457 Plan). It is intended to illustrate the hypothetical expense that you would incur over various time periods if you were to invest $10,000 in the Fund. This example assumes that the Fund provides a hypothetical return of 5% a year and that operating expenses of the Fund and the plan-level expenses remain the same. The results apply whether or not you redeem your investment at the end of the given time period.
Example Fees: 1 year - $49.59; 3 years - $155.60; 5 years - $271.40; 10 years - $609.86
The example outlined above was for illustrative purposes only and does not represent the actual fees and expenses or the actual past or future performance of the Fund. Actual future fees and expenses and actual future performance may be higher or lower than those shown.
Fees and expenses are only one of several factors that participants and beneficiaries should consider when making investment decisions.
State Street assumes no liability in connection with the accuracy or completeness of the plan-level expense information provided by CalPERS Supplemental Income 457 Plan or any performance information to the extent it is based on such plan-level expense information.
Expiration Date: 08/29/2018
Securities LendingThe Fund may participate in an agency securities lending program (the "Lending Program") sponsored by State Street Bank and Trust Company ("State Street") for the purpose of lending the Fund's securities and investing the collateral in a collateral reinvestment fund (each a "Collateral Pool"). None of the Collateral Pools are FDIC-insured bank deposits or otherwise guaranteed by SSGA or State Street or any of their respective affiliates. Investors may lose money by participating in the Lending Program and through investments in a Collateral Pool. For more information, including the risks associated with participating in the Lending Program you should review the SSGA Securities Lending Program Disclosure and the disclosure document and fact sheet for the relevant Collateral Pool.
Additional InformationFor more information on plan expenses and current performance information, including performance to the most recent month-end, please visit the Plan website at: https://calpers.voya.com. You may also contact CalPERS at (800) 260-0659.
About SSGAThe Fund is managed by State Street Global Advisors Trust Company, a wholly owned subsidiary of State Street Bank and Trust Company, and a global leader in providing investment management solutions to clients worldwide. To learn more about SSGA, visit our web site at www.ssga.com.
State Street Real Asset Fund - Class A
31 March 2018
CalPERS Supplemental Income 457 Plan
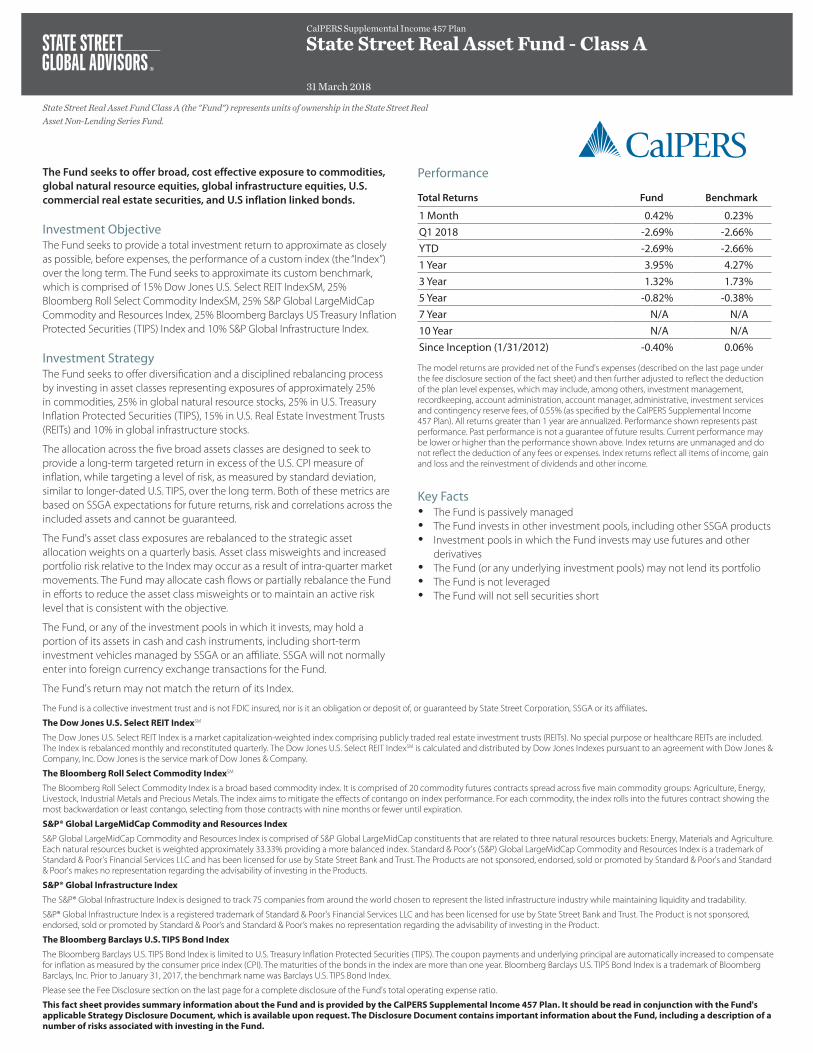
The Fund seeks to offer broad, cost effective exposure to commodities, global natural resource equities, global infrastructure equities, U.S. commercial real estate securities, and U.S inflation linked bonds.
Investment ObjectiveThe Fund seeks to provide a total investment return to approximate as closely as possible, before expenses, the performance of a custom index (the “Index”) over the long term. The Fund seeks to approximate its custom benchmark, which is comprised of 15% Dow Jones U.S. Select REIT IndexSM, 25% Bloomberg Roll Select Commodity IndexSM, 25% S&P Global LargeMidCap Commodity and Resources Index, 25% Bloomberg Barclays US Treasury Inflation Protected Securities (TIPS) Index and 10% S&P Global Infrastructure Index.
Investment StrategyThe Fund seeks to offer diversification and a disciplined rebalancing process by investing in asset classes representing exposures of approximately 25% in commodities, 25% in global natural resource stocks, 25% in U.S. Treasury Inflation Protected Securities (TIPS), 15% in U.S. Real Estate Investment Trusts (REITs) and 10% in global infrastructure stocks.
The allocation across the five broad assets classes are designed to seek to provide a long-term targeted return in excess of the U.S. CPI measure of inflation, while targeting a level of risk, as measured by standard deviation, similar to longer-dated U.S. TIPS, over the long term. Both of these metrics are based on SSGA expectations for future returns, risk and correlations across the included assets and cannot be guaranteed.
The Fund's asset class exposures are rebalanced to the strategic asset allocation weights on a quarterly basis. Asset class misweights and increased portfolio risk relative to the Index may occur as a result of intra-quarter market movements. The Fund may allocate cash flows or partially rebalance the Fund in efforts to reduce the asset class misweights or to maintain an active risk level that is consistent with the objective.
The Fund, or any of the investment pools in which it invests, may hold a portion of its assets in cash and cash instruments, including short-term investment vehicles managed by SSGA or an affiliate. SSGA will not normally enter into foreign currency exchange transactions for the Fund.
The Fund's return may not match the return of its Index.
State Street Real Asset Fund Class A (the "Fund") represents units of ownership in the State Street Real Asset Non-Lending Series Fund.
Performance
Total Returns Fund Benchmark
1 Month 0.42% 0.23%Q1 2018 -2.69% -2.66%YTD -2.69% -2.66%1 Year 3.95% 4.27%3 Year 1.32% 1.73%5 Year -0.82% -0.38%7 Year N/A N/A 10 Year N/A N/ASince Inception (1/31/2012) -0.40% 0.06%
The model returns are provided net of the Fund's expenses (described on the last page under the fee disclosure section of the fact sheet) and then further adjusted to reflect the deduction of the plan level expenses, which may include, among others, investment management, recordkeeping, account administration, account manager, administrative, investment services and contingency reserve fees, of 0.55% (as specified by the CalPERS Supplemental Income 457 Plan). All returns greater than 1 year are annualized. Performance shown represents past performance. Past performance is not a guarantee of future results. Current performance may be lower or higher than the performance shown above. Index returns are unmanaged and do not reflect the deduction of any fees or expenses. Index returns reflect all items of income, gain and loss and the reinvestment of dividends and other income.
Key Facts y The Fund is passively managed y The Fund invests in other investment pools, including other SSGA products y Investment pools in which the Fund invests may use futures and other
derivatives y The Fund (or any underlying investment pools) may not lend its portfolio y The Fund is not leveraged y The Fund will not sell securities short
The Fund is a collective investment trust and is not FDIC insured, nor is it an obligation or deposit of, or guaranteed by State Street Corporation, SSGA or its affiliates.
The Dow Jones U.S. Select REIT IndexSM
The Dow Jones U.S. Select REIT Index is a market capitalization-weighted index comprising publicly traded real estate investment trusts (REITs). No special purpose or healthcare REITs are included.The Index is rebalanced monthly and reconstituted quarterly. The Dow Jones U.S. Select REIT IndexSM is calculated and distributed by Dow Jones Indexes pursuant to an agreement with Dow Jones & Company, Inc. Dow Jones is the service mark of Dow Jones & Company.
The Bloomberg Roll Select Commodity IndexSM
The Bloomberg Roll Select Commodity Index is a broad based commodity index. It is comprised of 20 commodity futures contracts spread across five main commodity groups: Agriculture, Energy, Livestock, Industrial Metals and Precious Metals. The index aims to mitigate the effects of contango on index performance. For each commodity, the index rolls into the futures contract showing the most backwardation or least contango, selecting from those contracts with nine months or fewer until expiration.
S&P® Global LargeMidCap Commodity and Resources Index
S&P Global LargeMidCap Commodity and Resources Index is comprised of S&P Global LargeMidCap constituents that are related to three natural resources buckets: Energy, Materials and Agriculture. Each natural resources bucket is weighted approximately 33.33% providing a more balanced index. Standard & Poor's (S&P) Global LargeMidCap Commodity and Resources Index is a trademark of Standard & Poor's Financial Services LLC and has been licensed for use by State Street Bank and Trust. The Products are not sponsored, endorsed, sold or promoted by Standard & Poor's and Standard & Poor's makes no representation regarding the advisability of investing in the Products.
S&P® Global Infrastructure Index
The S&P® Global Infrastructure Index is designed to track 75 companies from around the world chosen to represent the listed infrastructure industry while maintaining liquidity and tradability.
S&P® Global Infrastructure Index is a registered trademark of Standard & Poor's Financial Services LLC and has been licensed for use by State Street Bank and Trust. The Product is not sponsored, endorsed, sold or promoted by Standard & Poor’s and Standard & Poor’s makes no representation regarding the advisability of investing in the Product.
The Bloomberg Barclays U.S. TIPS Bond Index
The Bloomberg Barclays U.S. TIPS Bond Index is limited to U.S. Treasury Inflation Protected Securities (TIPS). The coupon payments and underlying principal are automatically increased to compensate for inflation as measured by the consumer price index (CPI). The maturities of the bonds in the index are more than one year. Bloomberg Barclays U.S. TIPS Bond Index is a trademark of Bloomberg Barclays, Inc. Prior to January 31, 2017, the benchmark name was Barclays U.S. TIPS Bond Index.
Please see the Fee Disclosure section on the last page for a complete disclosure of the Fund's total operating expense ratio.
This fact sheet provides summary information about the Fund and is provided by the CalPERS Supplemental Income 457 Plan. It should be read in conjunction with the Fund's applicable Strategy Disclosure Document, which is available upon request. The Disclosure Document contains important information about the Fund, including a description of a number of risks associated with investing in the Fund.
State Street Global AdvisorsState Street Real Asset Fund - Class A 31 March 2018
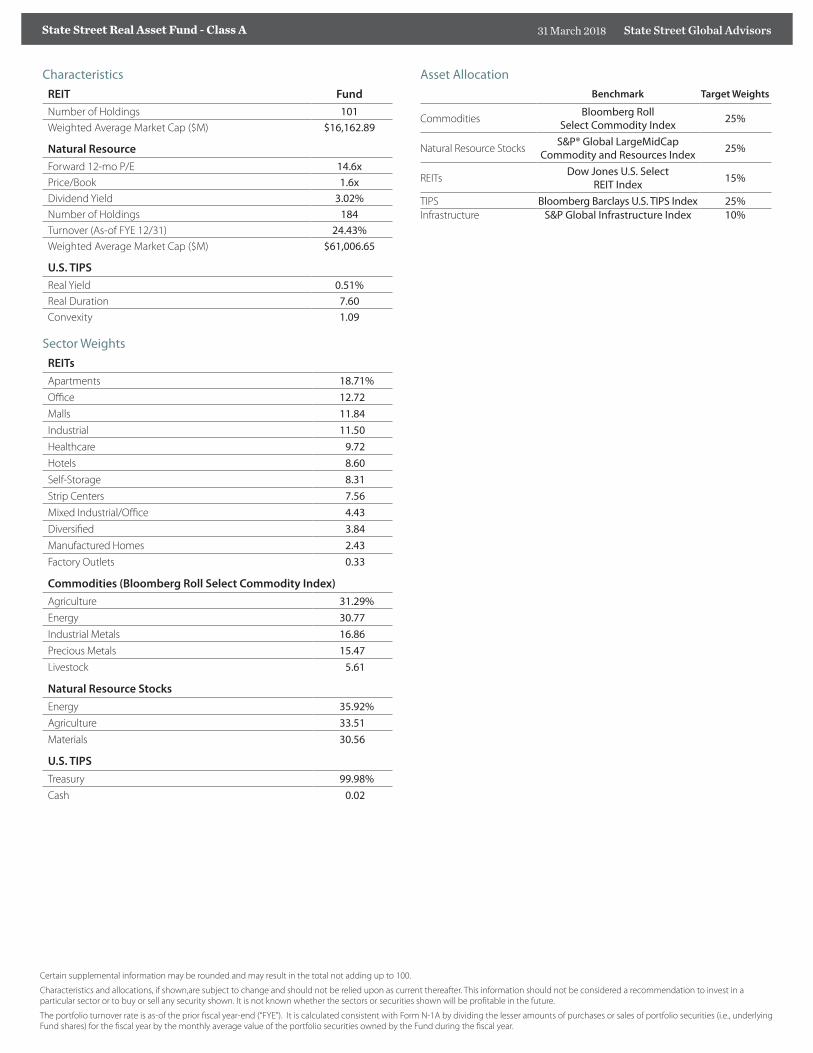
CharacteristicsREIT FundNumber of Holdings 101Weighted Average Market Cap ($M) $16,162.89
Natural ResourceForward 12-mo P/E 14.6xPrice/Book 1.6xDividend Yield 3.02%Number of Holdings 184Turnover (As-of FYE 12/31) 24.43%Weighted Average Market Cap ($M) $61,006.65
U.S. TIPSReal Yield 0.51%Real Duration 7.60Convexity 1.09
Sector WeightsREITsApartments 18.71%Office 12.72Malls 11.84Industrial 11.50Healthcare 9.72Hotels 8.60Self-Storage 8.31Strip Centers 7.56Mixed Industrial/Office 4.43Diversified 3.84Manufactured Homes 2.43Factory Outlets 0.33
Commodities (Bloomberg Roll Select Commodity Index)Agriculture 31.29%Energy 30.77Industrial Metals 16.86Precious Metals 15.47Livestock 5.61
Natural Resource StocksEnergy 35.92%Agriculture 33.51Materials 30.56
U.S. TIPSTreasury 99.98%Cash 0.02
Certain supplemental information may be rounded and may result in the total not adding up to 100.
Characteristics and allocations, if shown,are subject to change and should not be relied upon as current thereafter. This information should not be considered a recommendation to invest in a particular sector or to buy or sell any security shown. It is not known whether the sectors or securities shown will be profitable in the future.
The portfolio turnover rate is as-of the prior fiscal year-end (“FYE”). It is calculated consistent with Form N-1A by dividing the lesser amounts of purchases or sales of portfolio securities (i.e., underlying Fund shares) for the fiscal year by the monthly average value of the portfolio securities owned by the Fund during the fiscal year.
Asset AllocationBenchmark Target Weights
Commodities Bloomberg RollSelect Commodity Index 25%
Natural Resource Stocks S&P® Global LargeMidCap Commodity and Resources Index 25%
REITs Dow Jones U.S. SelectREIT Index 15%
TIPS Bloomberg Barclays U.S. TIPS Index 25%Infrastructure S&P Global Infrastructure Index 10%
Important Message About RiskThis section explains some of the general risks involved with investing in the Fund, including possible loss of principal. Generally, among asset classes, stocks are more volatile than bonds or short-term instruments. Stock values fluctuate in response to the activities of individual companies and general market and economic conditions and at times the risk level of the Fund may be greater than that of the U.S. stock market in general. In addition, the Fund may use derivative instruments which may involve additional risks such as potential illiquidity of the markets, credit risk, currency risk, leverage risk and counterparty risk.
This section does not purport to be a complete explanation; rather, an investment in the Fund is subject to a number of other risks, which are described in more detail in the Fund's Strategy Disclosure Document. Carefully review the complete description of the risks prior to investing in the Fund.
Further, there can be no guarantee that the Investment Objective of the Fund will be met. Risk management does not promise any level of performance or guarantee against loss of principal. SSGA encourages investors to seek the advice of well-qualified financial and tax advisors, accountants, attorneys and other professionals before making any investment or retirement decision.
Risk ManagementSSGA monitors the Fund's portfolio on an ongoing basis to minimize variances from its benchmark exposures, and initiates trades as part of the Fund's rebalancing process or to accommodate periodic cash flows.
State Street Global AdvisorsState Street Real Asset Fund - Class A 31 March 2018
Fee DisclosureThe Fund seeks to achieve its investment objective by making direct investments in securities or by making investments in other investment funds, including those managed by SSGA and its affiliates ("SSGA Funds"). The Fund indirectly bears a proportional share of the fees and expenses of the SSGA Funds in which the Fund invests ("Indirect Expenses") which may include, among others, administration, investment management, audit, index and legal fees. Additionally, the Fund incurs direct fees and expenses ("Direct Expenses") which may include, among others, administration, audit, index, service and legal fees. The Indirect Expenses combined with the Direct Expenses of the Fund (the "Total Annual Operating Expense Ratio" (TAOER)) will equal .05% annually. The investment management fee for the Fund is assessed outside the Fund. A portion, which may vary, may be paid to third-parties or intermediaries for recordkeeping, asset servicing, sub-accounting and communication services to plans invested in the Fund. It is not included as part of the TAOER of the Fund.
You should contact your Plan Administrator for a complete description of the fees and expenses applicable to the Fund, including both the Fund’s expenses and plan-level expenses, including the investment management fee.
The TAOER of .05% reflects all indirect and direct fees and expenses associated with the Fund. Transaction costs (including, for example, brokerage costs and taxes, if any) are not reflected in the TAOER but are reflected in the net performance returns of the Fund. The investment manager does not assess or charge any fee in connection with the purchase or redemption of units of the Fund. To the extent the Fund invests in one or more Collective Funds, the Fund itself may incur such Transaction Charges as a result of such investment, which will be reflected in the Fund's net asset value.
The following example is intended to help illustrate the impact of fees and expenses associated with an investment in the Fund (based upon the Fund’s expenses of .05% and plan-level expenses of .55%, as specified by CalPERS Supplemental Income 457 Plan). It is intended to illustrate the hypothetical expense that you would incur over various time periods if you were to invest $10,000 in the Fund. This example assumes that the Fund provides a return of 5% a year and that operating expenses of the Fund remain the same. The results apply whether or not you redeem your investment at the end of the given time period.
Example Fees: 1 year - $61.32; 3 years - $192.17; 5 years - $334.79; 10 years - $750.02
The example outlined above was for illustrative purposes only and does not represent the actual fees and expenses or the actual past or future performance of the Fund. Actual future fees and expenses and actual future performance may be higher or lower than those shown.
Fees and expenses are only one of several factors that participants and beneficiaries should consider when making investment decisions.
State Street assumes no liability in connection with the accuracy or completeness of the plan-level expense information provided by CalPERS Supplemental Income 457 Plan or any performance information to the extent it is based on such plan-level expense information.
Expiration Date: 08/29/2018
Additional InformationFor more information on plan expenses and current performance information, including performance to the most recent month-end, please visit the Plan website at: https://calpers.voya.com. You may also contact CalPERS at (800) 260-0659.
About SSGAThe Fund is managed by State Street Global Advisors Trust Company, a wholly owned subsidiary of State Street Bank and Trust Company, and a global leader in providing investment management solutions to clients worldwide. To learn more about SSGA, visit our web site at www.ssga.com.

Effective September 30, 2015, sector reporting is based on the Russell Global Sectors Classification System (RGS). Prior to August 31, 2015, sector reporting was based on the Global Industry Classification Standard ("GICS") which was developed by and is the exclusive property and a service mark of MSCI Inc. ("MSCI") and Standard & Poor's, a division of The McGraw-Hill Companies, Inc. ("S&P").
The Fund is a collective investment trust and is not FDIC insured, nor is it an obligation or deposit of, or guaranteed by State Street Corporation, SSGA or its affiliates.
The Russell 3000® Index measures the performance of the largest 3,000 U.S. companies representing approximately 98% of the investable U.S. equity market. The Russell 3000 Index is constructed to provide a comprehensive, unbiased, and stable barometer of the broad market and is completely reconstituted annually to ensure new and growing equities are reflected.
Russell Investment Group is the source and owner of the trademark, service marks and copyrights related to the Russell Indexes. Russell 3000® Index is a trademark of Russell Investment Group.
Please see the Fee Disclosure section on the last page for a complete disclosure of the Fund's total operating expense ratio.
This fact sheet provides summary information about the Fund and is provided by the CalPERS Supplemental Income 457 Plan. It should be read in conjunction with the Fund's applicable Strategy Disclosure Document, which is available upon request. The Disclosure Document contains important information about the Fund, including a description of a number of risks associated with investing in the Fund.
The Fund seeks to offer broad, low cost exposure to the U.S. Equity Markets diversified across small, medium and large sized companies.
Investment ObjectiveThe Fund seeks an investment return that approximates as closely as practicable, before expenses, the performance of the Russell 3000® Index (the "Index") over the long term.
Investment StrategyThe Fund is managed using a "passive" or "indexing" investment approach, by which SSGA attempts to match, before expenses, the performance of the Index. SSGA will typically attempt to invest in the equity securities comprising the Index, in approximately the same proportions as they are represented in the Index. Equity securities may include common stocks, preferred stocks, depository receipts, or other securities convertible into common stock. The Fund may purchase securities in their initial public offerings ("IPOs"). In some cases, it may not be possible or practicable to purchase all of the securities comprising the Index, or to hold them in the same weightings as they represent in the Index. In those circumstances, SSGA may employ a sampling or optimization technique to construct the portfolio in question.
From time to time securities are added to or removed from the Index. SSGA may sell securities that are represented in the Index, or purchase securities that are not yet represented in the Index, prior to or after their removal or addition to the Index.
The Fund may at times purchase or sell index futures contracts, or options on those futures, or engage in other transactions involving the use of derivatives, in lieu of investment directly in the securities making up the Index or to enhance the Fund's replication of the Index return. The Fund's return may not match the return of the Index.
Key Facts y The Fund is passively managed y The Fund may use futures and other derivatives y The Fund may lend its portfolio and enter into repurchase agreements
(See applicable governing documents for a Portfolio’s authority to lend. Participation in a securities lending program may adversely affect the investment returns and risk profile of the Portfolio)
y The Fund may invest in other investment pools, including those managed by SSGA and its affiliates
y The Fund is not leveraged y The Fund will not sell securities short
State Street Russell All Cap Index Fund Class I (the "Fund") represents units of ownership in the State Street Russell All Cap Index Securities Lending Series Fund.
Performance
Total Returns Fund Benchmark
1 Month -2.04% -2.01%Q1 2018 -0.75% -0.64%YTD -0.75% -0.64%1 Year 13.36% 13.81%3 Years 9.86% 10.22%5 Years 12.51% 13.03%7 Years 11.92% 12.39%10 Years 9.26% 9.62%Since Inception (5/31/1997) 7.46% 7.85%Best Since Inception (2013) 31.87% 33.55%Worst Since Inception (2008) -37.36% -37.31%
The model returns are provided net of the Fund’s expenses (described on the last page under the fee disclosure section of the fact sheet) and then further adjusted to reflect the deduction of the plan level expenses, which may include, among others, investment management, recordkeeping, account administration, account manager, administrative, investment services and contingency reserve fees, of 0.41% (as specified by the CalPERS Supplemental Income 457 Plan). All returns greater than 1 year are annualized. Performance shown represents past performance. Past performance is not a guarantee of future results. Current performance may be lower or higher than the performance shown above. Index returns are unmanaged and do not reflect the deduction of any fees or expenses. Index returns reflect all items of income, gain and loss and the reinvestment of dividends and other income.
The performance figures listed above do not take into account the mark-to-market unit value of the securities lending cash collateral pool held by the Fund. If the Fund marked-to-market units in the securities lending cash collateral pool, performance may be lower. Please see the last page for additional information about securities lending.
Growth of $10,000
'09 '10 '11 '12 '13 '14 '15 '16 '17 '18$0
$5,000
$10,000
$15,000
$20,000
$25,000 $24,234
The hypothetical $10,000 investment chart is plotted quarterly, and includes reinvestment of dividends and capital gains. There is no direct correlation between a hypothetical investment and the anticipated performance of the Fund.
State Street Russell All Cap Index Fund - Class I
31 March 2018
CalPERS Supplemental Income 457 Plan
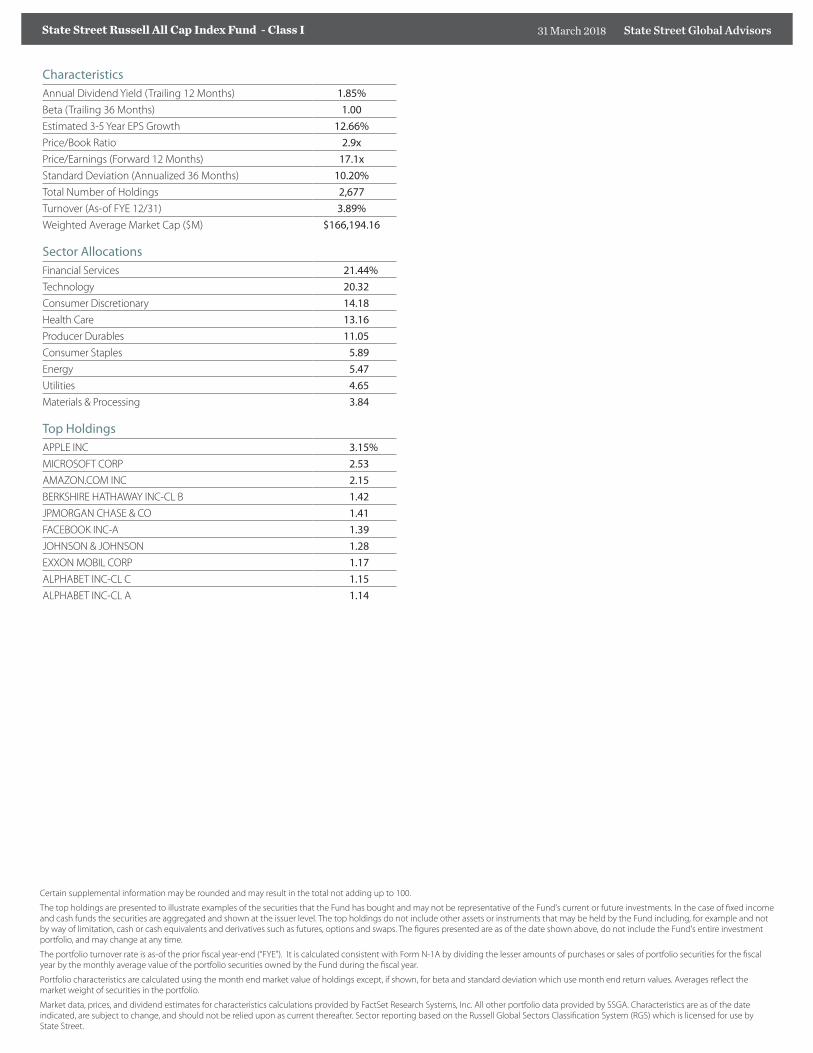
CharacteristicsAnnual Dividend Yield (Trailing 12 Months) 1.85%Beta (Trailing 36 Months) 1.00Estimated 3-5 Year EPS Growth 12.66%Price/Book Ratio 2.9xPrice/Earnings (Forward 12 Months) 17.1xStandard Deviation (Annualized 36 Months) 10.20%Total Number of Holdings 2,677Turnover (As-of FYE 12/31) 3.89%Weighted Average Market Cap ($M) $166,194.16
Sector AllocationsFinancial Services 21.44%Technology 20.32Consumer Discretionary 14.18Health Care 13.16Producer Durables 11.05Consumer Staples 5.89Energy 5.47Utilities 4.65Materials & Processing 3.84
Top HoldingsAPPLE INC 3.15%MICROSOFT CORP 2.53AMAZON.COM INC 2.15BERKSHIRE HATHAWAY INC-CL B 1.42JPMORGAN CHASE & CO 1.41FACEBOOK INC-A 1.39JOHNSON & JOHNSON 1.28EXXON MOBIL CORP 1.17ALPHABET INC-CL C 1.15ALPHABET INC-CL A 1.14
Certain supplemental information may be rounded and may result in the total not adding up to 100.
The top holdings are presented to illustrate examples of the securities that the Fund has bought and may not be representative of the Fund's current or future investments. In the case of fixed income and cash funds the securities are aggregated and shown at the issuer level. The top holdings do not include other assets or instruments that may be held by the Fund including, for example and not by way of limitation, cash or cash equivalents and derivatives such as futures, options and swaps. The figures presented are as of the date shown above, do not include the Fund's entire investment portfolio, and may change at any time.
The portfolio turnover rate is as-of the prior fiscal year-end (“FYE”). It is calculated consistent with Form N-1A by dividing the lesser amounts of purchases or sales of portfolio securities for the fiscal year by the monthly average value of the portfolio securities owned by the Fund during the fiscal year.
Portfolio characteristics are calculated using the month end market value of holdings except, if shown, for beta and standard deviation which use month end return values. Averages reflect the market weight of securities in the portfolio.
Market data, prices, and dividend estimates for characteristics calculations provided by FactSet Research Systems, Inc. All other portfolio data provided by SSGA. Characteristics are as of the date indicated, are subject to change, and should not be relied upon as current thereafter. Sector reporting based on the Russell Global Sectors Classification System (RGS) which is licensed for use by State Street.
State Street Global AdvisorsState Street Russell All Cap Index Fund - Class I 31 March 2018
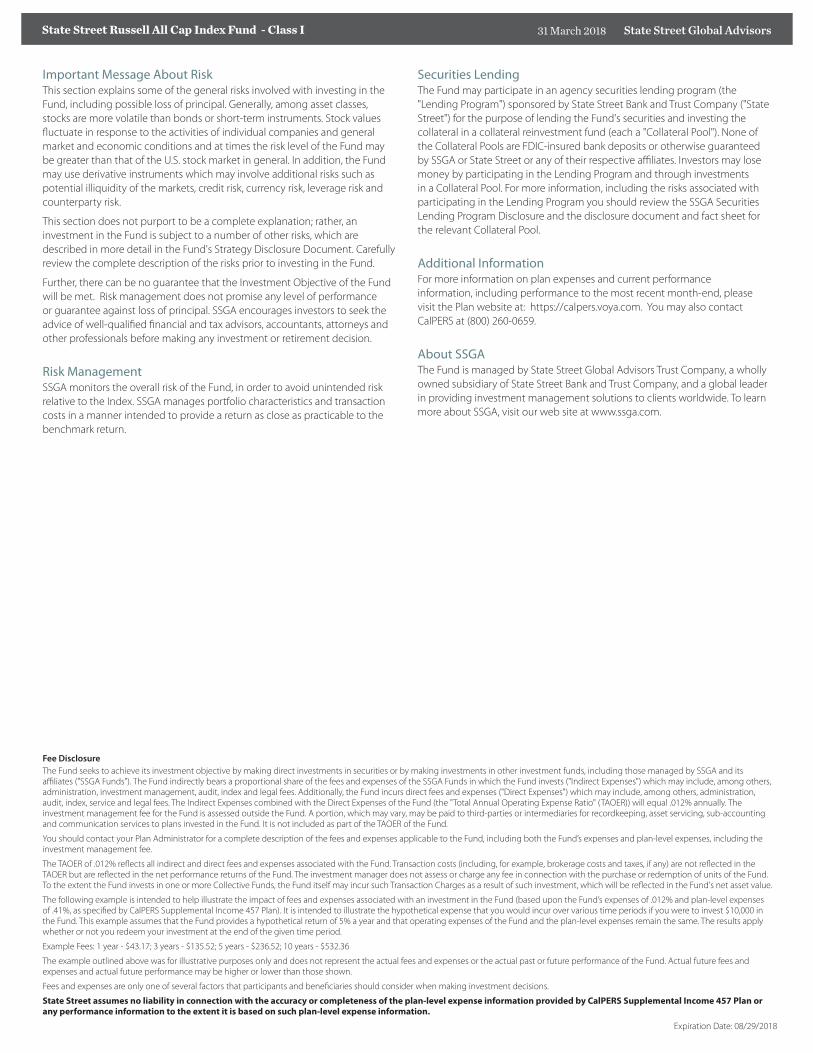
Important Message About RiskThis section explains some of the general risks involved with investing in the Fund, including possible loss of principal. Generally, among asset classes, stocks are more volatile than bonds or short-term instruments. Stock values fluctuate in response to the activities of individual companies and general market and economic conditions and at times the risk level of the Fund may be greater than that of the U.S. stock market in general. In addition, the Fund may use derivative instruments which may involve additional risks such as potential illiquidity of the markets, credit risk, currency risk, leverage risk and counterparty risk.
This section does not purport to be a complete explanation; rather, an investment in the Fund is subject to a number of other risks, which are described in more detail in the Fund's Strategy Disclosure Document. Carefully review the complete description of the risks prior to investing in the Fund.
Further, there can be no guarantee that the Investment Objective of the Fund will be met. Risk management does not promise any level of performance or guarantee against loss of principal. SSGA encourages investors to seek the advice of well-qualified financial and tax advisors, accountants, attorneys and other professionals before making any investment or retirement decision.
Risk ManagementSSGA monitors the overall risk of the Fund, in order to avoid unintended risk relative to the Index. SSGA manages portfolio characteristics and transaction costs in a manner intended to provide a return as close as practicable to the benchmark return.
Securities LendingThe Fund may participate in an agency securities lending program (the "Lending Program") sponsored by State Street Bank and Trust Company ("State Street") for the purpose of lending the Fund's securities and investing the collateral in a collateral reinvestment fund (each a "Collateral Pool"). None of the Collateral Pools are FDIC-insured bank deposits or otherwise guaranteed by SSGA or State Street or any of their respective affiliates. Investors may lose money by participating in the Lending Program and through investments in a Collateral Pool. For more information, including the risks associated with participating in the Lending Program you should review the SSGA Securities Lending Program Disclosure and the disclosure document and fact sheet for the relevant Collateral Pool.
Additional InformationFor more information on plan expenses and current performance information, including performance to the most recent month-end, please visit the Plan website at: https://calpers.voya.com. You may also contact CalPERS at (800) 260-0659.
About SSGAThe Fund is managed by State Street Global Advisors Trust Company, a wholly owned subsidiary of State Street Bank and Trust Company, and a global leader in providing investment management solutions to clients worldwide. To learn more about SSGA, visit our web site at www.ssga.com.
Fee DisclosureThe Fund seeks to achieve its investment objective by making direct investments in securities or by making investments in other investment funds, including those managed by SSGA and its affiliates ("SSGA Funds"). The Fund indirectly bears a proportional share of the fees and expenses of the SSGA Funds in which the Fund invests ("Indirect Expenses") which may include, among others, administration, investment management, audit, index and legal fees. Additionally, the Fund incurs direct fees and expenses ("Direct Expenses") which may include, among others, administration, audit, index, service and legal fees. The Indirect Expenses combined with the Direct Expenses of the Fund (the "Total Annual Operating Expense Ratio" (TAOER)) will equal .012% annually. The investment management fee for the Fund is assessed outside the Fund. A portion, which may vary, may be paid to third-parties or intermediaries for recordkeeping, asset servicing, sub-accounting and communication services to plans invested in the Fund. It is not included as part of the TAOER of the Fund.
You should contact your Plan Administrator for a complete description of the fees and expenses applicable to the Fund, including both the Fund’s expenses and plan-level expenses, including the investment management fee.
The TAOER of .012% reflects all indirect and direct fees and expenses associated with the Fund. Transaction costs (including, for example, brokerage costs and taxes, if any) are not reflected in the TAOER but are reflected in the net performance returns of the Fund. The investment manager does not assess or charge any fee in connection with the purchase or redemption of units of the Fund. To the extent the Fund invests in one or more Collective Funds, the Fund itself may incur such Transaction Charges as a result of such investment, which will be reflected in the Fund's net asset value.
The following example is intended to help illustrate the impact of fees and expenses associated with an investment in the Fund (based upon the Fund’s expenses of .012% and plan-level expenses of .41%, as specified by CalPERS Supplemental Income 457 Plan). It is intended to illustrate the hypothetical expense that you would incur over various time periods if you were to invest $10,000 in the Fund. This example assumes that the Fund provides a hypothetical return of 5% a year and that operating expenses of the Fund and the plan-level expenses remain the same. The results apply whether or not you redeem your investment at the end of the given time period.
Example Fees: 1 year - $43.17; 3 years - $135.52; 5 years - $236.52; 10 years - $532.36
The example outlined above was for illustrative purposes only and does not represent the actual fees and expenses or the actual past or future performance of the Fund. Actual future fees and expenses and actual future performance may be higher or lower than those shown.
Fees and expenses are only one of several factors that participants and beneficiaries should consider when making investment decisions.
State Street assumes no liability in connection with the accuracy or completeness of the plan-level expense information provided by CalPERS Supplemental Income 457 Plan or any performance information to the extent it is based on such plan-level expense information.
Expiration Date: 08/29/2018
State Street Global AdvisorsState Street Russell All Cap Index Fund - Class I 31 March 2018
Fixed
State Street U.S. Short-Term Government/Credit Bond Index Fund - Class I31 March 2018
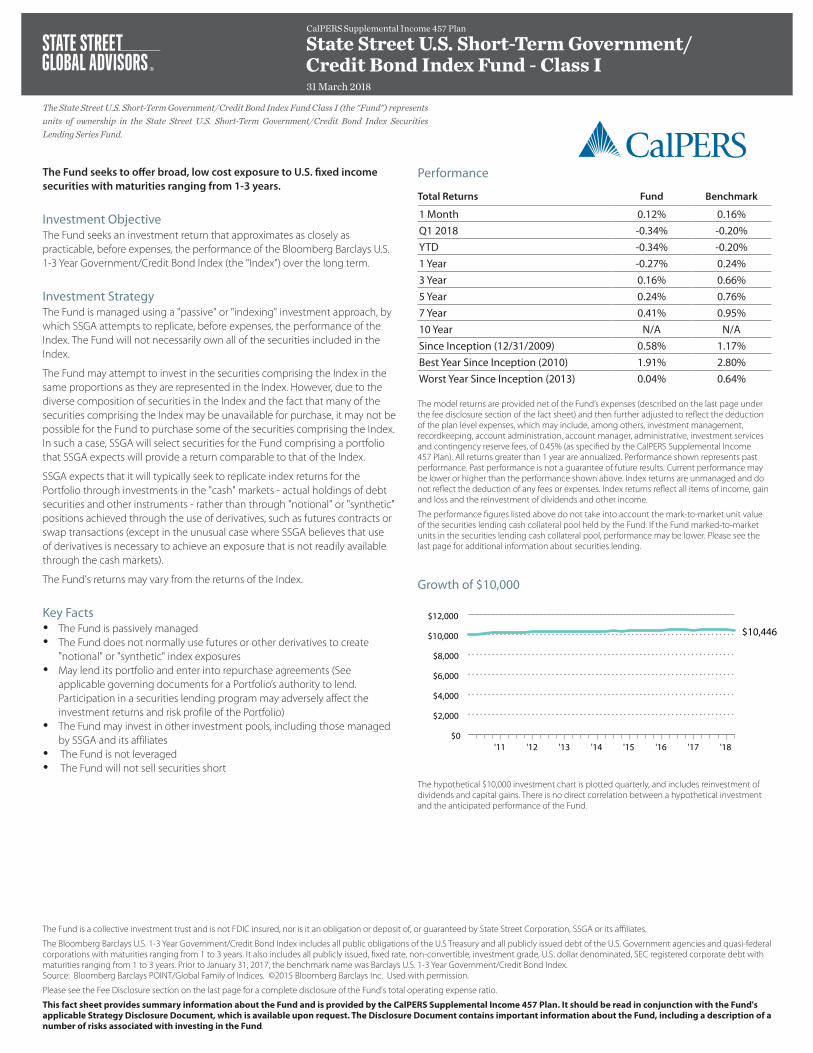
The Fund seeks to offer broad, low cost exposure to U.S. fixed income securities with maturities ranging from 1-3 years.
Investment ObjectiveThe Fund seeks an investment return that approximates as closely as practicable, before expenses, the performance of the Bloomberg Barclays U.S. 1-3 Year Government/Credit Bond Index (the "Index") over the long term.
Investment StrategyThe Fund is managed using a "passive" or "indexing" investment approach, by which SSGA attempts to replicate, before expenses, the performance of the Index. The Fund will not necessarily own all of the securities included in the Index.
The Fund may attempt to invest in the securities comprising the Index in the same proportions as they are represented in the Index. However, due to the diverse composition of securities in the Index and the fact that many of the securities comprising the Index may be unavailable for purchase, it may not be possible for the Fund to purchase some of the securities comprising the Index. In such a case, SSGA will select securities for the Fund comprising a portfolio that SSGA expects will provide a return comparable to that of the Index.
SSGA expects that it will typically seek to replicate index returns for the Portfolio through investments in the "cash" markets - actual holdings of debt securities and other instruments - rather than through "notional" or "synthetic" positions achieved through the use of derivatives, such as futures contracts or swap transactions (except in the unusual case where SSGA believes that use of derivatives is necessary to achieve an exposure that is not readily available through the cash markets).
The Fund's returns may vary from the returns of the Index.
Key Facts y The Fund is passively managed y The Fund does not normally use futures or other derivatives to create
"notional" or "synthetic" index exposures y May lend its portfolio and enter into repurchase agreements (See
applicable governing documents for a Portfolio’s authority to lend. Participation in a securities lending program may adversely affect the investment returns and risk profile of the Portfolio)
y The Fund may invest in other investment pools, including those managed by SSGA and its affiliates
y The Fund is not leveraged y The Fund will not sell securities short
The State Street U.S. Short-Term Government/Credit Bond Index Fund Class I (the "Fund") represents units of ownership in the State Street U.S. Short-Term Government/Credit Bond Index Securities Lending Series Fund.
The Fund is a collective investment trust and is not FDIC insured, nor is it an obligation or deposit of, or guaranteed by State Street Corporation, SSGA or its affiliates.
The Bloomberg Barclays U.S. 1-3 Year Government/Credit Bond Index includes all public obligations of the U.S Treasury and all publicly issued debt of the U.S. Government agencies and quasi-federal corporations with maturities ranging from 1 to 3 years. It also includes all publicly issued, fixed rate, non-convertible, investment grade, U.S. dollar denominated, SEC registered corporate debt with maturities ranging from 1 to 3 years. Prior to January 31, 2017, the benchmark name was Barclays U.S. 1-3 Year Government/Credit Bond Index. Source: Bloomberg Barclays POINT/Global Family of Indices. ©2015 Bloomberg Barclays Inc. Used with permission.
Please see the Fee Disclosure section on the last page for a complete disclosure of the Fund's total operating expense ratio.
This fact sheet provides summary information about the Fund and is provided by the CalPERS Supplemental Income 457 Plan. It should be read in conjunction with the Fund's applicable Strategy Disclosure Document, which is available upon request. The Disclosure Document contains important information about the Fund, including a description of a number of risks associated with investing in the Fund.
Performance
Total Returns Fund Benchmark
1 Month 0.12% 0.16%Q1 2018 -0.34% -0.20%YTD -0.34% -0.20%1 Year -0.27% 0.24%3 Year 0.16% 0.66%5 Year 0.24% 0.76%7 Year 0.41% 0.95%10 Year N/A N/ASince Inception (12/31/2009) 0.58% 1.17%Best Year Since Inception (2010) 1.91% 2.80%Worst Year Since Inception (2013) 0.04% 0.64%
The model returns are provided net of the Fund’s expenses (described on the last page under the fee disclosure section of the fact sheet) and then further adjusted to reflect the deduction of the plan level expenses, which may include, among others, investment management, recordkeeping, account administration, account manager, administrative, investment services and contingency reserve fees, of 0.45% (as specified by the CalPERS Supplemental Income 457 Plan). All returns greater than 1 year are annualized. Performance shown represents past performance. Past performance is not a guarantee of future results. Current performance may be lower or higher than the performance shown above. Index returns are unmanaged and do not reflect the deduction of any fees or expenses. Index returns reflect all items of income, gain and loss and the reinvestment of dividends and other income.
The performance figures listed above do not take into account the mark-to-market unit value of the securities lending cash collateral pool held by the Fund. If the Fund marked-to-market units in the securities lending cash collateral pool, performance may be lower. Please see the last page for additional information about securities lending.
Growth of $10,000
'11 '12 '13 '14 '15 '16 '17 '18$0
$2,000
$4,000
$6,000
$8,000
$10,000
$12,000
$10,446
The hypothetical $10,000 investment chart is plotted quarterly, and includes reinvestment of dividends and capital gains. There is no direct correlation between a hypothetical investment and the anticipated performance of the Fund.
CalPERS Supplemental Income 457 Plan
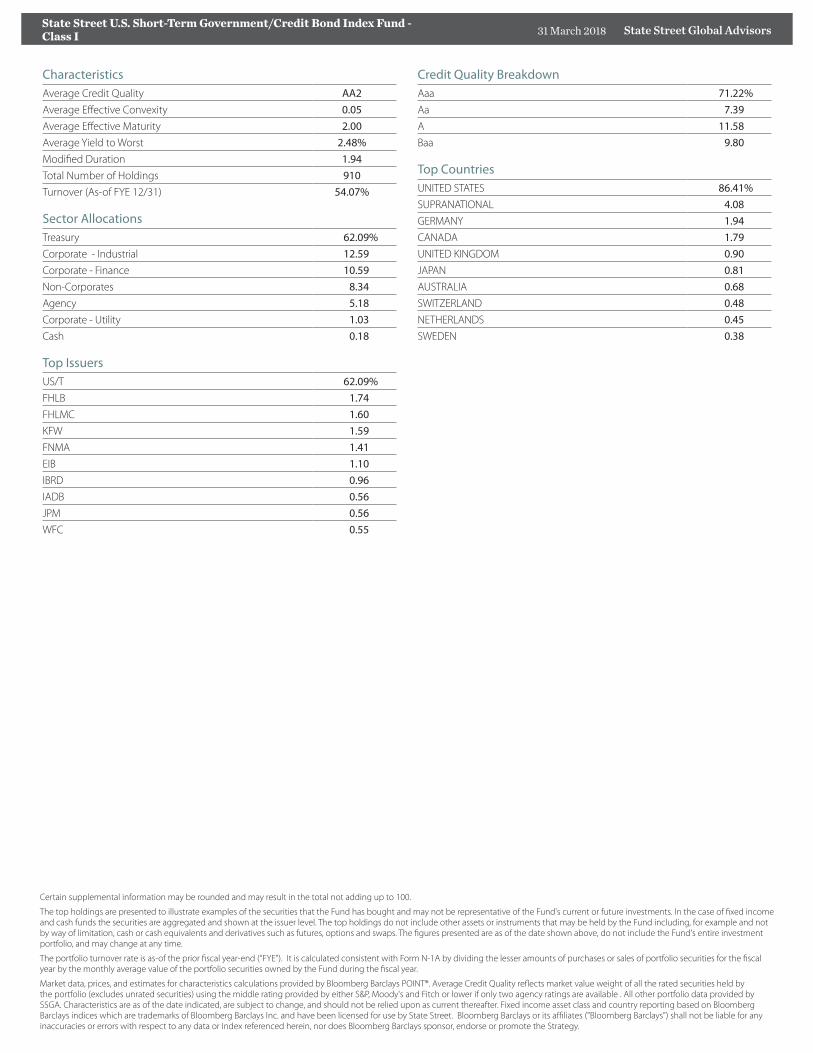
CharacteristicsAverage Credit Quality AA2Average Effective Convexity 0.05Average Effective Maturity 2.00Average Yield to Worst 2.48%Modified Duration 1.94Total Number of Holdings 910Turnover (As-of FYE 12/31) 54.07%
Sector AllocationsTreasury 62.09%Corporate - Industrial 12.59Corporate - Finance 10.59Non-Corporates 8.34Agency 5.18Corporate - Utility 1.03Cash 0.18
Top IssuersUS/T 62.09%FHLB 1.74FHLMC 1.60KFW 1.59FNMA 1.41EIB 1.10IBRD 0.96IADB 0.56JPM 0.56WFC 0.55
Certain supplemental information may be rounded and may result in the total not adding up to 100.
The top holdings are presented to illustrate examples of the securities that the Fund has bought and may not be representative of the Fund's current or future investments. In the case of fixed income and cash funds the securities are aggregated and shown at the issuer level. The top holdings do not include other assets or instruments that may be held by the Fund including, for example and not by way of limitation, cash or cash equivalents and derivatives such as futures, options and swaps. The figures presented are as of the date shown above, do not include the Fund's entire investment portfolio, and may change at any time.
The portfolio turnover rate is as-of the prior fiscal year-end (“FYE”). It is calculated consistent with Form N-1A by dividing the lesser amounts of purchases or sales of portfolio securities for the fiscal year by the monthly average value of the portfolio securities owned by the Fund during the fiscal year.
Market data, prices, and estimates for characteristics calculations provided by Bloomberg Barclays POINT®. Average Credit Quality reflects market value weight of all the rated securities held by the portfolio (excludes unrated securities) using the middle rating provided by either S&P, Moody's and Fitch or lower if only two agency ratings are available . All other portfolio data provided by SSGA. Characteristics are as of the date indicated, are subject to change, and should not be relied upon as current thereafter. Fixed income asset class and country reporting based on Bloomberg Barclays indices which are trademarks of Bloomberg Barclays Inc. and have been licensed for use by State Street. Bloomberg Barclays or its affiliates ("Bloomberg Barclays") shall not be liable for any inaccuracies or errors with respect to any data or Index referenced herein, nor does Bloomberg Barclays sponsor, endorse or promote the Strategy.
Credit Quality BreakdownAaa 71.22%Aa 7.39A 11.58Baa 9.80
Top CountriesUNITED STATES 86.41%SUPRANATIONAL 4.08GERMANY 1.94CANADA 1.79UNITED KINGDOM 0.90JAPAN 0.81AUSTRALIA 0.68SWITZERLAND 0.48NETHERLANDS 0.45SWEDEN 0.38
State Street Global AdvisorsState Street U.S. Short-Term Government/Credit Bond Index Fund - Class I 31 March 2018
Important Message About RiskThis section explains some of the general risks involved with investing in the Fund, including possible loss of principal. Generally, among asset classes, stocks are more volatile than bonds or short-term instruments. Stock values fluctuate in response to the activities of individual companies and general market and economic conditions and at times the risk level of the Fund may be greater than that of the U.S. stock market in general. In addition, the Fund may use derivative instruments which may involve additional risks such as potential illiquidity of the markets, credit risk, currency risk, leverage risk and counterparty risk.
This section does not purport to be a complete explanation; rather, an investment in the Fund is subject to a number of other risks, which are described in more detail in the Fund's Strategy Disclosure Document. Carefully review the complete description of the risks prior to investing in the Fund.
Further, there can be no guarantee that the Investment Objective of the Fund will be met. Risk management does not promise any level of performance or guarantee against loss of principal. SSGA encourages investors to seek the advice of well-qualified financial and tax advisors, accountants, attorneys and other professionals before making any investment or retirement decision.
Risk ManagementSSGA monitors the overall risk of the Fund, in order to avoid unintended risk relative to the Index. SSGA manages portfolio characteristics and transaction costs in a manner intended to provide a return as close as practicable to the benchmark return.
Securities LendingThe Fund may participate in an agency securities lending program (the "Lending Program") sponsored by State Street Bank and Trust Company ("State Street") for the purpose of lending the Fund's securities and investing the collateral in a collateral reinvestment fund (each a "Collateral Pool"). None of the Collateral Pools are FDIC-insured bank deposits or otherwise guaranteed by SSGA or State Street or any of their respective affiliates. Investors may lose money by participating in the Lending Program and through investments in a Collateral Pool. For more information, including the risks associated with participating in the Lending Program you should review the SSGA Securities Lending Program Disclosure and the disclosure document and fact sheet for the relevant Collateral Pool.
Additional InformationFor more information on plan expenses and current performance information, including performance to the most recent month-end, please visit the Plan website at: https://calpers.voya.com. You may also contact CalPERS at (800) 260-0659.
About SSGAThe Fund is managed by State Street Global Advisors Trust Company, a wholly owned subsidiary of State Street Bank and Trust Company, and a global leader in providing investment management solutions to clients worldwide. To learn more about SSGA, visit our web site at www.ssga.com.
Fee DisclosureThe Fund seeks to achieve its investment objective by making direct investments in securities or by making investments in other investment funds, including those managed by SSGA and its affiliates ("SSGA Funds"). The Fund indirectly bears a proportional share of the fees and expenses of the SSGA Funds in which the Fund invests ("Indirect Expenses") which may include, among others, administration, investment management, audit, index and legal fees. Additionally, the Fund incurs direct fees and expenses ("Direct Expenses") which may include, among others, administration, audit, index, service and legal fees. The Indirect Expenses combined with the Direct Expenses of the Fund (the "Total Annual Operating Expense Ratio" (TAOER)) will equal .012% annually. The investment management fee for the Fund is assessed outside the Fund. A portion, which may vary, may be paid to third-parties or intermediaries for recordkeeping, asset servicing, sub-accounting and communication services to plans invested in the Fund. It is not included as part of the TAOER of the Fund.
You should contact your Plan Administrator for a complete description of the fees and expenses applicable to the Fund, including both the Fund’s expenses and plan-level expenses, including the investment management fee.
The TAOER of .012% reflects all indirect and direct fees and expenses associated with the Fund. Transaction costs (including, for example, brokerage costs and taxes, if any) are not reflected in the TAOER but are reflected in the net performance returns of the Fund. The investment manager does not assess or charge any fee in connection with the purchase or redemption of units of the Fund. To the extent the Fund invests in one or more Collective Funds, the Fund itself may incur such Transaction Charges as a result of such investment, which will be reflected in the Fund's net asset value.
The following example is intended to help illustrate the impact of fees and expenses associated with an investment in the Fund (based upon the Fund’s expenses of .012% and plan-level expenses of .45%, as specified by CalPERS Supplemental Income 457 Plan). It is intended to illustrate the hypothetical expense that you would incur over various time periods if you were to invest $10,000 in the Fund. This example assumes that the Fund provides a hypothetical return of 5% a year and that operating expenses of the Fund and the plan-level expenses remain the same. The results apply whether or not you redeem your investment at the end of the given time period.
Example Fees: 1 year - $47.25; 3 years - $148.27; 5 years - $258.68; 10 years - $581.62
The example outlined above was for illustrative purposes only and does not represent the actual fees and expenses or the actual past or future performance of the Fund. Actual future fees and expenses and actual future performance may be higher or lower than those shown.
Fees and expenses are only one of several factors that participants and beneficiaries should consider when making investment decisions.
State Street assumes no liability in connection with the accuracy or completeness of the plan-level expense information provided by CalPERS Supplemental Income 457 Plan or any performance information to the extent it is based on such plan-level expense information.
Expiration Date: 08/29/2018
State Street Global AdvisorsState Street U.S. Short-Term Government/Credit Bond Index Fund - Class I 31 March 2018
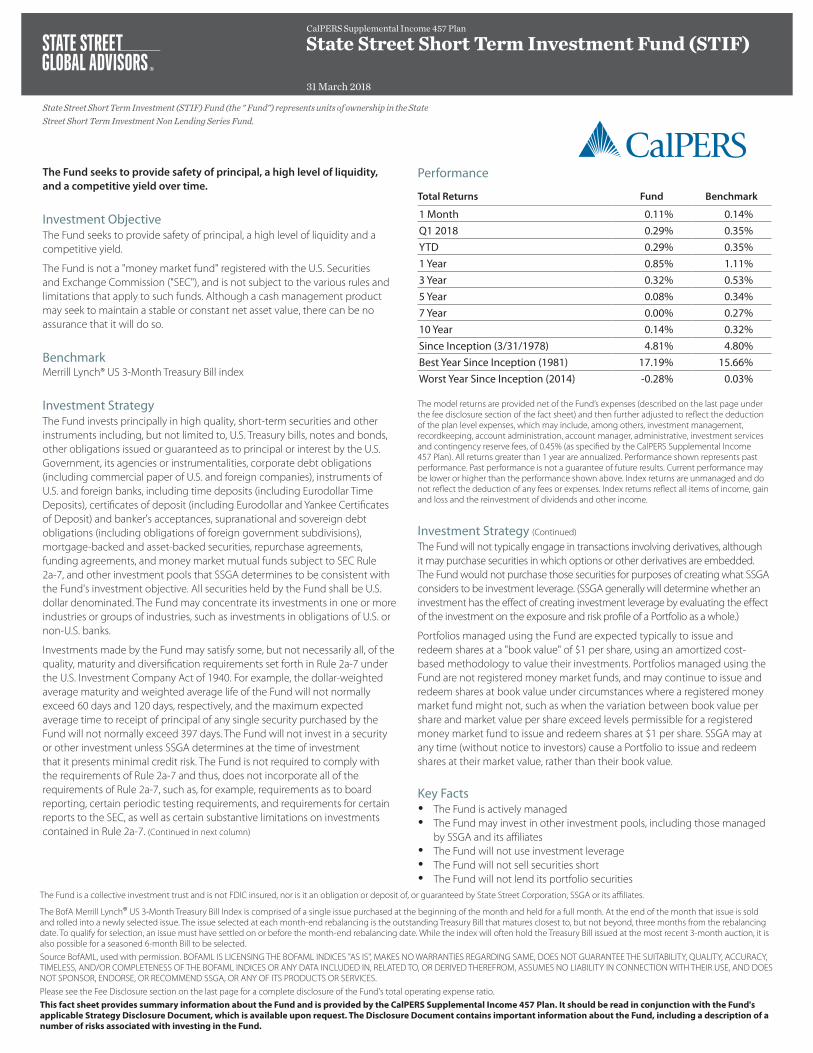
State Street Short Term Investment Fund (STIF)
31 March 2018
CalPERS Supplemental Income 457 Plan
The Fund seeks to provide safety of principal, a high level of liquidity, and a competitive yield over time.
Investment ObjectiveThe Fund seeks to provide safety of principal, a high level of liquidity and a competitive yield.
The Fund is not a "money market fund" registered with the U.S. Securities and Exchange Commission ("SEC"), and is not subject to the various rules and limitations that apply to such funds. Although a cash management product may seek to maintain a stable or constant net asset value, there can be no assurance that it will do so.
BenchmarkMerrill Lynch® US 3-Month Treasury Bill index
Investment StrategyThe Fund invests principally in high quality, short-term securities and other instruments including, but not limited to, U.S. Treasury bills, notes and bonds, other obligations issued or guaranteed as to principal or interest by the U.S. Government, its agencies or instrumentalities, corporate debt obligations (including commercial paper of U.S. and foreign companies), instruments of U.S. and foreign banks, including time deposits (including Eurodollar Time Deposits), certificates of deposit (including Eurodollar and Yankee Certificates of Deposit) and banker's acceptances, supranational and sovereign debt obligations (including obligations of foreign government subdivisions), mortgage-backed and asset-backed securities, repurchase agreements, funding agreements, and money market mutual funds subject to SEC Rule 2a-7, and other investment pools that SSGA determines to be consistent with the Fund's investment objective. All securities held by the Fund shall be U.S. dollar denominated. The Fund may concentrate its investments in one or more industries or groups of industries, such as investments in obligations of U.S. or non-U.S. banks.
Investments made by the Fund may satisfy some, but not necessarily all, of the quality, maturity and diversification requirements set forth in Rule 2a-7 under the U.S. Investment Company Act of 1940. For example, the dollar-weighted average maturity and weighted average life of the Fund will not normally exceed 60 days and 120 days, respectively, and the maximum expected average time to receipt of principal of any single security purchased by the Fund will not normally exceed 397 days. The Fund will not invest in a security or other investment unless SSGA determines at the time of investment that it presents minimal credit risk. The Fund is not required to comply with the requirements of Rule 2a-7 and thus, does not incorporate all of the requirements of Rule 2a-7, such as, for example, requirements as to board reporting, certain periodic testing requirements, and requirements for certain reports to the SEC, as well as certain substantive limitations on investments contained in Rule 2a-7. (Continued in next column)
State Street Short Term Investment (STIF) Fund (the " Fund") represents units of ownership in the State Street Short Term Investment Non Lending Series Fund.
The Fund is a collective investment trust and is not FDIC insured, nor is it an obligation or deposit of, or guaranteed by State Street Corporation, SSGA or its affiliates.
The BofA Merrill Lynch® US 3-Month Treasury Bill Index is comprised of a single issue purchased at the beginning of the month and held for a full month. At the end of the month that issue is sold and rolled into a newly selected issue. The issue selected at each month-end rebalancing is the outstanding Treasury Bill that matures closest to, but not beyond, three months from the rebalancing date. To qualify for selection, an issue must have settled on or before the month-end rebalancing date. While the index will often hold the Treasury Bill issued at the most recent 3-month auction, it is also possible for a seasoned 6-month Bill to be selected.Source BofAML, used with permission. BOFAML IS LICENSING THE BOFAML INDICES "AS IS", MAKES NO WARRANTIES REGARDING SAME, DOES NOT GUARANTEE THE SUITABILITY, QUALITY, ACCURACY, TIMELESS, AND/OR COMPLETENESS OF THE BOFAML INDICES OR ANY DATA INCLUDED IN, RELATED TO, OR DERIVED THEREFROM, ASSUMES NO LIABILITY IN CONNECTION WITH THEIR USE, AND DOES NOT SPONSOR, ENDORSE, OR RECOMMEND SSGA, OR ANY OF ITS PRODUCTS OR SERVICES.Please see the Fee Disclosure section on the last page for a complete disclosure of the Fund's total operating expense ratio. This fact sheet provides summary information about the Fund and is provided by the CalPERS Supplemental Income 457 Plan. It should be read in conjunction with the Fund's applicable Strategy Disclosure Document, which is available upon request. The Disclosure Document contains important information about the Fund, including a description of a number of risks associated with investing in the Fund.
Performance
Total Returns Fund Benchmark
1 Month 0.11% 0.14%Q1 2018 0.29% 0.35%YTD 0.29% 0.35%1 Year 0.85% 1.11%3 Year 0.32% 0.53%5 Year 0.08% 0.34%7 Year 0.00% 0.27%10 Year 0.14% 0.32%Since Inception (3/31/1978) 4.81% 4.80%Best Year Since Inception (1981) 17.19% 15.66%Worst Year Since Inception (2014) -0.28% 0.03%
The model returns are provided net of the Fund’s expenses (described on the last page under the fee disclosure section of the fact sheet) and then further adjusted to reflect the deduction of the plan level expenses, which may include, among others, investment management, recordkeeping, account administration, account manager, administrative, investment services and contingency reserve fees, of 0.45% (as specified by the CalPERS Supplemental Income 457 Plan). All returns greater than 1 year are annualized. Performance shown represents past performance. Past performance is not a guarantee of future results. Current performance may be lower or higher than the performance shown above. Index returns are unmanaged and do not reflect the deduction of any fees or expenses. Index returns reflect all items of income, gain and loss and the reinvestment of dividends and other income.
Investment Strategy (Continued)
The Fund will not typically engage in transactions involving derivatives, although it may purchase securities in which options or other derivatives are embedded. The Fund would not purchase those securities for purposes of creating what SSGA considers to be investment leverage. (SSGA generally will determine whether an investment has the effect of creating investment leverage by evaluating the effect of the investment on the exposure and risk profile of a Portfolio as a whole.)
Portfolios managed using the Fund are expected typically to issue and redeem shares at a "book value" of $1 per share, using an amortized cost-based methodology to value their investments. Portfolios managed using the Fund are not registered money market funds, and may continue to issue and redeem shares at book value under circumstances where a registered money market fund might not, such as when the variation between book value per share and market value per share exceed levels permissible for a registered money market fund to issue and redeem shares at $1 per share. SSGA may at any time (without notice to investors) cause a Portfolio to issue and redeem shares at their market value, rather than their book value.
Key Facts y The Fund is actively managed y The Fund may invest in other investment pools, including those managed
by SSGA and its affiliates y The Fund will not use investment leverage y The Fund will not sell securities short y The Fund will not lend its portfolio securities
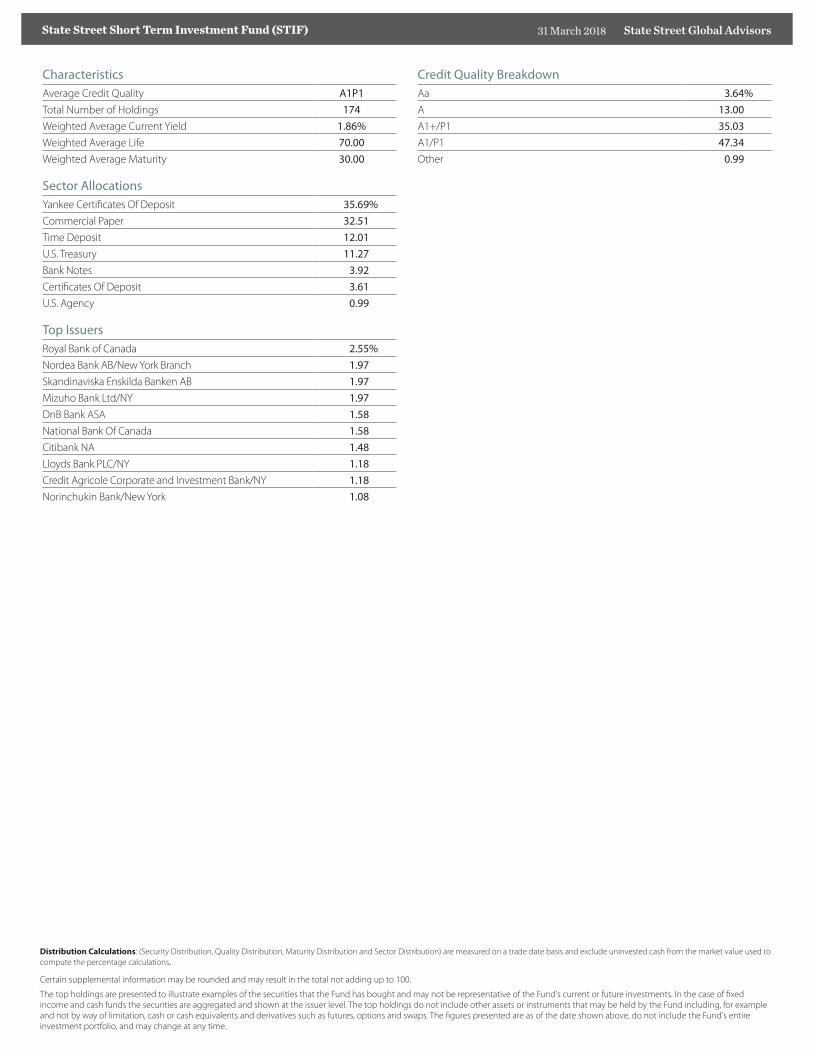
CharacteristicsAverage Credit Quality A1P1Total Number of Holdings 174Weighted Average Current Yield 1.86%Weighted Average Life 70.00Weighted Average Maturity 30.00
Sector AllocationsYankee Certificates Of Deposit 35.69%Commercial Paper 32.51Time Deposit 12.01U.S. Treasury 11.27Bank Notes 3.92Certificates Of Deposit 3.61U.S. Agency 0.99
Top IssuersRoyal Bank of Canada 2.55%Nordea Bank AB/New York Branch 1.97Skandinaviska Enskilda Banken AB 1.97Mizuho Bank Ltd/NY 1.97DnB Bank ASA 1.58National Bank Of Canada 1.58Citibank NA 1.48Lloyds Bank PLC/NY 1.18Credit Agricole Corporate and Investment Bank/NY 1.18Norinchukin Bank/New York 1.08
Distribution Calculations: (Security Distribution, Quality Distribution, Maturity Distribution and Sector Distribution) are measured on a trade date basis and exclude uninvested cash from the market value used to compute the percentage calculations.
Certain supplemental information may be rounded and may result in the total not adding up to 100.
The top holdings are presented to illustrate examples of the securities that the Fund has bought and may not be representative of the Fund's current or future investments. In the case of fixed income and cash funds the securities are aggregated and shown at the issuer level. The top holdings do not include other assets or instruments that may be held by the Fund including, for example and not by way of limitation, cash or cash equivalents and derivatives such as futures, options and swaps. The figures presented are as of the date shown above, do not include the Fund's entire investment portfolio, and may change at any time.
Credit Quality BreakdownAa 3.64%A 13.00A1+/P1 35.03A1/P1 47.34Other 0.99
State Street Global AdvisorsState Street Short Term Investment Fund (STIF) 31 March 2018
Important Message About RiskThis section explains some of the general risks involved with investing in the Fund, including possible loss of principal. Generally, among asset classes, stocks are more volatile than bonds or short-term instruments. Stock values fluctuate in response to the activities of individual companies and general market and economic conditions and at times the risk level of the Fund may be greater than that of the U.S. stock market in general. In addition, the Fund may use derivative instruments which may involve additional risks such as potential illiquidity of the markets, credit risk, currency risk, leverage risk and counterparty risk.
This section does not purport to be a complete explanation; rather, an investment in the Fund is subject to a number of other risks, which are described in more detail in the Fund's Strategy Disclosure Document. Carefully review the complete description of the risks prior to investing in the Fund.
Further, there can be no guarantee that the Investment Objective of the Fund will be met. Risk management does not promise any level of performance or guarantee against loss of principal. SSGA encourages investors to seek the advice of well-qualified financial and tax advisors, accountants, attorneys and other professionals before making any investment or retirement decision.
Risk ManagementSSGA monitors credit and interest rate risk on a continuous basis. The Fund will be highly diversified and will not invest more than 5% of its total assets in obligations of any one issuer, other than obligations of the U.S. Government or its agencies or obligations or other investment pools in which it may invest.
Fee DisclosureThe Fund seeks to achieve its investment objective by making direct investments in securities or by making investments in other investment funds, including those managed by SSGA and its affiliates ("SSGA Funds"). The Fund indirectly bears a proportional share of the fees and expenses of the SSGA Funds in which the Fund invests ("Indirect Expenses") which may include, among others, administration, investment management, audit, index and legal fees. Additionally, the Fund incurs direct fees and expenses ("Direct Expenses") which may include, among others, administration, audit, index, service and legal fees. The Indirect Expenses combined with the Direct Expenses of the Fund (the "Total Annual Operating Expense Ratio" (TAOER)) will equal .01% annually. The investment management fee for the Fund is assessed outside the Fund. A portion, which may vary, may be paid to third-parties or intermediaries for recordkeeping, asset servicing, sub-accounting and communication services to plans invested in the Fund. It is not included as part of the TAOER of the Fund.
You should contact your Plan Administrator for a complete description of the fees and expenses applicable to the Fund, including both the Fund’s expenses and plan-level expenses, including the investment management fee.
The TAOER of .01% reflects all indirect and direct fees and expenses associated with the Fund. Transaction costs (including, for example, brokerage costs and taxes, if any) are not reflected in the TAOER but are reflected in the net performance returns of the Fund. The investment manager does not assess or charge any fee in connection with the purchase or redemption of units of the Fund. To the extent the Fund invests in one or more Collective Funds, the Fund itself may incur such Transaction Charges as a result of such investment, which will be reflected in the Fund's net asset value.
The following example is intended to help illustrate the impact of fees and expenses associated with an investment in the Fund (based upon the Fund’s expenses of .01% and plan-level expenses of .45%, as specified by CalPERS Supplemental Income 457 Plan). It is intended to illustrate the hypothetical expense that you would incur over various time periods if you were to invest $10,000 in the Fund. This example assumes that the Fund provides a hypothetical return of 5% a year and that operating expenses of the Fund and the plan-level expenses remain the same. The results apply whether or not you redeem your investment at the end of the given time period.
Example Fees: 1 year - $47.04; 3 years - $147.64; 5 years - $257.57; 10 years - $579.17
The example outlined above was for illustrative purposes only and does not represent the actual fees and expenses or the actual past or future performance of the Fund. Actual future fees and expenses and actual future performance may be higher or lower than those shown.
Fees and expenses are only one of several factors that participants and beneficiaries should consider when making investment decisions.State Street assumes no liability in connection with the accuracy or completeness of the plan-level expense information provided by CalPERS Supplemental Income 457 Plan or any performance information to the extent it is based on such plan-level expense information.
Expiration Date: 08/29/2018
State Street Global AdvisorsState Street Short Term Investment Fund (STIF) 31 March 2018
Additional InformationFor more information on plan expenses and current performance information, including performance to the most recent month-end, please visit the Plan website at: https://calpers.voya.com. You may also contact CalPERS at (800) 260-0659.
About SSGAThe Fund is managed by State Street Global Advisors Trust Company, a wholly owned subsidiary of State Street Bank and Trust Company, and a global leader in providing investment management solutions to clients worldwide. To learn more about SSGA, visit our web site at www.ssga.com.
State Street U.S. Bond Index Fund - Class I
31 March 2018
CalPERS Supplemental Income 457 Plan
State Street U.S. Bond Index Fund Class I (the "Fund") represents units of ownership in the State Street U.S. Bond Index Securities Lending Series Fund.
The Fund is a collective investment trust and is not FDIC insured, nor is it an obligation or deposit of, or guaranteed by State Street Corporation, SSGA or its affiliates.
Bloomberg Barclays U.S. Aggregate Bond Index is an index representative of well-diversified exposure to the overall U.S. bond market. More specifically, it covers the dollar-denominated investment-grade fixed-rate taxable bond market, including U.S. treasuries, government-related and corporate securities, mortgaged pass-through securities, asset-backed securities and commercial mortgage-backed securities. Prior to January 31, 2017, the benchmark name was Barclays U.S. Aggregate Bond Index.
Source: Bloomberg Barclays POINT/Global Family of Indices. ©2015 Bloomberg Barclays Inc. Used with permission.
Please see the Fee Disclosure section on the last page for a complete disclosure of the Fund's total operating expense ratio.
This fact sheet provides summary information about the Fund and is provided by the CalPERS Supplemental Income 457 Plan. It should be read in conjunction with the Fund's applicable Strategy Disclosure Document, which is available upon request. The Disclosure Document contains important information about the Fund, including a description of a number of risks associated with investing in the Fund.
Performance
Total Returns Fund Benchmark
1 Month 0.65% 0.64%Q1 2018 -1.53% -1.46%YTD -1.53% -1.46%1 Year 0.83% 1.20%3 Year 0.84% 1.20%5 Year 1.54% 1.83%7 Year 2.60% 2.92%10 Year 3.32% 3.63%Since Inception (10/31/1997) 4.56% 4.88%Best Year Since Inception (2000) 11.29% 11.63%Worst Year Since Inception (2013) -2.22% -2.02%
The model returns are provided net of the Fund’s expenses (described on the last page under the fee disclosure section of the fact sheet) and then further adjusted to reflect the deduction of the plan level expenses, which may include, among others, investment management, recordkeeping, account administration, account manager, administrative, investment services and contingency reserve fees, of 0.40% (as specified by the CalPERS Supplemental Income 457 Plan). All returns greater than 1 year are annualized. Performance shown represents past performance. Past performance is not a guarantee of future results. Current performance may be lower or higher than the performance shown above. Index returns are unmanaged and do not reflect the deduction of any fees or expenses. Index returns reflect all items of income, gain and loss and the reinvestment of dividends and other income.
The performance figures listed above do not take into account the mark-to-market unit value of the securities lending cash collateral pool held by the Fund. If the Fund marked-to-market units in the securities lending cash collateral pool, performance may be lower. Please see the last page for additional information about securities lending.
Growth of $10,000
'09 '10 '11 '12 '13 '14 '15 '16 '17 '18$0
$2,000
$4,000
$6,000
$8,000
$10,000
$12,000
$14,000
$16,000
$13,869
The hypothetical $10,000 investment chart is plotted quarterly, and includes reinvestment of dividends and capital gains. There is no direct correlation between a hypothetical investment and the anticipated performance of the Fund.
The Fund seeks to offer broadly diversified, low cost exposure to the overall U.S. bond market.
Investment ObjectiveThe Fund seeks an investment return that approximates as closely as practicable, before expenses, the performance of the Bloomberg Barclays U.S. Aggregate Bond Index (the "Index") over the long term.
Investment StrategyThe Fund is managed using a "passive" or "indexing" investment approach, by which SSGA attempts to replicate, before expenses, the performance of the Index.
The Fund may attempt to invest in the securities comprising the Index in the same proportions as they are represented in the Index. However, due to the diverse composition of securities in the Index and the fact that many of the securities comprising the Index may be unavailable for purchase, it may not be possible for the Fund to purchase some of the securities comprising the Index. In such a case, SSGA will select securities for the Fund comprising a portfolio that SSGA expects will provide a return comparable to that of the Index.
SSGA expects that it will typically seek to replicate index returns for the Portfolio through investments in the "cash" markets - actual holdings of debt securities and other instruments - rather than through "notional" or "synthetic" positions achieved through the use of derivatives, such as futures contracts or swap transactions (except in the unusual case where SSGA believes that use of derivatives is necessary to achieve an exposure that is not readily available through the cash markets).
The Fund's returns may vary from the returns of the Index.
Key Facts y The Fund is passively managed y The Fund does not normally use futures or other derivatives to create
"notional" or "synthetic" index exposures y The Fund may lend its portfolio and enter into repurchase agreements
(See applicable governing documents for a Portfolio’s authority to lend. Participation in a securities lending program may adversely affect the investment returns and risk profile of the Portfolio)
y The Fund may invest in other investment pools, including those managed by SSGA and its affiliates
y The Fund is not leveraged y The Fund will not sell securities short
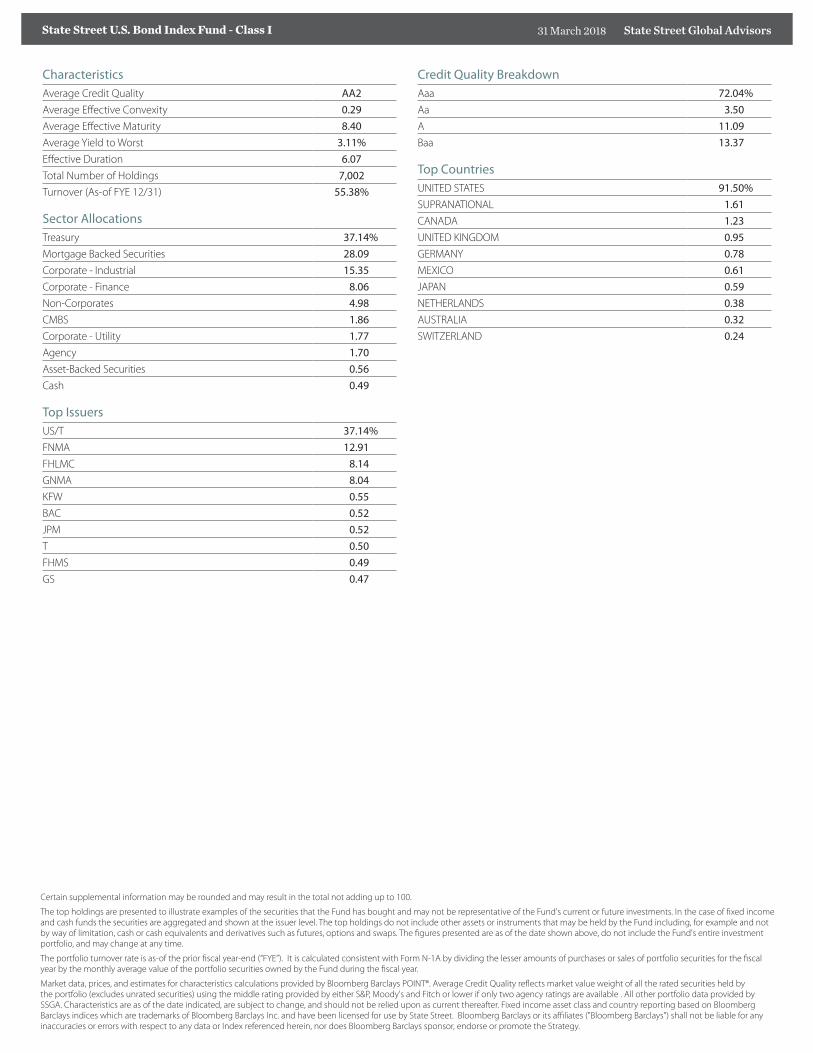
State Street Global AdvisorsState Street U.S. Bond Index Fund - Class I 31 March 2018
CharacteristicsAverage Credit Quality AA2Average Effective Convexity 0.29Average Effective Maturity 8.40Average Yield to Worst 3.11%Effective Duration 6.07Total Number of Holdings 7,002Turnover (As-of FYE 12/31) 55.38%
Sector AllocationsTreasury 37.14%Mortgage Backed Securities 28.09Corporate - Industrial 15.35Corporate - Finance 8.06Non-Corporates 4.98CMBS 1.86Corporate - Utility 1.77Agency 1.70Asset-Backed Securities 0.56Cash 0.49
Top IssuersUS/T 37.14%FNMA 12.91FHLMC 8.14GNMA 8.04KFW 0.55BAC 0.52JPM 0.52T 0.50FHMS 0.49GS 0.47
Certain supplemental information may be rounded and may result in the total not adding up to 100.
The top holdings are presented to illustrate examples of the securities that the Fund has bought and may not be representative of the Fund's current or future investments. In the case of fixed income and cash funds the securities are aggregated and shown at the issuer level. The top holdings do not include other assets or instruments that may be held by the Fund including, for example and not by way of limitation, cash or cash equivalents and derivatives such as futures, options and swaps. The figures presented are as of the date shown above, do not include the Fund's entire investment portfolio, and may change at any time.
The portfolio turnover rate is as-of the prior fiscal year-end (“FYE”). It is calculated consistent with Form N-1A by dividing the lesser amounts of purchases or sales of portfolio securities for the fiscal year by the monthly average value of the portfolio securities owned by the Fund during the fiscal year.
Market data, prices, and estimates for characteristics calculations provided by Bloomberg Barclays POINT®. Average Credit Quality reflects market value weight of all the rated securities held by the portfolio (excludes unrated securities) using the middle rating provided by either S&P, Moody's and Fitch or lower if only two agency ratings are available . All other portfolio data provided by SSGA. Characteristics are as of the date indicated, are subject to change, and should not be relied upon as current thereafter. Fixed income asset class and country reporting based on Bloomberg Barclays indices which are trademarks of Bloomberg Barclays Inc. and have been licensed for use by State Street. Bloomberg Barclays or its affiliates ("Bloomberg Barclays") shall not be liable for any inaccuracies or errors with respect to any data or Index referenced herein, nor does Bloomberg Barclays sponsor, endorse or promote the Strategy.
Credit Quality BreakdownAaa 72.04%Aa 3.50A 11.09Baa 13.37
Top CountriesUNITED STATES 91.50%SUPRANATIONAL 1.61CANADA 1.23UNITED KINGDOM 0.95GERMANY 0.78MEXICO 0.61JAPAN 0.59NETHERLANDS 0.38AUSTRALIA 0.32SWITZERLAND 0.24
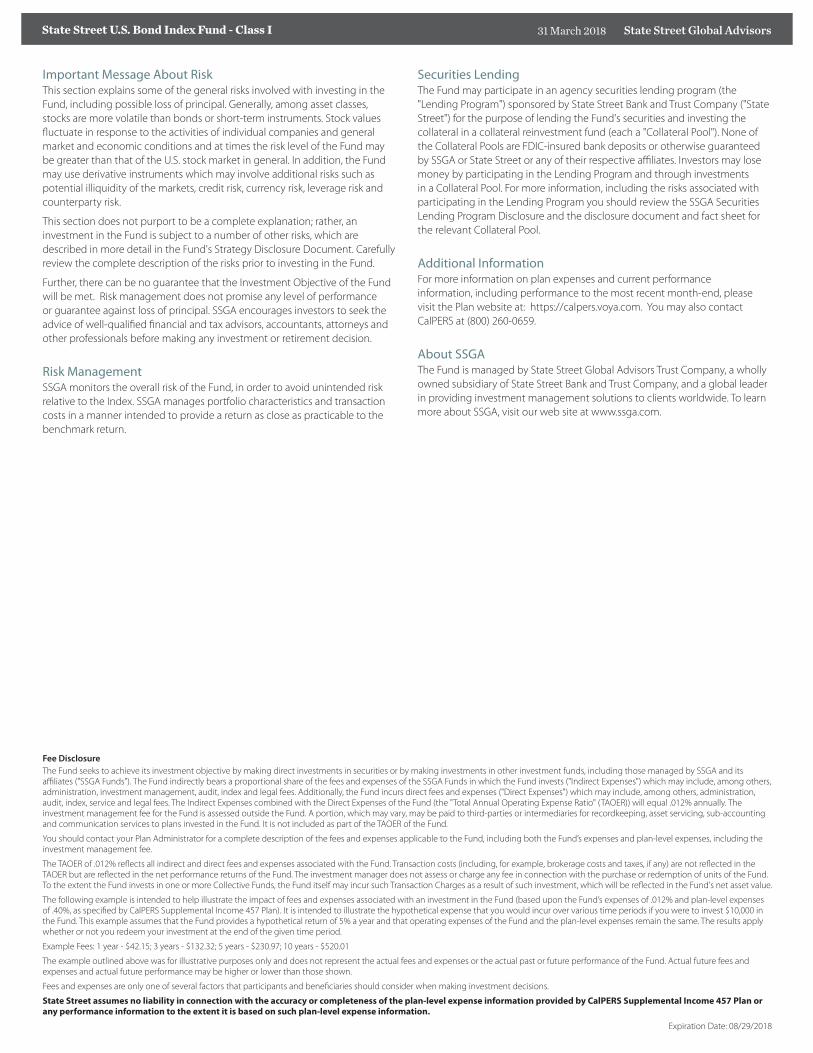
State Street Global AdvisorsState Street U.S. Bond Index Fund - Class I 31 March 2018
Important Message About RiskThis section explains some of the general risks involved with investing in the Fund, including possible loss of principal. Generally, among asset classes, stocks are more volatile than bonds or short-term instruments. Stock values fluctuate in response to the activities of individual companies and general market and economic conditions and at times the risk level of the Fund may be greater than that of the U.S. stock market in general. In addition, the Fund may use derivative instruments which may involve additional risks such as potential illiquidity of the markets, credit risk, currency risk, leverage risk and counterparty risk.
This section does not purport to be a complete explanation; rather, an investment in the Fund is subject to a number of other risks, which are described in more detail in the Fund's Strategy Disclosure Document. Carefully review the complete description of the risks prior to investing in the Fund.
Further, there can be no guarantee that the Investment Objective of the Fund will be met. Risk management does not promise any level of performance or guarantee against loss of principal. SSGA encourages investors to seek the advice of well-qualified financial and tax advisors, accountants, attorneys and other professionals before making any investment or retirement decision.
Risk ManagementSSGA monitors the overall risk of the Fund, in order to avoid unintended risk relative to the Index. SSGA manages portfolio characteristics and transaction costs in a manner intended to provide a return as close as practicable to the benchmark return.
Securities LendingThe Fund may participate in an agency securities lending program (the "Lending Program") sponsored by State Street Bank and Trust Company ("State Street") for the purpose of lending the Fund's securities and investing the collateral in a collateral reinvestment fund (each a "Collateral Pool"). None of the Collateral Pools are FDIC-insured bank deposits or otherwise guaranteed by SSGA or State Street or any of their respective affiliates. Investors may lose money by participating in the Lending Program and through investments in a Collateral Pool. For more information, including the risks associated with participating in the Lending Program you should review the SSGA Securities Lending Program Disclosure and the disclosure document and fact sheet for the relevant Collateral Pool.
Additional InformationFor more information on plan expenses and current performance information, including performance to the most recent month-end, please visit the Plan website at: https://calpers.voya.com. You may also contact CalPERS at (800) 260-0659.
About SSGAThe Fund is managed by State Street Global Advisors Trust Company, a wholly owned subsidiary of State Street Bank and Trust Company, and a global leader in providing investment management solutions to clients worldwide. To learn more about SSGA, visit our web site at www.ssga.com.
Fee DisclosureThe Fund seeks to achieve its investment objective by making direct investments in securities or by making investments in other investment funds, including those managed by SSGA and its affiliates ("SSGA Funds"). The Fund indirectly bears a proportional share of the fees and expenses of the SSGA Funds in which the Fund invests ("Indirect Expenses") which may include, among others, administration, investment management, audit, index and legal fees. Additionally, the Fund incurs direct fees and expenses ("Direct Expenses") which may include, among others, administration, audit, index, service and legal fees. The Indirect Expenses combined with the Direct Expenses of the Fund (the "Total Annual Operating Expense Ratio" (TAOER)) will equal .012% annually. The investment management fee for the Fund is assessed outside the Fund. A portion, which may vary, may be paid to third-parties or intermediaries for recordkeeping, asset servicing, sub-accounting and communication services to plans invested in the Fund. It is not included as part of the TAOER of the Fund.
You should contact your Plan Administrator for a complete description of the fees and expenses applicable to the Fund, including both the Fund’s expenses and plan-level expenses, including the investment management fee.
The TAOER of .012% reflects all indirect and direct fees and expenses associated with the Fund. Transaction costs (including, for example, brokerage costs and taxes, if any) are not reflected in the TAOER but are reflected in the net performance returns of the Fund. The investment manager does not assess or charge any fee in connection with the purchase or redemption of units of the Fund. To the extent the Fund invests in one or more Collective Funds, the Fund itself may incur such Transaction Charges as a result of such investment, which will be reflected in the Fund's net asset value.
The following example is intended to help illustrate the impact of fees and expenses associated with an investment in the Fund (based upon the Fund’s expenses of .012% and plan-level expenses of .40%, as specified by CalPERS Supplemental Income 457 Plan). It is intended to illustrate the hypothetical expense that you would incur over various time periods if you were to invest $10,000 in the Fund. This example assumes that the Fund provides a hypothetical return of 5% a year and that operating expenses of the Fund and the plan-level expenses remain the same. The results apply whether or not you redeem your investment at the end of the given time period.
Example Fees: 1 year - $42.15; 3 years - $132.32; 5 years - $230.97; 10 years - $520.01
The example outlined above was for illustrative purposes only and does not represent the actual fees and expenses or the actual past or future performance of the Fund. Actual future fees and expenses and actual future performance may be higher or lower than those shown.
Fees and expenses are only one of several factors that participants and beneficiaries should consider when making investment decisions.
State Street assumes no liability in connection with the accuracy or completeness of the plan-level expense information provided by CalPERS Supplemental Income 457 Plan or any performance information to the extent it is based on such plan-level expense information.
Expiration Date: 08/29/2018