CalPERS California Initiative 2008 · CalPERS California Initiative Annual Report 2008 | 3...
27
CalPERS California Initiative 2008 Creating Opportunities in California’s Underserved Markets
-
Upload
vuongduong -
Category
Documents
-
view
218 -
download
1
Transcript of CalPERS California Initiative 2008 · CalPERS California Initiative Annual Report 2008 | 3...

CalPERS California Initiative 2008
Creating Opportunities in California’s Underserved Markets

Alameda
Alpine
Amador
Butte
Calaveras
Colusa
ContraCosta
Del Norte
El Dorado
Fresno
Glenn
Humboldt
Imperial
Inyo
Kern
Kings
Lake
Lassen
Los Angeles
Madera
Marin
Mariposa
Mendocino
Merced
Modoc
Mono
Monterey
Napa
Nevada
Orange
Placer
Plumas
Riverside
Sacramento
San Benito
San Bernardino
San Diego
San Joaquin
San Luis Obispo
San Mateo
San Francisco
Santa Barbara
Santa Clara
Santa Cruz
Shasta
Sierra
Siskiyou
Solano
Sonoma
Stanislaus
Sutter
Tehama
Trinity
Tulare
Tuolumne
Ventura
Yolo
Yuba
Objectives of the CalPERS California InitiativeThe California Initiative seeks to invest in traditionally
underserved markets, primarily, but not exclusively, located
in California. The initiative seeks to discover and invest in
opportunities that may have been bypassed or not reviewed
by other sources of investment capital. The California
Initiative’s primary objective is to generate attractive
financial returns, meeting or exceeding private equity
benchmarks. As an ancillary benefit, the California Initiative
seeks to have a meaningful impact on the economic
infrastructure of California’s underserved markets by:
· Providing capital to areas that have historically
had limited access to institutional equity capital
· Employing workers who reside in economically
disadvantaged areas
· Supporting women and minority entrepreneurs
and managers

Table of Contents
Introduction . . . . . . . . . . . . . . . . . . . . . . . . . . . . . . . . . 3
Highlights . . . . . . . . . . . . . . . . . . . . . . . . . . . . . . . . . . 4
Profile . . . . . . . . . . . . . . . . . . . . . . . . . . . . . . . . . . . 4
Objective 1 – Providing capital to areas of California and the United States that have historically had limited access to equity capital. . . . . . . . . . . . . . . . 4
Objective 2 – Employing workers living in economically disadvantaged areas . . . . . . . 5
Objective 3 – Supporting women and minority entrepreneurs and managers . . . . . . . . 5
Profile – California Initiative Companies . . . . . . . . . . . . . . . . . . . 6
Employment and Employment Growth . . . . . . . . . . . . . . . . . . . . . . 6
Company Locations . . . . . . . . . . . . . . . . . . . . . . . . . . . . . . 9
Portfolio Diversification . . . . . . . . . . . . . . . . . . . . . . . . . . . . 11
Job Quality . . . . . . . . . . . . . . . . . . . . . . . . . . . . . . . . . 12
Suppliers . . . . . . . . . . . . . . . . . . . . . . . . . . . . . . . . . . 14
Patents . . . . . . . . . . . . . . . . . . . . . . . . . . . . . . . . . . . 14
CalPERS California Initiative – Investing in Underserved Markets . . . . . . . 15
Objective 1 – Providing capital to areas of California and the United States that have historically had limited access to equity capital. . . . . . . . . . . . . . . . 15
Objective 2 – Employing workers living in economically disadvantaged areas . . . . . . . 16
Objective 3 – Supporting women and minority entrepreneurs and managers . . . . . . . . 19
Endnotes . . . . . . . . . . . . . . . . . . . . . . . . . . . . . . . . . . 21
Banc of America Capital Access Funds Report . . . . . . . . . . . . . . . . 24

CalPERS California Initiative Annual Report 2008 | 3
Introduction
The California Public Employees’ Retirement System (CalPERS)
is the nation’s largest public pension fund. In 1990, the CalPERS
Investment Committee established the Alternative Investment
Management (AIM) program to specialize in private equity
investments, and today CalPERS is one of the largest private
equity investors in the world. The goal of the AIM program is
to “capitalize on marketplace opportunities in order to achieve
superior risk-adjusted returns.” Consistent with this goal, in
2001 the CalPERS Investment Committee established, and the
AIM team implemented, the California Initiative to invest
private equity in “traditionally underserved markets, primarily,
but not exclusively located in California.” 1
The California Initiative was launched with a capital
commitment of $475 million to nine private equity funds
and one fund-of-funds. This initial allocation is known as
Phase I. In October 2006, CalPERS made a second allocation,
a $500 million capital commitment to be managed by
Hamilton Lane, a leading private equity investment manager.
CalPERS and Hamilton Lane established an investment vehicle
known as the Golden State Investment Fund (GSIF), which
seeks to invest in both partnerships and direct co-investments
located primarily in California. The capital commitment to
GSIF was later increased to $550 million. As of June 30, 2008,
through the GSIF, Hamilton Lane had invested in eight private
equity funds and made seven direct co-investments.
The primary objective of the California Initiative –
comprised of both Phase I and GSIF – is to generate attractive
financial returns, meeting or exceeding private equity
benchmarks. As an ancillary benefit, the California Initiative
seeks to create jobs and promote economic opportunity
in underserved communities, primarily, but not exclusively
in California, by providing capital to companies that:
Are located in areas of California and the nation •
that have traditionally had limited access to
institutional equity capital,
Are located in, or employ workers living in, •
economically disadvantaged areas, and
Support women and minority entrepreneurs •
and managers.
This report focuses on the ancillary benefits derived
from both allocations of the California Initiative, with an
increased focus on the GSIF, now in its second year.
CalPERS and Hamilton Lane engaged Pacific Community
Ventures (PCV), a leader in measuring and interpreting
community outcomes of private equity investments, to
collect, analyze, and report on the California Initiative’s
ancillary benefits. Beginning with Phase I in 2005, 2008 is
the fourth year PCV has collected and analyzed data from
California Initiative portfolio companies.

4 | CalPERS California Initiative Annual Report 2008 CalPERS California Initiative Annual Report 2008 | 5
Highlights
Since the inception of the California Initiative in 2001,
281 companies have received investment through Phase I
and the Golden State Investment Fund (GSIF). Of the
249 companies in Phase I, 129 have received funding through
a $100 million separate fund-of-funds account, allocated
to the Banc of America California Community Venture
Fund (BACCVF). Except where otherwise noted, Creating
Opportunities in California’s Underserved Markets focuses
on data provided by 99 active Phase I and GSIF portfolio
companies (excluding BACCVF) as of June 30, 2008.2
BACCVF reports the community benefits derived from
its fund-of-funds in a separate document — see page 24
for a copy of that report.
Profile
Over 70 percent of active California Initiative companies are
headquartered in California. Nearly 75 percent of the capital
committed to GSIF active portfolio companies and 30 percent
of capital committed to Phase I active portfolio companies
have been invested in companies headquartered in California.
Including all company operating locations, more than half
of GSIF dollars and approximately 30 percent of all Phase I
dollars have been invested in California. 3 In addition, over
twenty percent of Phase I capital invested in active portfolio
companies has been invested in companies that employ
approximately one-quarter of their workforce in California,
although they are headquartered elsewhere and operate
few California facilities. Portfolio companies range in size
from fewer than 10 to more than 5,000 employees, with
the majority of portfolio companies (55 percent) employing
between 11 and 100 workers.
Since the inception of the California Initiative,
134 companies have participated in at least one data
collection effort. Employment growth since investment
at these companies is 21 percent in California and 5 percent
overall. The 99 active portfolio companies that provided data
for this assessment show employment growth of 24 percent
in California and 10 percent overall since investment.
California Initiative Key Milestones 4
(Excluding BACCVF)
Total dollars committed to the California Initiative $925 million 5
Total number of companies receiving investment 152 6
Percent of companies headquartered in California 70%
Jobs created since investment in the United States/California 4,135/2,933
Total employment at active portfolio companies 53,773
Percent of employees living in low and moderate income areas7 76%
Percent of portfolio company employees eligible for medical coverage 8 87%
Objective 1: Providing capital to areas of California
and the United States that have historically had
limited access to equity capital.
Between 2001 and 2007, more than 80 percent of all private
equity in the United States and more than 90 percent of all
private equity in California were committed to an area made
up of 774 United States ZIP Codes (153 California ZIP Codes).
California Initiative portfolio companies located outside of
this area are considered to be located in an area that has
historically had limited access to institutional equity capital.
Across California, only 25 percent of all companies
receiving private equity investment are located in areas that
have historically had limited access to institutional equity
capital. By contrast, 44 percent of all California Initiative
companies – including over 60 percent of GSIF companies –
are located in areas that have historically had limited access
to institutional equity capital, clearly indicating that the
initiative’s efforts to direct capital to these areas is working.

4 | CalPERS California Initiative Annual Report 2008 CalPERS California Initiative Annual Report 2008 | 5
Objective 2: Employing workers living in
economically disadvantaged areas
In total, active California Initiative portfolio companies employ
over 50,000 workers, approximately half of whom live in areas
predominantly comprised of low and moderate (LMI) income
census tracts. Over 60 percent of GSIF portfolio company
employees are considered LMI workers, based on an analysis
of both employee wage and residence location. Combined,
these statistics indicate that the California Initiative is fulfilling
its mission to provide employment opportunities to disadvan-
taged workers.9
Objective 3: Supporting women and minority
entrepreneurs and managers
When private equity dollars are invested in a company, the
ownership often shifts from individuals to a fund, or group
of funds. Given that ownership is transferred at the time of
investment, the number of current female and minority
officers (e.g., Chief Executive Officer, Chief Financial Officer,
Chief Operating Officer) is used as a proxy to better under-
stand the proportion of women and minority entrepreneurs
at portfolio companies.
Over 40 percent of Phase I investment dollars and
50 percent of GSIF dollars are committed to 47 companies
where there is at least one female officer, and over 40 percent
of Phase I investment dollars and 60 percent of GSIF dollars
are committed to 46 companies with at least one minority
officer. As company officers, these women and minorities
have substantial input into the management and growth
of these companies.
As a frame of reference, the proportion of women and
minority executives at California Initiative companies is greater
than the proportion of comparable businesses in the United
States that are women or minority-owned. At Phase I compa-
nies, 16 percent of officers are women and 22 percent are
minorities, compared to 10 percent of similar United States
businesses that are women-owned, and 6 percent that are
minority-owned. 10

6 | CalPERS California Initiative Annual Report 2008 CalPERS California Initiative Annual Report 2008 | 7
Profile – California Initiative Companies
Since the inception of the California Initiative,
281 companies have received investment through either
Phase I (249 companies) or GSIF (32 companies). Of the
249 companies in Phase I, 129 companies have received
funding through a $100 million separate fund-of-funds
account allocated to the Banc of America California Community
Venture Fund (BACCVF). Except where otherwise noted,
this report focuses on data provided by 99 active Phase I
and GSIF portfolio companies (excluding BACCVF) as of
June 30, 2008. BACCVF reports the community benefits
derived from its fund-of-funds separately – see the
addendum on page 24.
As of June 30, 2008, private equity funds that received
capital through the California Initiative had active investments
in 106 companies; 74 in Phase I and 32 in GSIF. Between
June 30, 2007 and June 30, 2008, 12 companies that received
investment from Phase I partners exited the portfolio,
bringing the total number of fully realized investments
over the life of the California Initiative to 46.
Of the 152 companies that have received investment
throughout the life of the California Initiative, 134 (88 percent)
have provided data for this report at some point during
investment. Ninety-nine active companies (93 percent)
provided data as of June 30, 2008: 68 (92 percent)
Phase I portfolio companies and 31 (97 percent) GSIF
portfolio companies.
California Initiative Portfolio Investments (Excluding BACCVF)
Phase I GSIF
Total California Initiative
Received investment 120 32 152
Active companies (as of June 30, 2008)
74 (62%) 32 (100%) 106 (70%)
Fully realized (as of June 30, 2008)
46 (38%) 0 46 (30%)
Active companies, contributed data 2008 68 (92%) 31 (97%)11 99 (93%)
All companies ever reporting, including fully realized invest-ments.
103 (86%) 31(97%) 134 (88%)
Employment and Employment Growth
The rate of employment growth at California Initiative
companies exceeds the employment growth rate across the
United States and California. Since 2005, 103 Phase I and
31 GSIF portfolio companies have contributed data to at
least one assessment effort. At time of investment, these
134 California Initiative portfolio companies employed a total
of 83,607 employees, including 13,778 Californians. The most
recent data available from these companies shows employ-
ment growth of 5 percent overall (4,135 net new jobs) and
21 percent in California (2,933 net new jobs) since investment.
By comparison, between 2001 and 2008, employment grew
4 percent across the country and 3 percent in California.12
The first GSIF portfolio company investment was made
in 2007. By June 30, 2008, GSIF managers had closed invest-
ments in 32 companies. At time of investment, GSIF portfolio
6 | CalPERS California Initiative Annual Report 2008 CalPERS California Initiative Annual Report 2008 | 7
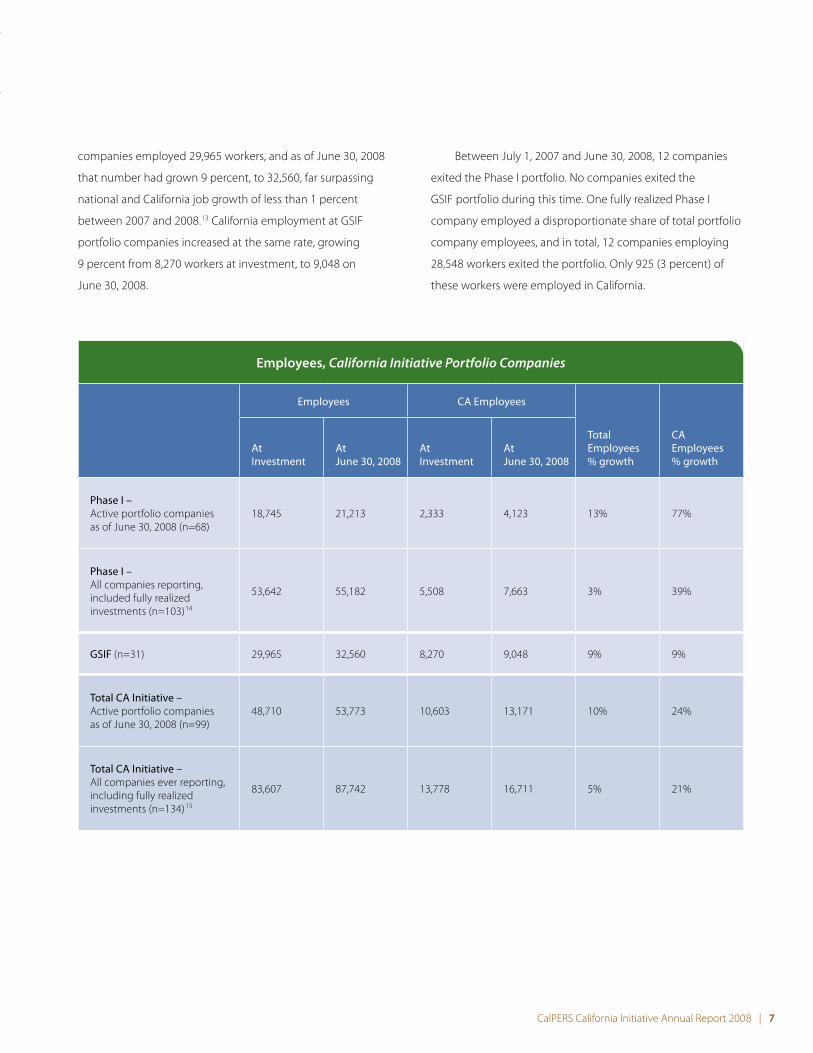
companies employed 29,965 workers, and as of June 30, 2008
that number had grown 9 percent, to 32,560, far surpassing
national and California job growth of less than 1 percent
between 2007 and 2008.13 California employment at GSIF
portfolio companies increased at the same rate, growing
9 percent from 8,270 workers at investment, to 9,048 on
June 30, 2008.
Employees, California Initiative Portfolio Companies
Employees CA Employees
At Investment
At June 30, 2008
At Investment
At June 30, 2008
Total Employees % growth
CA Employees % growth
Phase I – Active portfolio companies as of June 30, 2008 (n=68)
18,745 21,213 2,333 4,123 13% 77%
Phase I – All companies reporting, included fully realized investments (n=103)14
53,642 55,182 5,508 7,663 3% 39%
GSIF (n=31) 29,965 32,560 8,270 9,048 9% 9%
Total CA Initiative – Active portfolio companies as of June 30, 2008 (n=99)
48,710 53,773 10,603 13,171 10% 24%
Total CA Initiative – All companies ever reporting, including fully realized investments (n=134)15
83,607 87,742 13,778 16,711 5% 21%
Between July 1, 2007 and June 30, 2008, 12 companies
exited the Phase I portfolio. No companies exited the
GSIF portfolio during this time. One fully realized Phase I
company employed a disproportionate share of total portfolio
company employees, and in total, 12 companies employing
28,548 workers exited the portfolio. Only 925 (3 percent) of
these workers were employed in California.
8 | CalPERS California Initiative Annual Report 2008 CalPERS California Initiative Annual Report 2008 | 9
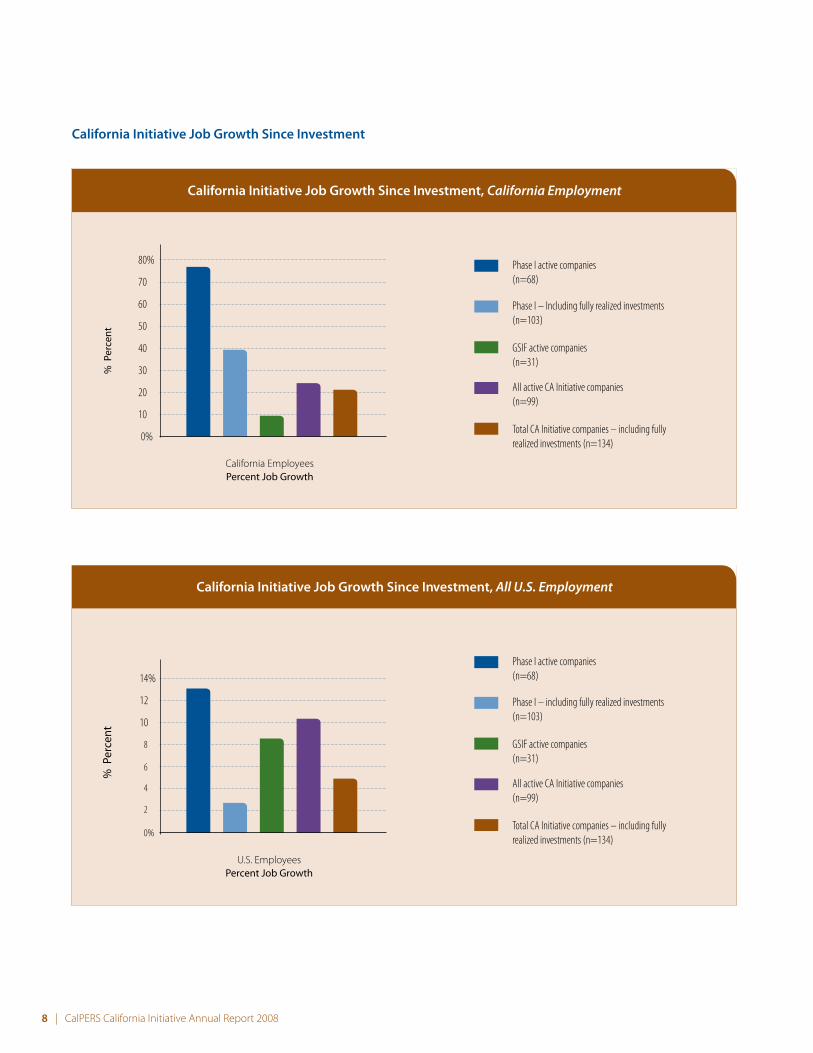
California Initiative Job Growth Since Investment
0%
California EmployeesPercent Job Growth
% P
erce
nt
10
20
30
40
50
60
70
80% Phase I active companies(n=68)
Phase I – Including fully realized investments (n=103)
GSIF active companies (n=31)
All active CA Initiative companies (n=99)
Total CA Initiative companies – including fully realized investments (n=134)
California Initiative Job Growth Since Investment, California Employment
0%
2
4
6
8
U.S. EmployeesPercent Job Growth
% P
erce
nt
10
12
14%Phase I active companies(n=68)
Phase I – including fully realized investments (n=103)
GSIF active companies (n=31)
All active CA Initiative companies (n=99)
Total CA Initiative companies – including fully realized investments (n=134)
California Initiative Job Growth Since Investment, All U.S. Employment

8 | CalPERS California Initiative Annual Report 2008 CalPERS California Initiative Annual Report 2008 | 9
Company Locations
The 99 active California Initiative portfolio companies that
contributed data in 2008 operate 2,410 total locations,
including both headquarters and facilities; 73 percent of these
companies are headquartered in California. Nearly 75 percent
of the capital invested in GSIF portfolio companies, and
30 percent of that invested in Phase I companies, have been
invested in companies headquartered in California. Including
all company locations, approximately 30 percent of Phase I
dollars and more than half of GSIF dollars committed to
date have been invested in California.16 In addition, over
twenty percent of Phase I capital invested in active portfolio
companies has been invested in companies that employ
approximately one-quarter of their workforce in California,
although they are headquartered elsewhere and operate
few California facilities.
Operating Locations, California Initiative Portfolio Companies
Active Portfolio Companies Headquarters Facilities Total
Phase I 68 945 1,013
Phase I in California 49 (72%) 171 (18%) 220 (22%)
GSIF 32 1,365 1,397
GSIF in California 24 (75%) 317 (23%) 341 (24%)
Total California Initiative 100 2,310 2,410
Total California Initiative in California 73 (73%) 488 (21%) 561 (23%)

10 | CalPERS California Initiative Annual Report 2008 CalPERS California Initiative Annual Report 2008 | 11
California Initiative Portfolio Company Locations

10 | CalPERS California Initiative Annual Report 2008 CalPERS California Initiative Annual Report 2008 | 11
Portfolio Diversification
California Initiative portfolio companies operate across
a variety of industries.
% Percent
0% 5 10 15 20 25 30 35 40 45%
Phase I active companies, (n=68)
GSIF active companies, (n=32)
Portfolio Diversification by Industry
Services
Transportation
Biopharma/Medical/Health
Communications
Consumer
Finance Related
IndustrialManufacturing
InformationTechnology
Media% Percent
0% 5 10 15 20 25 30 35 40%
Phase I active companies, (n=68)
GSIF active companies, (n=31)
California Initiative Active PortfolioCompanies by Employee Size
5000 +
1001–5000
501–1000
101–500
51–100
11–50
1–10
Empl
oyee
s
Portfolio companies also range in size from fewer than
10 to more than 5,000 employees. The majority of portfolio
companies (54 percent) employ between 11 and 100 workers.

12 | CalPERS California Initiative Annual Report 2008 CalPERS California Initiative Annual Report 2008 | 13
Evaluating the California Initiative’s Ancillary Benefits: New Developments in Methodology
With the addition of GSIF, CalPERS, Hamilton Lane, and PCV implemented expanded data collection
and analytical methods. These changes are described below.
Benefit percentiles
Phase I companies collect benefits data categorically,
with each company reporting data in quartile ranges.
GSIF portfolio companies report the absolute number of
employees eligible for and enrolled in each benefit. The
GSIF approach allows for better comparisons to State and
national data, while also providing a better picture of job
quality for portfolio company employees.
Patents granted
GSIF portfolio companies also report the number of
patents granted to the company annually. The number
of patents granted is an indicator of innovation, which
often precedes job growth at a company.
Employee wages
In order to assess employee economic status at
GSIF portfolio companies, PCV collected the wage
and ZIP Code of every employee. (To maintain employee
confidentiality, PCV collected no identifying information.)
Analyzing wages in combination with the associated
ZIP Code produces a more accurate assessment of
economic status. GSIF portfolio companies also
report the ZIP Codes of all operating locations, not
just those in California (as in Phase I). This additional
data provides a more complete picture of the portfolio
company communities.
Job Quality
At both Phase I and GSIF portfolio companies, job quality –
comprised of medical coverage, retirement plans, and paid
sick and vacation leave – compares favorably to job quality
at companies in California and the United States. A higher
percentage of Phase I companies offer employee benefits –
including medical insurance, retirement plans, vacation
and sick leave – than companies in the United States and
California. Ninety-six percent of Phase I companies provide
medical insurance to at least some of their employees
compared to 62 percent of U.S. companies and 71 percent
of California companies.17 The majority of Phase I companies
(84 percent) provide medical insurance to between
76 percent and 100 percent of their employees, whereas
71 percent of U.S. and 80 percent of California employees
are eligible for employer-based medical insurance.18 Of those
companies that provide medical insurance, 98 percent have
enrolled at least some employees, and 64 percent have
enrolled 76 percent to 100 percent of eligible employees.
Phase I companies also compare favorably to the United
States in the provision of employee retirement benefits,
sick leave, and paid vacation.
12 | CalPERS California Initiative Annual Report 2008 CalPERS California Initiative Annual Report 2008 | 13
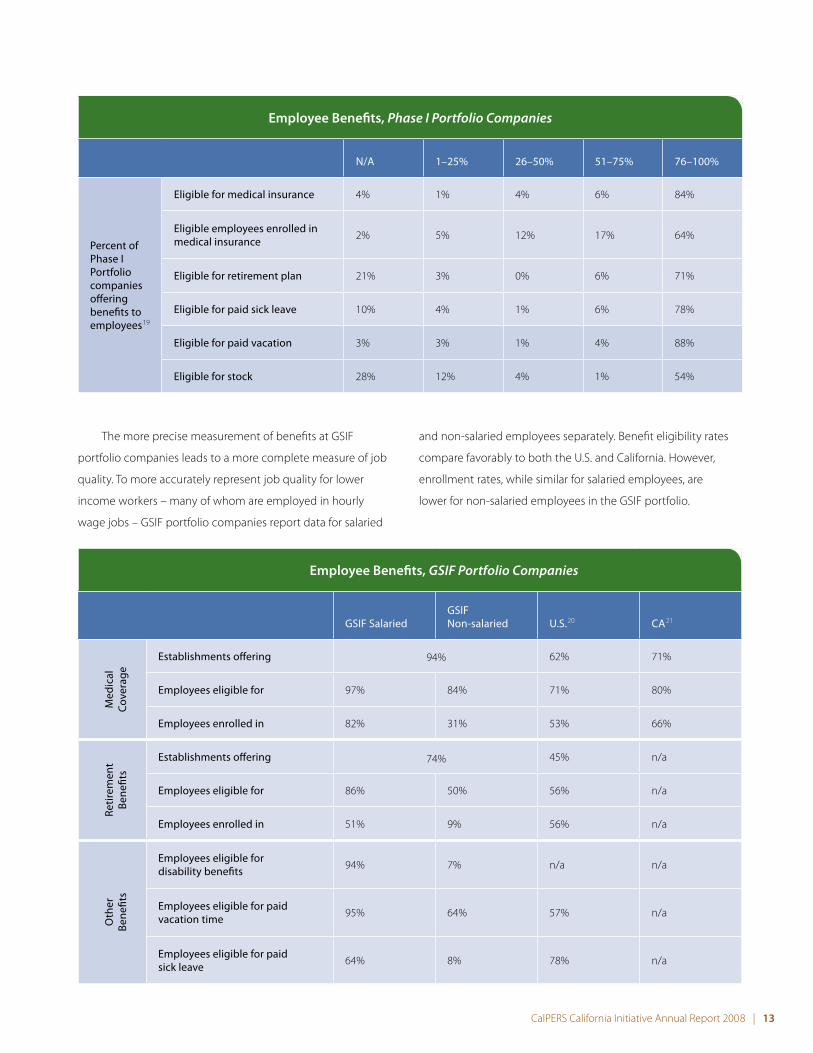
Employee Benefits, Phase I Portfolio Companies
N/A 1–25% 26–50% 51–75% 76–100%
Percent of Phase I Portfolio companies offering benefits to employees19
Eligible for medical insurance 4% 1% 4% 6% 84%
Eligible employees enrolled in medical insurance 2% 5% 12% 17% 64%
Eligible for retirement plan 21% 3% 0% 6% 71%
Eligible for paid sick leave 10% 4% 1% 6% 78%
Eligible for paid vacation 3% 3% 1% 4% 88%
Eligible for stock 28% 12% 4% 1% 54%
The more precise measurement of benefits at GSIF
portfolio companies leads to a more complete measure of job
quality. To more accurately represent job quality for lower
income workers – many of whom are employed in hourly
wage jobs – GSIF portfolio companies report data for salaried
and non-salaried employees separately. Benefit eligibility rates
compare favorably to both the U.S. and California. However,
enrollment rates, while similar for salaried employees, are
lower for non-salaried employees in the GSIF portfolio.
Employee Benefits, GSIF Portfolio Companies
GSIF SalariedGSIFNon-salaried U.S.20 CA21
Med
ical
Co
vera
ge
Establishments offering 62% 71%
Employees eligible for 97% 84% 71% 80%
Employees enrolled in 82% 31% 53% 66%
Retir
emen
t Be
nefit
s
Establishments offering 45% n/a
Employees eligible for 86% 50% 56% n/a
Employees enrolled in 51% 9% 56% n/a
Oth
er
Bene
fits
Employees eligible for disability benefits 94% 7% n/a n/a
Employees eligible for paid vacation time 95% 64% 57% n/a
Employees eligible for paid sick leave 64% 8% 78% n/a
94%
74%

14 | CalPERS California Initiative Annual Report 2008 CalPERS California Initiative Annual Report 2008 | 15
Health insurance enrollment rates for non-salaried
employees are most likely low because lower income
employees often cannot afford to pay the share of the
premium not covered by the employer. Premium costs in
California rose twice as fast as inflation over the last several
years,22 and both employers and employees have trouble
keeping up with the rising costs.
Job quality changes since investment
The influx of capital from GSIF investments has allowed many
portfolio companies to make changes to employee benefit
packages. Of 31 GSIF companies, 12 (40 percent) made
changes to their benefit plans between July 1, 2007 and
June 30, 2008. Of these 12, nine companies added employee
benefits, one company made the benefits easier for employ-
ees to access, one company changed plan provider, and
one company reduced its benefits package.
Suppliers
As of June 30, 2008, California Initiative Phase I and GSIF
companies had active supplier relationships23 with nearly
9,000 and over 30,000 vendors, respectively. In addition to the
boost to the economy provided directly by California Initiative
portfolio companies, nearly 14,000 other California businesses
(34 percent of all Phase I and GSIF suppliers) have been
indirectly supported by this capital investment.
Patents
GSIF portfolio companies report the number of patents
granted to them annually. Three new patents were granted
to two portfolio companies between July 1, 2007 and
June 30, 2008. GSIF patent rates compare favorably to both
the U.S. and California, where patent growth rates were
negative between 2006 and 2007.24
14 | CalPERS California Initiative Annual Report 2008 CalPERS California Initiative Annual Report 2008 | 15
CalPERS California Initiative – Investing in Underserved Markets
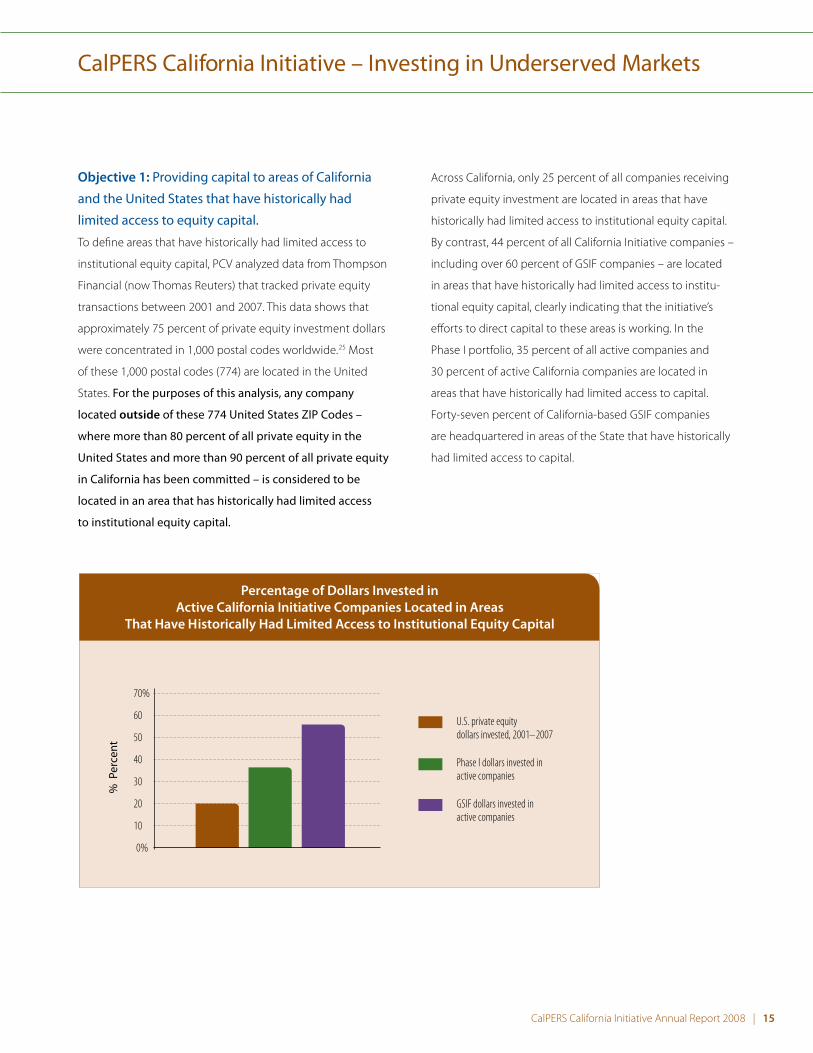
Objective 1: Providing capital to areas of California
and the United States that have historically had
limited access to equity capital.
To define areas that have historically had limited access to
institutional equity capital, PCV analyzed data from Thompson
Financial (now Thomas Reuters) that tracked private equity
transactions between 2001 and 2007. This data shows that
approximately 75 percent of private equity investment dollars
were concentrated in 1,000 postal codes worldwide.25 Most
of these 1,000 postal codes (774) are located in the United
States. For the purposes of this analysis, any company
located outside of these 774 United States ZIP Codes –
where more than 80 percent of all private equity in the
United States and more than 90 percent of all private equity
in California has been committed – is considered to be
located in an area that has historically had limited access
to institutional equity capital.
Across California, only 25 percent of all companies receiving
private equity investment are located in areas that have
historically had limited access to institutional equity capital.
By contrast, 44 percent of all California Initiative companies –
including over 60 percent of GSIF companies – are located
in areas that have historically had limited access to institu-
tional equity capital, clearly indicating that the initiative’s
efforts to direct capital to these areas is working. In the
Phase I portfolio, 35 percent of all active companies and
30 percent of active California companies are located in
areas that have historically had limited access to capital.
Forty-seven percent of California-based GSIF companies
are headquartered in areas of the State that have historically
had limited access to capital.
0%
% P
erce
nt
10
20
30
40
50
60
70%
U.S. private equitydollars invested, 2001–2007
Phase I dollars invested in active companies
GSIF dollars invested in active companies
Percentage of Dollars Invested in Active California Initiative Companies Located in Areas
That Have Historically Had Limited Access to Institutional Equity Capital

16 | CalPERS California Initiative Annual Report 2008 CalPERS California Initiative Annual Report 2008 | 17
Objective 2: Employing workers living in
economically disadvantaged areas
California Initiative portfolio companies benefit low and
moderate income (LMI) workers in two ways. First, companies
provide quality jobs to residents of LMI areas. Second,
companies that are headquartered or operate facilities in
LMI areas bring economic activity to distressed neighbor-
hoods, indirectly supporting the creation of more jobs.
To assess the extent to which California Initiative
companies are supporting employment for residents of
LMI areas, PCV examines areas where companies operate
as well as where company employees live.26
In the Phase I portfolio, over 80 percent of company
headquarters and operating facilities are located in
LMI areas.27 GSIF portfolio companies have a total of
1,39528 operating locations, including both facilities and
headquarters; 73 percent are located in LMI areas.
Eighty-seven percent of employees at Phase I portfolio
companies can be classified as living in LMI areas, including
51 percent of employees who live in predominantly low
income areas.29
Employees Living, and Companies Located, in Low and Moderate Income Geographies
Located in a Zip Code that Overlaps with LMI Census Tract
Located in a Zip Code that is Predominantly Comprised of LMI Census Tracts Total LMI Not LMI
Phas
e I
Headquarters (n=68) 35 (51%) 22 (32%) 57 (84%) 11(16%)
California headquarters 29 (59%) 13 (27%) 42 (86%) 7 (14%)
California facilities 77 (45%) 64 (38%) 141 (83%) 29 (17%)
California employees 1,454 (36%) 2,054 (51%) 3,508 (87%) 514 (13%)
GSI
F
Headquarters (n=30)30 17 (57%) 7 (23%) 24 (80%) 8 (20%)
California headquarters 14 (58%) 6 (25%) 20 (83%) 4 (17%)
Facilities 651 (48%) 339 (25%) 990 (73%) 375 (27%)
California facilities 142 (45%) 118 (37%) 260 (82%) 57 (18%)
Employees 31 12,718 (40%) 11,535 (36%) 24,253 (76%) 7,416 (23%)
California employees 3,383 (39%) 4,175 (48%) 7,558 (86%) 1,194 (14%)

16 | CalPERS California Initiative Annual Report 2008 CalPERS California Initiative Annual Report 2008 | 17
Not all low-income workers live in a low-income area, and not
all individuals living in low-income areas earn a low-income
wage. With the addition of new data points collected from
GSIF portfolio companies, PCV can report with greater
precision the number of LMI workers at portfolio companies.
A worker’s ZIP Code of residence and wage combine to form
a more complete picture of an individual’s economic status.
To assess the number of LMI workers at GSIF portfolio companies,
PCV has created a system to classify individual workers:
Middle/Upper Income Workers: GSIF portfolio company •
employees who earn a middle or upper income wage
are considered middle/upper income employees.
Similarly, employees who earn less than a middle
income wage, but live in middle or upper income
communities are also considered middle/upper
income workers.32 These workers likely are part of
households with other sources of income. Based on
the associated ZIP Code and wage data collected for
each employee, as of June 30, 2008, 39 percent of
all GSIF portfolio company employees are classified
middle/upper income.
Middle/Upper Income
39%
6%
Middle/Upper Income (39%)
Low and Moderate Income (61%)
Economic Status of GSIF Portfolio Employees
Moderate Income
Low-to-Moderate Income
36%
Low Income
19%

18 | CalPERS California Initiative Annual Report 2008 CalPERS California Initiative Annual Report 2008 | 19
Economic Status of Low and Moderate Income GSIF Portfolio Company Employees (n=17,576)35
Low-to-Moderate Income Workers: The remaining •
61percent of GSIF portfolio company employees are
low-to-moderate income workers for whom the
California Initiative is providing economic opportunities.
These employees both earn an LMI wage and live in
an LMI area.33 As a frame of reference, 35 percent of
all employed individuals in the United States, and
38 percent of working Californians live in LMI census
tracts. 34 For more in-depth analysis, PCV further divides
the LMI employees into three categories: low-income,
low-to-moderate income, and moderate-income.
Low Income
•Employeewageislessthan50percentoftheMedian Family Income (MFI) in the metropolitan statistical area of residence; and
•EmployeeresidenceZIPCodeoverlapswithacensustract where the median income is less than 50 percent of the Area Median Income (AMI)
•NumberofPortfolioEmployees:5,548(32%)
Low-To-Moderate Income
•Employeewageisbetween50percentand80percentof the MFI in the metropolitan statistical area of residence; and
•EmployeeresidenceZIPCodeoverlapswithacensustract where the median income is less than 50 percent of the AMI
•NumberofPortfolioEmployees:980(6%)
Low-To-Moderate Income
•Employeewageislessthan50percentoftheMFIin the metropolitan statistical area of residence; and
•EmployeeresidenceZIPCodeoverlapswithacensustract where the median income is between 50 percent and 80 percent of the AMI
•NumberofPortfolioEmployees:9,332(53%)
Moderate Income
•Employeewageisbetween50percentand80percentof the MFI in the metropolitan statistical area of residence; and
•EmployeeresidenceZIPCodeoverlapswithacensustract where the median income is between 50 percent and 80 percent of the AMI
•NumberofPortfolioEmployees:1,716(10%)
Low-To-Moderate Income
Low Income
Moderate Income
10%
53%
6%
32%
Low-To-Moderate Income
(ZIP Code where MFI is up to 80% of AMI)
(ZIP Code where MFI is less than 50% of AMI)
(Wage up to 80% of MFI)
(Wage less than 50% of MFI)
RESIDENCE RESIDENCE
WA
GE
WA
GE

18 | CalPERS California Initiative Annual Report 2008 CalPERS California Initiative Annual Report 2008 | 19
Objective 3: Supporting women and minority
entrepreneurs and managers
The third ancillary benefit assessed for the California Initiative
is the extent to which these investments support women
and minority entrepreneurs and managers. By tracking the
number of women and minority entrepreneurs, CalPERS can
better understand the role the California Initiative plays in the
training, professional development, and advancement of
these populations.
When private equity dollars are invested in a company,
ownership often shifts from individuals to a fund, or group
of funds. Prior to investment, company owners are commonly
C-level officers (e.g., Chief Executive Officer, Chief Financial
Officer, Chief Operating Officer). Accordingly, to better
understand the proportion of women and minority entrepre-
neurs at portfolio companies, officers and key managers are
used as a proxy.
The 99 active California Initiative companies employ a
total of 374 officers, an average of approximately four officers
per company. More than 40 percent of Phase I and 50 percent
of GSIF investment dollars are committed to 47 companies
where there is at least one female officer, suggesting that
women have substantial input into the management and
growth of these companies. Similarly, more than 40 percent
of Phase I and 60 percent of GSIF investment dollars are
committed to 46 companies that have at least one
minority officer.
The following table shows a breakdown of California
Initiative portfolio company officers by gender and ethnicity.
Provided as a frame of reference are ownership diversity
statistics for businesses with paid employees and $1 million
in revenue in California and the United States. Most portfolio
companies receiving investment from the California Initiative
met these criteria.
Minority and Female Officers and Key Managers, California Initiative Portfolio Companies
Phase I GSIF
Officers36 Key Managers Officers37
Key Managers38
CA Business Owners39
U.S. Business Owners40
Men 203 (84%) 500 (77%) 112 (85%) 296 (62%) 89% 90%
Women 39 (16%) 152 (23%) 20 (15%) 180 (38%) 11% 10%
Hispanic/Latino 15 (6%) 39 (6%) 6 (5%) 29 (6%) 5% 2%
African American 18 (8%) 31(5%) 2 (2%) 11 (2%) 1% 1%
Asian/Pacific Islander 12 (5%) 39 (6%) 3 (2%) 23 (5%) 11% 4%
Other Minorities 8 (3%) 7 (1%) 2 (2%) 3 (1%) 1% <1%
White 187 (78%) 534 (82%) 119 (90%) 410 (86%) 95% 98%

20 | CalPERS California Initiative Annual Report 2008 CalPERS California Initiative Annual Report 2008 | 21
0%
Female Minority
5
10
15
20
25
30
35
40% Phase I o�cers
GSIF o�cers
Phase 1 managers
GSIF managers
CA business owners
U.S. business owners
Female and Minority Entrepreneurs41
% P
erce
nt

20 | CalPERS California Initiative Annual Report 2008 CalPERS California Initiative Annual Report 2008 | 21
1 CalPERS Press Release; February 19, 2008. “CalPERS California Initiative Program Deploys Private Equity Capital to Overlooked Markets.”
2 There are a total of 106 active companies excluding the BACCVF portfolio companies. Ninety-nine of these 106 companies contributed data for this report.
3 This estimate assumes that portfolio companies allocate invested dollars evenly across operating locations.
4 As of June 30, 2008; excludes the $100 million committed to the Banc of America California Community Venture Fund.
5 Ibid.
6 Ibid. Note that headquarters location data is available for 144 of the 152 companies.
7 GSIF company employees only, as of June 30, 2008. All United States employees. Includes all employees living in ZIP Codes that overlap with low and moderate income census tracts.
8 Ibid.
9 Beginning with GSIF, portfolio companies now provide both a wage and residence ZIP Code for each employee, providing a more complete picture of workers’ economic status.
10 U.S. companies used for comparison are those that have employees and at least $1 million in revenues; this is similar to the size and makeup of most California Initiative portfolio companies.
11 Thirty-one companies contributed survey data, while for one company the only data presented in this report is the headquarters location. Any calculation that includes headquarter locations will include all 32 active GSIF portfolio companies.
12 Bureau of Labor Statistics. www.bls.gov/data/#employment
13 Ibid.
14 For fully realized investments, the data used for this analysis is the most recent data available, typically as of the June 30 prior to exit.
15 Ibid.
16 This estimate assumes that portfolio companies allocate invested dollars evenly across operating locations.
17 Bureau of Labor Statistics National Compensation Survey, March 2008. www.bls.gov/NCS/ncspubs.htm#benefits.
18 Ibid.
19 Numbers do not add to 100% due to rounding differences.
20 U.S. benchmark data from the Bureau of Labor Statistics National Compensation Survey, March 2008. www.bls.gov/NCS/ncspubs.htm#benefits.
21 California Health Care Foundation, California Employer Health Benefits Survey 2007. www.chcf.org/documents/insurance/ EmployerBenefitSurvey07.pdf
22 Ibid.
23 An “active supplier relationship” is defined as one where the company has made a purchase in the past year.
24 U.S. Patent Office. www.uspto.gov/web/offices/ac/ido/oeip/taf/ pat_tr07.htm
25 Thomson Reuters. www.thomsonreuters.com/business_units/financial/
26 Portfolio companies provide the ZIP Code for each head-quarter and facility, as well as for each employee. (In Phase I, portfolio companies reported ZIP Codes for California employ-ees and facilities only.) While employee and facility locations are defined by ZIP Codes, LMI areas are identified by census tracts. ZIP Codes can be comprised of parts of many census tracts and census tracts can contain parts of several ZIP Codes. To evaluate the extent to which California Initiative companies
Endnotes

22 | CalPERS California Initiative Annual Report 2008 CalPERS California Initiative Annual Report 2008 | 23
are supporting employment for residents of economically underserved areas, PCV made two distinctions:
ZIP Codes that overlap with LMI census tracts. These •workers and facilities may or may not be located in a lower-income census tract, but they are likely located near, and in a position to contribute to, the LMI area (20 percent of U.S. ZIP Codes fall into this category).
ZIP Codes that are predominantly (50 percent or more) •comprised of LMI census tracts. These workers and facilities are likely located in LMI areas (34 percent of U.S. ZIP Codes fall into this category).
A census tract is designated LMI if at least one of the following conditions holds true:
For census tracts within metropolitan areas, the median •income of the tract is at or below 80 percent of the metropolitan statistical area median. For census tracts outside of metropolitan areas, the median income of the tract is at or below 80 percent of the statewide, non-metropolitan area median income.
At least 20 percent of the population lives in poverty.•
The unemployment rate is at least 1.5 times the •national average.
27 Phase I companies report a total of 171 California facilities, but only 170 ZIP Codes were reported. All data referring to the LMI status of Phase I facilities deals only with these 170 locations.
28 There are 1,397 total operating locations in the GSIF profile. The LMI status of two New York City ZIP Codes cannot be determined at this time due to their proximity to the World Trade Center site. These two ZIP Codes have been left out of this analysis.
29 Phase I portfolio companies only report the ZIP Codes of California employees; thus the analysis of LMI workers is limited to California employees. Phase I companies report a total of 4,123 California employees, but provided valid ZIP Codes for 4,022 employees, a difference of 101 or 2 percent.
30 See footnote 28.
31 Companies report 32,650 employees but only 32,382 ZIP Codes, 31,669 of which are valid U.S. ZIP Codes. Companies report 9,048 employees in CA, but only 8,901 ZIP Codes, 8,752 of which are valid. Approximately 2 percent of reported ZIP Codes are either missing, refer to P.O. boxes, or do not match U.S. Postal Service ZIP Codes. All analysis has been conducted only on the valid ZIP Codes.
32 These workers earn more than 80 percent of the median family income (MFI) for the metropolitan statistical area (MSA) in which they live. Similarly, employees who earn 80 percent or less of the MFI for the MSA, but live in a ZIP Code area that is entirely comprised of middle- and upper-income census tracts, are also considered middle/upper income employees.
33 These workers earn less than 80 percent of the MFI for the MSA of residence and live in a ZIP Code that overlaps a census tract where the median income is less than 80 percent of the area median income.
34 Based on 2000 U.S. census data.
35 This analysis was conducted on all low and moderate income employees of GSIF portfolio companies whose ZIP Codes match valid U.S. lists as referenced in footnote 31. Percents do not equal 100 due to rounding differences.
36 One company with two officers and two key managers declined to provide ethnicity data. Percentages are for the total reported officers (240) and key managers (650).
37 Numbers do not equal 100 due to rounding differences.
38 Ibid.
39 CalPERS California Initiative companies report the number of women and minority officers and managers. The compari-son set for the United States and California is businesses with $1 million in revenue and paid employees that are at least 51 percent women and/or minority owned. This is the closest comparison possible for the diverse group of California Initiative companies. U.S. Census 2002 data. 2007 data unavail-able as of October 15, 2008. The census allows respondents to identify an ethnicity (Hispanic/Latino) and multiple racial categories; thus, minority categories cannot be combined for an accurate estimate of total minority-owned businesses.

22 | CalPERS California Initiative Annual Report 2008 CalPERS California Initiative Annual Report 2008 | 23
40 Ibid.
41 Because of differences between the way CalPERS and the U.S. Census Bureau collect race and ethnicity data, PCV uses the most conservative estimates for comparison. Census partici-pants can identify themselves as Hispanic/Latino as well as any other race, whereas CalPERS respondents choose the one category they most identify with. Based on U.S. Census data, between 7 and 18 percent of business owners in CA and between 6 and 8 percent of U.S. business owners are minority. PCV has elected to use the highest possible percentage for comparison in both categories. This percentage is most likely higher than the actual number.

24 | CalPERS California Initiative Annual Report 2008
Banc of America Capital Access Funds
In addition to investing in nine private equity funds, the California Initiative, working with Banc of America Capital
Access Funds (BACAF), has invested in a fund-of-funds, Banc of America California Community Venture Fund (BACCVF).
As of June 30, 2008, BACCVF had invested in 15 funds, and these funds had invested in 129 portfolio companies.1
BACAF expects its funds to ultimately invest in 150 to 175 companies. As of December 31, 2007, 90 companies of
the initial 129 remained active.
Profile of BACCVF Funds and Portfolio Companies
Of the 15 funds that have received an investment from
BACCVF, nine have an office in California. The remaining funds
are projected to have a solid lineup of California deals, based
on their networks and investing history. As of June 30, 2008,
57 (44 percent) of the 129 companies in BACCVF funds’
portfolios are headquartered in California. 2
Providing capital to areas of California and the
United States that have historically had limited
access to institutional equity capital
BACAF invests in well-run venture capital and private
equity funds that invest in companies that have one or
more of these characteristics:
Located in or employ residents of low-to-moderate •
income geographies
Owned or managed by ethnic minorities•
Owned or managed by women •
Focused on delivering products or services to •
an ethnically diverse customer base
Located in areas – urban or rural – with limited •
access to investment capital
As of December 31, 2007, 69 percent of the companies
funded by BACCVF met one or more of BACAF’s definitions of
“underserved.” Of the 15 funds that have received investment
from BACCVF, 11 (73 percent) focus on low-to-moderate
income areas or individuals. Two (13 percent) of the funds
are helping to capitalize financial institutions that provide
banking services to low-income and/or ethnic minority
consumers, and nine (60 percent) of the 15 funds focus on
ethnic minority opportunities. Many of the funds also focus
on one or more of the other components of BACAF’s
definition of an underserved company.
Of the 90 companies in BACCVF funds’ portfolios as
of December 31, 2007, eight (9 percent) are located in
areas of the United States classified by the Initiative for a
Competitive Inner City (ICIC) as Inner City, where venture
capital has not traditionally been invested.3 Two (2 percent)
of the 90 companies are located in rural areas of the United
States as defined by the U.S. Department of Agriculture.
Employing workers living in economically
disadvantaged areas
Twenty-nine (32 percent) of the companies in BACCVF
funds’ portfolios as of December 31, 2007, are located in a
low-to-moderate income area. Twenty-one (23 percent)
are located in census tracts where 20 percent or more of
the population live in households with income below the
federal poverty level. Twenty-three (25 percent) of the
companies are located in census tracts where the median
income is at or below 80 percent of median income for
the surrounding area.
Supporting women and minority entrepreneurs
and managers
Nine (60 percent) of the 15 funds receiving investment
through BACCVF focus on creating opportunities for ethnic
minorities. Eleven (73 percent) of the funds have at least one
ethnic minority partner, and 10 (67 percent) of the funds have
two or more ethnic minority partners. Six (40 percent) of the
funds have at least one female partner.

1 Includes companies held by BACAF portfolio funds that were subsequently
exited; one company is held by two funds.
2 Includes companies held by BACAF portfolio funds that were subsequently
exited; one company is held by two funds.
3 Inner Cities are defined as core urban areas that currently have higher
unemployment and poverty rates and lower media income levels than
surrounding Metropolitan Statistical Areas (MSA). Inner Cities have a 20 percent
poverty rate or higher, or meet two of the following three criteria: poverty
rate 1.5x or more than that of MSAs; median household income of 50 percent
or less that of their MSAs; unemployment rate of 1.5x times or more than that
of their MSAs.
4 Owned refers to a 50 percent or higher ownership stake; managed refers
to the CEO.
5 Includes companies held by BACAF portfolio funds that were subsequently
exited; one company is held by two funds.
Twenty-five (28 percent) of the companies in BACCVF
funds’ portfolios as of December 31, 2007, are majority-owned
or managed 4 by minorities. Thirty-five (39 percent) of the
companies are located in census tracts where more than half
the population is an ethnic minority. Forty-five (50 percent)
had some minority ownership, and 38 (42 percent) of the
companies had some female ownership.
In 21(23 percent) of the companies active as of
Dec. 31, 2007, the CEO is a minority. The CEO is African
American in seven of the 21, Hispanic in seven, and Asian
in six. Three companies have female CEOs. All 90 companies
in the BACCVF employed a total of 19,008 employees;
5,983 (31 percent) of these employees were ethnic minorities
and 8,779 (46 percent) were women.5

California Public Employees’ Retirement System
400 Q Street | Sacramento, CA 95811
www.calpers.ca.gov
For more information, please contact:
Hamilton Lane | www.hamiltonlane.com
Golden State Investment Fund | www.gsif.com
Printed on 30% PCW recycled paper using soy-based inks.