CALOPHYLLUM SCLEROPHYLLUM - UTAR Institutional...
125
PHYTOCHEMICAL AND ANTIOXIDANT STUDIES OF CALOPHYLLUM SCLEROPHYLLUM By YONG FUI LU A Project Report Submitted to the Department of Chemical Sciences, Faculty of Science, Universiti Tunku Abdul Rahman in Partial Fulfillment of the Requirement for the Degree of Bachelor of Science (Hons) Chemistry September 2015
Transcript of CALOPHYLLUM SCLEROPHYLLUM - UTAR Institutional...

PHYTOCHEMICAL AND ANTIOXIDANT STUDIES OF
CALOPHYLLUM SCLEROPHYLLUM
By
YONG FUI LU
A Project Report Submitted to the Department of Chemical Sciences,
Faculty of Science,
Universiti Tunku Abdul Rahman
in Partial Fulfillment of the Requirement for the
Degree of Bachelor of Science (Hons) Chemistry
September 2015

ii
ABSTRACT
PHYTOCHEMICAL AND ANTIOXIDANT STUDIES OF
CALOPHYLLUM SCLEROPHYLLUM
Yong Fui Lu
Chemical study on medicinally important plant secondary metabolites had led
to the identification of various useful compounds for further study into their
pharmacological activities. It involves extraction, isolation, purification and
structural characterization of compounds isolated from plants. In this project,
the stem bark of Calophyllum sclerophyllum was subjected to sequential
solvent extraction by using dichloromethane, ethyl acetate and methanol. The
chemical compounds in the crude extracts were subsequently separated using
column chromatography. From the ethyl acetate crude extract, a triterpenoid
and three coumarins were successfully isolated, namely friedelin [24], 5,7-
dihydroxy-6-(2-methylbutyryl)-4-phenylcoumarin [25], 5,7-dihydroxy-6-(3-
methylbutyryl)-4-phenylcoumarin [26] and isodispar B [27]. Characterization
of these pure compounds was carried out through various spectroscopic
analyses, including 1D- and 2D-NMR, UV-Vis, IR, GC-MS and LC-MS.
Besides, all the crude extracts of Calophyllum sclerophyllum and isolated
compounds were investigated for their antioxidant potential via DPPH assay.

iii
ABSTRAK
Kajian kimia tentang metabolit tumbuhan yang mempunyai nilai perubatan
telah membawa pengenalan pelbagai kompaun berguna untuk kajian aktiviti
farmakologi masa depan. Ia melibatkan pengekstrakan, pengasingan,
pembersihan dan analisis struktur kompaun. Dalam projek ini, kulit kayu
batang Calopyhllum sclerophyllum telah diekstrak berturutan dengan
menggunakan diklorometana, etil asetat dan metanol. Kompaun-kompaun
dalam ekstrak mentah seterusnya diasingkan dengan menggunakan
kromatografi. Daripada ekstrak etil asetat, triterpenoid dan tiga koumarin telah
diasingkan, iaitu friedelin [24], 5,7-dihydroksi-6-(2-metilbutiril)-4-
fenilkoumarin [25], 5,7-dihydroksi-6-(3-metilbutiril)-4-fenilkoumarin [26] dan
isodispar B [27]. Struktur-struktur kompaun telah diperolehi melalui pelbagai
spektroskopi analisis, termasuk 1D- dan 2D-NMR, UV-Vis, IR, GC-MS dan
LC-MS. Selain itu, ekstrak mentah Calophyllum sclerophyllum dan kompau-
kompaun tulen telah diujikan bagi potensi antioksiden dengan menggunakan
kaedah DPPH.

iv
ACKNOWLEDGEMENTS
To have successfully completed this final year project was a great achievement
of milestone for me. Of course, it was never an individual accomplishment.
First and foremost, I would like to express my heartiest thanks to my
supervisor, Dr. Lim Chan Kiang for his continual guidance, knowledge and
advices throughout the course of this project. His expertise in NMR analyses
did help me a lot in thesis writing. Again, thank you for sparing precious time
in teaching us patiently.
Secondly, I would also like to thank my postgraduate senior, Ms. Hemaroopini
Subramaniam for her guidance in handling instruments and chemical tests. At
the meantime, I cherish all the memories of those happy and hard times with
my fellow lab mates, seniors and juniors. It was fun working with all of them.
Besides, special thanks and appreciation to lab assistants for their kindness and
helps in running mass spectrometry analysis for my samples.
A million thanks to my family members for their motivation, enduring love and
financial support. Thank you for being understanding. Last but not least, I wish
to express my special gratitude to my friend, Ng Choo Liang for his sincere
advice and emotional support during my difficult times. Thanks for directing
me from biochemistry into an interesting chemistry course.

v
DECLARATION
I hereby declare that the project report is based on my original work except for
quotations and citations which have been duly acknowledge. I also declare that
it has not been previously or concurrently submitted for any other degree at
UTAR or other institutions.
(YONG FUI LU)

vi
APPROVAL SHEET
The project report entitled “PHYTOCHEMICAL AND ANTIOXIDANT
STUDIES OF CALOPHYLLUM SCLEROPHYLLUM” was prepared by
YONG FUI LU and submitted as partial fulfillment of the requirements for the
degree of Bachelor of Science (Hons) Chemistry at Universiti Tunku Abdul
Rahman.
Approved by:
Date:
(Dr. Lim Chan Kiang)
Supervisor
Department of Chemical Science
Faculty of Science
Universiti Tunku Abdul Rahman

vii
FACULTY OF SCIENCE
UNIVERSITI TUNKU ABDUL RAHMAN
Date:
PERMISSION SHEET
It is hereby certified that YONG FUI LU (ID No: 12ADB01527) has
completed this final year project entitled “PHYTOCHEMICAL AND
ANTIOXIDANT STUDIES OF CALOPHYLLUM SCLEROPHYLLUM”
supervised by Dr. Lim Chan Kiang from the Department of Chemical Science,
Faculty of Science.
I hereby give permission to the University to upload the softcopy of my final
year project in pdf format into the UTAR Institutional Repository, which may
be made accessible to the UTAR community and public.
Yours truly,
(YONG FUI LU)

viii
TABLE OF CONTENTS
Page
ABSTRACT ii
ABSTRAK iii
ACKNOWLEDGEMENTS iv
DECLARATION v
APPROVAL SHEET vi
PERMISSION SHEET vii
TABLE OF CONTENTS viii
LIST OF FIGURES xi
LIST OF TABLES xiv
LIST OF ABBREVIATIONS xv
CHAPTER
1 INTRODUCTION 1
1.1 General Introduction 1
1.2 Botany of Plant Species Studied 4
1.2.1 Taxonomy 4
1.2.2 Morphology 5
1.2.3 Geographical Distribution and Habitat 6
1.2.4 Ethnomedicinal Uses and Pharmacological Studies 6
1.3 Objectives of Study 7
2 LITERATURE REVIEW 8
2.1 Phytochemical Studies 8
2.1.1 Coumarin 9
ix
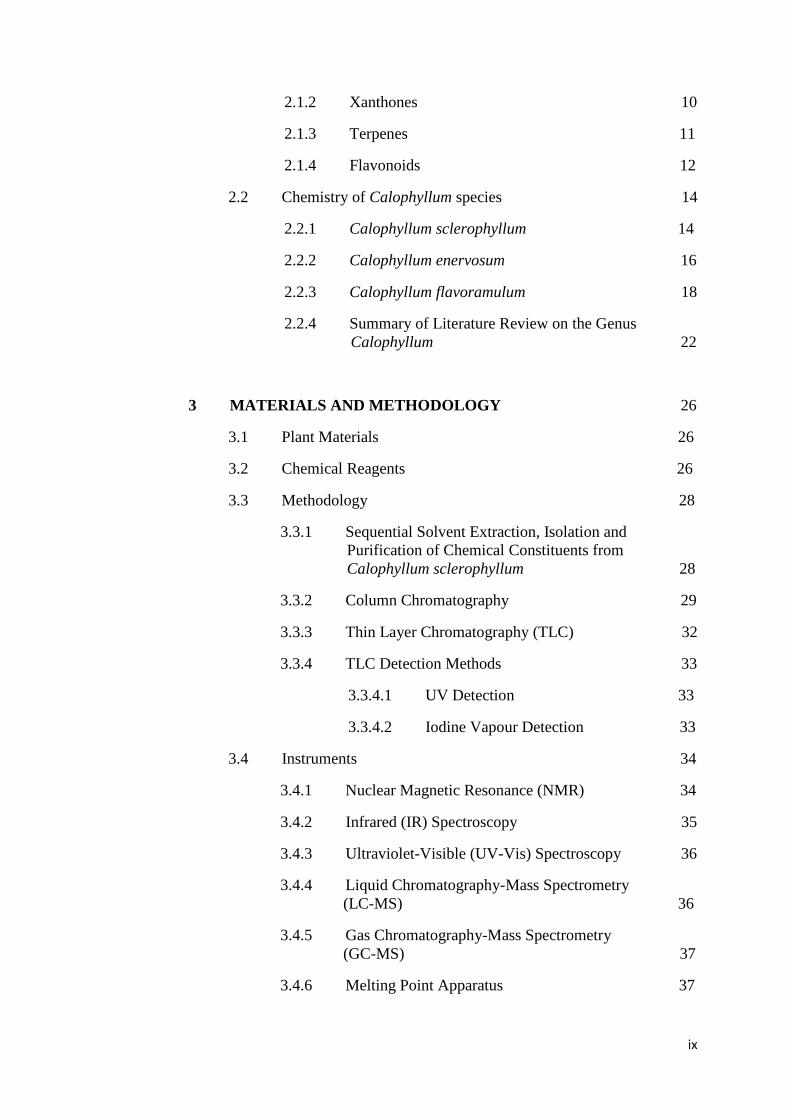
2.1.2 Xanthones 10
2.1.3 Terpenes 11
2.1.4 Flavonoids 12
2.2 Chemistry of Calophyllum species 14
2.2.1 Calophyllum sclerophyllum 14
2.2.2 Calophyllum enervosum 16
2.2.3 Calophyllum flavoramulum 18
2.2.4 Summary of Literature Review on the Genus
Calophyllum 22
3 MATERIALS AND METHODOLOGY 26
3.1 Plant Materials 26
3.2 Chemical Reagents 26
3.3 Methodology 28
3.3.1 Sequential Solvent Extraction, Isolation and
Purification of Chemical Constituents from
Calophyllum sclerophyllum 28
3.3.2 Column Chromatography 29
3.3.3 Thin Layer Chromatography (TLC) 32
3.3.4 TLC Detection Methods 33
3.3.4.1 UV Detection 33
3.3.4.2 Iodine Vapour Detection 33
3.4 Instruments 34
3.4.1 Nuclear Magnetic Resonance (NMR) 34
3.4.2 Infrared (IR) Spectroscopy 35
3.4.3 Ultraviolet-Visible (UV-Vis) Spectroscopy 36
3.4.4 Liquid Chromatography-Mass Spectrometry
(LC-MS) 36
3.4.5 Gas Chromatography-Mass Spectrometry
(GC-MS) 37
3.4.6 Melting Point Apparatus 37

x
3.5 Antioxidant Assay 38
4 RESULTS AND DISCUSSION 40
4.1 Chemical Constituents Isolated From Calophyllum
sclerophyllum 40
4.2 Chemical Identification and Structural Characterization of
5,7-dihydroxy-6-(2-methylbutyryl)-3-phenylcoumarin [25] 42
4.3 Chemical Identification and Structural Characterization of
5,7-dihydroxy-6-(3-methylbutyryl)-3-phenylcoumarin [26] 61
4.4 Chemical Identification and Structural Characterization of
Isodispar B [27] 73
4.5 Chemical Identification and Structural Characterization of
Friedelin [24] 83
4.6 Antioxidant Test 91
5 CONCLUSIONS 96
5.1 Conclusion 96
5.2 Future Perspectives 97
REFERENCES 98

xi
LIST OF FIGURES
Figure Page
1.1 Calophyllum sclerophyllum tree and its fruits 5
2.1 Basic building block of coumarins 9
2.2 Structure of xanthone core 11
2.3 Molecular structure of isoprene 12
2.4 Molecular structure of flavones 13
2.5 Structures of chemical compounds isolated from C. sclerophyllum 15
2.6 Structures of chemical compounds isolated from C. sclerophyllum
(continued) 16
2.7 Structures of chemical compounds isolated from C. enervosum 17
2.8 Structures of chemical compounds isolated from C. enervosum
(continued) 18
2.9 Structures of chemical compounds isolated from C. flavoramulum 19
2.10 Structures of chemical compounds isolated from C. flavoramulum
(continued) 21
3.1 Apparatus set up for column chromatography 31
3.2 TLC plate under different detection methods 34
3.3 96-well plate used in antioxidant assay 39
4.1 Isolation pathways of pure compounds 41
4.2 Molecular structure of 5,7-dihydroxy-6-(2-methylbutyryl)-4-
phenylcoumarin [25] 42
4.3 GC-MS spectrum of compound 25 43
4.4 HRESIMS spectrum of compound 25 43
4.5 UV-Vis spectrum of compound 25 44
4.6 IR spectrum of compound 25 47

xii
4.7 1H-NMR spectrum of compound 25 49
4.8 Expanded 1H-NMR spectrum of compound 25 50
4.9 Expanded 1H-NMR spectrum of compound 25 51
4.10 Expanded 1H-NMR spectrum of compound 25 52
4.11 13
C-NMR spectrum of compound 25 53
4.12 Expanded 13
C-NMR spectrum of compound 25 54
4.13 Expanded 13
C-NMR spectrum of compound 25 55
4.14 HMQC spectrum of compound 25 56
4.15 Expanded HMBC spectrum of compound 25 57
4.16 Expanded HMBC spectrum of compound 25 58
4.17 Expanded HMBC spectrum of compound 25 59
4.18 Expanded HMBC spectrum of compound 25 60
4.19 Molecular structure of 5,7-dihydroxy-6-(3-methylbutyryl)-4-
phenylcoumarin [26] 61
4.20 GC-MS spectrum of compound 26 61
4.21 HRESIMS spectrum of compound 26 62
4.22 UV-Vis spectrum of compound 26 62
4.23 IR spectrum of compound 26 64
4.24 1H-NMR spectrum of compound 26 66
4.25 Expanded 1H-NMR spectrum of compound 26 67
4.26 13
C-NMR spectrum of compound 26 68
4.27 Expanded 13
C-NMR spectrum compound 26 69
4.28 HMQC spectrum of compound 26 70
4.29 HMBC spectrum of compound 26 71
4.30 Expanded HMBC spectrum of compound 26 72
4.31 The molecular structure of isodispar B [27] 73
4.32 GC-MS spectrum of isodispar B [27] 74

xiii
4.33 HRESIMS spectrum of isodispar B [27] 74
4.34 UV-Vis spectrum of isodispar B [27] 75
4.35 IR spectrum of isodispar B [27] 77
4.36 1H-NMR spectrum of isodispar B [27] 79
4.37 13
C-NMR spectrum of isodispar B [27] 80
4.38 HMQC spectrum of isodispar B [27] 81
4.39 HMBC spectrum of isodispar B [27] 82
4.40 The molecular structure of friedelin [24] 83
4.41 GC-MS spectrum of friedelin [24] 84
4.42 HRESIMS spectrum of friedelin [24] 84
4.43 IR spectrum of friedelin [24] 86
4.44 UV-Vis spectrum of friedelin [24] 86
4.45 1H-NMR spectrum of friedelin [24] 88
4.46 13
C-NMR spectrum of friedelin [24] 89
4.47 Expanded 13
C-NMR spectrum of friedelin [24] 90
4.48 Resonance-stabilized free radicals formed by different coumarin
compounds 93
4.49 Resonance-stabilized radical formed by isodispar B 94
4.50 Graph of inhibition rate (%) against concentration of crude extracts 95
4.51 Graph of inhibition rate (%) against concentration of isolated
compounds 95

xiv
LIST OF TABLES
Table Page
1.1 Taxonomy of Calophyllum sclerophyllum 4
2.1 Summary of literature data on the genus Calophyllum 22
3.1 Industrial grade solvents and materials used in the extraction,
isolation and purification of chemical constituents 26
3.2 Deuterated solvents used in NMR analysis 27
3.3 HPLC grade solvents and materials used in LC- and GC-MS analysis 27
3.4 Analytical grade solvent and materials used in TLC analysis 27
3.5 Analytical grade solvents and materials used in UV-Vis analysis 27
3.6 Chemical reagents and materials used in antioxidant assay 27
4.1 Summary of NMR data for 5,7-dihydroxy-6-(2-methylbutyryl)-4-
phenylcoumarin [25] 48
4.2 Summary of NMR data for 5,7-dihydroxy-6-(3-methylbutyryl)-4-
phenylcoumarin [26] 65
4.3 Summary of NMR data for isodispar B [27] 78
4.4 Summary of NMR data for friedelin in comparison with literature
values 87
4.5 Antioxidant results of test samples in DPPH assay 92

xv
LIST OF ABBREVIATIONS
13C Carbon-13
1H Proton
DCM Dichloromethane
EtOAc Ethyl acetate
MeOH Methanol
TE Trolox Equivalent
μmol Micromole
μg Microgram
μL Microliter
mL Mililiter
mm Milimeter
cm Centimeter
nm Nanometer
mg Miligram
mol Mole
g Gram
kg Kilogram
oC Degree in Celsius
β Beta
δ Chemical shift
δC Chemical shift of carbon
δH Chemical shift of proton
λmax Maximum wavelength
NMR Nuclear Magnetic Resonance
1D-NMR One Dimension Nuclear Magnetic Resonance
2D-NMR Two Dimension Nuclear Magnetic Resonance

xvi
FTIR Fourier-Transform Infrared Spectroscopy
IR Infrared
HMQC Heteronuclear Multiple Quantum Coherence
HMBC Heteronuclear Multiple Bond Coherence
HRESIMS High Resolution Electrospray Ionization Mass Spectrometry
HPLC High Performance Liquid Chromatography
LC-MS Liquid Chromatography-Mass Spectrometry
GC-MS Gas Chromatography-Mass Spectrometry
UV-Vis Ultraviolet-Visible
TLC Thin Layer Chromatography
A1 Absorbance of the test sample
Ao Absorbance of the blank (negative control)
c Concentration of sample in g/mL
O-H Oxygen-Hydrogen (or Hydroxyl)
C-O Carbon-Oxygen (or Carbinol)
C=O Carbon=Oxygen (or Carbonyl)
C-H Carbon-Hydrogen
C=C Carbon=Carbon
CDCl3 Deuterated chloroform
Acetone-d6 Deuterated acetone
KBr Potassium bromide
TMS Tetramethylsilane
DPPH 1,1-diphenyl-2-picrylhydrazyl
IC50 Half maximal inhibitory concentration
BPX5 5% phenyl/ 95% methyl polysilphenylene/ siloxane phase
ppm Part per million
Rf Retention factor

xvii
s Singlet
d Doublet
dd Doublet of doublets
dq Doublet of quartets
t Triplet
m Multiplet
Hz Hertz
J Coupling constant in Hertz
JCH Heteronuclear coupling between carbon and proton
m/z Mass-to-charge ratio
AGEs Advanced glycation end-product
B.C.E. Before common era (used in timeline)
mM Milimoles

1
CHAPTER 1
INTRODUCTION
1.1 General Introduction
Nature has been a source of medicinal agents for thousands of years. In today’s
world, application of medicines originated from natural sources is growing
worldwide due to its minimal side effects. “Natural products” is generally
referred to chemical compounds that are derived from living organisms,
including plants, animal, insects, and microorganisms. The compounds that
plant produce can be categorized as primary and secondary metabolites. The
primary metabolites, including protein, carbohydrates, lipids, nucleic acids and
enzymes, play an integral role in vital life functions of plant, like
photosynthesis as well as respiration. They are crucially important molecules
of life. In contrast to primary metabolites, secondary metabolites are not
essential for organism’s development and growth. Plants synthesize them in
small quantities for the purpose of survival. The secondary compounds perform
other functions such as rendering colour to flowers and fragrance to assist in
pollination, or toxicity as a deterrent to predators. It is this area of secondary
metabolism which provides most of the pharmacologically active natural
products (Dewick, 2009).
2
Natural products have served as an important source of drugs since ancient
times. Several thousand years ago, hunter-gatherers collected certain herbs
with medicinal values to cure specific ailments. This knowledge was passed
down by word of mouth over generations, and the first medicinal plant record
written on clay tablets was from Mesopotamia, dates from about 2600 B.C.E.
(Wong, 2009). In the history of traditional Chinese medicine, The
Compendium of Materia Medica, also known as Pen-Tsao Kang-Mu, has been
extensively documented over the centuries. This compilation consisting of
11096 prescriptions used to treat common illnesses, and is widely spread until
today. Likewise, the Indian Ayurvedic medicine also has a long history in
pharmaceutical field, dates from 1100 B.C.E. (Cragg and Newman, 2002).
The fundamental methodologies involved in natural product chemistry are
extraction, compounds isolation, purification and structural elucidation.
Innovations in technology and equipment have often played an important role
in the progress of natural product chemistry. Early in the 19th century, plant
extraction technology was developed, whereby the bioactive compounds from
plants were chromatographically isolated, purified and drugs were produced.
Once the structure of compound was known, it was possible to produce them
synthetically. Natural compounds are used as templates for chemical synthesis
of their analogs which are having different structures but possess common
pharmacophores. These synthetic compounds may have superior and more
effective biological activities than the original compounds. The medicinal
products can be in the form of tablets, capsules, ointments, or liquids. For
example, salicin is an anti-inflammatory agent isolated from willow bark,

3
which is then chemically modified into aspirin by scientists through “Kolbe
synthesis” method (Vane, 1971).
It is of significance that secondary metabolites found in plant-derived natural
products are proven to be beneficial as therapeutic agents, even though these
phytochemicals are non-nutritive, and not essential to life processes. These
chemical constituents include alkaloids, flavonoids, coumarins, terpenes,
saponins, and steroids (Corrado, 2001). Many of these phytochemicals show
antioxidant activity, which are natural antioxidants that human valued for
treatment of cancers. Free radicals are generated via oxidation, and they are
reactive and unstable, thus, initiate chain reaction and caused oxidative stress
in human body. Oxidative stress is caused by unbalance between oxidant and
antioxidant, which can increase the risk of developing cancers due to cell
damaged and tissue injury. One of the therapies that can reduce the risk of
cancer is by intake of antioxidant (Rissyelly, 2014). Antioxidants terminate
these radical chain reactions by conversion of free radical intermediates to a
relatively stable compound. As a result, antioxidants are termed as “free radical
scavengers”.
Malaysia is one of the 12 mega biodiversity countries in the world which has
about 19.12 milion hectares of rainforest area. It is estimated that there are
around 8100 plant species, with 10% of them were reported to show some
medicinal values (Wong, 2009). The Calophyllum species in Sarawak are of
great interest for phytochemical investigations due to their broad-spectrum of
4
pharmacological properties, particularly with immune protection in HIV
disease and AIDS (Ma, et al., 2008). In this project, our works have been
focused on the isolation of bioactive secondary metabolites from Calophyllum
sclerophyllum and to test their antioxidant activity.
1.2 Botany of Plant Species Studied
1.2.1 Taxonomy
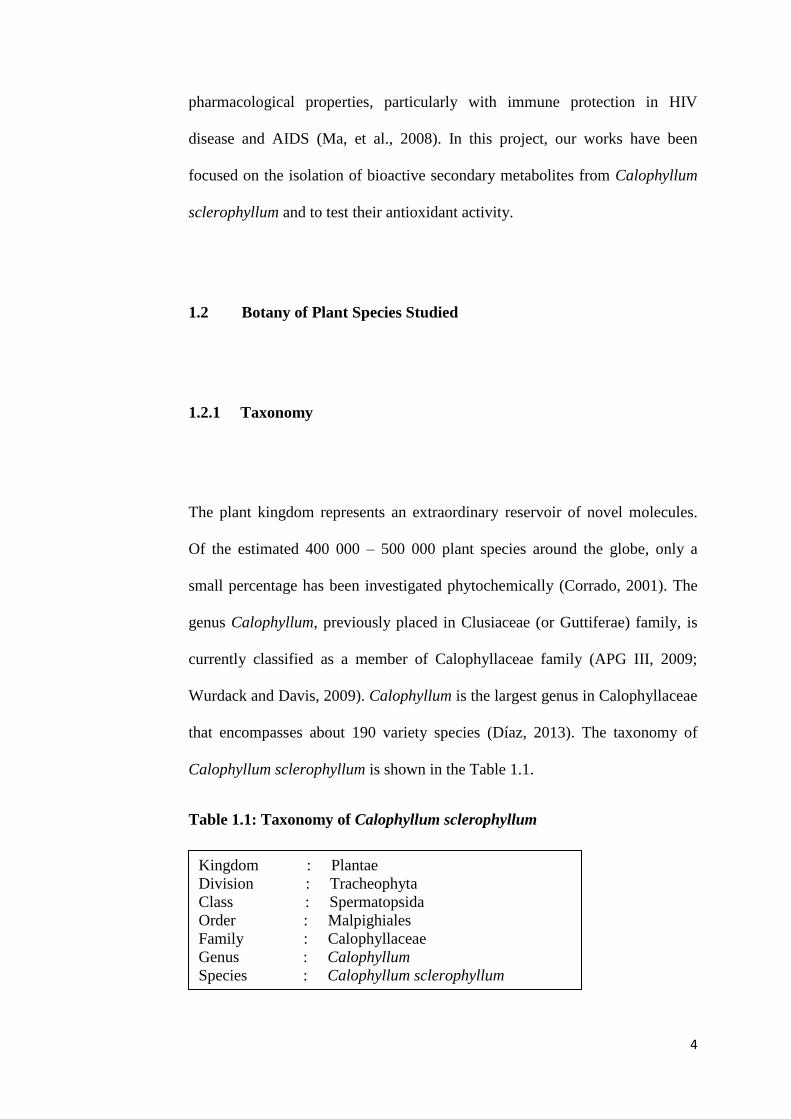
The plant kingdom represents an extraordinary reservoir of novel molecules.
Of the estimated 400 000 – 500 000 plant species around the globe, only a
small percentage has been investigated phytochemically (Corrado, 2001). The
genus Calophyllum, previously placed in Clusiaceae (or Guttiferae) family, is
currently classified as a member of Calophyllaceae family (APG III, 2009;
Wurdack and Davis, 2009). Calophyllum is the largest genus in Calophyllaceae
that encompasses about 190 variety species (Díaz, 2013). The taxonomy of
Calophyllum sclerophyllum is shown in the Table 1.1.
Table 1.1: Taxonomy of Calophyllum sclerophyllum
1.2.2 Morphology
Kingdom : Plantae
Division : Tracheophyta
Class : Spermatopsida
Order : Malpighiales
Family : Calophyllaceae
Genus : Calophyllum
Species : Calophyllum sclerophyllum

5
1.2.2 Morphology
Calophyllum sclerophyllum is an evergreen tree, growing up to 40 m in height.
It has a thick trunk covered with a rough, greyish-brown, fissured and cracked
bark. The bark oozes a yellowish-white resin. Stilt-roots or pneumatophore
(“breathing”) roots growing up to 4 m high on the trunk is one of the special
features of this species (Corner, 1978). The leaves of trees are simple, deep
glossy green, elliptic to obovate with a blunt end, and about 8 cm long and 5 to
7 cm wide. There are many parallel lateral veins perpendicular to the midvein
of the leaves. The flowers are white, about 2.5 cm wide, and have a very strong
sweet fragrance (Wong, 2009). Calophyllum sclerophyllum produces spherical
drupes fruits and is in green color. They arrange in clusters and attach to the
branches (Dweck and Meadows, 2002). The picture of Calophyllum
sclerophyllum is shown in Figure 1.1.
Figure 1.1 Calophyllum sclerophyllum tree and its fruits

6
1.2.3 Geographical Distribution and Habitat
Calophyllum sclerophyllum is widely distributed in tropical rainforest of Asia
regions such as Thailand, Johor and Sarawak of Malaysia, Singapore and
Kalimantan of Indonesia (Tjitrosoepomo, 1996). Calophyllum is more
generally known by indigenous people as Bintagor jangkang or Penaga darat.
It grows naturally and abundant in the swamp-forest, some of which on rocky
and sandy sea shores (Corner, 1978).
1.2.4 Ethnomedicinal Uses and Pharmacological Studies
Numerous Calophyllum species have been used as folk medicine. In Malaysia,
the Malays use its seed oil as a remedy for ulcer and rheumatism ailments.
Moreover, Dweck and Meadows (2002) reported that there was great
improvement in scars after tamanu oil applied on visually obvious scars. An
infusion of the leaves is used to treat inflamed eyes. The wood of the tree is
hard, thus it is used in timber industry for construction material, ship building,
and furniture (Díaz, 2013).
The modern pharmacology research on the genus Calophyllum has further
revealed a variety of biological activities exhibited by these plants, such as
inhibition of HIV, antioxidant, antitumor-promoting, antimalarial, as well as

7
cytotoxic activity. Various parts of these trees are found to be rich in bioactive
phytochemicals, including xanthones, coumarins, chromanones (flavonoids,
biflavonoids), terpenes and steroids (Su, et al., 2008). Hence, Calophyllum has
been gaining interest of the scientific community due to its promising chemical
and biological results. Previous studies on Calophyllum sclerophyllum has
reported the isolation of jacaerubin, 1,3,5,6 tetraoxygenated xanthones and
euxanthone, but there was no study about their biological activities (Jackson,
1966). Recently, a research study conducted by Rissyelly and co-workers
(2014) on the ethanolic extract of the same species has resulted in the isolation
of astilbin which showed antioxidant activity, and may lower the risk of cancer.
1.3 Objectives of Study
The purposes of conducting this study are:
To extract and isolate chemical constituents from the stem bark of
Calophyllum sclerophyllum.
To identify and characterize the structures of isolated compounds
through modern spectroscopic techniques.
To investigate the antioxidant activity of the pure isolates and crude
extracts of Calophyllum sclerophyllum via DPPH assay.

8
CHAPTER 2
LITERATURE REVIEW
2.1 Phytochemical Studies
Phytochemistry, generally termed “plant chemistry”, is a study of chemical
constituents that are naturally occurring in plants. The term secondary
metabolites is referring to the phytochemicals that are synthesized by
specialized plants cells in a trace quantity via secondary metabolism pathway.
Each plant family, genus and species produces characteristic phytochemicals.
Secondary metabolites have no obvious function in a plant’s primary
metabolism as well as in photosynthesis and reproduction. They may possess
an ecological role, as pollination attractants, represent chemical adaptions to
environmental stresses, or coordinate the development of the whole plant
defence mechanisms. For instance, plants produce toxic phytoalexins to kill
pathogenic microbes and insects (Monika, Joseph and Teresa, 2008).
These secondary compounds are highly valued by human. Mankind use many
of these compounds as spices, flavors, fragrances, insecticides and in many
cases as drugs. In fact, a large number of plants used in the traditional medicine
have now become a part of the modern world health care system because of
their unique ability to synthesize a wide array of compounds with diverse
health-related benefits (Naithani, et al., 2010). Natural products are

9
inexpensive, better compatibility with the human body and minimal side
effects. Thus, many research efforts have been devoted for the discovery of
therapeutic constituents from plants. A wide variety of active phytochemicals
have been identified and found to possess a broad range of biological activities
such as antimicrobial, antiviral, antioxidative, anti-malarial and antitumor
properties (Su, et al., 2008). Extensive phytochemical studies have shown plant
kingdom to be a rich source of secondary metabolites including alkaloids,
saponins, triterpenoids, flavonoids, lactones and organic acids.
2.1.1 Coumarins
Coumarins (2H-1-benzopyran-2-one) are plant-derived natural products with
molecular formula of C9H6O2. The core structure of coumarin is comprising of
fused benzene and 𝛼-pyrone rings, as shown in Figure 2.1. Dietary exposure to
benzopyrones is significant as these compounds are found in vegetables, fruits,
seeds, nuts, coffee, tea, and wine. Natural coumarins are mainly classified into
six categories based on their chemical structure, including simple coumarins,
furanocoumarins, pyranocoumarins, dihydrofuranocoumarins, phenylcoumarin
and bicoumarins (Venugopala, Rashmi and Odhav, 2013).
Figure 2.1: Basic building block of coumarins
10
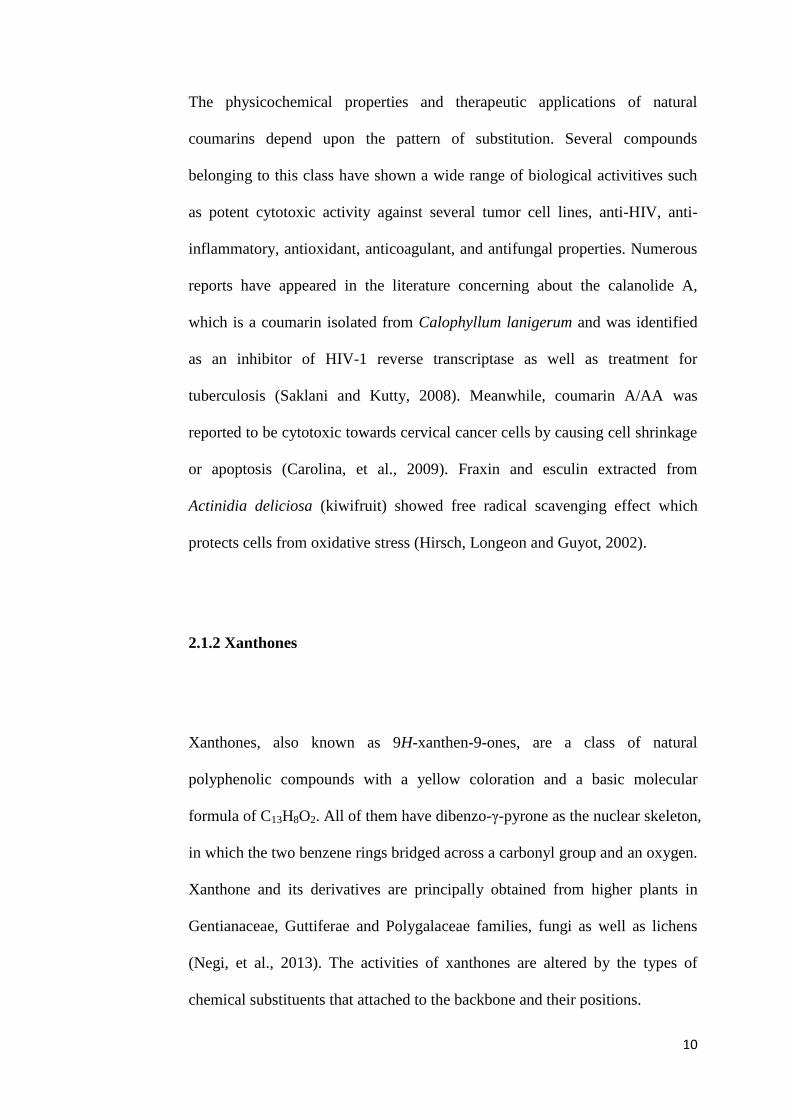
The physicochemical properties and therapeutic applications of natural
coumarins depend upon the pattern of substitution. Several compounds
belonging to this class have shown a wide range of biological activitives such
as potent cytotoxic activity against several tumor cell lines, anti-HIV, anti-
inflammatory, antioxidant, anticoagulant, and antifungal properties. Numerous
reports have appeared in the literature concerning about the calanolide A,
which is a coumarin isolated from Calophyllum lanigerum and was identified
as an inhibitor of HIV-1 reverse transcriptase as well as treatment for
tuberculosis (Saklani and Kutty, 2008). Meanwhile, coumarin A/AA was
reported to be cytotoxic towards cervical cancer cells by causing cell shrinkage
or apoptosis (Carolina, et al., 2009). Fraxin and esculin extracted from
Actinidia deliciosa (kiwifruit) showed free radical scavenging effect which
protects cells from oxidative stress (Hirsch, Longeon and Guyot, 2002).
2.1.2 Xanthones
Xanthones, also known as 9H-xanthen-9-ones, are a class of natural
polyphenolic compounds with a yellow coloration and a basic molecular
formula of C13H8O2. All of them have dibenzo-γ-pyrone as the nuclear skeleton,
in which the two benzene rings bridged across a carbonyl group and an oxygen.
Xanthone and its derivatives are principally obtained from higher plants in
Gentianaceae, Guttiferae and Polygalaceae families, fungi as well as lichens
(Negi, et al., 2013). The activities of xanthones are altered by the types of
chemical substituents that attached to the backbone and their positions.

11
Naturally occurring xanthones have gradually risen to great importance in view
of their remarkable pharmacological and other biological activities.
Interestingly, xanthones extracted from the plant Hypericum perforatum
possess antidepressant action and can be used as antidepressive drugs (Zhao, et
al., 2014). Besides that, 1,8-dihydroxy-3,5-dimethoxyxanthone (swerchirin)
isolated from Swertia chirayita was reported to have hypoglycemic effect, thus
reducing blood sugar significantly against diabetes (Bajpai, et al., 1991). Basic
molecular structure of xanthone is shown in Figure 2.2.
Figure 2.2: Structure of xanthone core
2.1.3 Terpenes
Terpenes are a large and diverse class of naturally occurring phytochemicals
derived from five carbon isoprene units. Since the molecular formula of
isoprene is C5H8, hence, terpenes are generally expressed in the formula of
(C5H8)n, whereby n indicates the number of isoprene units that linked together
(Corrado, 2001). For instance, triterpene is a natural compound containing
thirty carbon atoms based on six isoprene units. According to isoprene rule,
isoprene units are linked in a head-to-tail manner.

12
Terpenoids are derivatives of terpenes and their structures consisting of
functional groups such as hydroxyl and carbonyl groups. The terpenes are
classified into monoterpenoids (C10), sesquiterpenoids (C15), diterpenoids (C20),
sesterterpenoids (C25), triterpenoids (C30) and carotenoids (C40). Most of the
terpenes exist in cyclic form (Corrado, 2001). Monoterpenoids are major
components of the aromas of plants. These volatile natural products, known as
essential oils, form the basis of the perfumery and flavouring industries.
Menthol, a constituent of mint oil, is obtained commercially from Mentha
arvensis and possesses useful physiological properties including anaesthetic
and refreshing effects. It is used to flavour sweets, tobacco and toothpaste
(Wiart, 2013). Figure 2.3 shows the molecular structure of isoprene.
Figure 2.3: Molecular structure of isoprene
2.1.4 Flavonoids
Flavonoids are compounds that are responsible for the colour of flowers, fruits
and leaves. The name refers to the Latin word ‘flavus’ meaning yellow.
Flavonoids protect the plant from UV-damaging effects and play a role in
pollination by attracting animals by their colours. Flavonoids (or bioflavonoids)
are polyphenolic compounds that occurs in nature with the basic structural
formula C6—C3—C6. The basic structure of flavonoids is 2-phenyl chromane

13
or an Ar–C3–Ar skeleton, which involves two aromatic rings bonded to a three
carbons aliphatic moiety that form an oxygenated heterocycle. In plant,
flavonoids can either occur as aglycones or as O- or C-glycosides. Based on
their chemical structure, flavonoids are divided into several subclasses, namely
flavone, flavonols, isoflavonoids, chalcones, flavanols and flavanones (Gurib-
Fakim, 2006). Figure 2.4 shows the basic molecular structure of flavones.
Figure 2.4: Molecular structure of flavones
Natural flavonoids are of great interest due to their widespread
pharmacological properties, and this attracts many medicinal chemists for
further backbone derivatization, and screening them for novel therapeutic
agents. Pinocembrin, a flavonoid which occurs naturally in Alpinia galangal,
has been found to suppress the growth of a range of cancer cell lines including
cervical, breast and colon cancer cells. This is because flavonoids are very
effective scavengers of hydroxyl and peroxyl radicals as well as quenching
superoxide radicals and singlet oxygen (Wiart, 2013). Consequently, they are
widely used as antioxidant to reduce the risk of cancers.

14
2.2 Chemistry of Calophyllum Species
Calophyllum is a nature’s gift that occurs in the ethnopharmacy and folklore of
many countries. The important cures for various ailments were carefully passed
on verbally from one generation to another. Scientists prove that many
members of this genus were not only traditionally used in folklore medicine,
but also be applied into modern in vivo studies. This genus comprises of about
190 different plant species. Among all these species, C. lanigerium, C.
brasiliense, C. inophyllum, C. teysmanni and C. soulattri have been extensively
studied and have led to many important publications. Phytochemical studies
have shown Calophyllum to be a rich source of secondary metabolites
including coumarins, xanthones, triterpenoids, flavonoids and organic acids
(Su, et al., 2008).
2.2.1 Calophyllum sclerophyllum
In this project, C. sclerophyllum was selected for phytochemical investigation
in the search for medicinally important and chemically interesting compounds.
This species is less likely to be studied by researchers, probably due to the
limiting factor in geographical distribution of the plant. By far, there are only
two publications related to C. sclerophyllum, reported by Jackson et al. in 1966
and Rissyelly, et al. in 2014.
15
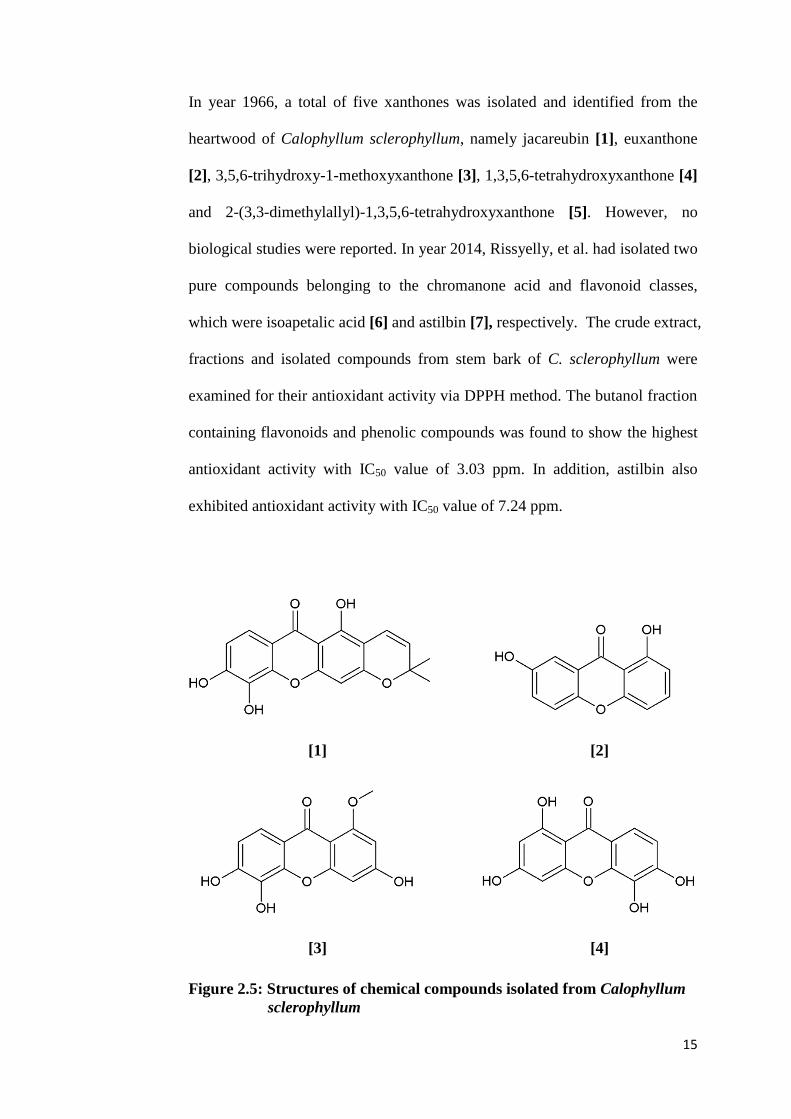
In year 1966, a total of five xanthones was isolated and identified from the
heartwood of Calophyllum sclerophyllum, namely jacareubin [1], euxanthone
[2], 3,5,6-trihydroxy-1-methoxyxanthone [3], 1,3,5,6-tetrahydroxyxanthone [4]
and 2-(3,3-dimethylallyl)-1,3,5,6-tetrahydroxyxanthone [5]. However, no
biological studies were reported. In year 2014, Rissyelly, et al. had isolated two
pure compounds belonging to the chromanone acid and flavonoid classes,
which were isoapetalic acid [6] and astilbin [7], respectively. The crude extract,
fractions and isolated compounds from stem bark of C. sclerophyllum were
examined for their antioxidant activity via DPPH method. The butanol fraction
containing flavonoids and phenolic compounds was found to show the highest
antioxidant activity with IC50 value of 3.03 ppm. In addition, astilbin also
exhibited antioxidant activity with IC50 value of 7.24 ppm.
[1] [2]
[3] [4]
Figure 2.5: Structures of chemical compounds isolated from Calophyllum
sclerophyllum

16
[5] [6]
[7]
Figure 2.6: Structures of chemical compounds isolated from Calophyllum
sclerophyllum (continued)
2.2.2 Calophyllum enervosum
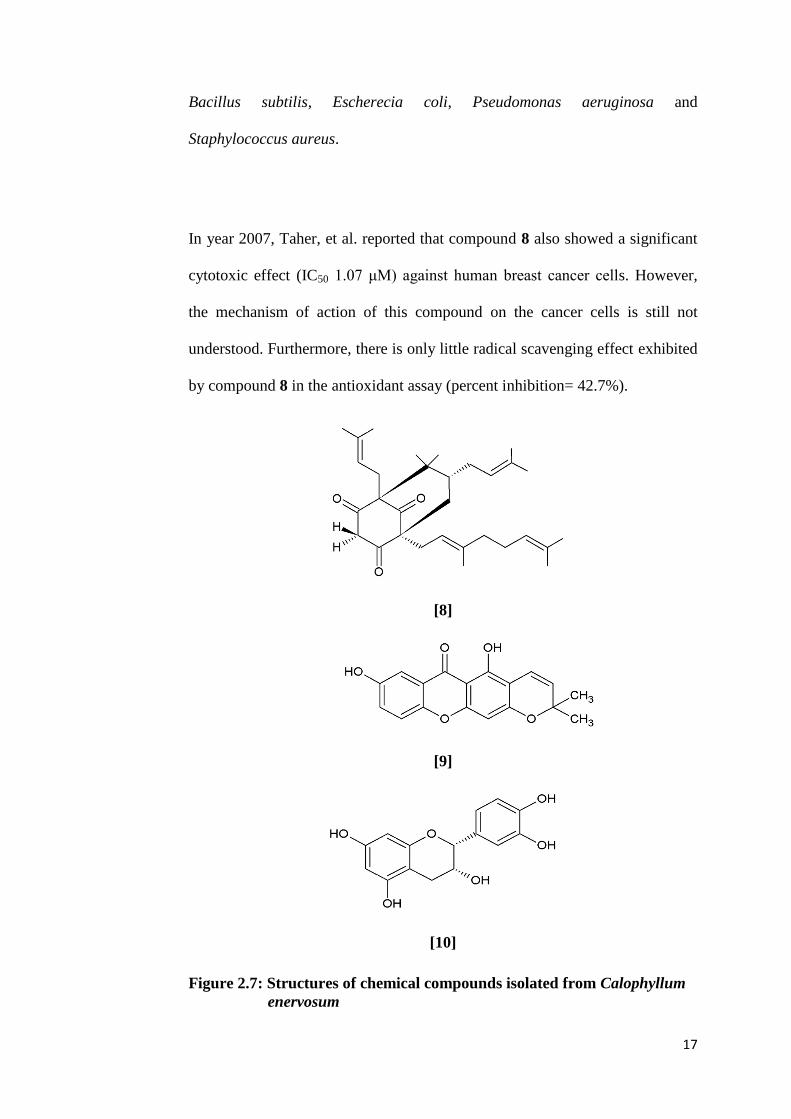
Chemical study on the stem bark of Calophyllum enervosum collected from
Indonesia has revealed the isolation of a polyisoprenylated ketone named
enervosanone [8] together with three known compounds, osajaxanthone [9],
epicatechin [10] and cambogin [11] (Taher, et al., 2005). All these isolated
compounds were tested against microorganisms using the disc diffusion
method. Among all, compound 8 in the form of white needles showed the
strongest antimicrobial activity against four types of microbes, which were
17
Bacillus subtilis, Escherecia coli, Pseudomonas aeruginosa and
Staphylococcus aureus.
In year 2007, Taher, et al. reported that compound 8 also showed a significant
cytotoxic effect (IC50 1.07 μM) against human breast cancer cells. However,
the mechanism of action of this compound on the cancer cells is still not
understood. Furthermore, there is only little radical scavenging effect exhibited
by compound 8 in the antioxidant assay (percent inhibition= 42.7%).
[8]
[9]
[10]
Figure 2.7: Structures of chemical compounds isolated from Calophyllum
enervosum

18
[11]
Figure 2.8: Structures of chemical compounds isolated from Calophyllum
enervosum (continued)
2.2.3 Calophyllum flavoramulum
Advanced glycation end-products (AGEs) are associated with many pathogenic
disorders such as Alzheimer’s disease, diabetes, atherosclerosis, joint diseases
and cardiovascular diseases. They are also responsible for aging and tissue
damage (Ferchichi, et al., 2012). In order to reduce or inhibit their formation,
the bioactive molecules must be α,β-dicarbonyl trapping agents, crosslink
breakers or antioxidants (radical scavengers or metal-ion chelators). Thus, in
year 2012, phytochemical and biological studies on Calophyllum flavoramulum,
a native Malaysian plant, were conducted by Ferchichi, et al. in seeking for
secondary metabolites as potent anti-AGEs drugs.

19
Prior to isolation, an anti-AGEs screening on crude leaves extracts was carried
out, however, only the MeOH extract showed positive result. Consequently
Ferchichi and co-researchers started searching for anti-AGEs natural
compounds from this extract via bioguided fractionation, whereas the
cyclohexane, DCM and EtOAc extracts were subjected to a systematic
phytochemical study.
A total of twelve pure chemical constituents were isolated. Two new
compounds were 3,4-dihydroxytetrahydrofuran-3-carboxylic acid [12] and
flavoramulone [13]. In addition, the other ten known compounds were also
isolated from the leaves extract, namely 3-methoxy-2-hydroxyxanthone [14],
quercitrin [15], 3,4-dihydroxybenzoic acid [16], benzoic acid [17], canophyllol
[18], apetalactone [19], 6-deoxyjacareubin [20], rheediachromenoxanthone
[21], amentoflavone [22] and 2,3-dihydroamentoflavone [23].
As a result from this study, a biflavonoid, amentoflavone [22] and a xanthone,
3-methoxy-2-hydroxyxanthone [14] were reported to be excellent AGEs
inhibitors, with IC50 values of 0.05 and 0.06 mM, respectively. Besides that,
quercitrin [15] and 3,4-dihydroxybenzoic acid [16] were also found to be
moderate AGEs inhibitors, both with IC50 value of 0.5 mM. On contrary, the
two new compounds, 3,4-dihydroxytetrahydrofuran-3-carboxylic acid [12] and
flavoramulone [13] were both reported to be inactive towards anti-AGEs
activities. Apart from that, those compounds with anti-AGEs activity were also

20
evaluated for their antioxidant potential. Among all, amentoflavone [22] has
the highest antioxidant activity (DPPH: 0.41 ± 0.03 μmol TE/ μmol).
[12] [13]
[14] [15]
[16] [17]
Figure 2.9: Structures of chemical compounds isolated from Calophyllum
flavoramulum

21
[18] [19]
[20] [21]
[22] [23]
Figure 2.10: Structures of chemical compounds isolated from Calophyllum
flavoramulum (continued)
22
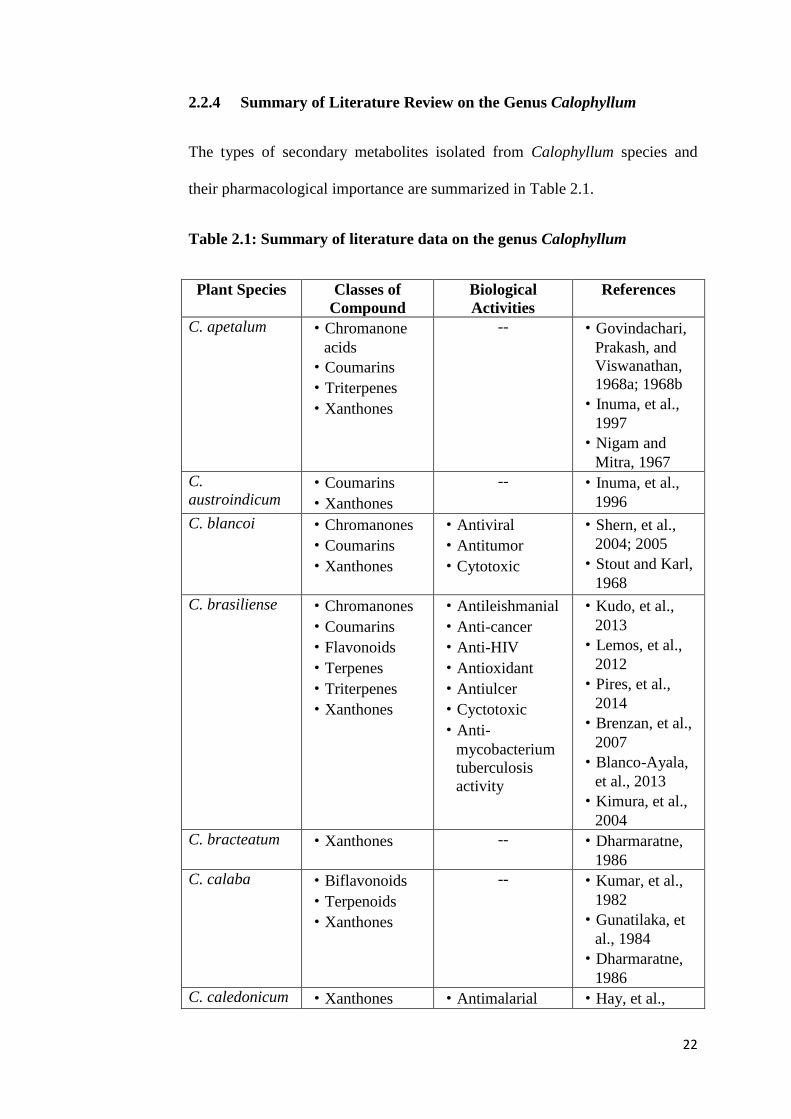
2.2.4 Summary of Literature Review on the Genus Calophyllum
The types of secondary metabolites isolated from Calophyllum species and
their pharmacological importance are summarized in Table 2.1.
Table 2.1: Summary of literature data on the genus Calophyllum
Plant Species Classes of
Compound
Biological
Activities
References
C. apetalum
·Chromanone
acids
·Coumarins
·Triterpenes
·Xanthones
-- ·Govindachari,
Prakash, and
Viswanathan,
1968a; 1968b
·Inuma, et al.,
1997
·Nigam and
Mitra, 1967
C.
austroindicum ·Coumarins
·Xanthones
-- ·Inuma, et al.,
1996
C. blancoi ·Chromanones
·Coumarins
·Xanthones
·Antiviral
·Antitumor
·Cytotoxic
·Shern, et al.,
2004; 2005
·Stout and Karl,
1968
C. brasiliense ·Chromanones
·Coumarins
·Flavonoids
·Terpenes
·Triterpenes
·Xanthones
·Antileishmanial
·Anti-cancer
·Anti-HIV
·Antioxidant
·Antiulcer
·Cyctotoxic
·Anti-
mycobacterium
tuberculosis
activity
·Kudo, et al.,
2013
·Lemos, et al.,
2012
·Pires, et al.,
2014
·Brenzan, et al.,
2007
·Blanco-Ayala,
et al., 2013
·Kimura, et al.,
2004
C. bracteatum ·Xanthones -- ·Dharmaratne,
1986
C. calaba ·Biflavonoids
·Terpenoids
·Xanthones
-- ·Kumar, et al.,
1982
·Gunatilaka, et
al., 1984
·Dharmaratne,
1986
C. caledonicum ·Xanthones ·Antimalarial ·Hay, et al.,

23
2004
·Morel, et al.,
2000; 2002
C. chapelieri ·Chromanone
acids
-- ·Guerreiro,
Kunesch and
Polonsky, 1971
C. cordato-
oblongum
·Chromene
acids
·Coumarins
·Triterpenoids
·Xanthones
-- ·Dharmaratne,
et al., 1985
·Dharmaratne,
et al., 1998
·Dharmaratne,
et al., 1999
·Gunasekera
and
Sultanbawa,
1975
C. costatum ·Coumarins -- ·Stout and
Stevens, 1964
C. decipiens ·Chromanones
·Triterpenes
·Xanthones
·Antibacterial
·Antioxidant
·Ajithabai, et
al., 2012
C. dispar ·Coumarins
·Cytotoxic
·Guilet, et al.,
2001a; 2001b
C.
dryobalonoides ·Chromanone
acids
·Xanthones
-- ·Ha, et al., 2012
C. enervosum ·Benzophenones
·Flavonoids
·Ketones
·Xanthones
·Antimicrobial
·Antioxidant
·Cytotoxic
·Taher, et al.,
2005; 2007
C.
flavorammulum ·Flavonoids
·Organic acids
·Triterpenes
·Xanthones
·Anti-AGEs
activity
·Antioxidant
·Ferchichi, et
al., 2012
C. gracilipes ·Triterpenes
·Xanthones
·Cytotoxic ·Cao, et al.,
1997a; 1997b
·Nasir, et al.,
2013
C. inophyllum ·Coumarins
·Flavonoids
·Triterpenes
·Xanthones
·Antimicrobial
·Antiproliferative
·Anti-tumor
·Cytotoxic
·Antioxidant
·Antidyslipidemi
c
·Yimdjo, et al.,
2004
·Itoigawa, et al.,
2001
·Mah, et al.,
2015
·Prasad, et al.,
2012

24
·Zou, et al.,
2010
C. lanigerum ·Coumarins ·Anti-HIV
·McKee, et al.,
1996
C. lankaensis
(C. zeylancum) ·Chromanone
acids
·Triterpenes
·Xanthones
-- ·Dharmaratne,
Sotheeswaran
and
Balasubramani
am, 1984
C.
macrocarpum ·Neoflavonoids
·Steroids
·Triterpenoids
-- ·Ampofo and
Waterman,
1986
C.
membranaceum ·Xanthones
·Anti-
inflammatory
·Cytotoxic
·Chen, et al.,
2008
·Zou, et al.,
2005
C. moonii ·Triterpenes
·Xanthones
-- ·Dharmaratne
and
Wijesinghe,
1997
C. nodusum ·Xanthones -- ·Nasir, et al.,
2011
C. neo-
ebudicum
·Triterpenes
·Xanthones
-- ·Scheinmann
and Sripong,
1970
C. polyanthum ·Chromanones
·Chromanone
acids
·Coumarins
-- ·Wang, et al.,
2010
·Ma, et al., 2004
C. ramiflorum
·Xanthones -- ·Bhanu,
Scheinmann
and Jefferson,
1975
C.
sclerophyllum ·Chromanone
acids
·Flavonoids
·Xanthones
·Antioxidant ·Jackson,
Locksley and
Scheinnman,
1966
·Rissyelly, 2014
C. soulattri ·Coumarins
·Terpenoids
·Triterpenes
·Xanthones
·Cytotoxic ·Nigam, et al.,
1988
·Mah, et al.,
2015
·Ee, et al., 2011
C. teysmannii
·Chromanone
acids
·Coumarins
·Anti-HIV
·Cytotoxic
·Cao, et al.,
1998
·Fuller, et al.,

25
·Triterpenes
·Xanthones
1994
·Kijjoa, et al.,
2000
·McKee, et al.,
1996
·Lim, et al.,
2015
·Pengsuparp, et
al., 1996
C. thorelii ·Benzophenones
·Triterpenes
·Xanthones
·Cytotoxic ·Nguyen, et al.,
2012
C. thwaitesii ·Neoflavonoids
·Terpenoids
·Triterpenes
·Xanthones
-- ·Dahanayake, et
al., 1974.
·Dharmaratne,
et al., 1986
·Dharmaratne
and
Wanigasekera,
1996
·Dharmaratne,
Sotheeswaran
and
Balasubramani
am, 1984
C. tomentosum ·Benzopyrans
·Coumarins
·Xanthones
·Triterpenes
-- ·Babu, et al.,
1994
·Banerji, et al.,
1994
·Karunayake, et
al., 1981
·Nigam and
Mitra, 1967
·Govindachari,
Prakash, and
Viswanathan,
1968b
C. verticillatum ·Neoflvonoids
·Triterpenoids
·Mulloscicidal
acitivity
·Ravelonjato,
Kunesch and
Poisson, 1987
C. walker ·Neoflavonoids
·Triterpenes
·Terpenoids
·Xanthones
-- ·Ampofo and
Waterman,
1986
·Dahanayake, et
al., 1974.

26
CHAPTER 3
MATERIALS AND METHODOLOGY
3.1 Plant Materials
The plant studied in this project was Calophyllum sclerophyllum. The stem
bark of this plant was collected from the jungle in Landeh, Sarawak. It was
identified by Mr. Tinjan Anak Kuda, a botanist from the Forest Department of
Sarawak. A voucher specimen (UITM 3008) was deposited at the herbarium of
Universiti Teknologi MARA, Sarawak.
3.2 Chemical Reagents
The solvents and materials used in this project are summarized in Table 3.1 to
Table 3.6.
Table 3.1: Industrial grade solvents and materials used in the extraction,
isolation and purification of chemical constituents
Solvents/Materials Molecular
formula
Density, ρ
(g cm-3
)
Source, Country
n-Hexane CH3(CH2)4CH3 0.659 Merck, Germany
Dichloromethane CH2Cl2 1.325 Fisher Scientific, UK
Ethyl acetate CH3COOC2H5 0.902 Lab Scan, Ireland
Acetone CH3COCH3 0.791 QReC, Malaysia
Methanol CH3OH 0.791 Mallinckrodit
Chemicals, Phillisburg
Silica gel (60 Å) SiO2 - Nacalai Tesque, Japan
Sodium sulphate
anhydrous
Na2SO4 2.66 John Kollin
Corporation, USA

27
Table 3.2: Deuterated solvents used in NMR analysis
Solvents Molecular formula Source, Country
Deuterated chloroform CDCl3 Acros Organics, Belgium
Acetone-d6 CD3COCD3 Acros Organics, Belgium
Methanol-d4 CD3OD Acros Organics, Belgium
Table 3.3: HPLC grade solvents and materials used in LC- and GC-MS
analysis
Solvents/Materials Molecular
formula
Density, ρ
(g cm-3
)
Source, Country
Acetonitrile CH3CN 41.05 Fisher Scientific, UK
Methanol CH3OH 32.04 Fisher Scientific, UK
Nylon syringe filter
(0.5 μm)
- - Membrane solution, USA
Table 3.4: Analytical grade solvent and materials used in TLC analysis
Solvents/Materials Molecular formula Source, Country
TLC silica gel 60 F254 - Merck, Germany
Iodine I2 Fisher Scientific, UK
n-Hexane CH3(CH2)4CH3 R & M Chemicals, UK
Dichloromethane CH2Cl2 QReC (Malaysia)
Ethyl acetate CH3COOC2H5 Fisher Scientific, UK
Table 3.5: Analytical grade solvents and materials used in UV-Vis analysis
Solvents/Materials Molecular formula Source, Country
Chloroform CHCl3 Fisher Scientific, UK
Cuvette (quartz) - Membrane solution, USA
Table 3.6: Chemical reagents and materials used in antioxidant assay
Chemical reagents/Materials Source, Country
Kaempferol Sigma-Aldrich, USA
Ascorbic acid (Vitamin C) Sigma-Aldrich, USA
1,1-Diphenyl-2-picryhydrazyl (DPPH) Sigma-Aldrich, USA
96-well plate Techno Plastic, Switzerland

28
3.3 Methodology
3.3.1 Sequential Solvent Extraction, Isolation and Purification of
Chemical Constituents from Calophyllum sclerophyllum
Prior to any isolation and purification work, natural products have to be
extracted from the sample material. In this study, a simple extraction method
called maceration was chosen, in which the plant material was placed in a
closed container and solvent was added until cover the top of the sample.
Approximately 1.5 kg of stem bark of Calophyllum sclerophyllum was
collected, air dried and finely ground into powder form. This is to ensure
powdered plant materials have maximum surface area contact with solvents for
an efficient extraction. The powdered stem bark was soaked in
dichloromethane for 48 hours at room temperature. It was noted that plant
extracts should not be stored in solvent for long periods or in sunlight, because
this will increases the risk of artifact formation and decomposition of extract
constituents. The dichlormethane crude extract was filtered and solvent was
evaporated under reduced pressure via a rotary evaporator to give a dark
viscous semisolid extract. The steps were repeated twice and the extracts were
combined.
The plant material was then extracted subsequently with increasing polarity
solvents, which were ethyl acetate and methanol, twice for each solvents as

29
described in the first extraction. Meanwhile, in order to minimize solvent
wastage, the recovered solvent was used during second time soaking. The dried
masses of the dichloromethane, ethyl acetate and methanol crude extracts were
18.6149 g, 49.5728 g and 27.6303 g, resepectively. About 2 g of each crude
extract were kept for antioxiadant assay.
The crude extracts of Calophyllum sclerophyllum were subjected to gravity
column chromatography using gradient elution and thereby separated into a
series of fractions. The chemical compositions of fractions were analyzed using
TLC. Fractions that showed identical pattern of spots on TLC were combined
for further purification using similar chromatographic technique. The
effectiveness of separation was monitored by TLC analyses. The process of
purification and TLC analysis were repeated until pure compounds were
obtained. Compounds that showed a single spot on the TLC plate were sent for
spectroscopic analyses such as NMR, IR, UV-Vis and LC-MS for structural
investigation.
3.3.2 Column Chromatography
Column chromatography is a common technique used to isolate and purify
chemical constituents from the plant crude extracts. In column chromatography,
silica gel as the stationary phase is held in a glass column, and the mobile
phase (solvent) is flown through it by means of gravitational force. The

30
components distribute themselves between the mobile phase and the stationary
phase. Separation is based on affinity of components towards both phases, thus
resulting differences in migration rates. Consequently, the components in a
mixture separate into different color or colorless bands along the column. The
eluents were collected according to separated color bands or volumes.
The sizes of columns used were 25 mm, 30 mm and 80 mm in internal
diameter, depending on the amount of sample. The sample was prepared via
dry packing method in which the sample was dissolved in a suitable amount of
solvent, followed by adding dropwise into silica gel and mixed homogeneously.
In a separate beaker, silica gel was mixed with hexane to form slurry. It was
then poured into a glass column. To obtain a compact packing of stationary
phase, the column was tapped gently to allow bubbles to rise and the silica to
settle down gradually. The prepared sample was then subjected to column
chromatography using gradient elution in increasing polarity to separate the
compounds of different polarities. On top of sample and sintered disc, a thin
layer of sea sand or drying agent was added to serve as protection layer,
prevent leakage of silica gel as well as to absorb moisture from the mobile
phase.
During elution, flow rate of mobile phase is important in controlling the quality
of separation. If the flow rate is too slow, diffusion process may lead to band
broadening. Conversely, if it is too fast, there may not be enough time for
compounds to achieve equilibrium distribution between stationary and mobile

31
phases and the compounds may be forced down the column without proper
separation. For small diameter columns, the optimal rate is lower than that for
large diameter columns. Therefore, larger columns can be run with a higher
flow rate than smaller columns. Furthermore, to ensure a better isolation, air
bubbles should be avoided within the column bed. If this happens, bubbles can
be removed by wrapping the column with a layer of tissue wetted methanol.
Volatile methanol will give a cold effect on outer wall of column, hence
resulting in contraction of column bed. Figure 3.1 shows the apparatus set up
for column chromatography.
Figure 3.1 Apparatus set up for column chromatography

32
3.3.3 Thin Layer Chromatography (TLC)
To examine the purity or chemical composition of fractions, TLC analysis was
carried out by using precoated aluminium sheets of silica gel 60 F254 Merck.
Initially, a baseline was drawn on the TLC plate, suitable amount of sample
solution was spotted onto it using a micro capillary tube. This plate was then
placed in a developing chamber, which containing solvent mixture and was
pre-saturated with solvent vapour. The solvent (mobile phase) migrates up the
plate through the silica sorbent (stationary phase) due to capillary action.
According to planar adsorption chromatography principle, polar compounds
will adsorbed strongly on the stationary phase, thus move slowly up the plate
as the solvent migrates. These compounds will therefore have small retention
factor, Rf. Contrastly, non-polar compounds will have larger Rf values as they
show less affinity towards the stationary phase. As a consequence of
development, components of a fraction will be separated according to their
relative polarities. The spots were visualized under a UV lamp at 254 nm and
356 nm, and iodine vapor. The Rf value of each analyte can be calculated by
using the following formula:
m m
m

33
3.3.4 TLC Detection Methods
3.3.4.1 UV Detection
TLC plates are usually impregnated with indicator such as manganese-
activated zinc silicate, which will emit a pale green light and pale purple blue
light under short and long wavelength UV lights, respectively. With effective
visualization, the UV active compounds containing aromatic rings and
conjugated systems can be detected. At short wavelength (254 nm), compounds
will appear as dark grey spots on a bright green background. Compounds that
absorb light at long wavelength (365 nm) will appear as fluorescence color
spots on a pale purple background when UV light is irradiated onto the plate.
Care should be taken not to direct UV light from these lamps to eyes or on skin
as UV light is mutagenic.
3.3.4.2 Iodine Vapour Detection
Iodine chamber was prepared by introducing iodine crystals into a close
container. The sample TLC plate was then placed into this chamber which was
saturated with iodine vapour, for few minutes before it was taken out. Iodine
forms dark brown complex with compounds that could not be observed under
UV light, such as terpenoids or non-conjugated compounds. The observed

34
sports were marked down immediately using a pencil as the staining effect of
iodine on TLC plate was temporary.
Figure 3.2 TLC plate under different detection methods
3.4 Instruments
3.4.1 Nuclear Magnetic Resonance (NMR)
NMR is a spectroscopic method that provides valuable information on the
number and types of protons and carbons present in a molecule, and the
structural relationships among these atoms. As each nucleus of an atom has
different surrounding chemical environment, each atom experiences distinct
magnetic field and hence produces characteristic signal in the chemical shift
region which aids in elucidation of structure of a molecule. In this project,
35
JEOL JNM-ECX 400 MHz spectrometer was used to obtain 1H-NMR,
13C-
NMR, HMQC, and HMBC spectra for each pure compound.
Samples were prepared by dissolving them in deuterated solvents, such as
deuterated dichloromethane, acetone and methanol, and were then transferred
to NMR tubes up to 4 cm in height. Selection of solvents depends on the
degree of dissolution. The tubes were capped and wrapped with parafilm to
prevent solvent evaporation. Tetramethylsilane (TMS) was used as an internal
standard during analysis.
3.4.2 Infrared (IR) Spectroscopy
Infrared (IR) spectroscopy is used to identify different functional groups
present in a molecule. The specific fingerprint region is helpful in structural
determination of compounds. Preparation of sample could be done by mixing
homogenously the solid sample with potassium bromide (KBr) in a ratio of
1:10, and pressing the mixture under high pressure. This gives KBr pellet and
is inserted into a sample holder for IR measurement. Perkin Elmer 2000-FTIR
spectrophotometer was used to obtain IR spectrum in the range of 4000 to 400
cm-1
.

36
3.4.3 Ultraviolet-Visible (UV-Vis) Spectroscopy
UV-Vis spectroscopy gives information about the chromophores present in a
molecule by defining its conjugated system. The classes of compounds thus
can be primarily identified from characteristic absorption peaks. Perkin Elmer
Lambda 35, a double-beam instrument was used in this analysis. In a double-
beam spectrophotometer, radiation is split into two compartments with equal
radiant energy, one beam passing through the sample and the other through the
blank solution. Sample was dissolved and diluted with chloroform. Chloroform
was used as blank solvent. For each sample, absorption spectrum was obtained
by scanning the sample in the range of 200–400 nm.
3.4.4 Liquid Chromatography-Mass Spectrometry (LC-MS)
The accurate molecular mass, molecular formula, and fragmentation pattern of
a non-volatile compound can be obtained precisely from a coupled technique,
namely liquid chromatography – mass spectrometry (LC-MS). About 2 mg of
sample was dissolved in 2 mL HPLC grade solvent and filtered to remove any
undissolved solid particles before it was introduced into the LC-MS. 5 μL of
sample solution was auto-injected into the column, followed by flushing with
30% water and 70% methanol in a flow rate of 0.6 mL/min. In this project,
Agilent Technologies 6520 LC/MS equipped with an electrospray source was
used to ionize the sample solutions into free cations for analysis.

37
3.4.5 Gas Chromatography–Mass Spectrometry (GC-MS)
GC-MS is a coupled technique that not only used for determining nominal
molecular weight, molecular formula and fragmentation of a compound, but
also for the comparison of chromatogram fingerprint. A concentration of 100
ppm of sample was prepared by dissolving in HPLC grade solvent. 5 μL of
sample solution was auto-injected into the non-polar BPX5 column, followed
by flushing with inert helium gas in a flow rate of 0.6 mL/min. In this project,
Shimadzu GC-MS QP2010 equipped with a flame ionization detector (FID)
was used to ionize the sample solution into free cations for analysis.
3.4.6 Melting Point Apparatus
Melting point measurement is essential in examine purity of a compound. A
pure crystalline compound shows a narrow and sharp range of melting point
when changing from solid state to liquid state. Conversely, if impurities are
present, compound may have a broader range of melting point. In this study,
the melting point measurement was carried out by using Stuart SMP 10 melting
point apparatus. Trace amount of solid sample was introduced into a hematocrit
capillary tube and heated until it completely melted. The temperature range at
which the compound starts and entirely melted was recorded.

38
3.5 Antioxidant Assay
For preparation of master stocks at concentration of 1 mg/mL, crude extracts,
isolated compounds and standard compounds (kaempferol and ascorbic acid)
were dissolved separately in methanol. These master stocks were then
sonicated for 5 minutes in order to form homogenous solutions. Similarly, a
DPPH solution with concentration of 2 mg/mL was prepared by dissolving
DPPH powder in methanol, and then sonicated. Master stocks of test samples
and DPPH solution were kept in a 4 oC chiller in dark condition to avoid
exposure to light which may led to decomposition of chemicals.
Test solutions were prepared through serial dilution of master stocks, at
concentrations of 240, 120, 60, 30, 15, 7.5 and 3.75 μg/mL in a 96-well plate,
followed by addition of 10 μL DPPH solution and 90 μL methanol.
Kaempferol and ascorbic acid were used as positive control in this assay. For
the blank or negative control, DPPH solution in methanol without test sample
was used.
The plate was immediately wrapped with aluminium foil to avoid solvent
evaporation and incubated for 30 minutes. The absorbance of the solutions in
each well was measured at 520 nm using a microplate reader. The assay was
performed in triplicate and the average absorbance for each concentration was
39
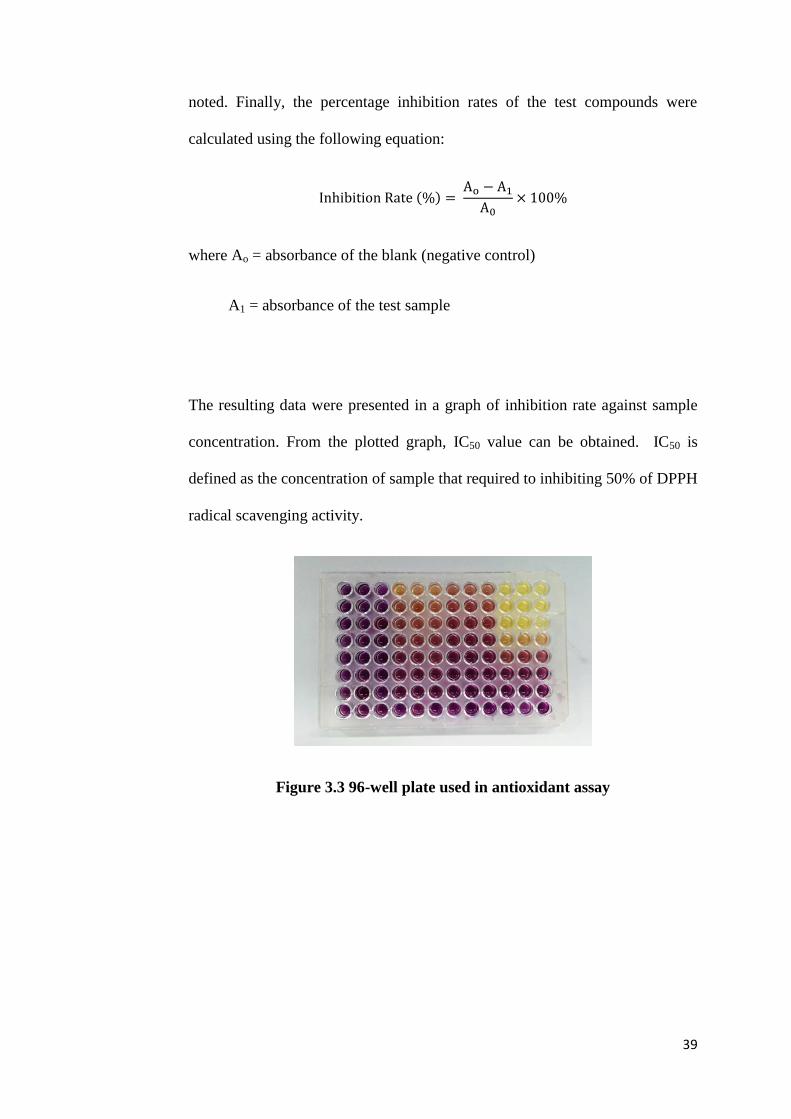
noted. Finally, the percentage inhibition rates of the test compounds were
calculated using the following equation:
where Ao = absorbance of the blank (negative control)
A1 = absorbance of the test sample
The resulting data were presented in a graph of inhibition rate against sample
concentration. From the plotted graph, IC50 value can be obtained. IC50 is
defined as the concentration of sample that required to inhibiting 50% of DPPH
radical scavenging activity.
Figure 3.3 96-well plate used in antioxidant assay

40
CHAPTER 4
RESULTS AND DISCUSSION
4.1 Chemical Constituents Isolated from Calophyllum sclerophyllum
Before isolation, selection of solvent system is important for column
chromatography. The solvent system that gives the best separation of
compounds on TLC plate is generally used as a mobile phase for column
chromatography with the same stationary phase. In this study, both hexane:
ethyl acetate and ethyl acetate: acetone solvent systems were selected as
mobile phase as they showed good separation effect on TLC plates. Whereas
methanol was adopted as the last mobile phase to elute out the remaining
compounds in the column.
The ethyl acetate crude extract was first subjected to column chromatography
using a 80 mm internal diameter glass column. Silica gel was used as column
bed and sample was eluted with hexane-ethyl acetate, ethyl acetate-acetone and
lastly methanol, in stepwise gradient elution. The separation afforded a total of
19 fractions and they were labeled as A1 to A19. Due to similar migration rate
of spots on TLC plate, fractions A11 to A13 were combined for further
separation using a smaller internal diameter column (30 mm) to yield
subfractions, B1 to B41. Among these subfractions, B3, B17 and B21 showed a
single spot on TLC plate. Meanwhile, subfractions B14 and B15 were

41
combined for further column chromatography. Separation results in a series of
fractions, C1 to C19. Similarly, among these fractions, C7 displayed a single
spot during TLC analysis. In order to confirm the purity of these single spot
isolates, an adequate amount of each sample was taken out from these
subfractions and prepared for NMR analysis.
According to spectroscopic data obtained and comparison with literature data,
the pure compounds were identified as friedelin [24], 5,7-dihydroxy-6-(3-
methylbutyryl)-4-phenylcoumarin [25], 5,7-dihydroxy-6-(2-methylbutyryl)-4-
phenylcoumarin [26] and isodispar B [27]. Besides NMR analysis, other
spectroscopic techniques including IR, GC-MS, LC-MS and UV-Vis were also
used in structural elucidation for these pure compounds.
Figure 4.1 Isolation pathways of pure compounds

42
4.2 Chemical Identification and Structural Characterization of 5,7-
Dihydroxy-6-(2-methylbutyryl)-4-phenylcoumarin [25]
Figure 4.2: Molecular structure of 5,7-dihydroxy-6-(2-methylbutyryl)-4-
phenylcoumarin [25]
A total of 237 mg of yellow crystals was isolated and identified as a coumarin,
namely 5,7-dihydroxy-6-(2-methylbutyryl)-4-phenylcoumarin. It has a melting
point of 203-205 oC (Lit. 201-202
oC, Crombie, et al., 1987). During TLC
analysis, compound 25 appeared as a single dark grey spot under short λ UV
light at 254 nm, and a dark brown spot when treated with iodine vapour, due to
its phenolic nature. The retention factor, Rf value of single spot is 0.61 via a
mixture of hexane, dichloromethane and ethyl acetate (1:2:1) as mobile phase.
Meanwhile, the elemental composition of compound 25 was determined by
both GC-MS and LC-MS. A molecular ion peak [M]+ with a nominal mass of
338 g mol-1
shown in GC-MS spectrum (Figure 4.3) was corresponding to the
molecular formula C20H18O5. Besides, the HRESI mass spectrum (Figure 4.4)
shows dominant ion at m/z 339.1223, which is consistent with the expected
protonated molecular ion, [M+H]+. Protonated molecular ion is expected
because the sample was analyzed under positive ionization mode. Hence, the

43
accurate mass of the molecular ion is deduced to be 338.1154 g mol-1
, which is
97.21% match with the calculated value of 338.1150 g mol-1
.
Figure 4.3: GC-MS spectrum of compound 25
Figure 4.4: HRESIMS spectrum of compound 25
The UV-Vis spectrum is mainly used to deduce the conjugation effect present
in the structure of a chemical compound. Coumarins with no substituent group
show maximum absorption at 274 and 311 nm, resulting from the benzene ring
and pyrone ring in its skeleton, respectively. Compound 25 with a coumarin
showed absorption peaks maxima at wavelengths of 278 and 330 nm in Figure

44
4.5. The introduction of hydroxyl group into the coumarin nucleus at C-5 and -
7 and a phenyl group at C-4 causes bathochromic shift of the principal
absorption bands at 274 and 311 nm to 278 and 330 nm, respectively.
Figure 4.5: UV-Vis spectrum of compound 25
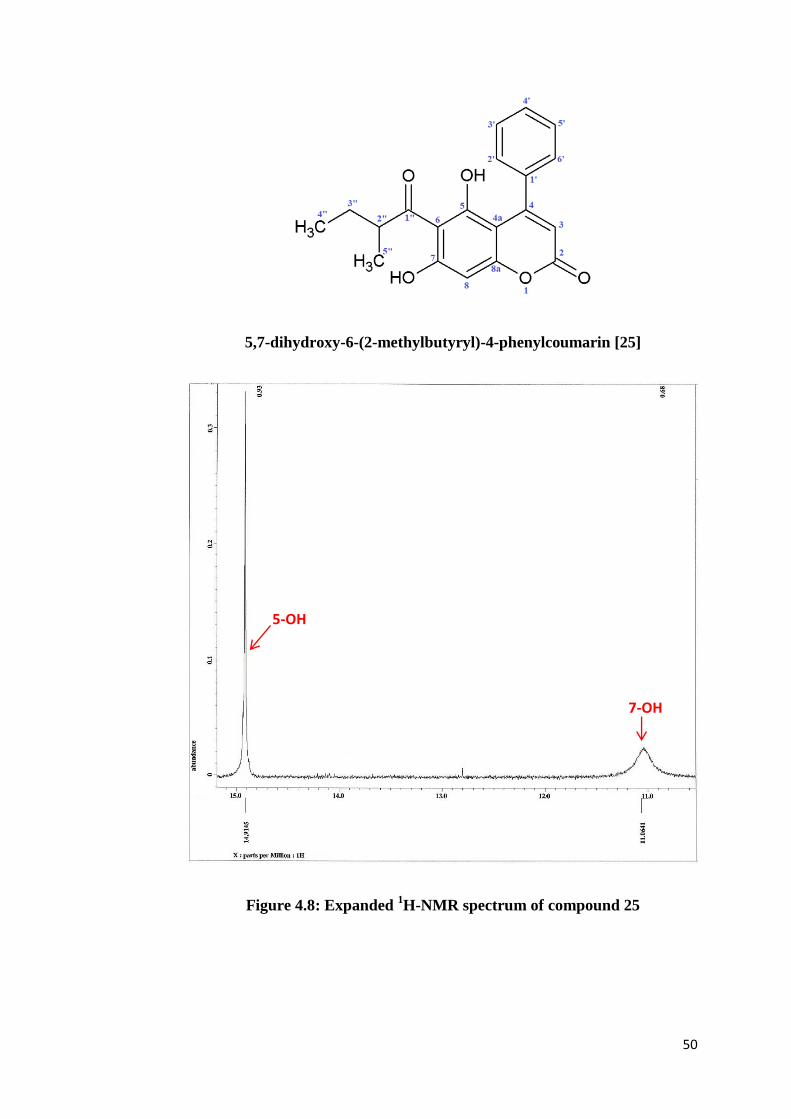
The chemical structure of compound 25 was elucidated based on the 1D- and
2D-NMR spectral data. In the 1H-NMR spectrum (Figure 4.7), the protons in
the aryl group displayed multiplet peaks integrated for five protons at δH 7.3. A
sharp singlet signal at δH 14.91 was assigned to the chelated hydroxyl proton,
5-OH. This proton is strongly deshielded via intramolecular hydrogen bonding
with the keto group. Contrastly, the free hydroxyl proton 7-OH gave a broad
singlet at δH 11.06. On the other hand, both aromatic protons H-8 and H-3
appeared as singlet signals at δH 6.41 and δH 5.83, respectively. The methyl
protons at C-4” and C-5” are in the upfield regions, each carrying three protons
but showed different multiplicity. The signal of H-4” observed at δH 0.87 was a
triplet (J = 7.4 Hz) because of the coupling with two adjacent protons H-3”.
Whereas, a doublet signal at δH 1.11 (J = 6.7 Hz) was assigned to H-5” as there

45
is only one neighbouring proton found on carbon C-2”. Meanwhile, proton H-2”
gave a relatively deshielded multiplet at δH 3.87 due to anisotropic effect
extended by the adjacent carbonyl group. The methylene protons Ha-3” and Hb-
3” experience a slight different in their magnetic environment due to their close
vicinity to the carbonyl group. One of the protons experiences a relatively
greater deshielding effect than the other one, thus resulting in non-equivalent
methylene protons Ha and Hb which appeared as doublet of quartets separately
at δH 1.80 (J = 7.4, 13.4 Hz) and 1.36 (J = 7.3, 14.0 Hz).
A total of 20 carbon signals were observed in 13
C-NMR spectrum (Figure 4.11),
indicating that compound 25 to consist of 20 carbons. Generally, the chemical
shift for carbonyl group of ketone is in the range of δc 185-220 ppm, while for
ester is δc 155-185, due to presence of highly electronegative O atom. In this
case, the two very downfield signals at δc 211.8 and 158.9 were attributed to
carbonyl groups, which are C-1” and C-2, respectively. The five aromatic
carbons resonances at δc 127.3, 127.5 and 128.0 were assigned to C-2’& 6’, C-
3’ & 5’ and C-4’, respectively. In short, the presence of sp2 hybridized carbons
including aromatic and carbonyl carbons were found to give carbon signals in
the chemical shift regions above δc 90. On the contrary, signals appeared in the
region below δc 90 were assigned to sp3 hybridized carbons, such as carbon C-
2”, 3”, 4” and 5” in the methylbutyryl substituent group.
With HMQC analysis, the types of carbons can be determined by the direct
1JCH coupling between protons and carbons. In HMQC spectrum (Figure 4.14),

46
the presence of two methyl carbons, one methylene carbons, eight methine
carbons and nine quaternary carbons were observed. Proton signals at δH 0.87
(H-4”) and δH 1.11 (H-5”) were correlated to carbon signals at δc 11.3 (C-4”)
and δc 15.9 (C-5”), respectively, implying the existence of methyl carbons.
Likewise, methylene carbon was assigned to C-3” as both proton signals at δH
1.80 and δH 1.36 intersect with carbon signal δC 26.7 to give two cross peaks in
the spectrum. In addition, presence of methine carbons was deduced from the
coupling interactions between a carbon and a proton, such as C-2” with H-2”,
C-3” with H-3” and C-8 with H-8. It was noted that quaternary carbons do not
give any cross peaks in HMQC spectrum. Meanwhile, HMBC spectra (Figures
4.15-4.18) provide carbon to proton long-range coupling information,
involving 2JCH and
3JCH correlations. From the HMBC spectrum, the hydroxyl
proton at C-5 (δH 14.91) showed 2J correlation with an oxygenated quaternary
carbon at δC 165.8 (C-5) and 3J correlations with two quaternary carbons at δC
106.2 (C-6) and δC 101.7 (C-4a), which confirmed the position of hydroxyl
group at C-5. The remaining correlations are listed in Table 4.1.
Assignment of chemical structure of compound 25 was further supported by
FTIR analysis, showing the presence of aromatic sp2 C-H stretch at 3064 cm
-1,
sp3 C-H stretch at 2971 cm
-1, C=O stretch at 1691 cm
-1, aromatic C=C stretch
at 1591 and 1460 cm-1
, and C-O stretch at 1227 cm-1
. Meanwhile, O-H stretch
appeared as a broad peak which occurs in the range of 3400- 3200 cm-1
, thus is
overlapping with C-H stretch. Besides stretching vibrations, C-H in-plane
bending vibration was observed at 1372 cm-1
. Whereas, the peaks with medium
to weak intensity appeared at 946, 892, 831 and 776 cm-1
in IR spectrum
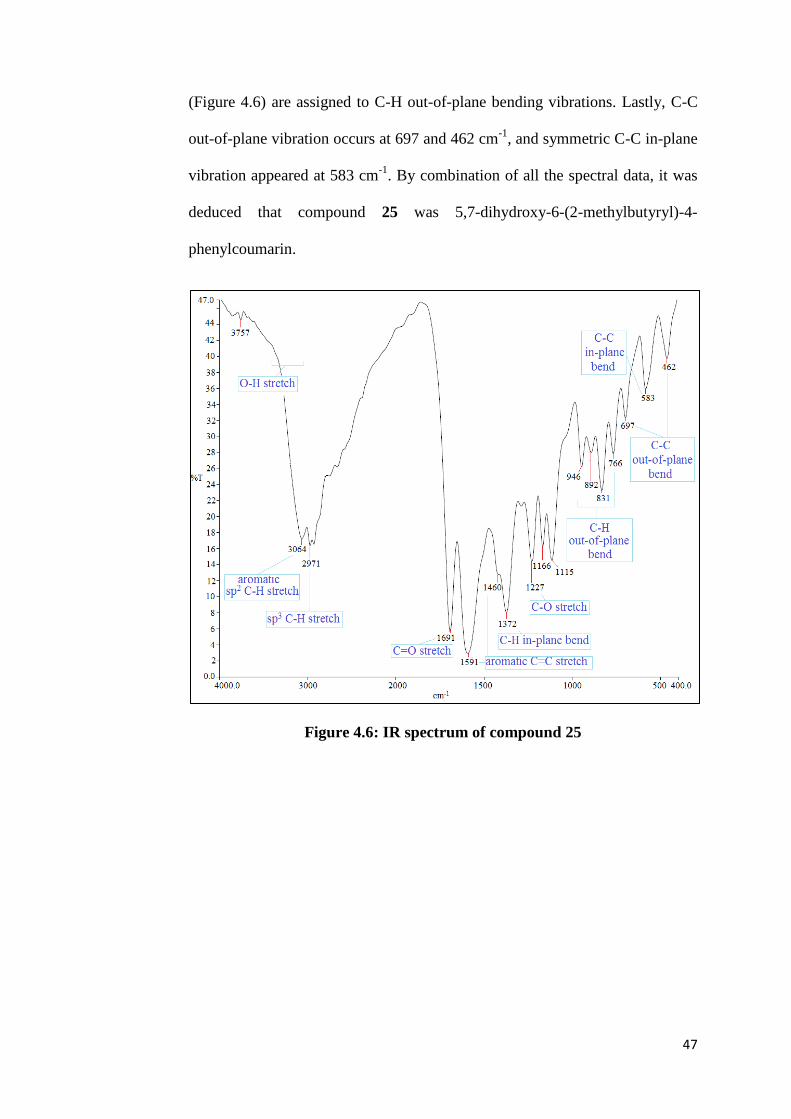
47
(Figure 4.6) are assigned to C-H out-of-plane bending vibrations. Lastly, C-C
out-of-plane vibration occurs at 697 and 462 cm-1
, and symmetric C-C in-plane
vibration appeared at 583 cm-1
. By combination of all the spectral data, it was
deduced that compound 25 was 5,7-dihydroxy-6-(2-methylbutyryl)-4-
phenylcoumarin.
Figure 4.6: IR spectrum of compound 25

48
Table 4.1: Summary of NMR data for 5,7-dihydroxy-6-(2-methylbutyryl)-
4-phenylcoumarin [25]
Position δH (ppm), Integration
and Multiplicity
δC (ppm) HMBC
1 - - -
2 - 158.9 -
3 5.83 (1H, s) 112.1 C-1’, 2, 4a
4 - 156.0 -
4a - 101.7 -
5 - 165.8 -
6 - 106.2 -
7 - 163.1 -
8 6.41 (1H, s) 95.0 C-4a, 6 , 7, 8a
8a - 160.4 -
1’ - 139.6 -
2’ & 6’ 7.35 (2H, m) 127.3 C-3’, 4’, 5’
3’ & 5’ 7.37 (2H, m) 127.5 C-2’, 4’, 6’
4’ 7.39 (1H, m) 128.0 C-2’, 3’, 5’, 6’
1” - 211.8 -
2” 3.87 (1H, m) 46.2 C-3”
3” 1.80 (1Ha, dq, J = 7.4 Hz,
13.4 Hz)
1.36 (1Hb, dq, J = 7.3 Hz,
14.0 Hz)
26.7 C-2”, 4”
4” 0.87 (3H, t, J = 7.4 Hz) 11.3 C-3”, C-2”
5” 1.11 (3H, d, J = 6.7 Hz) 15.9 C-1”, 2”, 3”
5-OH 14.91 (1H, s) - C-4a, 5, 6
7-OH 11.06 (1H, brs) - -

49
5,7-dihydroxy-6-(2-methylbutyryl)-4-phenylcoumarin [25]
Figure 4.7: 1H-NMR spectrum of compound 25
5-OH 7-OH
H-2’, 3’,4’,5’,6’
H-8 H-3
H-2”
solvent peak (acetone-d6)
H-3”
H-4”
H-5”
50
5,7-dihydroxy-6-(2-methylbutyryl)-4-phenylcoumarin [25]
Figure 4.8: Expanded 1H-NMR spectrum of compound 25
5-OH
7-OH

51
5,7-dihydroxy-6-(2-methylbutyryl)-4-phenylcoumarin [25]
Figure 4.9: Expanded 1H-NMR spectrum of compound 25
H-2’,3’,4’,5’,6’
H-8 H-3

52
5,7-dihydroxy-6-(2-methylbutyryl)-4-phenylcoumarin [25]
Figure 4.10: Expanded 1H-NMR spectrum of compound 25
H-2” H-3”
H-5”
H-4”
Residual water peak
Solvent peak (acetone-d6)

53
5,7-dihydroxy-6-(2-methylbutyryl)-4-phenylcoumarin [25]
Figure 4.11: 13
C-NMR spectrum of compound 25
C-1” C-5
C-7
C-8a
C-2
C-4 C-1’
C-4’
C-3’,5’
C-2’,6’
C-3 C-6
C-4a C-8 C-2”
C-3”
C-5”
C-4”
Solvent peak (acetone-d6)
Solvent peak (acetone-d6)

54
5,7-dihydroxy-6-(2-methylbutyryl)-4-phenylcoumarin [25]
Figure 4.12: Expanded 13
C-NMR spectrum of compound 25
C-5
C-7
C-8a
C-2
C-4 C-1’
C-4’
C-3’,5’
C-2’,6’
C-3 C-8
C-6 C-4a

55
5,7-dihydroxy-6-(2-methylbutyryl)-4-phenylcoumarin [25]
Figure 4.13: Expanded 13
C-NMR spectrum of compound 25
Solvent peak (acetone-d6)
C-2” C-3” C-5” C-4”

56
5,7-dihydroxy-6-(2-methylbutyryl)-4-phenylcoumarin [25]
Figure 4.14: HMQC spectrum of compound 25
5-OH 7-OH
H-2’,3’, 4’,5’,6’
H-8 H-3 H-2” H-3”
H-4” H-5”
C-4” C-5”
C-3”
C-2”
C-8
C-3
C-2’,3’,4’,5’,6’
C-4a C-6
C-4
C-5 C-7 C-8a C-2
C-1’
water solvent
solvent

57
5,7-dihydroxy-6-(2-methylbutyryl)-4-phenylcoumarin [25]
Figure 4.15: Expanded HMBC spectrum of compound 25
5-OH
C-4a
C-6
C-5
C-3
C-4’ C-2’,6’ C-3’,5’
C-7 C-8a C-2 C-4
5-OH, C-4a, C-6, C-5

58
5,7-dihydroxy-6-(2-methylbutyryl)-4-phenylcoumarin [25]
Figure 4.16: Expanded HMBC spectrum of compound 25
H-2’,3’,4’,5’,6’ H-8 H-3
C-4’
C-2’,6’
C-3’,5’
C-4a
C-6
C-8a C-7
C-2
C-1’
C-8
C-4
C-3
C-5
H-8, C-4a, C-6, C-8a, C-7
H-3, C-4a, C-1’, C-2
59
5,7-dihydroxy-6-(2-methylbutyryl)-4-phenylcoumarin [25]
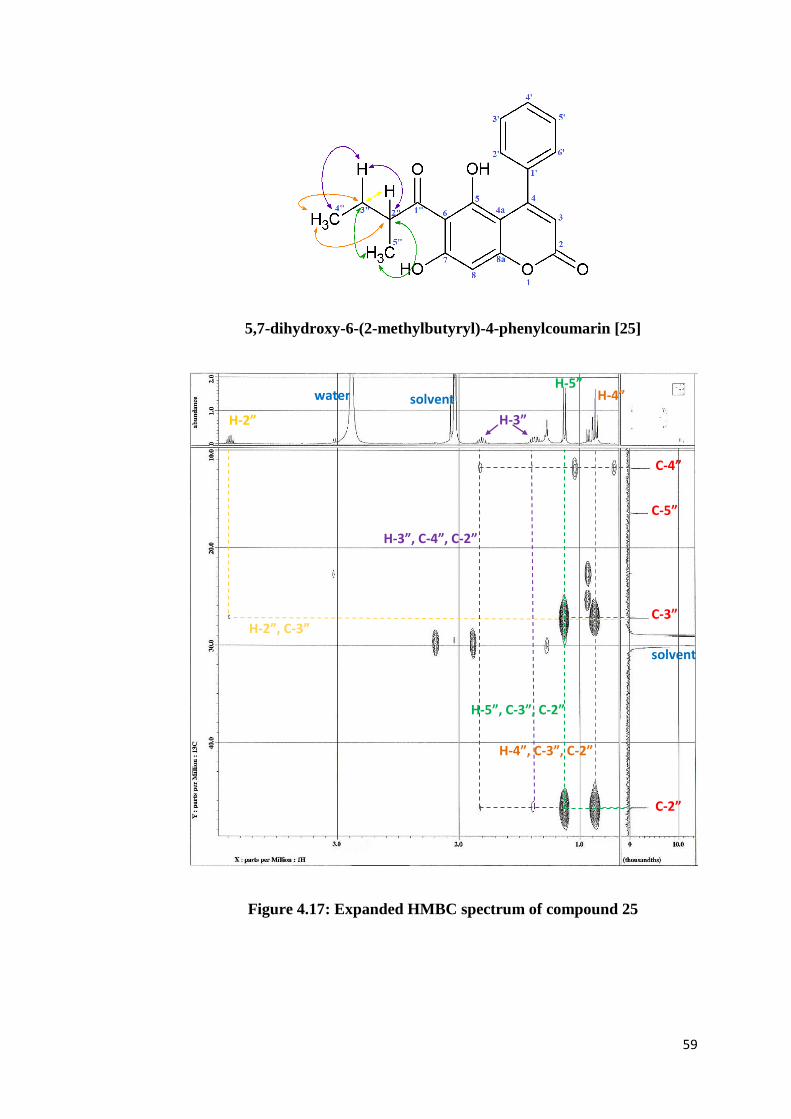
Figure 4.17: Expanded HMBC spectrum of compound 25
H-2”
water solvent
H-3”
H-5” H-4”
C-4”
C-2”
C-5”
C-3”
solvent
H-2”, C-3”
H-3”, C-4”, C-2”
H-5”, C-3”, C-2”
H-4”, C-3”, C-2”

60
5,7-dihydroxy-6-(2-methylbutyryl)-4-phenylcoumarin [25]
Figure 4.18: Expanded HMBC spectrum of compound 25
solvent
solvent
H-3”
H-5”
C-1”

61
4.3 Chemical Identification and Structural Characterization of 5,7-
Dihydroxy-6-(3-methylbutyryl)-4-phenylcoumarin
Figure 4.19: The molecular structure of 5,7-dihydroxy-6-(3-
methylbutyryl)-4-phenylcoumarin [26]
Compound 26 was isolated as a yellow crystalline compound with the amount
of 185.4 mg. Since it is a structural isomer of compound 25, thus it has the
same molecular formula C20H18O5 with compound 25, but with a different acyl
substituent group. In GC-MS chromatogram (Figure 4.20), compound 26 gave
a molecular ion peak [M]+ with a nominal mass of 338 g mol
-1. While in
HRESI mass spectrum (Figure 4.21), an accurate mass of 338.1149 g mol-1
was
reported for compound 26. Both molecular weights obtained are corresponding
to the molecular formula C20H18O5.
Figure 4.20: GC-MS spectrum of compound 26

62
Figure 4.21: HRESIMS spectrum of compound 26
In addition, compound 26 has a melting point of 249-251 oC (Lit. 244-245
oC,
Crombie, et al., 1987). In TLC analysis, a single spot with a retention factor, Rf
value of 0.58 was obtained using a mixture of hexane and ethyl acetate (1:3) as
mobile phase. Due to its aromatic nature, it appeared as dark grey spot when
visualized under short λ UV light and stained with iodine vapour to form a dark
brown spot. The presence of a coumarin moiety in the chemical structure of
compound 26 was deduced from the UV-Vis spectrum (Figure 4.22), in which
the characteristic absorption peaks appeared at 279 and 330 nm. Absorption
peaks were resulted from π → π* transitions of benzene and pyrone moiety.
Figure 4.22: UV-Vis spectrum of compound 26
200.0 220 240 260 280 300 320 340 360 380 400.0
0.01
0.5
1.0
1.5
2.0
2.5
3.0
3.50
nm
A
329.98,1.2641
278.58,2.6069
245.12,1.2709
222.32,0.47139
211.87,1.2974

63
Comparison of the 1H-NMR spectra (Figure 4.10 and 4.25) for compound 25
and 26 showed very obvious for several proton signals in the upfield region
below δH 4.0. In particular, a doublet signal at δH 0.95 integrated for six
protons were assigned to the two groups of chemically equivalent methyl
protons H-4” and H-5”. However, the two groups of methyl protons H-4” and
H-5” in compound 25 gave a triplet and doublet signals at δH 0.87 and 1.11,
respectively. Difference was also observed in the splitting pattern and
integration number for the H-2” protons, whereby in compound 26, a doublet
signal integrated for two protons was observed, but a multiplet signal
integrated for one proton was found in compound 25. At the meantime, H-3”
showed a peak integrated for one proton in compound 26, whereas in
compound 25, the integration number for H-3” is 2. The remaining proton
signals appeared above δH 5.0 were found to be identical in the 1H-NMR
spectra of these two compounds.
According to 13
C-NMR spectrum (Figure 4.26), compound 26 gave almost
identical spectral characteristics as compound 25 as discussed in Section 4.2.
The only difference was the carbon signal at δC 22.1 which was assigned to
carbons C-4” and C-5” as they are symmetrical carbons. However, in
compound 25, carbons C-4” and C-5” gave different carbon signals in the 13
C-
NMR spectrum (Figure 4.27). Since these two compounds showed the same
coumarin nucleus skeleton linked to a phenyl substituent group, therefore both
compounds gave almost similar carbon signals in the aromatic regions of δC
170-90 in their 13
C-NMR spectra.

64
The assignment was further confirmed by 2D-NMR experiments. In HMQC
spectrum (Figure 4.28), a proton signal integrated for one proton at δH 6.41 (H-
8) is directly coupled with carbon signal at δC 94.9 (C-8) through 1J coupling,
indicating that C-8 is a methine carbon. On the other hand, in HMBC spectrum
(Figure 4.29), this methine proton showed 3J couplings with carbons C-4a and
C-6, as well as 2J couplings with carbons C-7 and C-8a, which confirmed the
presence of fused benzene ring to α-pyrone ring in the coumarin nucleus. Other
correlations were listed in Table 4.2. Apart from NMR data, the chemical
structure of compound 26 was further verified by FTIR spectroscopic analysis.
From the IR spectrum (Figure 4.23), compound 26 was confirmed to have
functionalities such as hydroxyl O-H (3420 cm-1
), carbonyl C=O (1688 cm-1
),
carbinol C-O (1233 cm-1
) and aromatic C=C (1615 and 1469 cm-1
). Besides
stretching, C-H and C-C bending vibrations can be found below 1000 cm-1
.
Based on various spectral information, compound 26 was identified as 5,7-
dihydroxy-6-(3-methylbutyryl)-4-phenylcoumarin.
Figure 4.23: IR spectrum of compound 26
sp3 C-H stretch
O-H stretch
aromatic sp2 C-H stretch
C=O stretch
C-O stretch
aromatic C=C stretch
C-H bend
C-C bend

65
Table 4.2: Summary of NMR data for 5,7-dihydroxy-6-(3-methylbutyryl)-
4-phenylcoumarin [26]
Position δH (ppm), Integration
and Multiplicity
δC (ppm) HMBC
1 - - -
2 - 158.9 -
3 5.83 (1H, s) 112.0 C-1’, 2, 4a
4 - 156.0 -
4a - 101.5 -
5 - 165.5 -
6 - 106.6 -
7 - 163.5 -
8 6.41 (1H, s) 94.9 C-4a, 6 , 7, 8a
8a - 160.4 -
1’ - 139.6 -
2’ & 6’ 7.37 (2H, m) 127.3 C-3’, 4’, 5’
3’ & 5’ 7.39 (2H, m) 127.5 C-2’, 4’, 6’
4’ 7.41 (1H, m) 128.0 C-2’, 3’, 5’, 6’
1” - 207.4 -
2” 3.03 (2H, d, J = 6.7 Hz) 52.9 C-1”, 3”, 4”, 5”
3” 2.22 (1H, m) 24.9 -
4” 0.95 (6H, d, J = 6.7 Hz) 22.1 C-2”,3”, 4”,5”
5”
5-OH 14.96 (1H, s) - C-4a, 5, 6
7-OH 11.24 (1H, brs) - -

66
5,7-dihydroxy-6-(3-methylbutyryl)-4-phenylcoumarin [26]
Figure 4.24: 1H-NMR spectrum of compound 26
7-OH 5-OH
H-2’,3’,4’,5’,6’
H-8 H-3
H-4”, H-5”
H-2”
H-3”
residual water peak
solvent peak (acetone-d6)

67
5,7-dihydroxy-6-(3-methylbutyryl)-4-phenylcoumarin [26]
Figure 4.25: Expanded 1H-NMR spectrum of compound 26
H-2” H-3”
H-4”, H-5”
residual water peak
solvent peak (acetone-d6)

68
5,7-dihydroxy-6-(3-methylbutyryl)-4-phenylcoumarin [26]
Figure 4.26: 13
C-NMR spectrum of compound 26
C-1” C-2”
C-3”
C-4”,5”
C-3
C-8
C-6
C-4a
C-4’
C-3’,5’
C-2’,6’
C-1’
C-4
C-2
C-8a
C-7
C-5

69
5,7-dihydroxy-6-(3-methylbutyryl)-4-phenylcoumarin [26]
Figure 4.27: Expanded 13
C-NMR spectrum of compound 26
C-3”
C-4”, 5”

70
5,7-dihydroxy-6-(3-methylbutyryl)-4-phenylcoumarin [26]
Figure 4.28: HMQC spectrum of compound 26
H-8
H-3 H-2’,3’,4’,5’,6’
5-OH H-2”
H-4”,5”
C-8
C-3
C-2’,3’,4’, 5’,6’
C-4”,5”
C-2”
water solvent
solvent
7-OH
C-3”

71
5,7-dihydroxy-6-(3-methylbutyryl)-4-phenylcoumarin [26]
Figure 4.29: HMBC spectrum of compound 26
C-1”
H-2” 5-OH
C-5
C-4a C-6
C-2’,3’,5’,6’ C-4’
H-3
H-8
H-2’,3’,4’,5’,6’ H-4”,5”
solvent
C-4”, 5” C-3”
C-2”
C-7 C-8a
C-2
water
solvent

72
5,7-dihydroxy-6-(3-methylbutyryl)-4-phenylcoumarin [26]
Figure 4.30: Expanded HMBC spectrum of compound 26
H-2” H-3”
H-4”,5”
C-4”,5”
C-3”
C-2”
solvent water
solvent

73
4.4 Chemical Identification and Structural Characterization of
Isodispar B [27]
Figure 4.31: The molecular structure of isodispar B [27]
Compound 27 was obtained as pale yellow needle-like crystals with a melting
point of 202-204 oC (Lit. 200-202
oC, Crombie, et al., 1987). It is a coumarin,
namely isodispar B or 5,7-dihydroxy-8-(3-methylbutyryl)-4-phenylcoumarin.
Similarly to compounds 25 and 26, chemical structure of isodispar B also
comprises of coumarin nucleus with 4-phenyl and 5,7-dioxygenation patterns,
but a different in the position of acyl group attached. Instead of carbon C-6, the
3-methylbutyryl group is attached to carbon C-8 in isodispar B. Since isodispar
B containing conjugated aromatic ring, thus it appeared as single dark grey
spot under short wavelength UV light at 254 nm and a brown spot in iodine
chamber. The retention factor, Rf value of single spot is 0.60 via a solvent
mixture of hexane and ethyl acetate (1:3) as mobile phase.
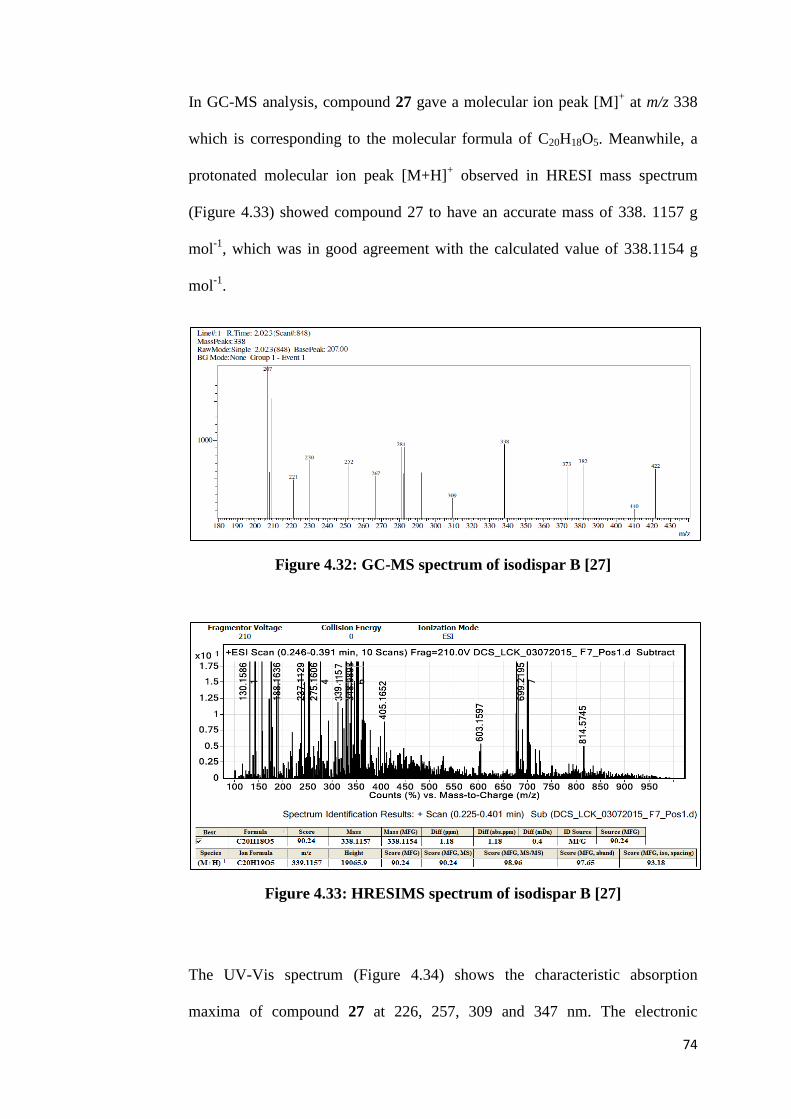
74
In GC-MS analysis, compound 27 gave a molecular ion peak [M]+ at m/z 338
which is corresponding to the molecular formula of C20H18O5. Meanwhile, a
protonated molecular ion peak [M+H]+ observed in HRESI mass spectrum
(Figure 4.33) showed compound 27 to have an accurate mass of 338. 1157 g
mol-1
, which was in good agreement with the calculated value of 338.1154 g
mol-1
.
Figure 4.32: GC-MS spectrum of isodispar B [27]
Figure 4.33: HRESIMS spectrum of isodispar B [27]
The UV-Vis spectrum (Figure 4.34) shows the characteristic absorption
maxima of compound 27 at 226, 257, 309 and 347 nm. The electronic
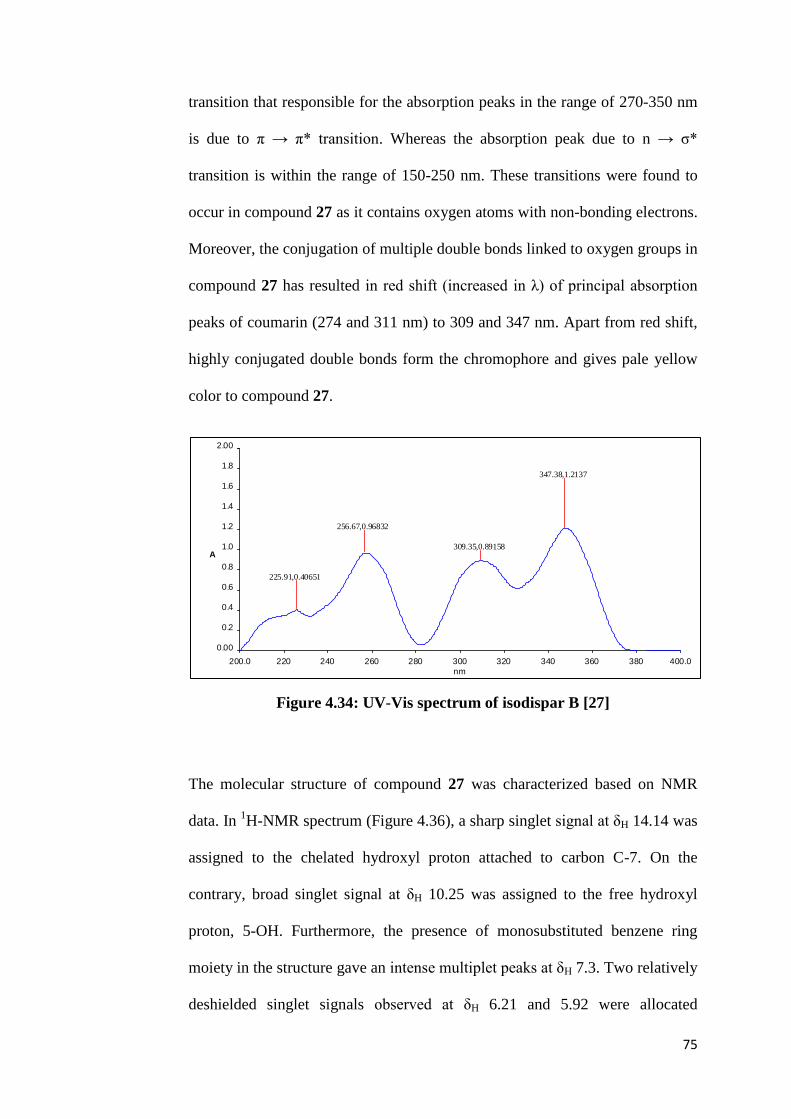
75
transition that responsible for the absorption peaks in the range of 270-350 nm
is due to π → π* transition. Whereas the absorption peak due to n → σ*
transition is within the range of 150-250 nm. These transitions were found to
occur in compound 27 as it contains oxygen atoms with non-bonding electrons.
Moreover, the conjugation of multiple double bonds linked to oxygen groups in
compound 27 has resulted in red shift (increased in λ) of principal absorption
peaks of coumarin (274 and 311 nm) to 309 and 347 nm. Apart from red shift,
highly conjugated double bonds form the chromophore and gives pale yellow
color to compound 27.
Figure 4.34: UV-Vis spectrum of isodispar B [27]
The molecular structure of compound 27 was characterized based on NMR
data. In 1H-NMR spectrum (Figure 4.36), a sharp singlet signal at δH 14.14 was
assigned to the chelated hydroxyl proton attached to carbon C-7. On the
contrary, broad singlet signal at δH 10.25 was assigned to the free hydroxyl
proton, 5-OH. Furthermore, the presence of monosubstituted benzene ring
moiety in the structure gave an intense multiplet peaks at δH 7.3. Two relatively
deshielded singlet signals observed at δH 6.21 and 5.92 were allocated
200.0 220 240 260 280 300 320 340 360 380 400.0
0.00
0.2
0.4
0.6
0.8
1.0
1.2
1.4
1.6
1.8
2.00
nm
A
347.38,1.2137
309.35,0.89158
256.67,0.96832
225.91,0.40651

76
separately to methine protons H-6 and H-3. Those proton signals appeared in
the upfield region below 4 ppm were attributed to protons which are linked to
sp3 hybridized carbons. Among these signals, the most shielded doublet signal
at δH 1.02 (6H, d, J = 6.7 Hz) was assigned to two groups of chemically
equivalent methyl protons, H-4” and H-5”.
In 13
C-NMR spectrum (Figure 4.37), keto carbonyl carbon C-1” was presented
as the most deshielded carbon signal at δC 209.8. A very intense peak at δC 21.1
was indicative of two magnetically equivalent carbon signals assigned to
symmetrical carbons C-4” and C-5”. Generally, the spectrum can be divided
into three chemical shift regions, whereby signals in the range of δC 150 to 220
ppm were assigned to sp2 hybridized carbons linked to oxygen groups.
Whereas signals for those sp2 hybridized carbons without linking to
electronegative atoms were found to appear in a lower range of δC 90 to 150.
Lastly, the presence of sp3 hybridized carbons was observed as signals in the
chemical shift region below δC 90 ppm.
The types of carbon were further investigated based on the HMQC analysis.
According to HMQC spectrum (Figure 4.38), two symmetrical methyl carbons
C-4” and C-5” were deduced as their carbon signal at δC 22.1 was correlated to
proton signal H-4” and H-5” at δH 1.02, which was integrated for 6 protons. In
addition, proton signal H-2” integrated for two protons at δH 3.14 showed
correlation with carbon signal C-2” at δC 53.1, indicating that C-2” is a
methylene carbon. Similarly, a total of 8 methine carbons was identified from
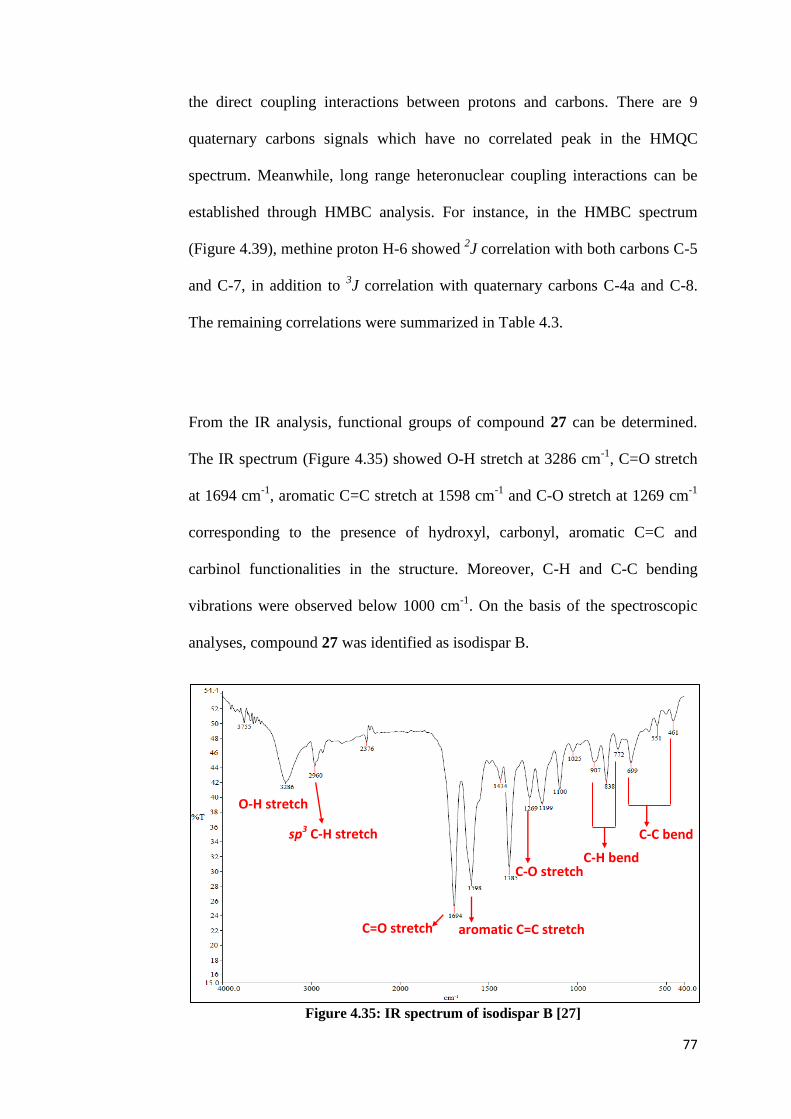
77
the direct coupling interactions between protons and carbons. There are 9
quaternary carbons signals which have no correlated peak in the HMQC
spectrum. Meanwhile, long range heteronuclear coupling interactions can be
established through HMBC analysis. For instance, in the HMBC spectrum
(Figure 4.39), methine proton H-6 showed 2J correlation with both carbons C-5
and C-7, in addition to 3J correlation with quaternary carbons C-4a and C-8.
The remaining correlations were summarized in Table 4.3.
From the IR analysis, functional groups of compound 27 can be determined.
The IR spectrum (Figure 4.35) showed O-H stretch at 3286 cm-1
, C=O stretch
at 1694 cm-1
, aromatic C=C stretch at 1598 cm-1
and C-O stretch at 1269 cm-1
corresponding to the presence of hydroxyl, carbonyl, aromatic C=C and
carbinol functionalities in the structure. Moreover, C-H and C-C bending
vibrations were observed below 1000 cm-1
. On the basis of the spectroscopic
analyses, compound 27 was identified as isodispar B.
Figure 4.35: IR spectrum of isodispar B [27]
O-H stretch
sp3 C-H stretch
C=O stretch aromatic C=C stretch
C-O stretch C-H bend
C-C bend

78
Table 4.3: Summary of NMR data for isodispar B [27]
Position δH (ppm), Integration
and Multiplicity
δC (ppm) HMBC
1 - -
2 - 158.2 -
3 5.92 (1H, s) 111.5 C-1’, 2, 4a
4 - 156.3 -
4a - 101.7 -
5 - 161.8 -
6 6.21 (1H, s) 99.5 C-4a, 5, 7, 8
7 - 168.5 -
8 - 104.0 -
8a - 158.4 -
1’ - 139.9 -
2’ & 6’ 7.35 (2H, m) 127.3 C-1’, 2’, 3’,4’,
5’, 6’, 4 3’ & 5’ 7.36 (2H, m) 127.5
4’ 7.38 (1H, m) 128.0
1” - 209.8 -
2” 3.14 (2H, d, J = 6.7 Hz) 53.1 C-1”, 3”, 4”, 5”
3” 2.29 (1H, m) 25.4 C-1”, 2”, 4”, 5”
4” 1.02 (6H, d, J = 6.7 Hz) 22.1 C-2”, 3”
5”
5-OH 10.25 (1H, brs) -
7-OH 14.14 (1H, s) C-6, 7, 8

79
Isodispar B [27]
Figure 4.36: 1H-NMR spectrum of isodispar B [27]
5-OH
7-OH
H-2’,3’,4’,5’,6’
H-6
H-3
H-2”
water
Acetone-d6
H-4”,5”
H-3”

80
Isodispar B [27]
Figure 4.37: 13
C-NMR spectrum of isodispar B [27]
C-1”
C-3”
C-4”,5”
C-1’
C-2” C-6
C-3
C-8
C-4a
C-4’
C-2’, 6’
C-3’, 5’
C-7
C-5
C-8a
C-2
C-4
solvent peak (acetone-d6)
solvent peak (acetone-d6)

81
Isodispar B [27]
Figure 4.38: HMQC spectrum of isodispar B [27]
H-2’,3’,4’,5’,6’ H-6
H-3
H-2”
H-3” H-4”,5”
C-6
C-3
C-2’,3’,4’,5’,6’
C-4”,5” C-3”
C-2
7-OH 5-OH
solvent

82
Isodispar B [27]
Figure 4.39: HMBC spectrum of isodispar B [27]
7-OH
H-2’,3’,4’,5’,6’
H-6 H-3 H-2”
H-3” H-4”,5”
C-6 C-8 C-4a
C-2’,3’,4’,5’,6’
C-1’
C-4 C-2 C-5 C-7
C-1”
solvent
C-4”,5” C-3”
solvent
C-2”

83
4.5 Chemical Identification and Structural Characterization of
Friedelin [24]
Figure 4.40: The molecular structure of friedelin [24]
About 98.2 mg of friedelin was obtained as white needle-like crystals with a
melting point of 258-260 oC (Lit. 259-260
oC, Abbas, et al., 2006). The purity
of compound 24 was examined by TLC analysis showing a single spot with
retention factor, Rf value of 0.75 eluted with a mobile phase of 90% hexane
and 10% ethyl acetate. However, compound 24 do not absorb UV light but
stained with iodine vapour to give a dark brown spot on TLC plate. Hence, the
absence of conjugated system in the structure was deduced.
Elemental composition of compound 24 was analyzed by GC-MS resulting in a
molecular ion peak [M]+ at m/z 426 which was corresponding to molecular
formula of C20H18O5. Furthermore, compound 24 was ionized into protonated
cations during LC-MS analysis. The molecular formula of C20H19O5 was
determined from the pseudo-molecular ion peak [M+H]+ at m/z 427.3934 in the
HRESIMS spectrum (Figure 4.42). The measured molecular weight of the

84
compound was reported to be 426.3862 g mol-1
which showed 99.56%
consistency with the calculated value, 426.3862 g mol-1
.
Figure 4.41: GC-MS spectrum of friedelin [24]
Figure 4.42: HRESI spectrum of friedelin [24]
Since all the protons in compound 24 were covalently bonded to sp3 hybridized
carbons, therefore all the proton signals were found to appear in the upfield
region, below 2.5 ppm in the 1H-NMR spectrum (Figure 4.45). A total of seven
intense singlet signals, each integrated for 3 protons were assigned to seven

85
groups of methyl protons. They were protons H-28 (1.16 ppm), H-27 (1.03
ppm), H-29 (0.99 ppm), H-30 (0.98 ppm), H-26 (0.93 ppm), H-25 (0.85 ppm)
and H-24 (0.70 ppm). In addition, a doublet signal was assigned to methyl
protons H-23 (0.86 ppm). Besides, two groups of non-equivalent methylene
gave signals at δH 1.95 (H-1a), 1.72 (H-1b), 2.36 (H-2a) and 2.29 (H-2b). A
multiplet signal of methine proton (H-4) was observed at 2.24 ppm. There was
no vinylic proton signals observed, and the remaining 21 protons consisting of
methylene and methine protons showed signals in the range of δH 1.20-1.70.
A total of 30 carbon signals were observed in 13
C-NMR spectrum (Figure 4.46)
as compound 24 composed of 30 carbons. The most deshielded signal at δC
213.0 was assigned to keto carbon, C-3. Furthermore, eight methyl carbon
signals appeared in the upfield region at δC 6.9, 14.7, 18.0, 20.3, 18.8, 32.2,
35.1 and 31.9 were attributed to carbons C-23, C-24, C25, C-26, C-27, C-28,
C-29 and C-30, respectively. The remaining assignment of carbon signals was
done by comparing with the literature values reported by Abbas, et al., in year
2007.
FTIR analysis further revealed stretching vibrations such as sp3 C-H stretch at
2927 cm-1
and C=O stretch at 1713 cm-1
. On the other hand, compound 24 gave
an absorption peak at 218 nm in the UV-Vis spectrum (Figure 4.44), which is
resulted from n → σ* transition. Based on the spectral data and comparison
with the literature values, it was confirmed that compound 24 is friedelin, a
common triterpenoid.

86
Figure 4.43: IR spectrum of friedelin [24]
Figure 4.44: UV-Vis spectrum of friedelin [24]
200.0 220 240 260 280 300 320 340 360 380 400.0
0.000
0.05
0.10
0.15
0.20
0.25
0.30
0.35
0.40
0.45
0.500
nm
A
218.03,0.39298
sp3 C-H stretch
C=O stretch
C-H bend

87
Table 4.4: Summary of NMR data for friedelin in comparison with
literature values.
Position δH (ppm) *δH (ppm) δC (ppm) *δC (ppm)
1 1.95 (1Ha, m)
1.72 (1Hb, m)
1.97 (m)
1.71 (m)
22.4 22.3
2 2.36 (1Ha, dd, J =
13.4 Hz, 3 Hz,)
2.29 (1Hb, m)
2.41 (dd, J= 13
Hz, 3.5 Hz)
2.31 (m)
41.6 41.5
3 - - 213.4 213.2
4 2.24 (1H, m) 2.28 (m) 58.3 58.2
5 - - 42.2 42.2
6 - 1.78 (m)
1.31 (m)
41.3 41.3
7 - 1.51 (m)
1.41 (m)
18.3 18.2
8 - 1.41 (m) 53.2 53.1
9 - - 37.5 37.4
10 - 1.55 (m) 59.5 59.5
11 - 1.40 (m) 35.7 35.6
12 - 1.30 (m)
1.28 (m)
30.6 30.5
13 - - 39.8 39.7
14 - - 38.4 38.3
15 - 1.50 (m)
1.30 (m)
32.8 32.8
16 - 1.40-1.60 (m) 36.1 36.0
17 - - 30.1 30.0
18 - 1.60 (m)
1.40 (m)
42.8 42.8
19 - 1.60 (m) 35.4 35.3
20 - - 28.3 28.2
21 - 1.51 (m)
1.31 (m)
32.5 32.5
22 - 1.51 (m)
0.97 (m)
39.3 39.3
23 0.86 (3H, d, J =
6.7 Hz)
0.92 (d, J= 7.0
Hz)
6.9 6.8
24 0.70 (3H, s) 0.75 (s) 14.7 14.7
25 0.85 (3H, s) 0.90 (s) 18.0 18.0
26 0.93 (3H, s) 1.03 (s) 20.3 20.3
27 1.03 (3H, s) 1.07 (s) 18.8 18.7
28 1.16 (3H, s) 1.20 (s) 32.2 32.1
29 0.99 (3H, s) 1.02 (s) 35.1 35.0
30 0.98 (3H, s) 0.98 (s) 31.9 31.8
*Literature source: Abbas, et al., 2007.

88
Friedelin [24]
Figure 4.45: 1H-NMR spectrum of friedelin [24]
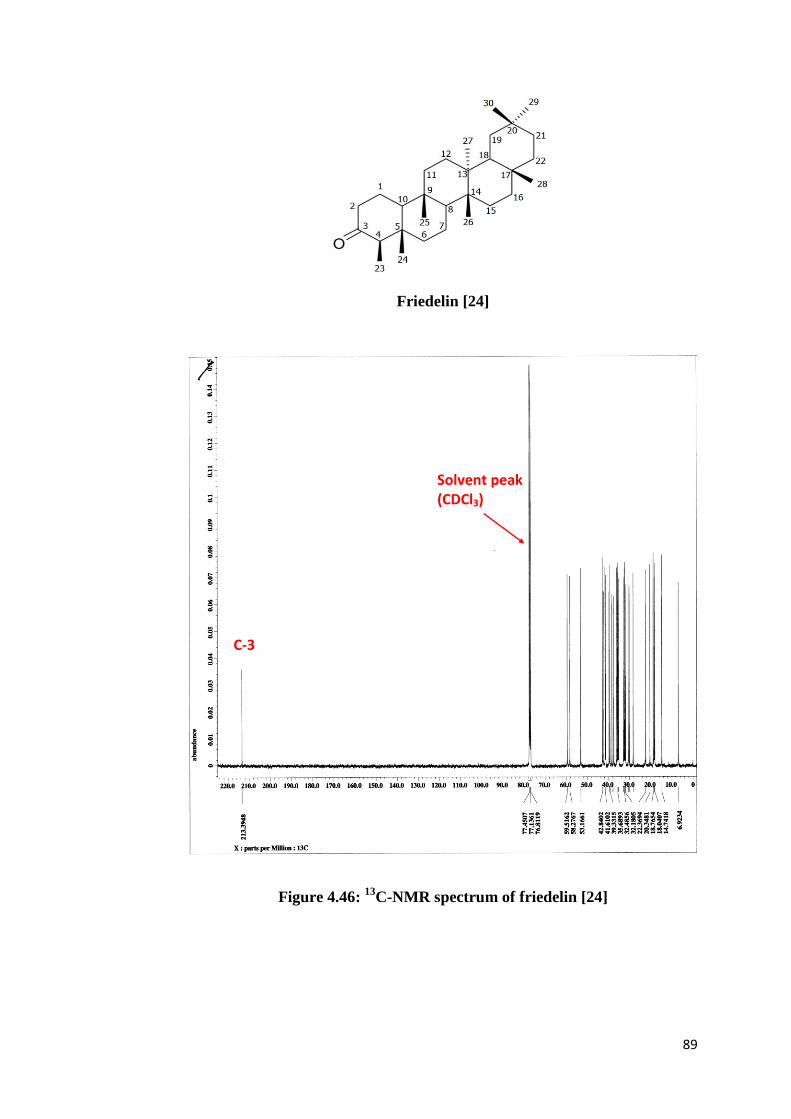
89
Friedelin [24]
Figure 4.46: 13
C-NMR spectrum of friedelin [24]
C-3
Solvent peak (CDCl3)

90
Friedelin [24]
Figure 4.47: Expanded 13
C-NMR spectrum of friedelin [24]

91
4.6 Antioxidant Test
Reactive oxygen species (ROS) such as peroxides, superoxide and hydroxyl
radical are formed in living cell. They are important in cell signaling and
homeostasis. However, oxidative stress can occurs if the level of ROS is too
high. This may results in cell damage and hence increases the risk of cancers
and aging. Generally, polyhydroxy (phenolic) compounds are known to act as
antioxidant in biological system. Antioxidant functions to react with ROS to
form a neutral species or a resonance-stabilized species by transferring an
electron or hydrogen atom (Lin, et al., 2011). Resonance-stabilized species is
also a free radical but less reactive than ROS as the lone electron can be
delocalized into the aromatic ring.
In this study, the radical scavenging activity of crude extracts and isolated
compounds were evaluated by means of 2,2-diphenyl-1-picrylhydrazyl (DPPH)
assay, a relatively simple cell-free method to perform. DPPH is a free radial
with violet colour that changes to yellow when it is scavenged. Besides, it also
acts as an indicator to allow clear observation. IC50 is defined as the
concentration of sample that required to inhibit 50% of DPPH radical activity.
When DPPH reacts with antioxidant, it is reduced, resulting in a decrease in
absorbance at 520 nm. Therefore, the lower IC50 value obtained, the stronger
the antioxidant activity. IC50 values were determined from the graph of percent
inhibition rate against concentration of sample as shown in Figures 4.50 and
4.51.
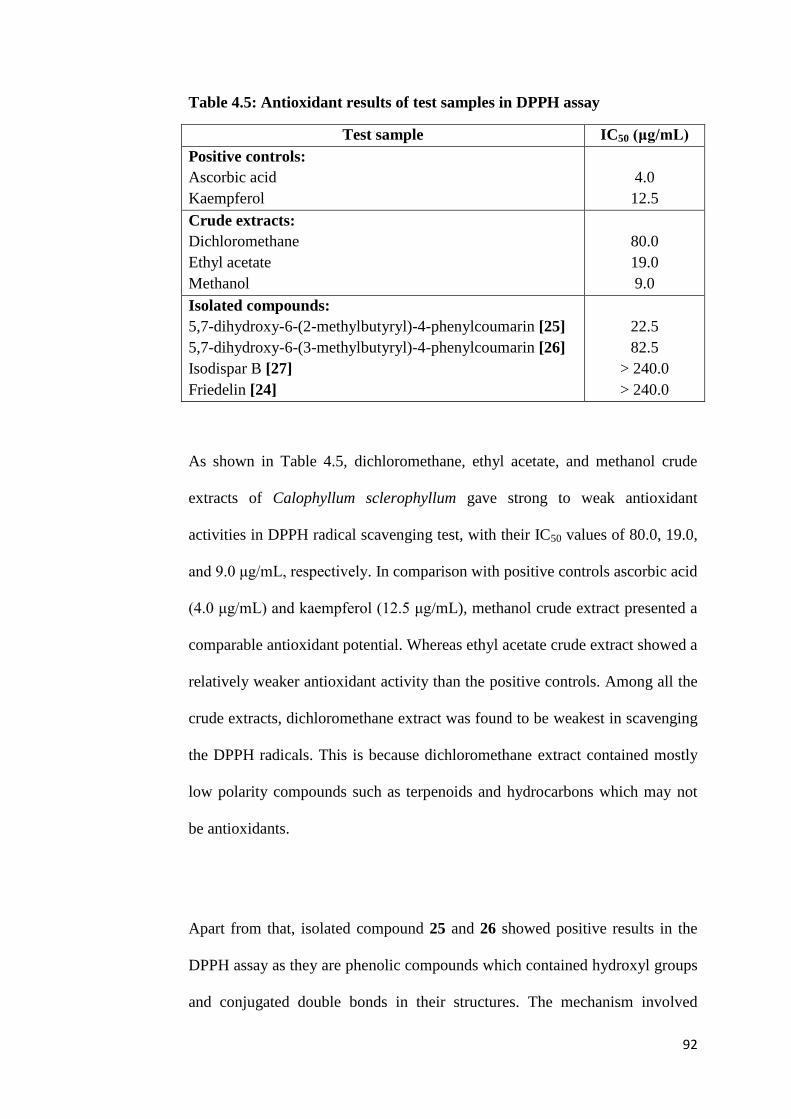
92
Table 4.5: Antioxidant results of test samples in DPPH assay
Test sample IC50 (μg/mL)
Positive controls:
Ascorbic acid
Kaempferol
4.0
12.5
Crude extracts:
Dichloromethane
Ethyl acetate
Methanol
80.0
19.0
9.0
Isolated compounds:
5,7-dihydroxy-6-(2-methylbutyryl)-4-phenylcoumarin [25]
5,7-dihydroxy-6-(3-methylbutyryl)-4-phenylcoumarin [26]
Isodispar B [27]
Friedelin [24]
22.5
82.5
> 240.0
> 240.0
As shown in Table 4.5, dichloromethane, ethyl acetate, and methanol crude
extracts of Calophyllum sclerophyllum gave strong to weak antioxidant
activities in DPPH radical scavenging test, with their IC50 values of 80.0, 19.0,
and 9.0 μg/mL, respectively. In comparison with positive controls ascorbic acid
(4.0 μg/mL) and kaempferol (12.5 μg/mL), methanol crude extract presented a
comparable antioxidant potential. Whereas ethyl acetate crude extract showed a
relatively weaker antioxidant activity than the positive controls. Among all the
crude extracts, dichloromethane extract was found to be weakest in scavenging
the DPPH radicals. This is because dichloromethane extract contained mostly
low polarity compounds such as terpenoids and hydrocarbons which may not
be antioxidants.
Apart from that, isolated compound 25 and 26 showed positive results in the
DPPH assay as they are phenolic compounds which contained hydroxyl groups
and conjugated double bonds in their structures. The mechanism involved

93
donation of proton from hydroxyl group at carbon 7 (7-OH) to DPPH free
radical and thereby forming a neutral DPPH species. Chelated hydroxyl group
(5-OH) is unable to act as proton donor as it forms intramolecular hydrogen
bond with the carbonyl group. Theoretically, both compounds should give
almost similar IC50 values as they comprised of the same coumarin nucleus
with 5,7-dihydroxyl and 4-phenyl substituent groups. However, compound 25
(22.5 μg/mL) exhibited a much stronger antioxidant properties than compound
26 (82.5 μg/mL). This is probably due to the role played by the acidic α-
hydrogens located next to the keto group in the radical scavenging mechanism.
After α-hydrogen is being donated, compound 25 tends to form a resonance-
stabilized tertiary radical which is more stable than secondary radical formed
by compound 26, and hence a stronger antioxidant than compound 26.
Figure 4.48: Resonance-stabilized free radicals formed by different
coumarin compounds
Radicals formed by compound 25: Radicals formed by compound 26:
.
and and
.
.
.

94
On the other hand, isodispar B and friedelin were showing negative results in
DPPH assay, both with IC50 values more than 240 μg/mL. This is because lack
of phenolic nature and conjugated system in the structure of friedelin.
Meanwhile for isodispar B, both chelated hydroxyl group (7-OH) and α-
hydrogens are unavailable as proton donors due to formation of hydrogen
bonds.
Figure 4.49: Resonance-stabilized radical formed by isodispar B
.

95
Figure 4.50: Graph of inhibition rate (%) against concentration of crude
extracts
Figure 4.51: Graph of inhibition rate (%) against concentration of isolated
sample
0
10
20
30
40
50
60
70
80
90
100
0 50 100 150 200 250 300
Inh
ibit
ion
rat
e (
%)
Concentration of sample (μg/mL)
Graph of inhibition rate (%) against concentration of sample
DCM
EA
MeOH
Ascorbicacid
Kaempferol
0
10
20
30
40
50
60
70
80
90
0 50 100 150 200 250 300
Inh
ibit
ion
rat
e (
%)
Concentration of sample (μg/mL)
Graph of inhibition rate (%) against concentration of sample
5,7-Dihydroxy-6-(2-methylbutyryl)-4-phenylcoumarin
5,7-Dihydroxy-6-(3-methylbutyryl)-4-phenylcoumarin
Isodispar B
Friedelin
22.5 82.5
19.0 80.0

96
CHAPTER 5
CONCLUSION
5.1 Conclusion
In this study, a total of four chemical compounds have been isolated from the
ethyl acetate crude extract of Calophyllum sclerophyllum. Their chemical
structures have been elucidated via various modern spectroscopic techniques
including 1D- and 2D-NMR, UV-Vis, IR and mass spectrometry. Compounds
isolated were identified as friedelin [24], 5,7-dihydroxy-6-(2-methybutyryl)-4-
phenylcoumarin [25], 5,7-dihydroxy-6-(3-methybutyryl)-4-phenylcoumarin
[26] and isodispar B [27].
All the crude extracts and isolates were investigated for their antioxidant
potential via DPPH assay. Interestingly, among three coumarin compounds,
compound 25 exhibited the highest antioxidant activity with IC50 value of 22.5
μg/mL, while the compound 26 and 27 showed weak or inactive in antioxidant
test. In addition, friedelin [24] also gave negative result in DPPH assay. At the
meantime, crude extracts showed strong to weak antioxidant activities in
comparison with the standards, ascorbic acid and kaempferol.

97
5.2 Future Perspectives
In this project, three coumarins and one triterpenoid had been successfully
isolated. For future studies, it is suggested that these isolated compounds can
be subjected for further investigation on other biological activities such as anti-
fungi, antimicrobial and anti-cancer. Secondly, more advance chromatographic
technique such as high performance liquid chromatography (HPLC) is
recommended to be applied in order to improve the separation efficiency. Due
to rapid separation and high resolution, preparative HPLC is usually an
excellent technique used to isolate compounds with close similarity in
structures. In addition, centrifugal chromatography and preparative TLC
chromatographies are also suggested to be used in separation of compounds
that exist in trace quantity.

98
REFERENCES
Abbas, F. A., Al-Massarany, S. M., Khan, S., Al-Howiriny, T. A., Mossa, J. S.
and Abourashed, E. A., 2007. Natural Product Research, 21(5), pp. 383-391.
Ajithabai, M. D., Rameshkumar, B., Jayakumar, G., Varma, L., Nair, M. S.,
Ajaikumar and Nair, G. P., 2012. Decipic acid and 12-acetyl apetalic acid from
Calophyllum decipiens. Indian Journal of Chemistry, 51(B), pp. 393-397.
Ampofo, S. A. and Waterman, P. G., 1986. Xanthones and neoflavonoids from
two Asian species of Calophyllum. Phytochemistry, 25(11), pp. 2617-2620.
APG III., 2009. An update of the angiosperm phylogeny group classification
for the orders and families of flowering plants: APG III. Botanical Journal of
the Linnean Society, 161(3), pp. 122-127.
Babu, V., Arya, R., Ilyas, M. and Nasim, K. T., 1994. 9-hydroxy-2,2,6,7-
tetramethyl-2H-[1]-benzopyran-(1-phenylethylene-10-yl)-[3,2-b]-
dihydropropyran-4-one from Calophyllum tomentosum. Phytochemistry, 35(2),
pp. 507-510.
Bajpai, M., Asthana, R., Sharma, N., Chatterjee, S. and Mukherjee, S., 1991.
Hypoglycemic effect of swerchirin from the hexane fraction of Swertia
chirayita. Planta Med., 57(2), pp. 102-104.
Banerji, A., Deshpande, A. D., Prabhu, B. R. and Pradhan, P., 1994.
Tomentotone, a new xanthonoid from the stem bark of Calophyllum
tomentosum. Journal of Natural Products, 57(3), pp. 396-399.
Bhanu, S., Scheinmann, F. and Jefferson, A., 1975. Xanthones from the
heartwood of Calophyllum ramiflorum. Phytochemistry, 14(1), pp. 298-299.
Blanco-Ayala, T., Lugo-Huitrón, R., Seprano-López, E. M., Reyes-Chilpa, R.,
Rangel-López, E., Pineda, B., Medina-Campos, O., Sánchez-Chapul, L.,
Pinzón, E., Cristina, T., Silva-Adaya, D., Pedraza-Chaverrí, J., Ríos, C., De La
Cruz, V. and Torres-Ramos, M., 2013. Antioxidant properties of xanthones
from Calophyllum Brasiliense: prevention of oxidative damage induced by
FeSO4. BMC Complement Altern Med, 13(1), pp. 262.

99
Brenzan, M. A., Nakamura, C. V., Prado Dias Filho, B., Ueda-Nakamura, T.,
Young, M. C. M. and Aparício Garcia Cortez, D., 2007. Antileishmanial
activity of crude extract and coumarin from Calophyllum brasiliense leaves
against Leishmania amazonensis. Parasitology Research, 101(3), pp. 715-722.
Cao, S., Lim, T., Sim, K. and Goh, S. H., 1997a. A highly prenylated xanthone
from the bark of Calophyllum gracilipes (Guttiferae). Natural Product Letters,
10(1), pp. 55-58.
Cao, S., Sim, K., Goh, S. H., Xue, F and Mark, T. C. W., 1997b. Gracilipene: a
heterocyclic seco-trisnor-oleanane from Calophyllum gracilipes (Guttiferae).
Tetrahedron Letters, 38(27), pp. 4783-4786.
Cao, S., Sim, K., Pereira, J. and Goh, S., 1998. Coumarins from Calophyllum
teysmannii (Guttiferae). Phytochemistry, 47(6), pp. 1051-1055.
Carolina, Á., Ricardo, R., Elizabet, E., Adriana, M., Angelina, Q., José, S. and
Marco, A. C., 2009. Coumarin A/AA induces apoptosis-like cell death in Hela
cells mediated by the release of apoptosis-inducing factor. Journal f
Biochemical and Molecular Toxicology, 23(4), pp. 263-272.
Chen, G., Zhu, G., Han, C., Zhao, J., Song, X. and Fong, W., 2008. A new
pyranoxanthone from the stems of Calophyllum membranaceum. Arkivoc,
13(2008), pp. 249-254.
Corner, E. J. H., 1978. The freshwater swamp forest of south Johore and
Singapore. Singapore: Botanic Gardens, Parks & Recreation Dept.
Corrado, T. ed., 2001. Bioactive compounds from natural sources: isolation,
characterization and biological properties. London: Taylor & Francis.
Cragg, G. M. and Newman, D. J., 2002. Drugs from nature: past achievements,
future prospects. In: M.M Iwu and J. Wootton, eds. Ethnomedicine and drug
discovery. USA: Elsevier Science, pp. 23-37.

100
Crombie, L., Jones, R. C. F. and Palmer, C. J., 1987. Synthesis of the mammea
coumarins part 1, the coumarins of the mammea A, B, and C series. Journal of
the Chemical Society, Perkin Transactions, 1, pp. 317-331.
Dahanayake, M., Kitagawa, I., Somanathan, R. and Sultanbawa, M. U, 1974.
Chemical investigation of Ceylonese plants. Part VII. Extractives of
Calophyllum thwaitesii Planch and Triana and Calophyllum walker Wight
(Guttiferae). Journal of the Chemical Society, 1, pp. 2510-2514.
Dewick, P. M., 2009. Medicinal natural products: a biosynthetic approach. 3rd
ed. England: Wiley.
Dharmaratne, H. W., Perera, D. C., Marasinghe, G. P. and Jamie, J., 1999. A
chromene acid from Calophyllum cordato-oblongum. Phytochemistry, 51(1),
pp. 111-113.
Dharmaratne, H. W., Sajeevani, J., Marasinghe, G. P. and Ekanayake, E., 1998.
Distribution of pyranocoumarins in Calophyllum cordato-oblongum.
Phytochemistry, 49(4), pp. 995-998.
Dharmaratne, H. W., Sotheeswaran, S. and Balasubramaniam, S., 1984.
Triterpenes and neoflavonoids of Calophyllum Lankaensis and Calophyllum
thwaitesii. Phytochemistry, 23(11), pp. 2601-2603.
Dharmaratne, H. W., Sotheeswaran, S. and Balasubramaniam, S. and Reisch, J.,
1986. Xanthones from roots of three Calophyllum species. Phytochemistry,
25(8), pp. 1957-1959.
Dharmaratne, H. W., Sotheeswaran, S., Balasubramaniam, S. and Waight, E. S.,
1985. Triterpenoids and coumarins from the leaves of Calophyllum cordato-
oblongum. Phytochemistry, 24(7), pp. 1553-1556.
Dharmaratne, H. W. and Wanigasekera, W., 1996. Xanthones from root bark of
Calophyllum thwaitesii. Phytochemistry, 42(1), pp. 249-250.

101
Dharmaratne, H. W. and Wijesinghe, W. M. N., 1997. A trioxygenated
diprenylated chromenxanthone from Calophyllum moonii. Phytochemistry,
46(7), pp. 1293-1295.
Díaz, D. M. V., 2013. Multivariate analysis of morphological and anatomical
characters of Calophyllum (Calophyllaceae) in South America. Botanical
Journal of the Linnean Society, 171(3), pp. 587-626.
Dweck, A. C. and Meadows, T., 2002. Tamanu (Calophyllum Inophyllum) - the
African, Asian, Polynesian and Pacific Panacea. International Journal of
Cosmetic Science, 24(6), pp. 341-348.
Ee, G. C. L., Mah, S. H., Teh, S. S., Rahmani, M., Go, R. and Taufiq-Yap, Y.
H., 2011. Soulamarin, a new coumarin from stem bark of Calophyllum
soulattri. Molecules, 16(12), pp. 9721-9727.
Ferchichi, L., Debré, S., Mahmood, K., Touré, K., Guilet, D., Litaudon, M.,
Awang, K., Hadi, A. H. A., Le Ray, A. M. and Richomme, P., 2012. Bioguided
fractionation and isolation of natural inhibitors of advanced glycation end-
products (AGEs) from Calophyllum flavoramulum. Phytochemistry, 78 (2012),
pp. 98-106.
Fuller, R. W., Bokesch, H. R., Gustafson, K. R., Mckee, T. C., Cardellina, J. H.,
Mcmahon, J. B., Cragg, G. M., Soejarto, D. and Boyd, M. R., 1994. HIV-
inhibitory coumarins from latex of the tropical rainforest tree Calophyllum
teysmannii var. inophylloide. Bioorganic & Medicinal Chemistry Letters, 4(16),
pp. 1961-1964.
Govindachari, T. R., Prakash, D. and Viswanathan, N., 1968a. Apetalactone, a
new triterpene lactone from Calophyllum species. Journal of the Chemical
Society, pp. 1323-1324.
Govindachari, T. R., Prakash, D. and Viswanathan, N., 1968b. Structure of
apetalic acid. Tetrahedron Letters, 24, pp. 6411-6415.
Guerreiro, E., Kunesch, G. and Polonsky, J., 1971. Les constituants des graines
de Calophyllum chapelieri (Guttiferae). Phytochemistry, 10(9), pp. 2139-2145.

102
Guilet, D., Hélesbeux, J. J., Séraphin, D., Sévenet, T., Richomme, P. and
Bruneton, J., 2001a. Novel cytotoxic 4-phenylfuranocoumarins from
Calophyllum dispar. Journal of Natural Products, 64(5), pp. 563-568.
Guilet, D., Séraphian, D., Rondeau, D., Richomme, P. and Bruneton, J., 2001b.
Cytotoxic coumarins from Calophyllum dispar. Phytochemistry, 58(1), pp.
571-575.
Gunasekera, S. P. and Sultanbawa, M. U., 1975. Chemical investigation of
ceylonese plants, part XVI, extractives of Calophyllum cordato-oblongurn
(Guttiferae). Journal of the Chemical Society, 1(22), pp. 2215-2220.
Gunatilaka, L., Silva, J., Sotheeswaran, S., Balasubramaniam, S. and Wazeer,
M., 1984. Terpenoid and biflavonoid constituents of Calaphyllum calaba and
Garcinia spicata from Sri Lanka. Phytochemistry, 23(2), pp. 323-328.
Gurib-Fakim, A., 2006. Medicinal plants: traditions of yesterday and drugs of
tomorrow. Molecular Aspects of Medicine, 27(1), pp. 1-93.
Ha, L. D., Hansen, P. E., Duus, F., Pham, H. D., Nguyen, L. D., 2012. A new
chromanone acid from the bark of Calophyllum dryobalanoides.
Phytochemistry Letters, 5(2), pp. 287-291.
Hay, A., Hélesbeux, J., Duval, O., Labaїed, M., Grellier, P. and Richomme, P.,
2004. Antimalarial xanthones from Calophyllum caledonicum and Garcinia
vieillardii. Life Sciences, 75(24), pp. 3077-3085.
Hirsch, A., Longeon, A. and Guyot, M., 2002. Fraxin and esculin: two
coumarins specific to Actinidia chinensis and A. deliciosa (kiwifruit).
Biochemical Systematics and Ecology, 30(1), pp. 55-60.
Inuma, M., Ito, T., Tosa, H., Tanaka, T., Toriyama, N. and Chelladurai, V.,
1996. Six xanthones from Calophyllum austroindicum. Phytochemistry, 43(3),
pp. 681-685.
103
Inuma, M., Ito, T., Tosa, H., Tanaka, T., Miyake, R. and Chelladurai, V., 1997.
Prenylated xanthonoids from Calophyllum apetalum. Phytochemistry, 46(8), pp.
1423-1429.
Itoigawa, M., Ito, C., Tan, H, T., Kuchide, M., Tokuda, H., Nishino, H. and
Furukawa, H., 2001. Cancer chemopreventive agents, 4-phenylcoumarins from
Calophyllum inophyllum. Cancer Letters, 169(1), pp. 15-19.
Jackson, B., Locksley, H. D. and Scheinnman, F., 1966. Extractives from
Guttiferae: part I extractives of Calophyllum Sclerephyllum. Journal of the
Chemical Society, pp. 178-181.
Karunayake, S. Sotheeswaran, S., Sultanbawa, S. M. and Balasubramaniam, S.,
1981. Xanthones and triterpenes of Calophyllum tomentosum. Phytochemistry,
20(6), pp. 1303-1304.
Kijjoa, A., Gonzalez, M. J., Pinto, M. M., Silva, A. M., Anantachoke, C. and
Herz, W., 2000. Xanthones from Calophyllum teysmannii var. inophylloide.
Phytochemistry, 55(7), pp. 833-836.
Kimura, S., Ito, C., Jyoko, N., Segawa, H., Kuroda, J., Okada, M., Adachi, S.,
Nakahata, T., Yuasa, T., Filho, V. C., Furukawa, H. and Maekawa, T., 2004.
Inhibition of leukemic cell growth by a novel anti-cancer drug (GUT-70) from
Calophyllum Brasiliense that acts by induction of apoptosis. International
Journal of Cancer, 113(1), pp. 158-165.
Kudo, E., Taura, M., Matsuda, K., Shimamoto, M., Kariya, R., Goto, H.,
Hattori, S., Kimura, S. and Okada, S., 2013. Inhibition of HIV-1 replication by
a tricyclic coumarin GUT-70 in acutely and chronically infected cells.
Bioorganic & Medicinal Chemistry Letters, 23(3), pp. 606-609.
Kumar, V., Sotheeswaran, S., Surendrakumar, S. and Balasubramaniam, S.,
1982. Calocalabaxanthone, the putative isoprenyl precursor of calabaxanthone
from Calophyllum calaba. Phytochemistry, 21(3), pp. 807-809.
Lemos, L. M. S., Martins, T. B., Tanajura, G. H., Gazoni, V. F., Bonaldo, J.,
Strada, C. L., Silva, M. G. D., Dall’Oglio, E. L., De Sousa Júnior, P. T. and
Martins, D. T. D. O., 2012. Evaluation of antiulcer activity of chromanone

104
fraction from Calophyllum brasiliesnse Camb. Journal of Ethnopharmacology,
141(1), pp. 432-439.
Lim, C. K., Subramaniam, H., Say, Y. H., Jong, V. Y. M., Khaledi, H. and
Chee, C. F., 2015. A new chromanone acid from the stem bark of Calophyllum
teysmannii. Natural Product Research, pp. 1-8.
Lin, M., Chou, Y., Tsai, Y. and Chou, D., 2011. Antioxidant properties of 5,7-
dihydroxycoumarin derivatives in in vitro cell-free and cell-containing systems.
Journal of Experimental and Clinical Medicine, 3(3), pp. 126-131.
Ma, C., Chen, B., Qi, H., Li, B. and Zhang, G., 2004. Two pyranocoumarins
from the seeds of Calophyllum polyanthum. Journal of Natural Products, 67(9),
pp. 1598-1600.
Ma, T., Gao, Q., Chen, Z., Wang, L. and Liu, G., 2008. Chemical resolution of
(±)-calanolide A, (±)-cordatolide A and their 11-demethyl analogues.
Bioorganic & Medicinal Chemistry Letters, 18(3), pp. 1079-1083.
Mah, S. H., Ee, G. C. L., Teh, S. S. and Sukari, M. A., 2015. Antiproliferative
xanthones derivatives from Calophyllum inophyllum and Calophyllum soulattri.
Pakistan Journal of Pharmaceutical Sciences, 28(2), pp. 425-429.
McKee, T. C., Fuller, R. W., Covington, C. D., Cardellina, J. H., Gulakowski,
R. J., Krepps, B. L., McMahon, J. B. and Boyd, M. R., 1996. New
pyranocoumarins isolated from Calophyllum lanigerum and Calophyllum
teysmannii. Journal of Natural Products, 59(11), pp.1108-1108.
Monika, W. H., Joseph, S. and Teresa, K., 2008. Thin layer chromatography in
phytochemistry. Boca Raton: CRC Press.
Morad, A. F., 2012. Calopyhllum sclerophyllum and its fruits. [photograph]
Malaysia, available at:
<http://www.flickriver.com/photos/adaduitokla/7687020188/> [Accessed 8
June 2015].

105
Morel, C., Hay, A., Litaudon, M., Sévenet, T., Séraphin, D., Bruneton, J. and
Richomme, P., 2002. Thirteen new xanthone derivatives from Calophyllum
caledonicum (Clusiaceae). Molecules, 7(1), pp. 38-50.
Morel, C., Séraphin, D., Oger, J., Litaudon, M., Sévenet, T., Richomme, P.,
and Bruneton, J., 2000. New xanthones from Calophyllun caledonicum.
Journal of Natural Products, 63(11), pp. 1471-1474.
Naithani, R., Metha, R. G., Shukla, D., Chandersekera, S. N. and Moriarty, R.
M., 2010. Antiviral activity of phytochemicals: a current perspective. Dietary
Components and Immune Function, 8(11), pp. 421-468.
Nasir, N. M., Rahmani, M., Shaari, K., Go, R., Stanslas, J. and Jeyaraj, E. J.,
2013. Xanthones from Calophyllum gracilipes and their cytotoxic activity.
Sains Malaysiana, 42(9), pp. 1261–1266.
Nasir, N. M., Rahmani, M., Shaari, K., Ee, G. C. L., Go, R., Kassim, N. K.,
Muhamad, S. N. K. and Iskandar, M. J., 2011. Two new xanthones from
Calophyllum nodusum (Guttiferae). Molecules, 16(12), pp. 8973-8980.
Negi, J. S., Bisht, V. K., Singh, P., Rawat, M. S. M. and Joshi, G.P., 2013.
Naturally occurring xanthones: chemistry and biology. Journal of Applied
Chemistry, 2013, pp. 1-9.
Nguyen, L. T., Nguyen, H. T., Barbič, M., Brunner, G., Heilmann, J., Pham, H.
D., Nguyen, D. M. and Nguyen, L. D., 2012. Polyisoprenylated
acylphloroglucinols and a polyisoprenylated tetracyclic xanthone from the bark
of Calophyllum thorelii. Tetrahedron Letters, 53(34), pp. 4487-4493.
Nigam, S. K., Banerji, R., Rebuffat, S., Cesario, M., Pascard, C. and Bodo, B.,
1988. Soulattrone, a C24 terpenoid from Calophyllum soulattri. Phytochemistry,
27(2), pp. 527-530.
Nigam, S. K. and Mitra, C. R., 1967. Constituents of Calophyllum tomentosum
and Calophyllum apetalum nuts: structure of a new 4-alkyl- and of two new 4-
phenyl-coumarins. Tetrahedron Letters, 28, pp. 2633-2636.

106
Pengsuparp, T., Serit, M., Hughes, S. H., Soejarto, D. D. and Pezzuto, J. M.,
1996. Specific inhibition of human immunodeficiency virus type 1 reverse
transcriptase mediated by soulattrolide, a coumarin isolated from the latex of
Calophyllum teysmannii. Journal of Natural Products, 59(9), pp. 839-842.
Pires, C. T. A., Brenzan, M. A., Scodro, R. B. D. L., Cortez, D. A. G., Lopes, L.
D. G., Siqueira, V. L. D. and Cardoso, R. F., 2014. Anti-mycobacterium
tuberculosis activity and cytotoxicity of Calophyllum brasiliense Cambess
(Clusiaceae). Memórias do Instituto Oswaldo Cruz, 109(3), pp. 324-329.
Prasad, J., Shrivastava, A., Khanna, A., Bhatia, G., Awasthi, S. and Narender,
T., 2012. Antidyslipidemic and antioxidant activity of the constituents isolated
from the leaves of Calophyllum inophyllum. Phytomedicine, 19(14), pp. 1245-
1249.
Ravelonjato, B., Kunesch, N. and Poisson, J. E., 1987. Neoflavonoids from the
stem bark of Calophyllum verticillatum. Phytochemistry, 26(11), pp. 2973-
2976.
Rissyelly, Katrin, Berna, E. and Angger, M., 2014. Radical scavenging activity
of extract, fraction and chemical compound from Calophyllum sclerophyllum
vesq. stembark by using 1,1-diphenyl-2-picryl hydrazil (DPPH). Int. J.
PharmTech Res, 6(1), pp. 396-402.
Saklani, A. and Kutty, S. K., 2008. Plant-derived compounds in clinical trials.
Drug Discovery Today, 13(3), pp. 161-171.
Scheinmann, F. and Sripong, N., 1970. Xanthones from the heartwood of
Calophyllum neo-ebudicum: comments on the taxonomic value of jacareubin in
Calophyllum species. Phytochemistry, 10(6), pp. 1331-1333.
Shern, Y., Wang, L., Khalil, A. T. and Kuo, Y., 2004. Chromanones and
dihydrocoumarins from Calophyllum blancoi. Chemical and Pharmaceutical
Bulletin, 52(4), pp. 402-405.
Shern, Y., Wang, L., Khalil, A. T., Chiang, L. C. and Cheng, P., 2005.
Bioactive pyranoxanthones from the roots of Calophyllum blancoi. Chemical
and Pharmaceutical Bulletin, 53(2), pp. 244-247.

107
Su, X., Zhang, M., Li, L., Huo, C., Gu, Y. and Shi, Q., 2008. Chemical
constituents of the plants of the genus Calophyllum. Chemistry and
Biodiversity, 5(12), pp. 2579-2608.
Stout, G. H. and Karl D. S., 1968. Calophyllum products III structure of
blancoic acids. The Journal of Organic Chemistry, 33(11), pp. 4185-4190.
Stout, G. H. and Stevens, K. L., 1964. The structure of costatolide. The
Journal of Organic Chemistry, 29(12), pp. 3604-3609.
Taher, M., Idris, M. S., Ahmad, F. and Arbain, D., 2005. A polyisoprenylated
ketone from Calophyllum enervosum. Phytochemistry, 66(6), pp. 723-726.
Taher, M., Idris, M. S., Ahmad, F. and Arbain, D., 2007. Antimicrobial,
antioxidant and cytotoxic activities of Garcinia eugenifolia and Calophyllum
enovorsum. Internation Journal of Pharmacy and Technology, 6(1), pp. 93-98.
Tjitrosoepomo, G., 1996. Takssonomi Tumbuhan Spermatophyta. Yogyakarta:
Gajah mada University Press.
Vane, J. R., 1971. Inhibition of prostaglandin synthesis as a mechanism of
action for aspirin-like drugs. Nature New Biology, 231(25), pp. 232-235.
Venugopala, K. N., Rashmi, V. and Odhav, B., 2013. Review on natural
coumarin lead compounds for their pharmacological activity. BioMed Research
International, 2013, pp. 1-14.
Wang, H., Sun, Q., Yang, F., Long, C., Wang, Y., Tang, G., Zhao, F., Niu, H.,
Huang, Q., Xu, J., Wataya, Y. and Ma, L., 2010. Chromanone derivatives from
the pericarps of Calophyllum polyanthum. Helvetica Chimica Acta, 93(11), pp.
2183-2188.
Wiart, C., 2013. Lead compounds from medicinal plants for the treatment of
cancer. London: Elsevier Academic Press.

108
Wong, K. M. ed., 2009. Herbs of Malaysia: an introduction to the medicinal,
culinary, aromatic and cosmetic use of herbs. Malaysia: Marshall Cavendish
Editions.
Wurdack K. J. and Davis C. C., 2009. Malpighiales phylogenetics: gaining
ground on one of the most recalcitrant clades in the angiosperm tree of life.
American Journal of Botany, 96(8), pp. 1551-1570.
Yimdjo, M. C., Azebaze, A. G., Nkengfack, A. E., Meyer, A. M., Bodo, B. and
Fomum, Z. T., 2004. Antimicrobial and cytotoxic agents from Calophyllum
inophyllum. Phytochemistry, 65(20), pp. 2789-2795.
Zhao, X., Chen, Q., Liu, Y., Xia, C., Shi, J. and Zheng, M., 2014. Effect of
xanthone derivatives on animal models of depression. Current Therapaeutic
Research, 76, pp. 45-50.
Zou, J., Jin, D., Chen, W., Wang, J., Liu, Q., Zhu, X. and Zhao, W., 2005.
Selective cyclooxygenase-2 inhibitors from Calophyllum membranaceum.
Journal of Natural Products, 68(10), pp. 1514-1518.
Zou, J., Wu, J., Liu, S. and Zhao, W., 2010. New coumarins and triterpenes
from Calophyllum Inophyllum. Helvetica Chimica Acta, 93(9), pp. 1812-1821.