California (CAISO) Electric Regions
17
Federal Energy Regulatory Commission • Market Oversight @ FERC.gov California Electric Market: Overview and Focal Points March 2008 California (CAISO) Electric Regions March 2008
Transcript of California (CAISO) Electric Regions

Federal Energy Regulatory Commission • Market Oversight @ FERC.gov
California Electric Market: Overview and Focal Points March 2008
California (CAISO) Electric Regions
March 2008

Federal Energy Regulatory Commission • Market Oversight @ FERC.gov
Updated August 3, 2007
California Electric Market: Overview and Focal Points
1002
Overview
Geography
States covered: California (most of) and northern Baja California (Mexico)
Reliability region: California-Mexico Power Area (CAMX) sub-region of the Western Electric Coordinating Council (WECC)
Balancing authorities: California ISO (CAISO), Sacramento Municipal Utility District (SMUD), Turlock Irrigation District (TID), Los Angeles Department of Water and Power (LADWP), and Comision Federal de Electricidad(CFE).
Approximately 80% of demand in the CAMX subregion is within the area of the CAISO balancing authority. The portion of the CAMX area within Mexico is comparatively small. The remaining 20% of California's load is managed primarily by municipal utilities and irrigation districts such as the Los Angeles Department of Water and Power, the Sacramento Municipal Utility District, and the Imperial Irrigation District.
CAISO zones: NP-15, ZP-26, SP-15
RTO/ISO
California ISO (CAISO) (established 1998) operates the region's power grid and wholesale electric markets:
• Real-time imbalance energy,
• Ancillary services, and
• Transmission usage.
CAISO 2006 State of the Markets ReportMarket Monitor: Keith Casey – Director, Department of Market Monitoring
Page 2 of 17
March 2008

Federal Energy Regulatory Commission • Market Oversight @ FERC.gov
Updated April 26, 2007
California Electric Market: Overview and Focal Points
1002
Generation/Supply
Marginal fuel type: natural gas
Generating capacity (summer 2006): 56,347 MW
Capacity reserve (summer 2006): 6,077 MW
Reserve margin (summer 2006): 12%
Demand
All time peak demand: 50,270 MW (set July 24, 2006)
In July 2006, CAISO experienced an extreme heat wave that resulted in new records for peak loads and for temperatures across the state.
Peak demand growth: 10.7% (2006-2005)
2004 2005 2006
Summer Peak Demand (MW) 45,597 45,431 50,270
Source: Derived from CAISO data.
Load pockets: Humbolt, North Bay, Greater San Francisco Bay, Sierra, Stockton, Los Angeles Basin, and San Diego areas.
Page 3 of 17
March 2008

Federal Energy Regulatory Commission • Market Oversight @ FERC.gov
Updated April 26, 2007
California Electric Market: Overview and Focal Points
1002
Prices (CAISO only)
Annual Average Price (ISO Real-time)
NP-15:
2004: $38.52/MWh
2005: $54.25/MWh
2006: $43.38/MWh
SP-15:
2004: $39.64/MWh
2005: $55.52/MWh
2006: $46.84/MWh
Prices increased in 2005 as a result of disturbances to the natural gas market. Prices declined in 2006 as natural gas storage levels remained above historical ranges throughout the injection season (April through October).
Interconnections/Seams
Load serving entities within CAISO rely on imports for approximately one-fourth of their annual energy needs.
Page 4 of 17
March 2008

Federal Energy Regulatory Commission • Market Oversight @ FERC.gov
Updated June 5, 2007
California Electric Market: Overview and Focal Points
1002
Focal Points
Price Differences: California ISO real-time prices differed from bilateral spot markets in 2006. Last year, average on-peak prices for CAISO real-time imbalance energy ($48/MWh) were lower than bilateral spot prices ($57/MWh). A recent CAISO study found that overscheduling of power deliveries required the majority of real time dispatches to reduce output. These decremental dispatches resulted in the lower real time prices. The new Market Redesign and Technology Upgrade (MRTU), to be implemented in 2008, is to contain mechanisms that are intended to improve day-ahead and real time price convergence.
CAISO Bid Cap: On January 14, 2006, CAISO raised the bid cap for its real-time imbalance energy market from $250/MWh to $400/MWh. The Commission approved this proposal in response to CAISO concerns that having the bid cap remain at $250/MWh might result in reduced bid volumes with gas prices on the rise as was occurring in the fall of 2005. (Both the previous and revised bid caps were “soft,” where a soft bid cap permits market participants to submit bids above the cap subject to cost justification, but such bids are not allowed to set the market clearing price.)
Page 5 of 17
March 2008

Federal Energy Regulatory Commission • Market Oversight @ FERC.gov
Updated April 26, 2007
California Electric Market: Overview and Focal Points
1002
Focal Points
Heat Wave Loads: In late July 2006, load records were set in regions covered by the California Independent System Operator (CAISO), Los Angeles Department of Water and Power (LADWP), and Sacramento Municipal Utility District (SMUD). A severe heat wave resulted in 100+ degree temperatures over most of the state, with some areas topping 110 degrees. California's utilities, the CAISO, and state officials urged consumers to conserve. CAISO declared a Stage 2 Emergency (calling for conservation) on July 24 when operating reserves dropped below 5 percent, which allowed CAISO to direct participating utilities to curtail nonfirm load and customers on interruptible programs.
Conservation efforts, curtailed load, and distribution system outages kept peak load under the 52,000 MW that CAISO anticipated that date, with the peak actually reaching 50,270 MW on July 24. No curtailment of nonfirm load was needed.
Power prices in the bilateral markets, where the majority of incremental power needs are met in California, rose to more than $350/MWh. CAISO real-time prices rose to nearly $400/MWh (which is the current soft bid cap in the real-time imbalance energy market) intermittently throughout the days of the almost two-week-long heat wave. High levels of day-ahead and hour-ahead scheduling occurred in CAISO as utilities and other load serving entities implemented the state's new resource adequacy requirements, which were set in June. Volumes in CAISO's real-time energy market were relatively moderate over the critical peak hours.
Page 6 of 17
March 2008

Federal Energy Regulatory Commission • Market Oversight @ FERC.gov
Supply and Demand Statistics for CAISO
Corrected and Updated April 10, 2007Source: Derived from CAISO data.
California Electric Market: Supply and Demand
1003
Footnote (1): Generation capacity includes dynamically scheduled generation, and excludes any derates of the resources or imports.
2004 2005 2006Summer Generating Capacity MW (1) 54,038 55,694 56,347Summer Peak Demand MW 45,597 45,431 50,270Summer Reserves MW 8,441 10,263 6,077Summer Reserve Margin: 19% 23% 12%Annual Load (GWh): 239,788 236,449 240,259Annual Net Generation GWh 178,304 179,188 177,757
Supply Demand Statistics
Page 7 of 17
March 2008

Federal Energy Regulatory Commission • Market Oversight @ FERC.gov
Annual Average Bilateral Prices
Updated March 7, 2008Source: Derived from Platts data.
California Electric Market: Annual Bilateral Prices
1004
Annual Average Day Ahead On Peak Prices ($/MWh)2005 2006 2007 5 Years
NP15 $72.49 $61.08 $66.59 $60.72SP15 $73.04 $61.95 $66.48 $61.57
Page 8 of 17
March 2008

Federal Energy Regulatory Commission • Market Oversight @ FERC.gov
Western Daily Bilateral Day-Ahead On-Peak Prices
Source: Derived from Platts data.
California Electric Market: Western Bilateral Prices
1006
$0
$50
$100
$150
$200
$250
$300
Jan-0
7Feb
-07Mar-
07Apr-
07May
-07Ju
n-07
Jul-0
7Aug
-07Sep
-07Oct-
07Nov
-07Dec
-07Ja
n-08
Feb-08
Mid-ColumbiaNP-15SP-15Palo Verde
Monthly Average
$0
$20
$40
$60
$80
$100
$120
Jan-0
4May
-04Sep
-04Ja
n-05
May-05
Sep-05
Jan-0
6May
-06Sep
-06Ja
n-07
May-07
Sep-07
Jan-0
8
Pric
e ($
/MW
h)
Updated March 7, 2008
Page 9 of 17
March 2008

Federal Energy Regulatory Commission • Market Oversight @ FERC.gov
Southwestern Daily Bilateral Day-Ahead On-Peak Prices
Updated March 7, 2008Source: Derived from Platts data.
California Electric Market: Southwestern Bilateral Prices
1005
$0
$50
$100
$150
$200
$250
$300
$350
Jan-0
7Fe
b-07
Mar-07
Apr-07
May-07
Jun-0
7Ju
l-07
Aug-07
Sep-07
Oct-07
Nov-07
Dec-07
Jan-0
8Feb
-08
SP-15Four CornersMeadPalo Verde
Monthly Average
$0
$20
$40
$60
$80
$100
$120
Jan-0
4May
-04Sep
-04Ja
n-05
May-05
Sep-05
Jan-0
6May
-06Sep
-06Ja
n-07
May-07
Sep-07
Jan-0
8Pr
ice
($/M
Wh)
Page 10 of 17
March 2008

Federal Energy Regulatory Commission • Market Oversight @ FERC.gov
Northwestern Daily Bilateral Day-Ahead On-Peak Prices
Source: Derived from Platts data.
California Electric Market: Northwestern Bilateral Prices
1007
$0
$50
$100
$150
$200
$250
$300
Jan-0
7Feb
-07Mar-
07Apr-
07May
-07Ju
n-07
Jul-0
7Aug
-07Sep
-07Oct-
07Nov
-07Dec
-07Ja
n-08
Feb-08
Mid-ColumbiaCOBNP-15
Monthly Average
$0$20$40$60
$80$100$120
Jan-0
4May
-04Sep
-04Ja
n-05
May-05
Sep-05
Jan-0
6May
-06Sep
-06Ja
n-07
May-07
Sep-07
Jan-0
8Pr
ice
($/M
Wh)
Updated March 7, 2008
Page 11 of 17
March 2008
Federal Energy Regulatory Commission • Market Oversight @ FERC.gov
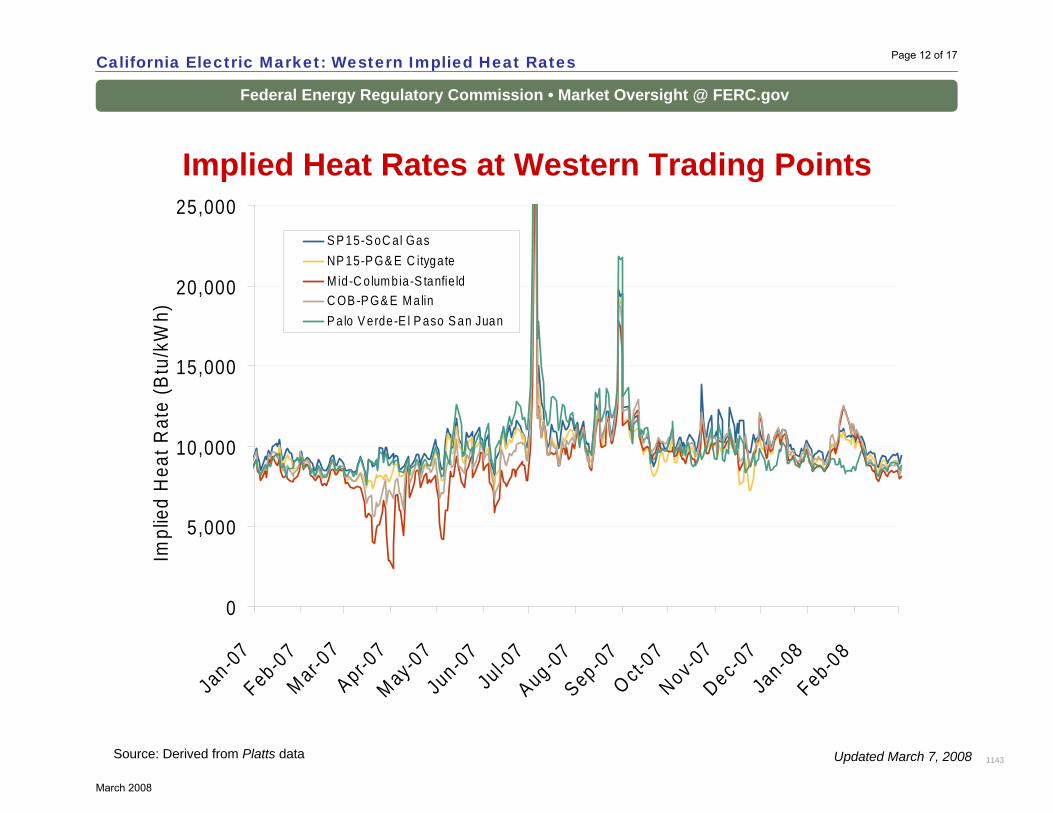
Implied Heat Rates at Western Trading Points
Source: Derived from Platts data
California Electric Market: Western Implied Heat Rates
1143
0
5,000
10,000
15,000
20,000
25,000
Jan -07Feb-07Mar-0
7Apr-0
7May-07Jun -07
Jul-07
Aug -07Sep -07Oct-0
7Nov-07Dec-07Jan -08Feb-08
Impl
ied
Hea
t Rat
e (B
tu/k
Wh)
S P 15-S oC al Gas NP 15-P G& E C itygateM id-C o lumbia-S tanfie ldC OB -P G& E MalinP a lo V erde-E l P aso S an Juan
Updated March 7, 2008
Page 12 of 17
March 2008

Federal Energy Regulatory Commission • Market Oversight @ FERC.gov
Western Daily Actual Peak Demand
Source: Derived from WECC Daily Report data available at http://wecc.biz. Data shown is generally Sunday through Thursday due to limitations of daily reports.
California Electric Market: Daily Peak Demand
1192Updated March 7, 2008
0
10
20
30
40
50
60
70
Nov-06
Dec-06
Jan-0
7Feb
-07Mar-
07Apr-
07May
-07Ju
n-07
Jul-0
7Aug
-07Sep
-07Oct-
07Nov
-07Dec
-07Ja
n-08
Feb-08
Mar-08
Thou
sand
s of
GW
s
Northwest
California/Baha
Rockies/Southwest
Page 13 of 17
March 2008

Federal Energy Regulatory Commission • Market Oversight @ FERC.gov
Weekly Electric Generation Output and TemperaturesCalifornia
California Electric Market: Generation Output and Temperatures
1123Source: Derived from EEI and NOAA data.
01,0002,0003,0004,0005,0006,0007,0008,000
Jan Feb Mar Ap r May Ju n Ju l Au g Sep O ct Nov DecEle
ctric
Gen
erat
ion
(GW
h)
2003-2007 Range2008
-50
-25
0
25
50
75
War
mer
Tem
pera
ture
s th
anN
orm
al (D
egre
e D
ays)
Heat ing S eas onHeating S eas on Cooling S eas on
Updated March 7, 2008
Page 14 of 17
March 2008

Federal Energy Regulatory Commission • Market Oversight @ FERC.gov
California Hydroelectric Production
Source: Derived from CAISO data.Trend lines are 7-day moving averages.
California Electric Market: Hydro Production
1104
0
20
40
60
80
100
120
140
Jan Feb Mar Ap r May Jun Ju l Au g Sep O ct Nov Dec
Thou
sand
s of
MW
h
5 -Year Range, 2003-20072007 Output2008 Output
Updated March 7, 2008
Page 15 of 17
March 2008

Federal Energy Regulatory Commission • Market Oversight @ FERC.gov
Pacific Northwest Hydroelectric Production
California Electric Market: Pacific Northwest Hydro Production
1105
0
50
100
150
200
250
300
350
400
Jan Feb Mar Ap r May Ju n Ju l Au g Sep O ct Nov Dec
Thou
sand
s of
MW
h
5 -Year Range, 2003-20072007 Output2008 Output
Source: Derived from USACE data reflecting the output of the 24 largest facilities.Trend lines are 7-day moving averages. Updated March 7, 2008
Page 16 of 17
March 2008

Federal Energy Regulatory Commission • Market Oversight @ FERC.gov
SP-15 Forward and Swap Volumes
Source: Derived from ICE and Nymex ClearPort . ICE on-peak forward (physical) and swap (financial) volumes are for SP-15 and include monthly, dual monthly, quarterly, and calendar year contracts traded for each month. Nymex ClearPort on-peak swap (financial) volumes are for the SP-15 Hub traded by month.
California Electric Market: Physical & Financial Market Volumes
1008
0
5
10
15
20
25
30
35
40
Jan -07Feb-07Mar-0
7Apr-0
7May-07Jun -07
Jul-07
Aug -07Sep -07Oct-0
7Nov-07Dec-07Jan -08Feb-08Mar-0
8Apr-0
8May-08Jun -08
Jul-08
Aug -08Sep -08Oct-0
8Nov-08Dec-08
Thou
sand
s of
GW
h
IC E S P -15 S waps V olumeIC E S P -15 Forwards V o lum eC learP ort S P -15 S waps V o lume
Updated March 7, 2008
Page 17 of 17
March 2008