Calf-Thymus DNA in Solution - Semantic Scholar
19
polymers Article Conformation and Rheological Properties of Calf-Thymus DNA in Solution Lourdes Mónica Bravo-Anaya 1,3 , Marguerite Rinaudo 2, * and Félix Armando Soltero Martínez 3 1 Grenoble Alpes University, Laboratoire Rhéologie et Procédés (LRP), F-38000, Grenoble 38000, France; [email protected] 2 Biomaterials applications, 6 rue Lesdiguières, Grenoble 38000, France 3 Departamento de Ingeniería Química, Universidad de Guadalajara, Blvd. M. García Barragán, Guadalajara C.P. 44430, Jalisco, Mexico; [email protected] * Correspondence: [email protected]; Tel.: +33-611-434-806 Academic Editor: Christine Wandrey Received: 7 January 2016; Accepted: 5 February 2016; Published: 11 February 2016 Abstract: Studies of DNA molecule behavior in aqueous solutions performed through different approaches allow assessment of the solute-solvent interactions and examination of the strong influence of conformation on its physicochemical properties, in the presence of different ionic species and ionic concentrations. Firstly, the conformational behavior of calf-thymus DNA molecules in TE buffer solution is presented as a function of temperature. Secondly, their rheological behavior is discussed, as well as the evidence of the critical concentrations, i.e., the overlap and the entanglement concentrations (C* and C e , respectively) from steady state flow and oscillatory dynamic shear experiments. The determination of the viscosity in the Newtonian plateau obtained from flow curves η ( 9 γ) allows estimation of the intrinsic viscosity and the specific viscosities at zero shear when C[η] < 40. At end, a generalized master curve is obtained from the variation of the specific viscosity as a function of the overlap parameter C[η]. The variation of the exponent s obtained from the power law η~ 9 γ ´s for both flow and dynamic results is discussed in terms of Graessley’s analysis. In the semi-dilute regime with entanglements, a dynamic master curve is obtained as a function of DNA concentration (C DNA > 2.0 mg/mL) and temperature (10 ˝ C< T < 40 ˝ C). Keywords: DNA; hydrodynamic behavior; conformation; electrostatic interactions; temperature 1. Introduction DNA in the double helical structure is a long, thin. and locally cylindrical polyelectrolyte chain [1]. DNA results from four different subunits of monomers called deoxyribonucleotides arranged in a precise linear sequence [2,3]. Each deoxyribonucleotide is formed of a nitrogenous base, a deoxyribose sugar, and a phosphate group. DNA is a semi-flexible molecule having a significant possible rotation around a certain number of links in the sugar-phosphate backbone [4]. The importance of this biomolecule relies in the fact that its linear sequence encodes the genetic information [5–7]. Its two polymeric strands are wound together to form the double helix of DNA [8]. Before cell division, the two DNA strands are separated, so they operate as a template for the synthesis of a new complementary strand, immediately generating two identical double-helical molecules [9,10]. DNA solutions usually have high viscosities at room temperature (25 ˝ C) and pH = 7.0. Their viscosities decrease when solutions are brought to extreme pH or to temperatures above 70 ˝ C, also depending on the external salt concentration of the solutions [11]. High temperatures and extreme pH cause denaturation (or melting) of double-helical DNA [12–14]. DNA denaturation is the process where double-stranded DNA helices unwind and separate into single strands throughout the breaking of hydrogen bonds between bases [15,16]. Each species of DNA is characterized by having a specific Polymers 2016, 8, 51; doi:10.3390/polym8020051 www.mdpi.com/journal/polymers
Transcript of Calf-Thymus DNA in Solution - Semantic Scholar
polymers
Article
Conformation and Rheological Properties ofCalf-Thymus DNA in Solution
Lourdes Mónica Bravo-Anaya 1,3, Marguerite Rinaudo 2,* and Félix Armando Soltero Martínez 3
1 Grenoble Alpes University, Laboratoire Rhéologie et Procédés (LRP), F-38000, Grenoble 38000, France;[email protected]
2 Biomaterials applications, 6 rue Lesdiguières, Grenoble 38000, France3 Departamento de Ingeniería Química, Universidad de Guadalajara, Blvd. M. García Barragán,
Guadalajara C.P. 44430, Jalisco, Mexico; [email protected]* Correspondence: [email protected]; Tel.: +33-611-434-806
Academic Editor: Christine WandreyReceived: 7 January 2016; Accepted: 5 February 2016; Published: 11 February 2016
Abstract: Studies of DNA molecule behavior in aqueous solutions performed through differentapproaches allow assessment of the solute-solvent interactions and examination of the stronginfluence of conformation on its physicochemical properties, in the presence of different ionic speciesand ionic concentrations. Firstly, the conformational behavior of calf-thymus DNA molecules in TEbuffer solution is presented as a function of temperature. Secondly, their rheological behavior isdiscussed, as well as the evidence of the critical concentrations, i.e., the overlap and the entanglementconcentrations (C* and Ce, respectively) from steady state flow and oscillatory dynamic shearexperiments. The determination of the viscosity in the Newtonian plateau obtained from flowcurves η ( 9γ) allows estimation of the intrinsic viscosity and the specific viscosities at zero shear whenC[η] < 40. At end, a generalized master curve is obtained from the variation of the specific viscosityas a function of the overlap parameter C[η]. The variation of the exponent s obtained from the powerlaw η~ 9γ´s for both flow and dynamic results is discussed in terms of Graessley’s analysis. In thesemi-dilute regime with entanglements, a dynamic master curve is obtained as a function of DNAconcentration (CDNA > 2.0 mg/mL) and temperature (10 ˝C < T < 40 ˝C).
Keywords: DNA; hydrodynamic behavior; conformation; electrostatic interactions; temperature
1. Introduction
DNA in the double helical structure is a long, thin. and locally cylindrical polyelectrolyte chain [1].DNA results from four different subunits of monomers called deoxyribonucleotides arranged in aprecise linear sequence [2,3]. Each deoxyribonucleotide is formed of a nitrogenous base, a deoxyribosesugar, and a phosphate group. DNA is a semi-flexible molecule having a significant possible rotationaround a certain number of links in the sugar-phosphate backbone [4]. The importance of thisbiomolecule relies in the fact that its linear sequence encodes the genetic information [5–7]. Its twopolymeric strands are wound together to form the double helix of DNA [8]. Before cell division, the twoDNA strands are separated, so they operate as a template for the synthesis of a new complementarystrand, immediately generating two identical double-helical molecules [9,10].
DNA solutions usually have high viscosities at room temperature (25 ˝C) and pH = 7.0. Theirviscosities decrease when solutions are brought to extreme pH or to temperatures above 70 ˝C, alsodepending on the external salt concentration of the solutions [11]. High temperatures and extremepH cause denaturation (or melting) of double-helical DNA [12–14]. DNA denaturation is the processwhere double-stranded DNA helices unwind and separate into single strands throughout the breakingof hydrogen bonds between bases [15,16]. Each species of DNA is characterized by having a specific
Polymers 2016, 8, 51; doi:10.3390/polym8020051 www.mdpi.com/journal/polymers

Polymers 2016, 8, 51 2 of 19
denaturation temperature, also referred as melting point (Tm) [17]. DNA melting point increaseswhile increasing the content of guanine–cytosine (G–C) base pairs, since they possess three hydrogenbonds that require more heat energy to dissociate than adenine–thymine (A–T) base pairs [18]. Tm
also depends strongly on the ionic concentration in solution due to the electrostatic screening betweenphosphate negatively charged sites.
One of the most interesting characteristics of the DNA molecule is that each base pair has twoelementary negative charges [5,14,19]. A double-stranded DNA molecule is then characterized byhaving an exceptionally high linear charge density. Small cations like Na+ are usually attracted byDNA negative charges, creating a positively charged cloud around its chain [5]. Several importantproperties of DNA are strongly dependent on DNA concentration and on the salt content, usuallyNaCl, due to the electrostatic interactions between negatively charged DNA molecules, and betweenneighbor phosphate sites on DNA chains and counterions [14,20]. Especially in a diluted solution ofpolyelectrolyte, such as DNA in water, these electrostatic interchain and intrachain interactions needto be considered. Odijk [21] studied DNA as a wormlike chain characterized by a contour length Land a persistence length lp, bearing charges that interact via electrostatic repulsions increasing thetotal persistence length. Many authors have extensively studied the effect of electrostatics on therigidity of the double helix of DNA characterized by its persistence length in dependence of the ionicstrength [21–25]. DNA is one the stiffest polymers, with a persistence length of around 50 nm for longchains in 0.1 M aqueous NaCl [22].
Various techniques have contributed to understanding the macroscopic [22,26] and/ormicroscopic [27] behavior of DNA molecules in solution. In the field of polymers study, there isan important distinction between dilute polymer solutions, where the coiled chains are separatedfrom one another, and more concentrated solutions, where the chains overlap. This threshold isknown as the overlap concentration (C*), also considered as a transition region between the diluteregime and the semi-dilute regime [26]. At higher concentrations, it has been reported a second criticalconcentration, i.e., the entanglement concentration, Ce [28,29] or C** [30,31] (depending on the authors)defined as the limit to enter semi-dilute uniformly entangled regime. Several rheological studies ofaqueous solutions of DNA have provided information about the dynamics of DNA chains in solution.Raspaud et al. [29] and Musti et al. [32] published scaling plots of zero shear viscosity as a functionof polymer concentration in the semi-dilute with and without entanglements regimes for T2 phageDNA in buffer. They showed that a universal plot could be obtained for all samples when the ratiobetween the viscosity and the Rouse viscosity (η/ηRouse) is plotted as a function of C/Ce. Over Ce, theslope of this curve is equal to 3.4. Among several studies of the viscoelastic behavior of calf thymusDNA solutions in buffer, Mason et al. [28] reported the dependence of the G modulus plateau (G0)and the crossover frequency (ωc) with DNA concentration using the following power laws: G0~C2.3
and ωc~C´2.4. These values were found to be consistent with the model of entangled semi-flexiblepolymer coils dissolved in a good solvent [28].
Currently, research has also focused in a more detailed study of the mechanical and dynamicalproperties of biopolymers study since they directly affect many biological processes, including proteinfolding and DNA transcription [33–35]. As an example, the rigidity of the actin and myosin in musclesprovides the structure maintaining the shape of the cell [36], while flexibility of DNA allows to themolecule to undergo a drastic change of state, from an elongated state to a very compact state duringthe compaction process [19]. Dynamics of biopolymer fluids are a research area of great interest,mainly the flow of DNA in “lab-on-chip” devices, whose applications include the mapping of thegenome [37,38]. The study of rheological and flow properties of DNA solutions has much practicalimportance and can lead to a better understanding of the dynamics of macromolecules [39,40].
In this work, the conformational behavior of calf-thymus DNA in NaCl solutions at differentionic concentrations and the rheological behavior of calf-thymus DNA in Tris–HCl/EDTA bufferare developed. DNA solutions are studied in a wide concentration range, i.e., from the dilute to thesemi-dilute with entanglements regimes (0.01 < CDNA < 30 mg/mL), and in the temperature range
Polymers 2016, 8, 51 3 of 19
between 10 and 40 ˝C. The evidence of two critical concentrations (C* and Ce) is discussed fromsteady state and oscillatory dynamic shear experiments. Flow results are analyzed in terms of (1) theviscosity η0 in the Newtonian plateau, (2) the critical shear rate
.γc for the transition to non-Newtonian
behavior, and (3) the exponent from the power law η~.γ´s. The determination of the intrinsic viscosity
through the viscosity in the Newtonian plateau allows calculating the molecular weight of calf-thymusDNA. Flow and dynamic measurements data are discussed considering the phase diagram given byGraessley [41] and the two-parameter scaling discussed by Colby et al. [42,43].
2. Materials and Methods
2.1. Materials and Solution Preparation
DNA/Buffer solutions were prepared from samples of calf thymus DNA supplied bySigma–Aldrich (Toluca, Mexico). A buffer solution was prepared with Tris–HCl and EDTA inorder to obtain and maintain pH = 7.3. Trizma, C4H12ClNO3, (Tris–HCl) was used with a purityof 99.0%. Ethylenediaminetetraacetic acid (EDTA), C10H16N2O8, was also used with a purity of 99.0%.Appropriate amounts of Tris–HCl (100 mM) and EDTA (10 mM) were used to prepare the buffersolution. After mixing Tris–HCl and EDTA, the pH was checked (pH = 2.75) and then adjusted topH = 7.3 by adding NaOH solution (3 M). DNA solutions were prepared using appropriate amountsof DNA for each polymer concentration and a solvent consisting of a ratio of 9:1 of HPLC waterand Tris–HCl/EDTA buffer (TE buffer). The ionic strength of this TE buffer determined throughconductivity measurements was found to be equivalent to 10´2 M of NaCl. Sigma–Aldrich Companysupplied all reagents. Anhydrous NaCl was used separately to prepare a series of DNA solutionsat different ionic concentrations (from 10´4 M to 10´1 M) to examine the role of ionic concentrationon viscosity and conformation. All solutions and dilutions were prepared with HPLC grade water.The vials were closed and sealed with Parafilm® (Bemis NA, Neenah, WI, USA) to prevent waterevaporation and changes in the concentration. All solutions were stored in a refrigerator at atemperature of 4 ˝C in order to prevent degradation.
2.2. Purity and Thermal Stability
DNA melting temperatures (Tm) were measured by recording the absorbance A260 as a functionof temperature (T) using a Cary 400 Scan UV–Vis Spectrophotometer. The Tm cell block contains sixcells for samples and six cells for the solvent. Quartz cuvettes were used for all measurements. Thesolvent cuvettes were filled with water, NaCl solution, or TE buffer solution (depending on the solventused for the tested sample) and were used as blank. The temperature controlled instrument allowsthe increase and decrease of temperature with variable increments. In this study, the temperaturewas raised at a rate of 1 ˝C/min, from 25 to 90 ˝C, then it was decreased from 90 to 25 ˝C at a rate of5 ˝C/min.
2.3. Rheological Measurements
The rheological behavior of DNA/TE buffer system was studied through flow and dynamicmeasurements by using DHR-3 and AR-G2 rheometers from TA Instruments Company (New Castle,DE, USA). Three different geometries were used depending on DNA concentration and on the type ofexperiment carried on: (1) a steel cone with a 60 mm diameter and an angle of 2˝ was used for DNAsolutions with concentrations between 0.01 mg/mL to 0.4 mg/mL (DHR-3 rheometer); (2) a steel conewith a 60 mm diameter and an angle of 1˝ was used for DNA solutions with concentrations between0.5 mg/mL to 2 mg/mL (AR-G2 rheometer); (3) a steel cone with a 40 mm diameter and an angle of 2˝
was used for DNA solutions with concentrations between 2 mg/mL to 30 mg/mL (AR-G2 rheometer).Flow experiments: Steady state measurements were performed in a shear rate range between
1 ˆ 10´3 and 1000 s´1, using five points per decade. For each DNA sample, each sweep was performedat the following temperatures: 10, 20, 30, and 40 ˝C, controlled by a Peltier plane.
Polymers 2016, 8, 51 4 of 19
Dynamic measurements: In order to define the linear viscoelastic regime (LVR), oscillation strainsweeps were carried out at an angular frequency of 10 rad/s in a strain range between 0.01% and100% using 10 points per decade. Frequency sweeps were carried out in the range 0.01 up to 100 rad/sat a selected strain in the LVR, using five points per decade. For each DNA sample, each strain andfrequency sweep was performed at the following temperatures: 10, 20, 30, and 40 ˝C, controlled by aPeltier plane.
3. Results and Discussion
3.1. Conformation
Absorbance measurements allowed determining DNA concentration in solution. In addition,DNA purity was evaluated by measuring the absorbance from 230 nm to 320 nm to detect otherpotential contaminants. The ratio A260/A280 was found to be 1.87 ˘ 0.11, which is in good agreementwith pure DNA ratio reported in the literature (between 1.8 and 2.0) [44]. DNA concentration of thestudied samples was determined by measuring the absorbance at 260 nm (A260), where DNA absorbslight most strongly [45]. The spectrophotometric measurements at A260 can be converted from oneabsorbance unit at 260 nm to DNA concentration expressed in mg/mL, depending on the nature ofthe chain [46], i.e., A260 = 1 corresponds to 33 µg/mL and to 50 µg/mL for single stranded DNA anddouble-stranded DNA, respectively. Double-stranded DNA conversion was used for our sample.
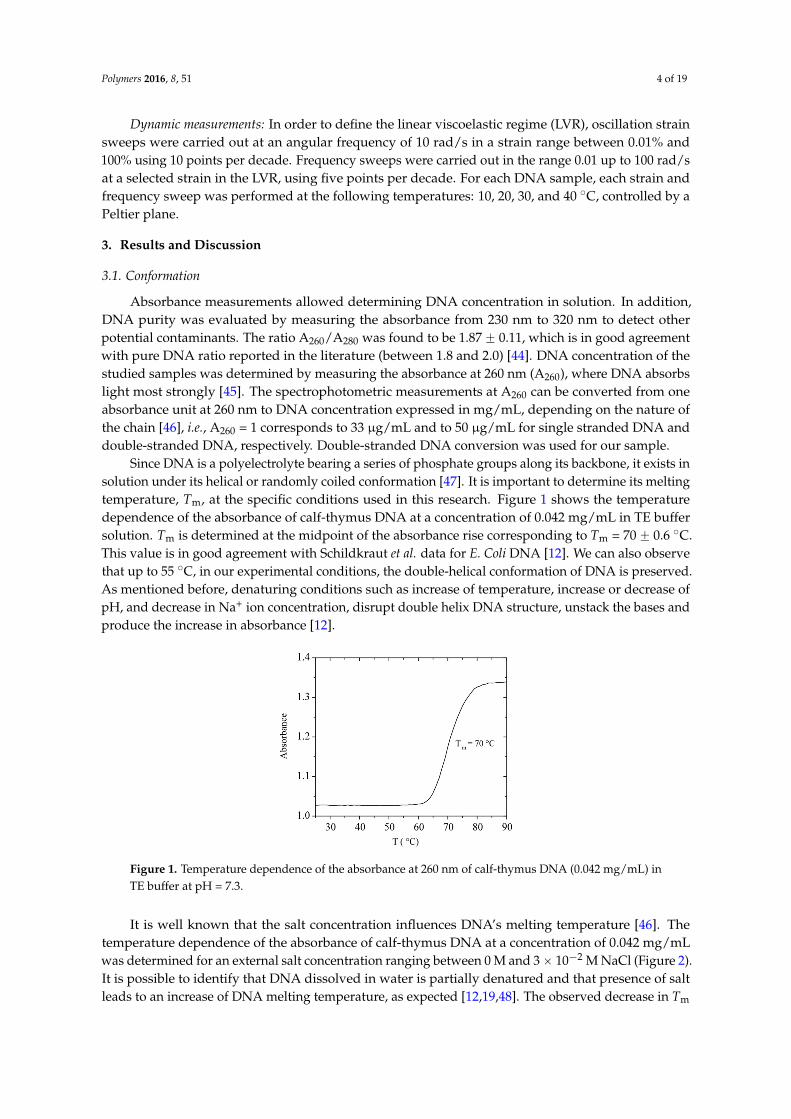
Since DNA is a polyelectrolyte bearing a series of phosphate groups along its backbone, it exists insolution under its helical or randomly coiled conformation [47]. It is important to determine its meltingtemperature, Tm, at the specific conditions used in this research. Figure 1 shows the temperaturedependence of the absorbance of calf-thymus DNA at a concentration of 0.042 mg/mL in TE buffersolution. Tm is determined at the midpoint of the absorbance rise corresponding to Tm = 70 ˘ 0.6 ˝C.This value is in good agreement with Schildkraut et al. data for E. Coli DNA [12]. We can also observethat up to 55 ˝C, in our experimental conditions, the double-helical conformation of DNA is preserved.As mentioned before, denaturing conditions such as increase of temperature, increase or decrease ofpH, and decrease in Na+ ion concentration, disrupt double helix DNA structure, unstack the bases andproduce the increase in absorbance [12].
Polymers 2016, 8, 51 4 of 18
strain and frequency sweep was performed at the following temperatures: 10, 20, 30, and 40 °C, controlled by a Peltier plane.
3. Results and Discussion
3.1. Conformation
Absorbance measurements allowed determining DNA concentration in solution. In addition, DNA purity was evaluated by measuring the absorbance from 230 nm to 320 nm to detect other potential contaminants. The ratio A260/A280 was found to be 1.87 ± 0.11, which is in good agreement with pure DNA ratio reported in the literature (between 1.8 and 2.0) [44]. DNA concentration of the studied samples was determined by measuring the absorbance at 260 nm (A260), where DNA absorbs light most strongly [45]. The spectrophotometric measurements at A260 can be converted from one absorbance unit at 260 nm to DNA concentration expressed in mg/mL, depending on the nature of the chain [46], i.e., A260 = 1 corresponds to 33 μg/mL and to 50 μg/mL for single stranded DNA and double-stranded DNA, respectively. Double-stranded DNA conversion was used for our sample.
Since DNA is a polyelectrolyte bearing a series of phosphate groups along its backbone, it exists in solution under its helical or randomly coiled conformation [47]. It is important to determine its melting temperature, Tm, at the specific conditions used in this research. Figure 1 shows the temperature dependence of the absorbance of calf-thymus DNA at a concentration of 0.042 mg/mL in TE buffer solution. Tm is determined at the midpoint of the absorbance rise corresponding to Tm = 70 ± 0.6 °C. This value is in good agreement with Schildkraut et al. data for E. Coli DNA [12]. We can also observe that up to 55 °C, in our experimental conditions, the double-helical conformation of DNA is preserved. As mentioned before, denaturing conditions such as increase of temperature, increase or decrease of pH, and decrease in Na+ ion concentration, disrupt double helix DNA structure, unstack the bases and produce the increase in absorbance [12].
Figure 1. Temperature dependence of the absorbance at 260 nm of calf-thymus DNA (0.042 mg/mL) in TE buffer at pH = 7.3.
It is well known that the salt concentration influences DNA’s melting temperature [46]. The temperature dependence of the absorbance of calf-thymus DNA at a concentration of 0.042 mg/mL was determined for an external salt concentration ranging between 0 M and 3 × 10⁻² M NaCl (Figure 2). It is possible to identify that DNA dissolved in water is partially denatured and that presence of salt leads to an increase of DNA melting temperature, as expected [12,19,48]. The observed decrease in Tm at low salt concentrations is caused by an increase of the electrostatic repulsions between the negative phosphate sites of DNA strands competing with the stabilization by the cooperative hydrogen bonds.
Figure 1. Temperature dependence of the absorbance at 260 nm of calf-thymus DNA (0.042 mg/mL) inTE buffer at pH = 7.3.
It is well known that the salt concentration influences DNA’s melting temperature [46]. Thetemperature dependence of the absorbance of calf-thymus DNA at a concentration of 0.042 mg/mLwas determined for an external salt concentration ranging between 0 M and 3ˆ 10´2 M NaCl (Figure 2).It is possible to identify that DNA dissolved in water is partially denatured and that presence of saltleads to an increase of DNA melting temperature, as expected [12,19,48]. The observed decrease in Tm

Polymers 2016, 8, 51 5 of 19
at low salt concentrations is caused by an increase of the electrostatic repulsions between the negativephosphate sites of DNA strands competing with the stabilization by the cooperative hydrogen bonds.Polymers 2016, 8, 51 5 of 18
Figure 2. Temperature dependence of the % denaturation calculated from the absorbance at 260 nm of calf-thymus DNA 0.042 mg/mL at salt concentrations up to 3 × 10⁻² M NaCl, taking as reference the absorbance at 25 °C.
Figure 3 shows the variation of DNA melting temperature for different DNA and salt concentrations in a semi-log plot. A linear behavior is observed when the total ionic concentration (CT) is plotted in semi-log as a function of the inverse of Tm, as usually adopted in the literature [18]. In this representation, CT includes the contribution of free counterions from DNA and ions from the external salt addition [48].
Figure 3. Variation of Tm with the total ionic concentration for different DNA concentrations and external salt contents.
From our experimental results, agreeing with the literature, the main conclusion is that the double helix DNA conformation is preserved in the TE buffer and in DNA solutions with external salt concentrations higher than 10−3 M NaCl in the temperature range from 25 to 60 °C.
3.2. Intrinsic Viscosity and Molecular Weight
To obtain the intrinsic viscosity at low shear rate, the cone-plate rheometer DHR-3 was used and DNA shear viscosity was determined in the concentration range between 0.010 and 0.367 mg/mL in TE buffer. A constant viscosity over a range of at least one decade of shear rate was obtained in order to determine with accuracy the zero shear viscosity for each sample tested. Figure 4 shows the measured viscosities at a temperature of 20 °C.
Figure 2. Temperature dependence of the % denaturation calculated from the absorbance at 260 nm ofcalf-thymus DNA 0.042 mg/mL at salt concentrations up to 3 ˆ 10´2 M NaCl, taking as reference theabsorbance at 25 ˝C.
Figure 3 shows the variation of DNA melting temperature for different DNA and saltconcentrations in a semi-log plot. A linear behavior is observed when the total ionic concentration(CT) is plotted in semi-log as a function of the inverse of Tm, as usually adopted in the literature [18].In this representation, CT includes the contribution of free counterions from DNA and ions from theexternal salt addition [48].
Polymers 2016, 8, 51 5 of 18
Figure 2. Temperature dependence of the % denaturation calculated from the absorbance at 260 nm of calf-thymus DNA 0.042 mg/mL at salt concentrations up to 3 × 10⁻² M NaCl, taking as reference the absorbance at 25 °C.
Figure 3 shows the variation of DNA melting temperature for different DNA and salt concentrations in a semi-log plot. A linear behavior is observed when the total ionic concentration (CT) is plotted in semi-log as a function of the inverse of Tm, as usually adopted in the literature [18]. In this representation, CT includes the contribution of free counterions from DNA and ions from the external salt addition [48].
Figure 3. Variation of Tm with the total ionic concentration for different DNA concentrations and external salt contents.
From our experimental results, agreeing with the literature, the main conclusion is that the double helix DNA conformation is preserved in the TE buffer and in DNA solutions with external salt concentrations higher than 10−3 M NaCl in the temperature range from 25 to 60 °C.
3.2. Intrinsic Viscosity and Molecular Weight
To obtain the intrinsic viscosity at low shear rate, the cone-plate rheometer DHR-3 was used and DNA shear viscosity was determined in the concentration range between 0.010 and 0.367 mg/mL in TE buffer. A constant viscosity over a range of at least one decade of shear rate was obtained in order to determine with accuracy the zero shear viscosity for each sample tested. Figure 4 shows the measured viscosities at a temperature of 20 °C.
Figure 3. Variation of Tm with the total ionic concentration for different DNA concentrations andexternal salt contents.
From our experimental results, agreeing with the literature, the main conclusion is that thedouble helix DNA conformation is preserved in the TE buffer and in DNA solutions with external saltconcentrations higher than 10´3 M NaCl in the temperature range from 25 to 60 ˝C.
3.2. Intrinsic Viscosity and Molecular Weight
To obtain the intrinsic viscosity at low shear rate, the cone-plate rheometer DHR-3 was used andDNA shear viscosity was determined in the concentration range between 0.010 and 0.367 mg/mLin TE buffer. A constant viscosity over a range of at least one decade of shear rate was obtained inorder to determine with accuracy the zero shear viscosity for each sample tested. Figure 4 shows themeasured viscosities at a temperature of 20 ˝C.

Polymers 2016, 8, 51 6 of 19Polymers 2016, 8, 51 6 of 18
Figure 4. Steady state viscosity as a function of the shear rate for different CDNA at 20 °C in TE buffer.
Reduced viscosities were calculated according Equation (1) using the zero shear-rate viscosity from the Newtonian plateau. It was plotted as a function of DNA concentration (CDNA) following the Huggins relation (Figure 5):
ηred = ηsp/C = [η] + k’ [η]2 C (1)
where ηred is the reduced viscosity, ηsp is the specific viscosity (equals to (η − ηs)/ηs with ηs the solvent viscosity), C is the polymer concentration in g/mL, [η] is the intrinsic viscosity in mL/g, and k’ is the Huggins constant.
Figure 5. Reduced viscosity, ηred, dependence with CDNA at a temperature of 20 °C. The solid line represents only a visual aid.
A deviation from the linear behavior corresponding to the dilute regime is clearly observed at the concentration of 0.23 mg/mL. This concentration could be related to the overlap concentration of the system, C*. The extrapolation to zero concentration gives the intrinsic viscosity, i.e., 4080 mL/g. The viscometric-average molecular weight of the DNA sample can be estimated using the following Mark-Houwink relation (Equation (2)) established by Tsortos et al. for a DNA molecular weight range between 2 × 10⁶ and 1.3 × 10⁸ [49]:
[η] = 6.9 × 10⁻² M0.70 (2)
Therefore, the calculated viscometric-average molecular weight for this DNA sample is equal to 6,559,500, which is in the average range of the few reported values for calf-thymus DNA, i.e., between 6,000,000 and 8,000,000 (ultrahigh molecular weight range) [50–52]. An interesting example was given by Porsch et al. [50] reporting weight–average molecular weight (Mw) for calf-thymus DNA equal to 8,418,000, obtained by size-exclusion chromatography with dual low-angle light scattering/ refractometric detection and with an intrinsic viscosity corresponding to [η] = 4850 mL/g.
Figure 4. Steady state viscosity as a function of the shear rate for different CDNA at 20 ˝C in TE buffer.
Reduced viscosities were calculated according Equation (1) using the zero shear-rate viscosityfrom the Newtonian plateau. It was plotted as a function of DNA concentration (CDNA) following theHuggins relation (Figure 5):
ηred “ ηsp{C “ rηs ` k1 rηs2 C (1)
where ηred is the reduced viscosity, ηsp is the specific viscosity (equals to (η´ ηs)/ηs with ηs the solventviscosity), C is the polymer concentration in g/mL, [η] is the intrinsic viscosity in mL/g, and k’ is theHuggins constant.
Polymers 2016, 8, 51 6 of 18
Figure 4. Steady state viscosity as a function of the shear rate for different CDNA at 20 °C in TE buffer.
Reduced viscosities were calculated according Equation (1) using the zero shear-rate viscosity from the Newtonian plateau. It was plotted as a function of DNA concentration (CDNA) following the Huggins relation (Figure 5):
ηred = ηsp/C = [η] + k’ [η]2 C (1)
where ηred is the reduced viscosity, ηsp is the specific viscosity (equals to (η − ηs)/ηs with ηs the solvent viscosity), C is the polymer concentration in g/mL, [η] is the intrinsic viscosity in mL/g, and k’ is the Huggins constant.
Figure 5. Reduced viscosity, ηred, dependence with CDNA at a temperature of 20 °C. The solid line represents only a visual aid.
A deviation from the linear behavior corresponding to the dilute regime is clearly observed at the concentration of 0.23 mg/mL. This concentration could be related to the overlap concentration of the system, C*. The extrapolation to zero concentration gives the intrinsic viscosity, i.e., 4080 mL/g. The viscometric-average molecular weight of the DNA sample can be estimated using the following Mark-Houwink relation (Equation (2)) established by Tsortos et al. for a DNA molecular weight range between 2 × 10⁶ and 1.3 × 10⁸ [49]:
[η] = 6.9 × 10⁻² M0.70 (2)
Therefore, the calculated viscometric-average molecular weight for this DNA sample is equal to 6,559,500, which is in the average range of the few reported values for calf-thymus DNA, i.e., between 6,000,000 and 8,000,000 (ultrahigh molecular weight range) [50–52]. An interesting example was given by Porsch et al. [50] reporting weight–average molecular weight (Mw) for calf-thymus DNA equal to 8,418,000, obtained by size-exclusion chromatography with dual low-angle light scattering/ refractometric detection and with an intrinsic viscosity corresponding to [η] = 4850 mL/g.
Figure 5. Reduced viscosity, ηred, dependence with CDNA at a temperature of 20 ˝C. The solid linerepresents only a visual aid.
A deviation from the linear behavior corresponding to the dilute regime is clearly observed atthe concentration of 0.23 mg/mL. This concentration could be related to the overlap concentration ofthe system, C*. The extrapolation to zero concentration gives the intrinsic viscosity, i.e., 4080 mL/g.The viscometric-average molecular weight of the DNA sample can be estimated using the followingMark-Houwink relation (Equation (2)) established by Tsortos et al. for a DNA molecular weight rangebetween 2 ˆ 106 and 1.3 ˆ 108 [49]:
rηs “ 6.9ˆ 10´2 M0.70 (2)
Therefore, the calculated viscometric-average molecular weight for this DNA sample is equalto 6,559,500, which is in the average range of the few reported values for calf-thymus DNA, i.e.,between 6,000,000 and 8,000,000 (ultrahigh molecular weight range) [50–52]. An interesting examplewas given by Porsch et al. [50] reporting weight–average molecular weight (Mw) for calf-thymus

Polymers 2016, 8, 51 7 of 19
DNA equal to 8,418,000, obtained by size-exclusion chromatography with dual low-angle lightscattering/refractometric detection and with an intrinsic viscosity corresponding to [η] = 4850 mL/g.
Concerning the influence of the polymer concentration, Graessley [41] discussed the variationof the chain dimension R (with R2, the chain mean-square end-to-end distance) in a good solventwhen polymer concentration increases. At concentrations lower than C*, R2(C) is independent of C,corresponding to the dilute regime. The overlap concentration is not precisely defined, but it wasproposed to correspond to a concentration at which the average spacing between two chains is 2S (0),where S (0) is the radius of gyration of the chain at zero concentration. The radius of gyration and[η] are then two useful characteristics of polymers in dilute solution. The overlap concentration canbe estimated as a first approach by using the relation C*~[η]´1. In this manner, the calculated valuefor C* is equal to 0.245 mg/mL, which corresponds to the observed deviation point from the lineardependence of the reduced viscosity with DNA concentration as mentioned before (Figure 5). The firstestimation of the radius of gyration may be calculated using C* according to Equation (3) [53]:
C˚ “ rp4{3π ă S2 ą 3/2NAq{Ms´1 (3)
where NA is Avogadro’s number.Considering the molecular weight determined by viscosity and Equation (3), an average radius
of gyration, <S2>1/2, equal to 237 nm, is obtained in TE buffer. Then, an approximated valueof the persistence length in θ-conditions is calculated for this high molecular weight using thefollowing relation:
ă S2 ą 1/2 “ pL ˚ lpq{3 (4)
in which L is the contour length of the chain and lp is the intrinsic persistence length found equal to50 nm. This result is in good agreement with the lp value usually reported in the literature [22,28].
It is worth mentioning that the entanglements in the semi-dilute regime make the system morecomplicated and lead to viscoelastic properties that need to be studied by dynamic measurements oranalyzed from the effect of shear rate on the viscosity [53].
3.3. Rheological Properties of Calf-Thymus DNA
In order to describe the effects of DNA concentration on viscosity and to define the limits betweenthe semi-dilute unentangled and entangled regimes for DNA/buffer solutions, flow and dynamicmeasurements were carried out in a large range of polymer concentrations. Both series of experimentswere performed in TE buffer 9:1 solution at the temperatures of 10, 20, 30, and 40 ˝C.
3.3.1. Steady Shear Viscometry
In the case of Newtonian fluids, the viscosity usually depends on temperature; however, forpolymeric fluids as DNA solutions, the viscosity becomes non Newtonian and depends strongly onshear rate for high MW, on polymer concentration and on the molecular conformation (single strandor double helix). The influence of shear rate on the viscosity of DNA samples was studied in a rangeof concentration covering mainly the semi-dilute regime to complete the data given in Figure 4. Thestudies were performed at different temperatures: 10, 20, 30, and 40 ˝C. These experimental conditionspreserve the double helical conformation, as shown from absorbance measurements.
Data obtained at a temperature of 20 ˝C are presented in Figure 6. The observed flow curves arecharacterized by having three important parameters: the viscosity in the Newtonian plateau at lowshear rate, η0, the critical shear rate,
.γc, and the slope, s [53–55].

Polymers 2016, 8, 51 8 of 19Polymers 2016, 8, 51 8 of 18
Figure 6. Influence of shear rate on the viscosity of calf-thymus DNA at different DNA concentrations at a temperature of 20 °C in TE buffer.
Figure 7 shows the dependence of the specific viscosity (to take into account the viscosity of the solvent itself) on shear rate for a constant DNA concentration at the different temperatures studied, i.e., 10, 20, 30, and 40 °C. A very small influence of temperature on the specific viscosity of DNA solutions is observed in the studied temperature range, i.e., low influence on the hydrodynamic volume of DNA (reflected by the intrinsic viscosity).
Figure 7. Influence of shear rate on the specific viscosity of calf-thymus DNA at a concentration of 7 mg/mL at the temperatures of 10, 20, 30, and 40 °C.
All the data obtained for the specific viscosity determined in the Newtonian plateau are plotted in Figure 8, in which all the points follow a single curve with a final slope equal to 4.3 at high DNA concentrations. In order to analyze the viscosity variation as a function of polymer concentration and temperature, all experimental values are treated in terms of a master curve. Equation (5) was first used for hyaluronans with various molecular weights [53], from which it was possible to predict any viscosity of polymer solution by replacing C[η] in the following expression:
ηsp = C[η] + k’ (C[η])2 + B (C[η])n (5)
where k’ corresponds to the Huggins constant and the values B and n are equal to 7.77 × 10⁻³ and 4.18, respectively. Additionally, a new representation was proposed by Kwei et al. [56] (Equation (6)) for the same hyaluronan samples [53,57]:
ηsp = C[η] [1 + k1 (C[η]) + k2 (C[η])2 + k3 (C[η])3] (6)
where the constants k1, k2, and k3 can be calculated as follows: k1 = 0.4; k2 = (k1)2/2! = 0.08; k3 = (k1)3/3! = 7.1 × 10⁻³.
Figure 6. Influence of shear rate on the viscosity of calf-thymus DNA at different DNA concentrationsat a temperature of 20 ˝C in TE buffer.
Figure 7 shows the dependence of the specific viscosity (to take into account the viscosity of thesolvent itself) on shear rate for a constant DNA concentration at the different temperatures studied, i.e.,10, 20, 30, and 40 ˝C. A very small influence of temperature on the specific viscosity of DNA solutionsis observed in the studied temperature range, i.e., low influence on the hydrodynamic volume of DNA(reflected by the intrinsic viscosity).
Polymers 2016, 8, 51 8 of 18
Figure 6. Influence of shear rate on the viscosity of calf-thymus DNA at different DNA concentrations at a temperature of 20 °C in TE buffer.
Figure 7 shows the dependence of the specific viscosity (to take into account the viscosity of the solvent itself) on shear rate for a constant DNA concentration at the different temperatures studied, i.e., 10, 20, 30, and 40 °C. A very small influence of temperature on the specific viscosity of DNA solutions is observed in the studied temperature range, i.e., low influence on the hydrodynamic volume of DNA (reflected by the intrinsic viscosity).
Figure 7. Influence of shear rate on the specific viscosity of calf-thymus DNA at a concentration of 7 mg/mL at the temperatures of 10, 20, 30, and 40 °C.
All the data obtained for the specific viscosity determined in the Newtonian plateau are plotted in Figure 8, in which all the points follow a single curve with a final slope equal to 4.3 at high DNA concentrations. In order to analyze the viscosity variation as a function of polymer concentration and temperature, all experimental values are treated in terms of a master curve. Equation (5) was first used for hyaluronans with various molecular weights [53], from which it was possible to predict any viscosity of polymer solution by replacing C[η] in the following expression:
ηsp = C[η] + k’ (C[η])2 + B (C[η])n (5)
where k’ corresponds to the Huggins constant and the values B and n are equal to 7.77 × 10⁻³ and 4.18, respectively. Additionally, a new representation was proposed by Kwei et al. [56] (Equation (6)) for the same hyaluronan samples [53,57]:
ηsp = C[η] [1 + k1 (C[η]) + k2 (C[η])2 + k3 (C[η])3] (6)
where the constants k1, k2, and k3 can be calculated as follows: k1 = 0.4; k2 = (k1)2/2! = 0.08; k3 = (k1)3/3! = 7.1 × 10⁻³.
Figure 7. Influence of shear rate on the specific viscosity of calf-thymus DNA at a concentration of7 mg/mL at the temperatures of 10, 20, 30, and 40 ˝C.
All the data obtained for the specific viscosity determined in the Newtonian plateau are plottedin Figure 8, in which all the points follow a single curve with a final slope equal to 4.3 at high DNAconcentrations. In order to analyze the viscosity variation as a function of polymer concentration andtemperature, all experimental values are treated in terms of a master curve. Equation (5) was firstused for hyaluronans with various molecular weights [53], from which it was possible to predict anyviscosity of polymer solution by replacing C[η] in the following expression:
ηsp “ Crηs ` k1 pCrηsq2 ` B pCrηsqn (5)
where k’ corresponds to the Huggins constant and the values B and n are equal to 7.77 ˆ 10´3 and4.18, respectively. Additionally, a new representation was proposed by Kwei et al. [56] (Equation (6))for the same hyaluronan samples [53,57]:
ηsp “ Crηs r1 ` k1 pCrηsq ` k2 pCrηsq2 ` k3 pCrηsq3s (6)

Polymers 2016, 8, 51 9 of 19
where the constants k1, k2, and k3 can be calculated as follows: k1 = 0.4; k2 = (k1)2/2! = 0.08;k3 = (k1)3/3! = 7.1 ˆ 10´3.Polymers 2016, 8, 51 9 of 18
Figure 8. Specific viscosity at zero shear rate as a function of CDNA at 10, 20, 30, and 40 °C.
This relation is successfully tested for calf-thymus DNA solutions in the concentration range between 0.01 and 10 mg/mL, using a Huggins constant (identified as k1) of 0.4, as found for perfectly soluble polymers (Figure 9). To be able to compare all the results obtained with DNA, but also to compare with other polymers, the majority of the plots are expressed as a function of the overlap parameter CDNA[η]. In Figure 9, the specific viscosity at zero shear rate is plotted in a log–log representation as a function of CDNA[η].
Figure 9. Specific viscosity at zero shear rate as a function of the overlap parameter C[η] for calf-thymus DNA solutions in TE buffer pH 7.3 at different CDNA and temperatures (The dashed line represents the master curve expressed by relation 6).
The advantage of this simple representation is to be able to calculate ηsp at zero shear rate for any polymeric solution at a given polymer concentration when the intrinsic viscosity is known. A strong deviation from this master curve usually indicates the existence of large aggregates as demonstrated for galactomannan [58]. It is worth mentioning that the value of the intrinsic viscosity determined at 20 °C was adopted for all the temperatures, taking into account that: (1) DNA double helical conformation was identified in the same buffer conditions as used for rheological study, and (2) the specific viscosity is independent of temperature in the range covered (10 to 40 °C) at low polymer concentration (for better sensitivity as shown in Figure 10). The slight influence of temperature on the specific viscosity is attributed to the semi rigid character of DNA. This insignificant role of temperature has been mentioned previously in literature [59].
Figure 8. Specific viscosity at zero shear rate as a function of CDNA at 10, 20, 30, and 40 ˝C.
This relation is successfully tested for calf-thymus DNA solutions in the concentration rangebetween 0.01 and 10 mg/mL, using a Huggins constant (identified as k1) of 0.4, as found for perfectlysoluble polymers (Figure 9). To be able to compare all the results obtained with DNA, but also tocompare with other polymers, the majority of the plots are expressed as a function of the overlapparameter CDNA[η]. In Figure 9, the specific viscosity at zero shear rate is plotted in a log–logrepresentation as a function of CDNA[η].
Polymers 2016, 8, 51 9 of 18
Figure 8. Specific viscosity at zero shear rate as a function of CDNA at 10, 20, 30, and 40 °C.
This relation is successfully tested for calf-thymus DNA solutions in the concentration range between 0.01 and 10 mg/mL, using a Huggins constant (identified as k1) of 0.4, as found for perfectly soluble polymers (Figure 9). To be able to compare all the results obtained with DNA, but also to compare with other polymers, the majority of the plots are expressed as a function of the overlap parameter CDNA[η]. In Figure 9, the specific viscosity at zero shear rate is plotted in a log–log representation as a function of CDNA[η].
Figure 9. Specific viscosity at zero shear rate as a function of the overlap parameter C[η] for calf-thymus DNA solutions in TE buffer pH 7.3 at different CDNA and temperatures (The dashed line represents the master curve expressed by relation 6).
The advantage of this simple representation is to be able to calculate ηsp at zero shear rate for any polymeric solution at a given polymer concentration when the intrinsic viscosity is known. A strong deviation from this master curve usually indicates the existence of large aggregates as demonstrated for galactomannan [58]. It is worth mentioning that the value of the intrinsic viscosity determined at 20 °C was adopted for all the temperatures, taking into account that: (1) DNA double helical conformation was identified in the same buffer conditions as used for rheological study, and (2) the specific viscosity is independent of temperature in the range covered (10 to 40 °C) at low polymer concentration (for better sensitivity as shown in Figure 10). The slight influence of temperature on the specific viscosity is attributed to the semi rigid character of DNA. This insignificant role of temperature has been mentioned previously in literature [59].
Figure 9. Specific viscosity at zero shear rate as a function of the overlap parameter C[η] for calf-thymusDNA solutions in TE buffer pH 7.3 at different CDNA and temperatures (The dashed line represents themaster curve expressed by relation 6).
The advantage of this simple representation is to be able to calculate ηsp at zero shear rate for anypolymeric solution at a given polymer concentration when the intrinsic viscosity is known. A strongdeviation from this master curve usually indicates the existence of large aggregates as demonstratedfor galactomannan [58]. It is worth mentioning that the value of the intrinsic viscosity determinedat 20 ˝C was adopted for all the temperatures, taking into account that: (1) DNA double helicalconformation was identified in the same buffer conditions as used for rheological study, and (2) thespecific viscosity is independent of temperature in the range covered (10 to 40 ˝C) at low polymerconcentration (for better sensitivity as shown in Figure 10). The slight influence of temperature on thespecific viscosity is attributed to the semi rigid character of DNA. This insignificant role of temperaturehas been mentioned previously in literature [59].

Polymers 2016, 8, 51 10 of 19Polymers 2016, 8, 51 10 of 18
Figure 10. Dependence of the specific viscosity ηsp, obtained from the shear viscosity at zero shear rate, for a DNA concentration of 0.2 mg/mL in NaCl 1 × 10⁻² M, on shear rate at the different temperatures studied, i.e., 20, 30 and 40 °C.
In addition, the influence of ionic concentration may be considered as playing a role on viscosity when DNA concentration increases. It corresponds to an increase of the total ionic concentration in the solution modifying the electroviscous contribution.
An example of the role of ionic contribution of DNA on the electrostatic repulsions should be estimated in TE buffer: at 1 mg/mL, the Debye length κ−1 ≈ 2.95 nm and for 10 mg/mL it comes that κ−1 ≈ 2.7 nm indicating a relatively small influence of the DNA concentration itself. The influence of ionic concentration is evidenced by the viscosity data obtained for one polymer concentration as a function of the shear rate at different concentrations in NaCl as shown in Figure 11a. As usually demonstrated for polyelectrolytes, viscosity at zero shear rate decreases sharply at low ionic concentration. Then, it levels up over 10−2 M NaCl (ionic concentration similar to TE buffer) as shown in Figure 11b. At NaCl concentrations higher than 1 × 10⁻² M, long-range interchain electrostatic interactions between DNA chains in solution are screened and only a small variation of the hydrodynamic volume occurs due to intrachain electrostatic repulsions as usually for semi-rigid polymers.
Figure 11. (a) Dependence of relative viscosity with the shear rate for a 0.2 mg/L DNA solution in NaCl as solvent at different ionic concentrations. Temperature: 20 °C; (b) Dependence of relative viscosity with [NaCl] for a 0.2 mg/mL DNA solution at a temperature of 20 °C.
Taking into account the insignificant influence of temperature and ionic contribution of DNA on its hydrodynamic volume, Figure 9 allows predicting the viscosity for different concentrations and molecular weights of different polymers, as shown by Berriaud et al. [60], Milas et al. [61], and Fouissac et al. [31] for hyaluronans. At low polymer concentration (C[η] ≤ 1) the Huggins relation (Equation (1)) applies, as also recalled by Raspaud et al. [29]. These authors found a scaling exponent relating viscosity to hydrodynamic volume (or concentration) equal to 1.3, in agreement with the
Figure 10. Dependence of the specific viscosity ηsp, obtained from the shear viscosity at zero shear rate,for a DNA concentration of 0.2 mg/mL in NaCl 1 ˆ 10´2 M, on shear rate at the different temperaturesstudied, i.e., 20, 30 and 40 ˝C.
In addition, the influence of ionic concentration may be considered as playing a role on viscositywhen DNA concentration increases. It corresponds to an increase of the total ionic concentration in thesolution modifying the electroviscous contribution.
An example of the role of ionic contribution of DNA on the electrostatic repulsions shouldbe estimated in TE buffer: at 1 mg/mL, the Debye length κ´1 « 2.95 nm and for 10 mg/mL itcomes that κ´1 « 2.7 nm indicating a relatively small influence of the DNA concentration itself.The influence of ionic concentration is evidenced by the viscosity data obtained for one polymerconcentration as a function of the shear rate at different concentrations in NaCl as shown inFigure 11a. As usually demonstrated for polyelectrolytes, viscosity at zero shear rate decreasessharply at low ionic concentration. Then, it levels up over 10´2 M NaCl (ionic concentration similarto TE buffer) as shown in Figure 11b. At NaCl concentrations higher than 1 ˆ 10´2 M, long-rangeinterchain electrostatic interactions between DNA chains in solution are screened and only a smallvariation of the hydrodynamic volume occurs due to intrachain electrostatic repulsions as usually forsemi-rigid polymers.
Polymers 2016, 8, 51 10 of 18
Figure 10. Dependence of the specific viscosity ηsp, obtained from the shear viscosity at zero shear rate, for a DNA concentration of 0.2 mg/mL in NaCl 1 × 10⁻² M, on shear rate at the different temperatures studied, i.e., 20, 30 and 40 °C.
In addition, the influence of ionic concentration may be considered as playing a role on viscosity when DNA concentration increases. It corresponds to an increase of the total ionic concentration in the solution modifying the electroviscous contribution.
An example of the role of ionic contribution of DNA on the electrostatic repulsions should be estimated in TE buffer: at 1 mg/mL, the Debye length κ−1 ≈ 2.95 nm and for 10 mg/mL it comes that κ−1 ≈ 2.7 nm indicating a relatively small influence of the DNA concentration itself. The influence of ionic concentration is evidenced by the viscosity data obtained for one polymer concentration as a function of the shear rate at different concentrations in NaCl as shown in Figure 11a. As usually demonstrated for polyelectrolytes, viscosity at zero shear rate decreases sharply at low ionic concentration. Then, it levels up over 10−2 M NaCl (ionic concentration similar to TE buffer) as shown in Figure 11b. At NaCl concentrations higher than 1 × 10⁻² M, long-range interchain electrostatic interactions between DNA chains in solution are screened and only a small variation of the hydrodynamic volume occurs due to intrachain electrostatic repulsions as usually for semi-rigid polymers.
Figure 11. (a) Dependence of relative viscosity with the shear rate for a 0.2 mg/L DNA solution in NaCl as solvent at different ionic concentrations. Temperature: 20 °C; (b) Dependence of relative viscosity with [NaCl] for a 0.2 mg/mL DNA solution at a temperature of 20 °C.
Taking into account the insignificant influence of temperature and ionic contribution of DNA on its hydrodynamic volume, Figure 9 allows predicting the viscosity for different concentrations and molecular weights of different polymers, as shown by Berriaud et al. [60], Milas et al. [61], and Fouissac et al. [31] for hyaluronans. At low polymer concentration (C[η] ≤ 1) the Huggins relation (Equation (1)) applies, as also recalled by Raspaud et al. [29]. These authors found a scaling exponent relating viscosity to hydrodynamic volume (or concentration) equal to 1.3, in agreement with the
Figure 11. (a) Dependence of relative viscosity with the shear rate for a 0.2 mg/L DNA solution inNaCl as solvent at different ionic concentrations. Temperature: 20 ˝C; (b) Dependence of relativeviscosity with [NaCl] for a 0.2 mg/mL DNA solution at a temperature of 20 ˝C.
Taking into account the insignificant influence of temperature and ionic contribution of DNAon its hydrodynamic volume, Figure 9 allows predicting the viscosity for different concentrations

Polymers 2016, 8, 51 11 of 19
and molecular weights of different polymers, as shown by Berriaud et al. [60], Milas et al. [61], andFouissac et al. [31] for hyaluronans. At low polymer concentration (C[η] ď 1) the Huggins relation(Equation (1)) applies, as also recalled by Raspaud et al. [29]. These authors found a scaling exponentrelating viscosity to hydrodynamic volume (or concentration) equal to 1.3, in agreement with theRouse model. Equation (6) in the dilute domain should give an average value of 1.2. Then, for thesemi-dilute unentangled regime, the viscosity data superpose with the development calculated byEquation (6) with a progressive increase of the slope.
For DNA at the highest concentrations, the concentration C** is obtained when the linear behaviorin this curve starts. Mason et al. also defined this concentration as the entanglement concentration,Ce [28]. For the linear domain, the calculated slope is 4.3 (ηsp~C4.3), which presents a slight deviationfrom the master curve having a maximum slope of 4 (Equation (6)). This kind of deviation was alsodetected for the reported experimental values for hyaluronan in 0.1 N NaCl (with a slope of 4.18) andxanthan in 0.1 N NaCl (with a slope of 4.24) [30]. The limit for linear behavior in this curve is aroundC[η]~10, the starting point of semi-diluted entangled domain, i.e., 2.45 mg/mL for DNA. The obtainedbehavior in the DNA concentration range 2.0 < CDNA < 10 mg/mL was found to be consistent withprevious results reported by Mason et al. obtained at 25 ˝C [28]. The width of the semi-dilute domain(unentangled and entangled) is such as Ce~10 C*, as mentioned in the literature [42,62].
The slope in the semi-dilute entangled regime deviates from the master curve representationfitting very well in the lower polymer concentration domains. In fact, this may be connected withthe reptation regime admitted over C** (or Ce) for which η/ηRouse varies as (C/Ce)3.4 [29,32]. In theseconditions, it comes that η varies as (C/Ce)4.42. This power law is in good agreement with our datawhere the slope is 4.3.
Considering the transition between Newtonian and non-Newtonian regimes in flow experiments(critical shear rate), Figure 12 is a log-log plot of
.γc versus CDNA[η] for DNA concentrations in the
semi-dilute regime at different temperatures. Due to lack of sensitivity, only the semi-dilute domainis covered from 2 mg/mL up to 10 mg/mL. As a small influence of the temperature on the criticalshear rate values is found, a single curve is obtained in which all concentrations and temperatures areplotted. When the shear rate increases, the viscosity decrease was attributed to structural changes inthe solution such as disentanglements, alignments of the molecules in the flow, or to conformationalmodifications of the molecules among others. With this curve it is possible to obtain the relation.γc~CDNA[η]´2.0˘0.1, also reported for different molecular weight hyaluronans [61]. This exponent isin agreement with the scaling parameter (9/4) corresponding to the longest relaxation time for anentanglement strand in the Rouse theory as mentioned by Colby et al. [42]. The calculated values forthe critical shear rate with the Rouse model are in good agreement with the experimental values butonly for higher concentration (CDNA ě 7 mg/mL). The scaling law relates the temperature influenceon viscosity with an exponent of 7/12 in a good solvent; it is smaller (considerably low) in our case,probably due to the semi-rigid character of DNA [42].

Polymers 2016, 8, 51 12 of 19
Polymers 2016, 8, 51 11 of 18
Rouse model. Equation (6) in the dilute domain should give an average value of 1.2. Then, for the semi-dilute unentangled regime, the viscosity data superpose with the development calculated by Equation (6) with a progressive increase of the slope.
For DNA at the highest concentrations, the concentration C** is obtained when the linear behavior in this curve starts. Mason et al. also defined this concentration as the entanglement concentration, Ce [28]. For the linear domain, the calculated slope is 4.3 (ηsp~C4.3), which presents a slight deviation from the master curve having a maximum slope of 4 (Equation (6)). This kind of deviation was also detected for the reported experimental values for hyaluronan in 0.1 N NaCl (with a slope of 4.18) and xanthan in 0.1 N NaCl (with a slope of 4.24) [30]. The limit for linear behavior in this curve is around C[η]~10, the starting point of semi-diluted entangled domain, i.e., 2.45 mg/mL for DNA. The obtained behavior in the DNA concentration range 2.0 < CDNA < 10 mg/mL was found to be consistent with previous results reported by Mason et al. obtained at 25 °C [28]. The width of the semi-dilute domain (unentangled and entangled) is such as Ce~10 C*, as mentioned in the literature [42,62].
The slope in the semi-dilute entangled regime deviates from the master curve representation fitting very well in the lower polymer concentration domains. In fact, this may be connected with the reptation regime admitted over C** (or Ce) for which η/ηRouse varies as (C/Ce)3.4 [29,32]. In these conditions, it comes that η varies as (C/Ce)4.42. This power law is in good agreement with our data where the slope is 4.3.
Considering the transition between Newtonian and non-Newtonian regimes in flow experiments (critical shear rate), Figure 12 is a log-log plot of c versus CDNA[η] for DNA concentrations in the semi-dilute regime at different temperatures. Due to lack of sensitivity, only the semi-dilute domain is covered from 2 mg/mL up to 10mg/mL. As a small influence of the temperature on the critical shear rate values is found, a single curve is obtained in which all concentrations and temperatures are plotted. When the shear rate increases, the viscosity decrease was attributed to structural changes in the solution such as disentanglements, alignments of the molecules in the flow, or to conformational modifications of the molecules among others. With this curve it is possible to obtain the relation
c~CDNA[η]−2.0 ± 0.1, also reported for different molecular weight hyaluronans [61]. This exponent is in agreement with the scaling parameter (9/4) corresponding to the longest relaxation time for an entanglement strand in the Rouse theory as mentioned by Colby et al. [42]. The calculated values for the critical shear rate with the Rouse model are in good agreement with the experimental values but only for higher concentration (CDNA ≥ 7 mg/mL). The scaling law relates the temperature influence on viscosity with an exponent of 7/12 in a good solvent; it is smaller (considerably low) in our case, probably due to the semi-rigid character of DNA [42].
Figure 12. Dependence of the critical shear rate, of the onset of the Non-Newtonian viscosity, with CDNA[η] as a function of polymer concentration and for the temperatures 10, 20, and 30 °C. The values obtained by Cox-Merz analysis, discussed later, are also represented.
Finally, considering the dependence of viscosity on shear rate, the slope s from the power law region of η ( ) as a function of the shear rate was determined at each temperature for each DNA
Figure 12. Dependence of the critical shear rate, of the onset of the Non-Newtonian viscosity, withCDNA[η] as a function of polymer concentration and for the temperatures 10, 20, and 30 ˝C. The valuesobtained by Cox-Merz analysis, discussed later, are also represented.
Finally, considering the dependence of viscosity on shear rate, the slope s from the power lawregion of η (
.γ) as a function of the shear rate was determined at each temperature for each DNA
concentration over C*. The obtained results from flow measurements are presented in Figure 13 interms of –s as a function of CDNA[η]. The value of –s increases and goes to the limit value around´0.82 for a CDNA[η] > 35. This limit value agrees with that predicted by Graessley in the entangledregime [63]. The same behavior has also been reported for a wide range of molecular weight hyaluronansamples [60,61] and for xanthan solutions [30].
Polymers 2016, 8, 51 12 of 18
concentration over C*. The obtained results from flow measurements are presented in Figure 13 in terms of –s as a function of CDNA[η]. The value of –s increases and goes to the limit value around −0.82 for a CDNA[η] > 35. This limit value agrees with that predicted by Graessley in the entangled regime [63]. The same behavior has also been reported for a wide range of molecular weight hyaluronan samples [60,61] and for xanthan solutions [30].
Figure 13. Slope −s in the power law region determined on flow curves of calf-thymus DNA in TE buffer at the temperatures of 10, 20, 30, and 40 °C. The values obtained by Cox Merz analysis are also represented. (Dashed line represents the limit proposed by Graessley [63]).
3.3.2. Dynamic Rheometry
By fixing γ = 0.02, inside the linear regime, the spectra for the storage and the loss moduli in the same range of DNA concentrations at the four temperatures were measured subsequently. Figures 14a,b show the dependence of G’ and G’’ with frequency for DNA concentration ranging between 2.0 and 10.0 mg/mL at the temperature of 10 °C and for the DNA concentration 7.0 mg/mL at the temperatures of 10, 20, 30, and 40 °C, respectively. The loss and storage moduli cross at a characteristic frequency (ωC) and a modulus value G’ = G’’ = Gc. The reciprocal of ωC corresponds to the longest relaxation time of the system, τc. This crossover frequency (ωC) decreases with increasing DNA concentration and temperature. For solutions at which CDNA ≤ 0.5 mg/mL, the rheological behavior is predominantly viscous at all frequencies (not shown in this figure); however, an elastic behavior is observed at higher DNA concentrations, when the chains start to be entangled.
Figure 14. Frequency dependence of the storage (G’) and the loss modulus (G’’) for (a) different CDNA in TE buffer at 10 °C and for (b) a CDNA of 7 mg/mL in TE buffer at 10, 20, 30, and 40 °C.
Figure 13. Slope ´s in the power law region determined on flow curves of calf-thymus DNA in TEbuffer at the temperatures of 10, 20, 30, and 40 ˝C. The values obtained by Cox Merz analysis are alsorepresented. (Dashed line represents the limit proposed by Graessley [63]).
3.3.2. Dynamic Rheometry
By fixing γ = 0.02, inside the linear regime, the spectra for the storage and the loss moduli in thesame range of DNA concentrations at the four temperatures were measured subsequently. Figure 14a,bshow the dependence of G’ and G” with frequency for DNA concentration ranging between 2.0 and10.0 mg/mL at the temperature of 10 ˝C and for the DNA concentration 7.0 mg/mL at the temperaturesof 10, 20, 30, and 40 ˝C, respectively. The loss and storage moduli cross at a characteristic frequency(ωC) and a modulus value G’ = G” = Gc. The reciprocal ofωC corresponds to the longest relaxation timeof the system, τc. This crossover frequency (ωC) decreases with increasing DNA concentration andtemperature. For solutions at which CDNA ď 0.5 mg/mL, the rheological behavior is predominantlyviscous at all frequencies (not shown in this figure); however, an elastic behavior is observed at higherDNA concentrations, when the chains start to be entangled.

Polymers 2016, 8, 51 13 of 19
Polymers 2016, 8, 51 12 of 18
concentration over C*. The obtained results from flow measurements are presented in Figure 13 in terms of –s as a function of CDNA[η]. The value of –s increases and goes to the limit value around −0.82 for a CDNA[η] > 35. This limit value agrees with that predicted by Graessley in the entangled regime [63]. The same behavior has also been reported for a wide range of molecular weight hyaluronan samples [60,61] and for xanthan solutions [30].
Figure 13. Slope −s in the power law region determined on flow curves of calf-thymus DNA in TE buffer at the temperatures of 10, 20, 30, and 40 °C. The values obtained by Cox Merz analysis are also represented. (Dashed line represents the limit proposed by Graessley [63]).
3.3.2. Dynamic Rheometry
By fixing γ = 0.02, inside the linear regime, the spectra for the storage and the loss moduli in the same range of DNA concentrations at the four temperatures were measured subsequently. Figures 14a,b show the dependence of G’ and G’’ with frequency for DNA concentration ranging between 2.0 and 10.0 mg/mL at the temperature of 10 °C and for the DNA concentration 7.0 mg/mL at the temperatures of 10, 20, 30, and 40 °C, respectively. The loss and storage moduli cross at a characteristic frequency (ωC) and a modulus value G’ = G’’ = Gc. The reciprocal of ωC corresponds to the longest relaxation time of the system, τc. This crossover frequency (ωC) decreases with increasing DNA concentration and temperature. For solutions at which CDNA ≤ 0.5 mg/mL, the rheological behavior is predominantly viscous at all frequencies (not shown in this figure); however, an elastic behavior is observed at higher DNA concentrations, when the chains start to be entangled.
Figure 14. Frequency dependence of the storage (G’) and the loss modulus (G’’) for (a) different CDNA in TE buffer at 10 °C and for (b) a CDNA of 7 mg/mL in TE buffer at 10, 20, 30, and 40 °C.
Figure 14. Frequency dependence of the storage (G’) and the loss modulus (G”) for (a) different CDNA
in TE buffer at 10 ˝C and for (b) a CDNA of 7 mg/mL in TE buffer at 10, 20, 30, and 40 ˝C.
3.3.3. Rheological Behavior Analysis
From dynamic measurements, taking G’(ω) and G”(ω) at a given DNA concentration as referenceit is possible to obtain a master curve as a function of DNA concentration from horizontal (ax) andvertical (ay) translations. First one represents the coefficient of translation of the frequencies andsecond one the coefficient of translation of the G moduli. Figure 15a shows the master curve obtainedfor DNA concentration ranging between 1.5 and 10 mg/mL at the temperature of 20 ˝C, by usingpolymer concentration C = 4 mg/mL as reference. The same procedure is used for the analysis of thetemperature for each DNA concentration. Figure 15 b shows the master curve for a constant DNAconcentration at temperatures 10, 20, 30, and 40 ˝C, using the temperature of 20 ˝C as reference. Finally,all moduli for DNA concentrations in the concentration range between 1.5 and 30 mg/mL and inthe temperature range between 10 and 40 ˝C collapse in a general dynamic master curve using thefrequencies (ax) and the moduli (ay) shifts (Available in Supplementary Material).
Polymers 2016, 8, 51 13 of 18
3.3.3. Rheological Behavior Analysis
From dynamic measurements, taking G’(ω) and G’’(ω) at a given DNA concentration as reference it is possible to obtain a master curve as a function of DNA concentration from horizontal (ax) and vertical (ay) translations. First one represents the coefficient of translation of the frequencies and second one the coefficient of translation of the G moduli. Figure 15a shows the master curve obtained for DNA concentration ranging between 1.5 and 10 mg/mL at the temperature of 20 °C, by using polymer concentration C = 4 mg/mL as reference. The same procedure is used for the analysis of the temperature for each DNA concentration. Figure 15 b shows the master curve for a constant DNA concentration at temperatures 10, 20, 30, and 40 °C, using the temperature of 20 °C as reference. Finally, all moduli for DNA concentrations in the concentration range between 1.5 and 30 mg/mL and in the temperature range between 10 and 40 °C collapse in a general dynamic master curve using the frequencies (ax) and the moduli (ay) shifts (Available in Supplementary Material).
Figure 15. Master curves for the reduced elastic (G’) and viscous (G’’) moduli as a function of the reduced frequency for (a) the concentration variation of calf-thymus DNA in TE buffer at a temperature of 20 °C and for (b) DNA concentration of 4 mg/mL in TE buffer at the temperatures of 10, 20, 30, and 40 °C.
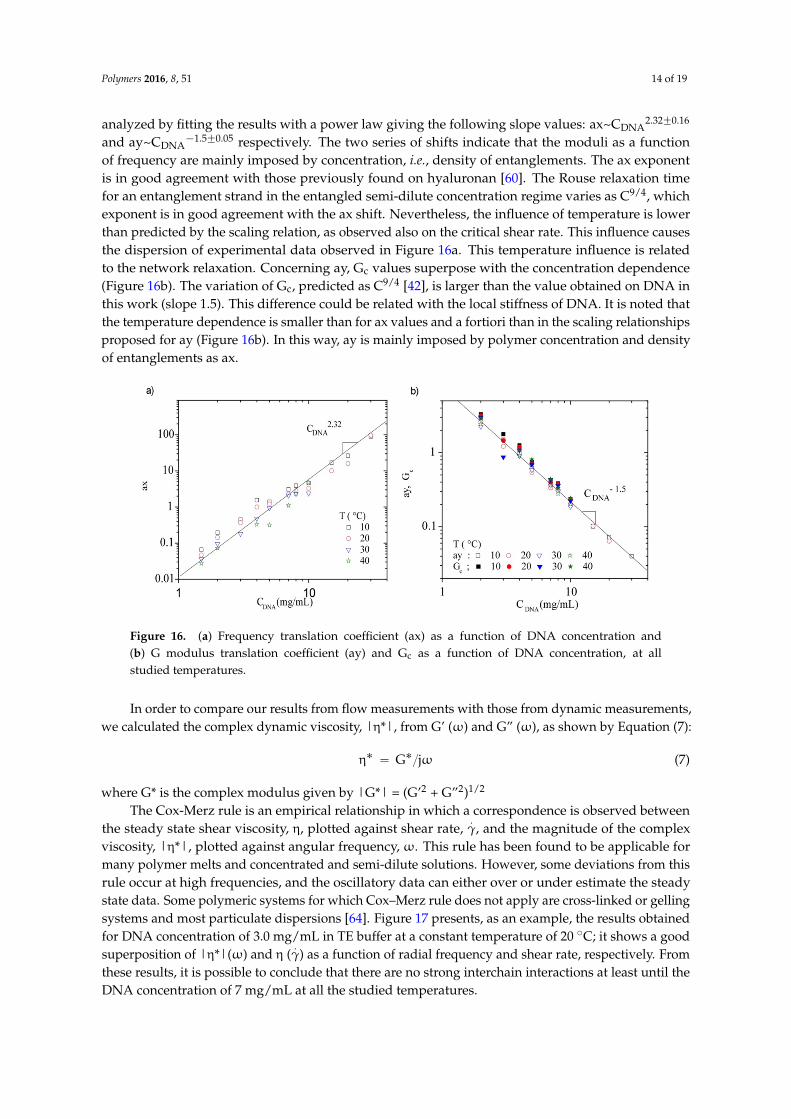
The frequencies (ax) and the moduli (ay) translation coefficients were plotted as a function of DNA concentration for all temperatures between 10 and 40 °C (Figures 16a,b). These curves were analyzed by fitting the results with a power law giving the following slope values: ax~CDNA2.32 ± 0.16 and ay~CDNA−1.5 ± 0.05 respectively. The two series of shifts indicate that the moduli as a function of frequency are mainly imposed by concentration, i.e., density of entanglements. The ax exponent is in good agreement with those previously found on hyaluronan [60]. The Rouse relaxation time for an entanglement strand in the entangled semi-dilute concentration regime varies as C9/4, which exponent is in good agreement with the ax shift. Nevertheless, the influence of temperature is lower than predicted by the scaling relation, as observed also on the critical shear rate. This influence causes the dispersion of experimental data observed in Figure 16a. This temperature influence is related to the network relaxation. Concerning ay, Gc values superpose with the concentration dependence (Figure 16b). The variation of Gc, predicted as C9/4 [42], is larger than the value obtained on DNA in this work (slope 1.5). This difference could be related with the local stiffness of DNA. It is noted that the temperature dependence is smaller than for ax values and a fortiori than in the scaling relationships proposed for ay (Figure 16b). In this way, ay is mainly imposed by polymer concentration and density of entanglements as ax.
Figure 15. Master curves for the reduced elastic (G’) and viscous (G”) moduli as a function of thereduced frequency for (a) the concentration variation of calf-thymus DNA in TE buffer at a temperatureof 20 ˝C and for (b) DNA concentration of 4 mg/mL in TE buffer at the temperatures of 10, 20, 30, and40 ˝C.
The frequencies (ax) and the moduli (ay) translation coefficients were plotted as a function ofDNA concentration for all temperatures between 10 and 40 ˝C (Figure 16a,b). These curves were
Polymers 2016, 8, 51 14 of 19
analyzed by fitting the results with a power law giving the following slope values: ax~CDNA2.32˘0.16
and ay~CDNA´1.5˘0.05 respectively. The two series of shifts indicate that the moduli as a function
of frequency are mainly imposed by concentration, i.e., density of entanglements. The ax exponentis in good agreement with those previously found on hyaluronan [60]. The Rouse relaxation timefor an entanglement strand in the entangled semi-dilute concentration regime varies as C9/4, whichexponent is in good agreement with the ax shift. Nevertheless, the influence of temperature is lowerthan predicted by the scaling relation, as observed also on the critical shear rate. This influence causesthe dispersion of experimental data observed in Figure 16a. This temperature influence is relatedto the network relaxation. Concerning ay, Gc values superpose with the concentration dependence(Figure 16b). The variation of Gc, predicted as C9/4 [42], is larger than the value obtained on DNA inthis work (slope 1.5). This difference could be related with the local stiffness of DNA. It is noted thatthe temperature dependence is smaller than for ax values and a fortiori than in the scaling relationshipsproposed for ay (Figure 16b). In this way, ay is mainly imposed by polymer concentration and densityof entanglements as ax.
Polymers 2016, 8, 51 14 of 18
Figure 16. (a) Frequency translation coefficient (ax) as a function of DNA concentration and (b) G modulus translation coefficient (ay) and Gc as a function of DNA concentration, at all studied temperatures.
In order to compare our results from flow measurements with those from dynamic measurements, we calculated the complex dynamic viscosity, |η*|, from G’ (ω) and G’’ (ω), as shown by Equation (7):
η* = G*/jω (7)
where G* is the complex modulus given by |G*| = (G’2 + G’’2)1/2 The Cox-Merz rule is an empirical relationship in which a correspondence is observed between
the steady state shear viscosity, η, plotted against shear rate, , and the magnitude of the complex viscosity, |η*|, plotted against angular frequency, ω. This rule has been found to be applicable for many polymer melts and concentrated and semi-dilute solutions. However, some deviations from this rule occur at high frequencies, and the oscillatory data can either over or under estimate the steady state data. Some polymeric systems for which Cox–Merz rule does not apply are cross-linked or gelling systems and most particulate dispersions [64]. Figure 17 presents, as an example, the results obtained for DNA concentration of 3.0 mg/mL in TE buffer at a constant temperature of 20 °C; it shows a good superposition of |η*|(ω) and η ( ) as a function of radial frequency and shear rate, respectively. From these results, it is possible to conclude that there are no strong interchain interactions at least until the DNA concentration of 7 mg/mL at all the studied temperatures.
Figure 17. |η*|(ω) and η ( ) as a function of shear rate and radial frequency for a DNA concentration of 3.0 mg/mL in TE buffer at a temperature of 20 °C.
Then, the characteristic parameters obtained for the slope s and for c were reported on Figures 12 and 13 respectively. A good agreement is obtained for the experimental values obtained by flow and dynamic measurements indicating that DNA is in good thermodynamic conditions at least up to 7 mg/mL.
Figure 16. (a) Frequency translation coefficient (ax) as a function of DNA concentration and(b) G modulus translation coefficient (ay) and Gc as a function of DNA concentration, at allstudied temperatures.
In order to compare our results from flow measurements with those from dynamic measurements,we calculated the complex dynamic viscosity, |η*|, from G’ (ω) and G” (ω), as shown by Equation (7):
η˚ “ G˚{jω (7)
where G* is the complex modulus given by |G*| = (G’2 + G”2)1/2
The Cox-Merz rule is an empirical relationship in which a correspondence is observed betweenthe steady state shear viscosity, η, plotted against shear rate,
.γ, and the magnitude of the complex
viscosity, |η*|, plotted against angular frequency, ω. This rule has been found to be applicable formany polymer melts and concentrated and semi-dilute solutions. However, some deviations from thisrule occur at high frequencies, and the oscillatory data can either over or under estimate the steadystate data. Some polymeric systems for which Cox–Merz rule does not apply are cross-linked or gellingsystems and most particulate dispersions [64]. Figure 17 presents, as an example, the results obtainedfor DNA concentration of 3.0 mg/mL in TE buffer at a constant temperature of 20 ˝C; it shows a goodsuperposition of |η*|(ω) and η (
.γ) as a function of radial frequency and shear rate, respectively. From
these results, it is possible to conclude that there are no strong interchain interactions at least until theDNA concentration of 7 mg/mL at all the studied temperatures.

Polymers 2016, 8, 51 15 of 19
Polymers 2016, 8, 51 14 of 18
Figure 16. (a) Frequency translation coefficient (ax) as a function of DNA concentration and (b) G modulus translation coefficient (ay) and Gc as a function of DNA concentration, at all studied temperatures.
In order to compare our results from flow measurements with those from dynamic measurements, we calculated the complex dynamic viscosity, |η*|, from G’ (ω) and G’’ (ω), as shown by Equation (7):
η* = G*/jω (7)
where G* is the complex modulus given by |G*| = (G’2 + G’’2)1/2 The Cox-Merz rule is an empirical relationship in which a correspondence is observed between
the steady state shear viscosity, η, plotted against shear rate, , and the magnitude of the complex viscosity, |η*|, plotted against angular frequency, ω. This rule has been found to be applicable for many polymer melts and concentrated and semi-dilute solutions. However, some deviations from this rule occur at high frequencies, and the oscillatory data can either over or under estimate the steady state data. Some polymeric systems for which Cox–Merz rule does not apply are cross-linked or gelling systems and most particulate dispersions [64]. Figure 17 presents, as an example, the results obtained for DNA concentration of 3.0 mg/mL in TE buffer at a constant temperature of 20 °C; it shows a good superposition of |η*|(ω) and η ( ) as a function of radial frequency and shear rate, respectively. From these results, it is possible to conclude that there are no strong interchain interactions at least until the DNA concentration of 7 mg/mL at all the studied temperatures.
Figure 17. |η*|(ω) and η ( ) as a function of shear rate and radial frequency for a DNA concentration of 3.0 mg/mL in TE buffer at a temperature of 20 °C.
Then, the characteristic parameters obtained for the slope s and for c were reported on Figures 12 and 13 respectively. A good agreement is obtained for the experimental values obtained by flow and dynamic measurements indicating that DNA is in good thermodynamic conditions at least up to 7 mg/mL.
Figure 17. |η*|(ω) and η (.γ) as a function of shear rate and radial frequency for a DNA concentration
of 3.0 mg/mL in TE buffer at a temperature of 20 ˝C.
Then, the characteristic parameters obtained for the slope s and for.γc were reported on
Figures 12 and 13 respectively. A good agreement is obtained for the experimental values obtained byflow and dynamic measurements indicating that DNA is in good thermodynamic conditions at leastup to 7 mg/mL.
4. Conclusions
In this paper, the main physicochemical properties of calf thymus DNA in buffer aqueous solutionare examined. In a first part, the conformation is characterized as well as its stability using UV–Vismeasurements. It is concluded that, in the experimental conditions adopted (TE buffer), the doublehelical conformation is stable in the range of temperature covered for the rheological study. Themelting temperature is found at 70 ˝C in the buffer used. The influence of the ionic concentrationimposed by external salt is also studied. Then, the intrinsic viscosity is determined from the studyof viscosity as a function of the shear rate to get the viscosity in the Newtonian plateau. A value of[η] = 4080 mL/g is obtained from which the viscometric-average molecular weight Mv = 6,559,000is calculated.
In a second part, the rheological behavior is investigated in a large range of polymer concentration(from 0.01 to 30 mg/mL) in TE buffer and at different temperatures from 10 to 40 ˝C, where the doublehelical conformation is stable. For that purpose, flow and dynamic experiments are performed. Itis shown that the hydrodynamic behavior is only slightly modified by temperature. We identifiedthree concentration domains: the dilute domain C < C* with C* « 0.23 mg/mL; then, the semi-diluteunentangled regime between C* and Ce (or C**) with Ce « 2.4 mg/mL followed by the entangledregimes. For the first two regimes, the specific viscosity at zero shear rate follows a development as afunction of the overlap parameter C[η]; at larger concentrations, experimental data deviate from thisrelation and the scaling exponent equals 4.3 in agreement with reptation model. In the semi-diluteregime, the critical value of the shear rate (
.γc) for the transition from Newtonian to non-Newtonian
behavior, as well as the slope of the viscosity as a function of the shear rate (s) are examined as afunction of the overlap parameter. Dynamic rheology in the linear regime gives a series of curvesas a function of DNA concentration and temperatures allowing obtaining a master curve (using ashift using a given reference for CDNA and T). The imposed shifts are analyzed as a function of DNAconcentration, the main parameter controlling the solution behavior at constant molecular weight. Inthe range of concentration covered up to 7 mg/mL, Cox-Merz superposition is valid and all the flowcharacteristics agree when dynamic complex viscosity and flow viscosity are compared. To conclude,it is necessary to introduce the hypothesis that, up to now, the scaling parameters are introduced for

Polymers 2016, 8, 51 16 of 19
flexible chains (for which the Flory exponent ν = 0.5 in θ-conditions, which is not valid for wormlikechains) and that it is probably needed to reconsider the behavior of semi-rigid chains on certain aspectsof the theoretical predictions.
Supplementary Materials: The following are available online at www.mdpi.com/2073-4360/8/2/51/s1, FigureS1: Master curve for the reduced elastic (G’) and viscous (G”) moduli as a function of the reduced frequency forthe concentration variation of calf-thymus DNA in TE buffer at 10, 20, 30, and 40 ˝C.
Acknowledgments: Félix Armando Soltero Martínez acknowledges CONACYT for financial support throughproject No. 223549. Lourdes Mónica Bravo-Anaya acknowledges the scholarship granted by CONACYT, theBourse Eiffel scholarship granted by French Government, and financial support granted by G. Bravo-Galván.We acknowledge Nicolas Spinelli for his help with performing UV-Vis measurements. We acknowledgeHélène Galliard for her valuable help with conducting the experiments and Mohamed Karrouch, Eric Fèvre,Frédéric Hugenell, and Didier Bleses for their technical support.
Author Contributions: Félix Armando Soltero Martínez suggested the work; Lourdes Mónica Bravo-Anaya,Marguerite Rinaudo, and Félix Armando Soltero Martínez conceived and designed the experiments; LourdesMónica Bravo-Anaya performed the experiments; Marguerite Rinaudo and Lourdes Mónica Bravo-Anayaanalyzed the data; Félix Armando Soltero Martínez contributed with reagents; Marguerite Rinaudo and LourdesMónica Bravo-Anaya wrote the paper.
Conflicts of Interest: The authors declare no conflict of interest.
Abbreviations
The following abbreviations are used in this manuscript:
DNA: Deoxyribonucleic AcidMw: weight–average molecular weightMW: molecular weightTE: Tris–HCl-EDTA buffer
References
1. Anderson, C.F.; Record, M.T. Polyelectrolyte theories and their applications to DNA. Annu. Rev. Phys. Chem.1982, 33, 191–222. [CrossRef]
2. Bloomfield, V.A. Hydrodynamic properties of DNA. J. Macromol. Sci. Polym. Rev. 1968, 3, 255–316. [CrossRef]3. Paun, G.; Rozenberg, G.; Salomaa, A. DNA: Its Structure and Processing in DNA Computing; Springer-Verlag:
Berlin, Germany, 1998; pp. 10–22.4. Lavery, R.; Sklenar, H.; Zakrzewska, K.; Pullman, B. The flexibility of the nucleic acids: (II) The calculation of
internal energy and applications to mononucleotide repeat DNA. J. Biomol. Struct. Dyn. 1986, 5, 989–1014.[CrossRef] [PubMed]
5. Frank-Kamenetskii, M.D. Biophysics of the DNA molecule. Phys. Rep. 1997, 288, 13–60. [CrossRef]6. Gerstein, M.B.; Bruce, C.; Rozowsky, J.S.; Zheng, D.; Du, J.; Korbel, J.O.; Emanuelsson, O.; Zhang, Z.D.;
Weissman, S.; Snyder, M. What is a gene, post-ENCODE? History and updated definition. Genome Res. 2007,17, 669–681. [CrossRef] [PubMed]
7. Wood, R.D.; Mitchell, M.; Sgouros, J.; Lindahl, T. Human DNA repair genes. Science 2001, 291, 1284–1289.[CrossRef] [PubMed]
8. Watson, J.D.; Crick, F.H.C. The structure of DNA. Cold Spring Harb. Symp. Quant. Biol. 1953, 18, 123–131.[CrossRef] [PubMed]
9. Klein, A.; Bonhoeffer, F. DNA replication. Annu. Rev. Biochem. 1972, 41, 301–332. [CrossRef] [PubMed]10. Jacob, F.; Brenner, S.; Cuzin, F. On the regulation of DNA replication in bacteria. Cold Spring Harb. Symp.
Quant. Biol. 1963, 28, 329–348. [CrossRef]11. Rosenberg, A.H.; Studier, F.W. Intrinsic viscosity of native and single stranded T7 DNA and its relationship
to sedimentation coefficient. Biopolymers 1969, 7, 765–774. [CrossRef] [PubMed]12. Schildkraut, C.; Lifson, S. Dependence of the melting temperature of DNA on salt concentration. Biopolymers
1965, 3, 195–208. [CrossRef] [PubMed]

Polymers 2016, 8, 51 17 of 19
13. Vedenov, A.A.; Dykhne, A.M.; Frank-Kamanestskii, M.D. The helix-coil transition in DNA. Sov. Phys. Usp.1972, 14, 715–736. [CrossRef]
14. Manning, G.S. The molecular theory of polyelectrolyte solutions with applications to the electrostaticproperties of polynucleotides. Q. Rev. Biophys. 1978, 2, 179–246. [CrossRef]
15. DeVoe, H.; Tinoco, I., Jr. The stability of helical polynucleotides: Base contributions. J. Mol. Biol. 1962, 4,500–517. [CrossRef]
16. Fixman, M.; Freire, J.J. Theory of DNA melting curves. Biopolymers 1977, 16, 2693–2704. [CrossRef] [PubMed]17. Nelson, D.L.; Cox, M.M. Lehninger Principles of Biochemistry, 5th ed.; W.H. Freeman and Company: New York,
NY, USA, 2008; p. 292.18. Owen, R.J.; Hill, L.R.; Lapage, S.P. Determination of DNA base compositions from melting profiles in dilute
buffers. Biopolymers 1969, 7, 503–516. [CrossRef] [PubMed]19. Bloomfield, V.A. DNA condensation by multivalent cations. Biopolymers 1997, 44, 269–282. [CrossRef]20. Tan, Z.-J.; Chen, S.-J. Nucleic acid helix stability: Effects of salt concentration, cation valence and size, and
chain length. Biophys. J. 2006, 90, 1175–1190. [CrossRef] [PubMed]21. Odijk, T. On the ionic-strength dependence of the intrinsic viscosity of DNA. Biopolymers 1979, 18, 3111–3113.
[CrossRef] [PubMed]22. Manning, G.S. The persistence length of DNA is reached from the persistence length of its null isomer
through an internal electrostatic stretching force. Biophys. J. 2006, 91, 3607–3616. [CrossRef] [PubMed]23. Odijk, T.; Houwaart, A.C. On the theory of the excluded-volume effect of a polyelectrolyte in a 1–1 electrolyte
solution. J. Polym. Sci. Polym. Phys. 1978, 16, 627–639. [CrossRef]24. Harrington, R.E. Opticohydrodynamic properties of high-molecular-weight DNA. III. The effects of NaCl
concentration. Biopolymers 1978, 17, 919–936. [CrossRef]25. Maret, G.; Weill, G. Magnetic birefringence study of the electrostatic and intrinsic persistence length of DNA.
Biopolymers 1983, 22, 2727–2744. [CrossRef] [PubMed]26. Odijk, T. Possible scaling relations for semidilute polyelectrolyte Solutions. Macromolecules 1979, 12, 688–693.
[CrossRef]27. Reed, W.F. Light-scattering results on polyelectrolyte conformations, diffusion, and interparticle and
correlations. In Macro-Ion Characterization, From Dilute Solutions to Complex Fluids; Kenneth, S.S., Ed.;American Chemical Society: Washington, DC, USA, 1994.
28. Mason, T.G.; Dhople, A.; Wirtz, D. Linear viscoelastic moduli of concentrated DNA Solutions. Macromolecules1998, 31, 3600–3603. [CrossRef]
29. Raspaud, E.; Lairez, D.; Adam, M. On the number of blobs per entanglement in semidilute and good solventsolution: Melt influence. Macromolecules 1995, 28, 927–933. [CrossRef]
30. Milas, M.; Rinaudo, M.; Knipper, M.; Schuppiser, J.L. Flow and viscoelastic properties of xanthan gumsolutions. Macromolecules 1990, 23, 2506–2511. [CrossRef]
31. Fouissac, E.; Milas, M.; Rinaudo, M. Shear-Rate, Concentration, Molecular Weight, and Temperature ViscosityDependences of Hyaluronate, a Wormlike Polyelectrolyte. Macromolecules. 1993, 26, 6945–6951. [CrossRef]
32. Musti, R.; Sikorav, J.-L.; Lairez, D.; Jannink, G.; Adam, M. Viscoelastic properties of entangled DNA solutions.C. R. Acad. Sci. Série II b 1995, 320, 599–605.
33. Sun, M.; Pejanovic, S.; Mijovic, J. Dynamics of deoxyribonucleic acid solutions as studied by dielectricrelaxation spectroscopy and dynamic mechanical spectroscopy. Macromolecules 2005, 38, 9854–9864.[CrossRef]
34. Anselmi, C.; DeSantis, P.; Scipioni, A. Nanoscale mechanical and dynamical properties of DNA singlemolecules. Biophys. Chem. 2005, 113, 209–221. [CrossRef] [PubMed]
35. Taulier, N.; Chalikian, T.V. Compressibility of protein transitions. Biochim. Biophys. Acta 2002, 1595, 48–70.[CrossRef]
36. Wang, N. Mechanical interactions among cytoskeletal filaments. Hypertension 1998, 32, 162–165. [CrossRef][PubMed]
37. Chan, E.Y.; Goncalves, N.M.; Haeusler, R.A.; Hatch, A.J.; Larson, J.W.; Maletta, A.M.; Yantz, G.R.;Carstea, E.D.; Fuchs, M.; Wong, G.C.; et al. DNA mapping using microfluidic stretching and single-moleculedetection of fluorescent site-specific tags. Genome Res. 2004, 14, 1137–1146. [CrossRef] [PubMed]

Polymers 2016, 8, 51 18 of 19
38. Bader, J.S.; Hammond, R.W.; Henck, S.A.; Demm, M.W.; McDermott, G.A.; Bustillo, J.M.; Simpson, J.W.;Mulhern, G.T.; Rothberg, J.M. DNA transport by a micromachined Brownian ratchet device. Proc. Natl. Acad.Sci. USA 1999, 96, 13165–13169. [CrossRef] [PubMed]
39. Aktins, E.D.; Taylor, M.A. Elongational flow studies on DNA in aqueous solution and stress-induced scissionof the double helix. Biopolymers 1992, 32, 911–923.
40. Juarez, G.; Arratia, P.E. Extensional rheology of DNA suspensions in microfluidic devices. Soft Matter 2011,7, 9444–9452. [CrossRef]
41. Graessley, W.M. Polymer chain dimensions and the dependence of viscoelastic properties on concentration,molecular weight and solvent power. Polymer 1980, 21, 258–262. [CrossRef]
42. Colby, R.H.; Rubinstein, M.; Daoud, M. Hydrodynamics of polymer solutions via two-parameter scaling.J. Phys. II France 1994, 4, 1299–1310. [CrossRef]
43. Colby, R.H.; Fetters, L.J.; Funk, W.G.; Graessley, W.W. Effects of concentration and thermodynamic interactionon the viscoelastic properties of polymer solutions. Macromolecules 1991, 24, 3873–3882. [CrossRef]
44. Wilfinger, W.W.; Mackey, K.; Chomczynski, P. Effect of pH and ionic strength on the spectrophotometricassessment of nucleic acid purity. Biotechniques 1997, 22, 478–481.
45. Alatorre-Meda, M.; Taboada, P.; Hartl, F.; Wagner, T.; Freis, M.; Rodríguez, J.R. The influence of chitosanvalence on the complexation and transfection of DNA: The weaker the DNA–chitosan binding the higherthe transfection efficiency. Colloids Surf. B Biointerfaces 2011, 82, 54–62. [CrossRef] [PubMed]
46. Pouton, C.W.; Lucas, P.; Thomas, B.J.; Uduehi, A.N.; Milroy, D.A.; Moss, S.H. Polycation–DNA complexesfor gene delivery: A comparison of the biopharmaceutical properties of cationic polypeptides and cationiclipids. J. Control. Release 1998, 53, 289–299. [CrossRef]
47. Frank-Kamenetskii, M.D. DNA chemistry. How the double helix breathes. Nature 1987, 328, 17–18. [CrossRef][PubMed]
48. Record, M.T., Jr. Effects of Na+ and Mg++ Ions on the helix-coil transition of DNA. Biopolymers 1975, 14,2137–2158. [CrossRef]
49. Tsortos, A.; Papadakis, G.; Gizeli, E. The intrinsic viscosity of linear DNA. Biopolymers 2011, 95, 824–832.[CrossRef] [PubMed]
50. Porsch, B.; Laga, R.; Horský, J.; Konák, C.; Ulbrich, K. Molecular weight and polydispersity of calf-thymusDNA: Static light-scattering and size-exclusion chromatography with dual detection. Biomacromolecules 2009,10, 3148–3150. [CrossRef] [PubMed]
51. Tanigawa, M.; Suzuzuto, M.; Fukudome, K.; Yamaoka, K. Changes in molecular weights andmolecular weight distributions of differently stranded nucleic acids after sonication: Gel permeationchromatography/low angle laser light scattering evaluation and computer simulation. Macromolecules1996, 29, 7418–7425. [CrossRef]
52. Sundaresan, N.; Suresh, C.H.; Thomas, T.; Thomas, T.J.; Pillai, C.K.S. Liquid crystalline phase behavior ofhigh molecular weight DNA: A comparative study of the influence of metal ions of different size, chargeand binding mode. Biomacromolecules 2008, 9, 1860–1869. [CrossRef] [PubMed]
53. Milas, M.; Rinaudo, M.; Tinland, B. The viscosity dependence on concentration, molecular weight and shearrate of xanthan solutions. Polym. Bull. 1985, 14, 157–164. [CrossRef]
54. Barnes, H.A.; Hutton, J.F.; Walters, K. An Introduction to Rheology; Elsevier Science: Amsterdam, Netherlands& London, UK & New York, NY, USA & Tokyo, Japan, 1989; p. 128.
55. Ferry, J.D. Viscoelastic Properties of Polymers, 3rd ed.; John Wiley & Sons: New York, NY, USA, 1980.56. Kwei, T.K.; Nakazawa, M.; Matsuoka, S.; Cowman, M.K.; Okamoto, Y. Concentration dependence of solution
viscosities of rigid rod polymers. Macromolecules 2000, 33, 235–236. [CrossRef]57. Rinaudo, M. Relation between the Molecular Structure of Some Polysaccharides and Original Properties in
Sol and Gel States. Food Hydrocoll. 2001, 15, 433–440. [CrossRef]58. Kapoor, V.P.; Milas, M.; Taravel, F.R.; Rinaudo, M. Rheological properties of a seed galactomannan from
Cassia siamea lamk. Food Hydrocoll. 1996, 10, 167–172. [CrossRef]59. Frisman, E.V.; Vorobiev, V.I.; Shchagina, L.V.; Yanovskaya, N.K. Flow birefringence in solutions
of deoxyribonucleic acids DNA-I the optical anisotropy of native and aggregated denatured DNA.Vysokomol. Soedin 1962, 4, 762–768.
60. Berriaud, N.; Milas, M.; Rinaudo, M. Rheological study on mixtures of different molecular weighthyaluronates. Int. J. Biol. Macromol. 1994, 16, 137–142. [CrossRef]

Polymers 2016, 8, 51 19 of 19
61. Milas, M.; Rinaudo, M.; Roure, I.; Al-Assaf, S.; Phillips, G.O.; Williams, P.A. Comparative rheologicalbehavior of hyaluronan from bacterial and animal sources with cross-linked hyaluronan (hylan) in aqueoussolution. Biopolymers 2001, 59, 191–204. [CrossRef]
62. Colby, R.H. Structure and linear viscoelasticity of flexible polymer solutions: comparison of polyelectrolyteand neutral polymer Solutions. Rheol. Acta 2010, 49, 425–442. [CrossRef]
63. Graessley, W.W. The Entanglement Concept in Polymer Rheology; Springer: Berlin, Germany, 1974; pp. 1–179.64. Yılmaz, M.T.; Karaman, S.; Cankurt, H.; Kayacier, A.; Sagdic, O. Steady and dynamic oscillatory shear
rheological properties of ketchup–processed cheese mixtures: Effect of temperature and concentration.J. Food Eng. 2011, 103, 197–210. [CrossRef]
© 2016 by the authors; licensee MDPI, Basel, Switzerland. This article is an open accessarticle distributed under the terms and conditions of the Creative Commons by Attribution(CC-BY) license (http://creativecommons.org/licenses/by/4.0/).