Calculation of marketing ROI in marketing mix models, from ...
58
UNIVERSIA BUSINESS REVIEW | FOURTH QUARTER 2016 | ISSN: 1698-5117 18 1. INTRODUCTION There is growing pressure from the senior management, investors and financial analyst for the marketing departments of large companies to inform them of the return on investment from the campaigns they carry out, owing to the substantial amount of financial resources they manage. According to the 2014 annual report of telecommunications company Jazztel, their investment in marketing and customer service amounted to 214.7m euros, compared to a 359.7m euro investment in fibre optic deployment (their main activity being the exploitation of the same); that is, the company invested the equivalent of almost 60% of its fixed assets investing in marketing activities. Investments in fixed assets are always evaluated from a strictly financial perspective, using clear and widely accepted metrics such as, for example, return on investment (ROI) and economic value added (EVA), been this information provided in detail to shareholders, analysts and investors to enable them to make decisions on resources allocation. However, this is not always the case with marketing investments. These tend not to be sufficiently explained and, and owing to the lack of transparency, it is difficult for investors to know whether these create value or not and, consequently, whether the investment will bring value to the shareholders (Kimbrough et al. 2009). Despite the importance of transmitting information to the market about the result of marketing strategies, there is still little Calculation of marketing ROI in marketing mix models, from ROMI, to marketing-created value for shareholders, EVAM 1 Received: 17 November 2015. Accepted: 3 October 2016 DOI: 10.3232/UBR.2016.V13.N4.01 JEL CODES: G30, M31, M37 Cálculo del ROI de marketing en modelos de marketing mix, del ROMI, al valor creado del marketing para los accionistas EVAM Mariano Méndez Suárez 2 ESIC Business & Marketing School [email protected] Macarena Estevez Conento macarena.estevez@conento. com
Transcript of Calculation of marketing ROI in marketing mix models, from ...

UNIVERSIA BUSINESS REVIEW | FOURTH QUARTER 2016 | ISSN: 1698-5117
18
1. INTRODUCTIONThere is growing pressure from the senior management, investors and financial analyst for the marketing departments of large companies to inform them of the return on investment from the campaigns they carry out, owing to the substantial amount of financial resources they manage. According to the 2014 annual report of telecommunications company Jazztel, their investment in marketing and customer service amounted to 214.7m euros, compared to a 359.7m euro investment in fibre optic deployment (their main activity being the exploitation of the same); that is, the company invested the equivalent of almost 60% of its fixed assets investing in marketing activities.Investments in fixed assets are always evaluated from a strictly financial perspective, using clear and widely accepted metrics such as, for example, return on investment (ROI) and economic value added (EVA), been this information provided in detail to shareholders, analysts and investors to enable them to make decisions on resources allocation. However, this is not always the case with marketing investments. These tend not to be sufficiently explained and, and owing to the lack of transparency, it is difficult for investors to know whether these create value or not and, consequently, whether the investment will bring value to the shareholders (Kimbrough et al. 2009). Despite the importance of transmitting information to the market about the result of marketing strategies, there is still little
Calculation of marketing ROI in marketing mix models, from ROMI, to marketing-created value for shareholders, EVAM1
Received: 17 November 2015. Accepted: 3 October 2016 DOI: 10.3232/UBR.2016.V13.N4.01 JEL CODES: G30, M31, M37
Cálculo del ROI de marketing en modelos de marketing mix, del ROMI, al valor creado del marketing para los accionistas EVAM
Mariano Méndez Suárez2
ESIC Business & Marketing [email protected]
Macarena [email protected]

UNIVERSIA BUSINESS REVIEW | FOURTH QUARTER 2016 | ISSN: 1698-5117
19
EXECUTIVE SUMMARYIn this paper we explain using a real example of a fast consumer good the construction of a Marketing Mix model for calculating the return on marketing investment (ROMI) as a metric of profitability and the calculation of economic value added of marketing (EVAM) as a metric of shareholders value creation. We propose a novel approach for estimating the coefficient λ of the Adstock model using impulse response functions. We measure the return of short-term advertising and its combination with long-term using as a variable brand awareness measured with a tracking throughout the entire period analyzed. The result of the analysis indicates that short-term advertising has a negative return which happens to be very positive when we consider the combined effect with brand awareness.
RESUMEN DEL ARTÍCULOEn el presente artículo explicamos mediante un ejemplo real de un product de gran consumo la construcción de un model de Marketing Mix para el cálculo del return on marketing investment (ROMI) como metric de rentabilidad y el cálculo del valor económico añadido del marketing (EVAM) como metric de creación de valor para los shareholders. Proponemos un método novedoso para la estimación del coefficient λ del model de Adstock mediante impulse response functions. Medimos la rentabilidad de la advertising a corto plazo y el effect conjunto de la advertising a corto y a largo plazo utilizando para ello la variable brand awareness medida a través de un tracking de marca a lo largo de todo el periodo analizado. El resultado del análisis indica que la advertising a corto plazo tiene un retorno negativo que pasa a ser muy positivo cuando tenemos en cuenta su effect combinado con la brand awareness.

CALCULATION OF MARKETING ROI IN MARKETING MIX MODELS, FROM ROMI, TO MARKETING-CREATED VALUE FOR SHAREHOLDERS, EVAM
UNIVERSIA BUSINESS REVIEW | FOURTH QUARTER 2016 | ISSN: 1698-5117
20
agreement on how to measure profitability of these, even within the organisations themselves.In 1999 Bucklin and Gupta advocated the standardisation of methods for evaluating marketing profitability, owing to the heterogeneity and opacity of the methods being used, especially by consultancy companies. In 2005, Steward et al., of the Marketing Accountability Foundation, stated that apart from using traditional metrics (e.g.: awareness, purchase intent and brand recommendation), the results of marketing actions needed to be financially measureable using metrics such as Return on Marketing Investment (ROMI). The Foundation promotes the adoption of standard procedures, to allow
interested parties to monitor and cross-compare the returns obtained and to compare them in time. More recently, Farris et al. (2015) insisted on the standardisation of the ROMI definition, owing to its growing acceptance, but in many cases used and interpreted in very different ways. The aim of this paper is to explain and clarify the calculation of economic metrics for measuring return on marketing investment and estimating the value created for shareholders, especially regarding the short and long-term effects of advertising. In the following section we will analyse the actual use of these economic metrics by the marketing departments. We will then define and give an example of the calculation of the return on marketing investment (ROMI) and the economic value added of marketing (EVAM). Then,
using data from a project undertaken for a consumer goods company, we will create the econometric model to obtain the contribution of the main variables that affect sales, which will enable us to calculate the ROMI and EVAM. We will end by discussing conclusions, limitations and future research lines.
2. THE USE OF ECONOMIC METRICS AND TRADITIONAL METRICS IN MARKETING Since Kotler’s (1977) definition of the concept of marketing effective-ness there has been a growing interest in the development of quanti-tative methods for measuring the financial return of marketing actions, especially advertising, in order to prove that these are investments from which a return can be expected and are not an expense with an unquantifiable return. It is increasingly common, especially for large
The aim of this paper
is to explain and cla-
rify the calculation of
economic metrics for
measuring return on
marketing investment
and estimating the
value created for
shareholders
MARIANO MÉNDEZ SUÁREZ & MACARENA ESTEVEZ
UNIVERSIA BUSINESS REVIEW | FOURTH QUARTER 2016 | ISSN: 1698-5117
21
companies with a high level of investment in advertising, to request the calculation of ROMI as a measure of the financial return on the activities carried out to demonstrate that these create value for sha-reholders.To learn about the implementation of the metric, in 2009 and 2011 the Lenskold Group conducted separate studies entitled Marketing ROI & Measurement Study, requesting information about the use of economic metrics in evaluating marketing performance. Both studies showed a growing tendency in the use of ROMI. In the 2011 study, 28% of those surveyed said they used ROMI as an indicator of pro-fitability and 36% said they used another financial metric. We should point out that in the 2009 study, the response regarding the use of ROMI was broken down into two groups, one formed of companies considered to be “highly efficient and effective” and the other formed of the other companies consulted. It is very insightful that in the first group 54% said they used ROMI as their main economic metric, whe-reas this figure was only 29% in the second group.Rogers and Sexton (2012) conducted a study that is more explicit about the use of more traditional metrics such as brand awareness, purchase intent and brand recommendation. Of those surveyed, 22% made most of their decisions based on brand awareness alone and, of these, 60% used only this metric to measure the profitability of their actions. 82% of those surveyed were confused about the concept of ROMI, given that they didn’t mention the link between marketing in-vestment and financial return.Moreover, in the survey conducted by Mintz and Currim (2013) they break down the results of the use of marketing metrics according to the main broadcast advertising channels and create a ranking in which these are ordered according to their use. For companies that use tra-ditional advertising, that is, with a high component of TV advertising, the most frequently used metric is brand awareness, accounting for 60% of cases, with ROMI in 7th position with 32% and EVAM in 27th position with 4%.The data analysed regarding the use of financial metrics in marke-ting indicate that these still need to be adapted to the language of senior management, shareholders and investors through tools such as ROMI and EVAM.
KEY WORDSMarketing Mix modeling, return on marketing investment (ROMI), economic value added of Marketing EVAM, Modeling Advertising Effectiveness.
PALABRAS CLAVEModelos de Marketing Mix, retorno de la inversion en Marketing ROMI, valor económico añadido del Marketing EVA, modelización de la eficacia publicitaria.
CALCULATION OF MARKETING ROI IN MARKETING MIX MODELS, FROM ROMI, TO MARKETING-CREATED VALUE FOR SHAREHOLDERS, EVAM
UNIVERSIA BUSINESS REVIEW | FOURTH QUARTER 2016 | ISSN: 1698-5117
22
3. DEFINITION AND EXAMPLE OF CALCULATION OF ROMI AND EVAMFarris et al. (2015) define ROMI as the result of dividing the increase in financial value created by the marketing actions net the investment made in these actions by the investment in marketing. To estimate the increase of financial value we calculate the difference between the sales made after the marketing actions (or incremental sales) and the expected sales, if these haven’t been done (or baseline sales). Econometric models are then used to obtain the incremental sales. We will look at the creation of these models later on. Once the incremental sales have been isolated, the calculation pro-cess is as follows: 1) we multiply these sales by the price, obtaining the incremental revenue; 2) we multiply these sales by their variable cost, obtaining the variable incremental cost; 3) we find the difference to give us the incremental gross margin; 4) from this value we subtract the investment made in marketing; 5) we then divide the value obtai-ned by the marketing Investment, thus obtaining the ROMI:
Incremental Income
- Incremental Variable Cost Incremental Gross Margin
- Marketing Investment - Marketing Investment Incremental Revenue
ROMI = ------------------------------- = ------------------------------- = -------------------------------
Marketing Investment Marketing Investment Marketing Investment
The result of the operation can be interpreted either as euros earned/lost per euro invested or as a percentage of the return on investment made in advertising. For example, ROMI = 0.3 would mean that we have earned 30 euros for each 100 euros invested, or that the cam-paign has had a return of 30%. If the ROMI value is negative, = -0.3, it means we have lost 30 euros for each 100 euros invested, or have a return of -30%.This calculation does not include fixed costs or depreciation, as we assume that these would not vary as a result of the incremental sales generated by the campaign. We could ask why we haven’t included income tax in the formula, or tax saving as advertising is considered a tax deductible cost, but because we have made a quotient between both and despite the fact that the absolute values will diminish, the ratio will remain constant:

MARIANO MÉNDEZ SUÁREZ & MACARENA ESTEVEZ
UNIVERSIA BUSINESS REVIEW | FOURTH QUARTER 2016 | ISSN: 1698-5117
23
Once we have obtained the ROMI, we then need to subtract the cost of the company’s financial resources. This cost is the weighted avera-ge cost of capital (WACC) which is an average of the cost of the long-term debt and the return required by shareholders, or cost of capital. In some cases, certain companies use a value superior to the WACC, known as the hurdle rate. The difference between the ROMI and the WACC gives us the return obtained from the campaign:
Return = ROMI - wacc
The next step is to calculate the EVAM. Seggie, Cavusgil, and Phelan (2007) refer to this as a metric that allows us to communicate the re-sults outside the marketing departments, especially to shareholders, since there will be no controversy owing to subjective opinions. Smyth and Lecoeuvre (2015) state its importance for measuring the value created for shareholders by the marketing strategies.In financial terms, EVA measures the contribution in value for the company from the investments made after subtracting its financial cost; this is calculated by subtracting from earnings before interest and after taxes the investment made multiplied by the cost of capital (for further information about EVA see Griffith 2004). By adapting the formula to the incremental revenue obtained from the marketing acti-vities we can calculate the EVAM as:
EVAM = Incremental Profit (1-T) – Marketing Investment x wacc
Using an example to illustrate the calculation of the ROMI and the EVAM we can establish the following hypotheses: incremental sales of 100,000 price units of 9 euros and variable cost of 6 euros. A mar-keting investment of 200,000 euros, a WACC of 10% and tax rate of 30%. The ROMI would be:
Incremental Profit (1-T) Incremental Profit
ROMI = --------------------------------- = ---------------------------------
Marketing Investment(1-T) Marketing Investment
100,000 x 9
-100,000 x 6 300,000
- 200,000 - 200,000 100,000
ROMI = ------------------ = ------------------ = ----------------- = 0.5
200,000 200,000 200,000

CALCULATION OF MARKETING ROI IN MARKETING MIX MODELS, FROM ROMI, TO MARKETING-CREATED VALUE FOR SHAREHOLDERS, EVAM
UNIVERSIA BUSINESS REVIEW | FOURTH QUARTER 2016 | ISSN: 1698-5117
24
We obtain a ROMI of 50%, from which we need to subtract the WACC of 10%, thus obtaining a return on investment of 40%. The EVAM in this case would be 50,000 euros:
EVAM = 100,000 x (1-0.3) – 200,000 x 0.1 = 70,000 – 20,000 = 50,000
Now, basing ourselves on work carried out for a consumer goods company, we show the creation of the econometric model to first find the incremental sales and then the calculation of the ROMI and EVAM obtained.
4. DATATo explain the process of obtaining incremental sales, we will use the data of a Spanish leading product in the dairy products category with beneficial health properties and a high level of advertising investment, especially in television. The series consists of 298 observations with a weekly frequency and aggregated on Sundays between 2009 and 2014. This period is particularly difficult to model, since it includes both the peak of the economic crisis that occurred in Spain and the start of the recovery in 2013 and 2014. Sales in the category have a high seasonal component, with a positive impact in the first and last week of the month and with very pronounced falls in sales in the summer months, November, bank holiday weekends, summer holiday periods and around Christmas. The initial database includes over a thousand variables with data about the company itself and about sector competitors as well as other economic variables. In addition to calculating the ROMI, this database allows the analysis of other aspects of brand marketing performance, such as the calculation of price or crossed elasticity, advertising elasticity, etc., and the measurement of the impact of campaigns featuring various celebrities or special actions. It also allows us to measure the effectiveness of the positioning of the first and last advert after the commercial breaks.After an initial specification we move on to the econometric modelling process. This consists of deciding which variables are important for analysis and which, therefore, are considered better for explaining, significantly, the variation in sales during the period studied. We describe these variables below:
MARIANO MÉNDEZ SUÁREZ & MACARENA ESTEVEZ
UNIVERSIA BUSINESS REVIEW | FOURTH QUARTER 2016 | ISSN: 1698-5117
25
Sales by volume (Sales)The sales correspond exclusively to a single product of the brand and are measured in litres. By including the variable sales in litres as a dependent variable of the model, one would think that it would make more sense to use a measure of sales in euros instead of by volume, and even more so considering that we want to measure the return on marketing investment. But the problem is that sales in euros is a linear combination of the variables sales by volume and price, so if we use this variable we would lose the information about the impact of price on sales as we would not know whether the sales variations were due to changes in price or volume. In addition, technically speaking and considering the methodology used for the linear regression, introducing the sales in economic value causes some problems and distortions when establishing the variable that causes the variation in sales. For example, if we base ourselves on a given week in which sales are 100 units and the price is 1 euro, in this case the sales variable in euros would have a value of 100 euros. A week later if we reduce the price to 0.8 euros and accompany it with a TV campaign to announce the reduction, we assume that the combined effect of these two variables would mean an increase in sales to 120 units and our sales variable in euros would be 120x0.8 = 96 euros. The information received by the econometric model would be a 4% fall in sales in euros, dropping from 100 to 96 euros (when the sales by volume would actually have increased by 20%), and an increase in advertising investment, which the model would interpret as a negative correlation between advertising and sales, being unable to detect the price effect. However, if we use sales by volume we would provide the model with very different information that would not cause distortions of economic logic: the increase in sales from 100 to 120 units is due to the combined effect of two variables: the fall in price and the increase in advertising.
Weighted distributionWeighted distribution is the measurement of the quality of distribution of a product, it tells us the percentage of supermarkets or department stores in which the product is sold, but weighting this percentage against the category’s total sales volume in each centre; that is, the greater the sales volume in the centres where we are present, the greater the weighted distribution. The product has an average weighted distribution of 99.9% and the brand showed great interest

CALCULATION OF MARKETING ROI IN MARKETING MIX MODELS, FROM ROMI, TO MARKETING-CREATED VALUE FOR SHAREHOLDERS, EVAM
UNIVERSIA BUSINESS REVIEW | FOURTH QUARTER 2016 | ISSN: 1698-5117
26
in knowing what impact this variable has on sales given the high level of investment required to maintain it.
Promotional Intensity IndexesThese indexes are obtained by dividing the sales from promotions by total sales. In our case, we have three different kinds of promotions; Promotional Intensity Index with Special Display (PII SD); Promotional Intensity Index with Leaflets (PII L), and the Promotional Intensity Index with Temporary Price Reduction (PII TPR).
Television Gross Rating Points (GRPs) at 20” and GRPs at 20” Special Actions (SA)The GRPs measurement only takes into account people who have seen the ad broadcasted and who form part of the target audience, excluding those who have seen it but are not part of this audience. It is the result of the product of two variables: the percentage of our target audience who have seen the ad and the number of times the ad has been seen multiplied by 100. Therefore, the GRPs are a measure of advertising pressure only on our target audience, so 200 GRPs may mean that 100% of our target audience have seen the ad twice, or that 50% of them have seen it four times. Using this variable instead of investment in euros is because of what occurred in the case of sales, where the investment in euros is a linear combination of two variables: the number of GRPs and the cost of these. So, for example, if there were a fall in the cost of GRPs due to circumstances in the TV market, the econometric model would interpret this as a fall in advertising (introducing a distortion into the analysis) when, in fact, the level of advertising pressure remains constant.Given that TV campaigns consist of ads of varying duration in each campaign, in our case 11 different durations from 5 seconds to 120 seconds, these formats need to be homogenised into a single format of 20 seconds; for example, two seen ads of 30 seconds each are equivalent to three of 20 seconds. The data are provided by the audience measurement company Kantar Media.
Investment in Internet and press advertising In this case, and given that there is no measure equivalent to the GRPs for television for these variables, advertising investment in euros is used, even at the risk of experiencing deviations caused by price fluctuations over time.

MARIANO MÉNDEZ SUÁREZ & MACARENA ESTEVEZ
UNIVERSIA BUSINESS REVIEW | FOURTH QUARTER 2016 | ISSN: 1698-5117
27
Brand awarenessThe brand awareness variable is expressed as a percentage and to calculate it we use brand tracking by the IPSOS Social Research Institute. This quantifies the responses to the question: Had you already heard of the brand …… before today?. For the tracking, 700 telephone interviews a week were conducted throughout the entire analysis period, by means of subsamples of 100 interviews a day, giving a total de 36,500 interviews per year. As we can see in Table 1, the values range between a minimum of 84%, an average of 96% and a maximum of 100% and they represent the percentage of people who know of the brand.
Price differential with distributor brand (DB)This variable measures the impact of price on sales. To calculate it, the total weekly sales by value (deflated by the IPC) of all the distributor brands are added up and then divided by the total weekly sales of all these brands in volume, giving us the weekly average price. Once this data has been obtained we subtract the price of the brand to find out the difference.
Interest in searching for the category on the InternetThis variable measures the frequency of the search for keywords related to the beneficial health properties of the brand, covering the entire period analysed in the regression, from 2009 to 2014. The data, provided by Google3 trends, are the result of dividing the number of searches for the keywords by the total number of searches in Google at the same time and in the same place. To index these values from 0 to 100, the values obtained from this quotient are divided by the highest figure in the entire range and then multiplied by 100.
Seasonal dummy variables Some dummy variables will be introduced into the model, which will be given a value of 0 or 1 and will represent factors such as seasonality. For example, the dummy variable May Bank Holiday Weekend, is given a value of 1 in the week in which the May Bank Holiday Weekend occurs and for the rest of the time it has a value of 0. To be able to include these variables in the model the brand must confirm that the phenomenon is an isolated, specific event.
CALCULATION OF MARKETING ROI IN MARKETING MIX MODELS, FROM ROMI, TO MARKETING-CREATED VALUE FOR SHAREHOLDERS, EVAM
UNIVERSIA BUSINESS REVIEW | FOURTH QUARTER 2016 | ISSN: 1698-5117
28
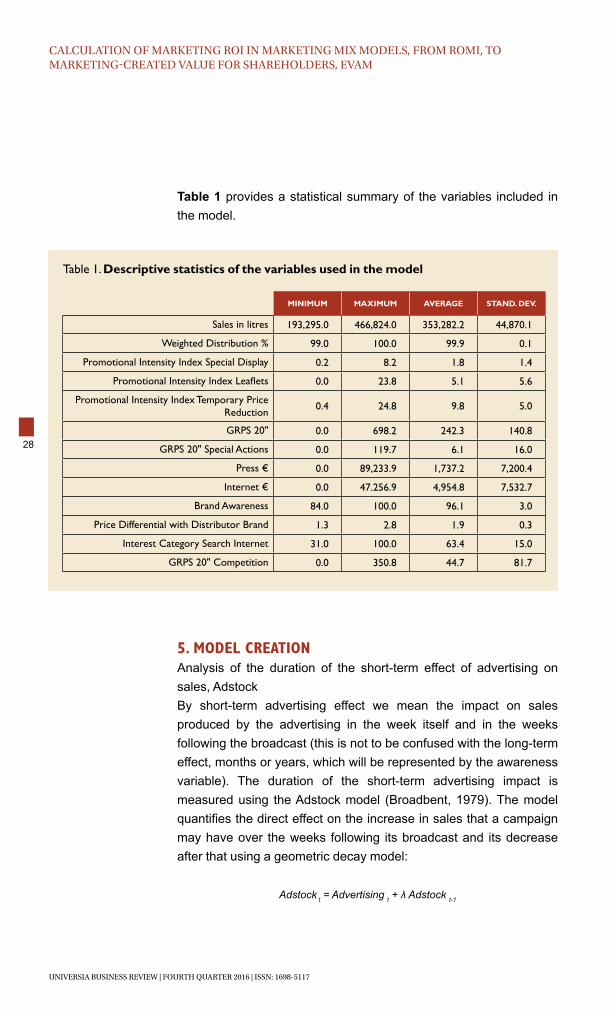
Table 1 provides a statistical summary of the variables included in the model.
Table 1. Descriptive statistics of the variables used in the model
MINIMUM MAXIMUM AVERAGE STAND. DEV.
Sales in litres 193,295.0 466,824.0 353,282.2 44,870.1
Weighted Distribution % 99.0 100.0 99.9 0.1
Promotional Intensity Index Special Display 0.2 8.2 1.8 1.4
Promotional Intensity Index Leaflets 0.0 23.8 5.1 5.6
Promotional Intensity Index Temporary Price Reduction 0.4 24.8 9.8 5.0
GRPS 20" 0.0 698.2 242.3 140.8
GRPS 20" Special Actions 0.0 119.7 6.1 16.0
Press € 0.0 89,233.9 1,737.2 7,200.4
Internet € 0.0 47.256.9 4,954.8 7,532.7
Brand Awareness 84.0 100.0 96.1 3.0
Price Differential with Distributor Brand 1.3 2.8 1.9 0.3
Interest Category Search Internet 31.0 100.0 63.4 15.0
GRPS 20" Competition 0.0 350.8 44.7 81.7
5. MODEL CREATIONAnalysis of the duration of the short-term effect of advertising on sales, AdstockBy short-term advertising effect we mean the impact on sales produced by the advertising in the week itself and in the weeks following the broadcast (this is not to be confused with the long-term effect, months or years, which will be represented by the awareness variable). The duration of the short-term advertising impact is measured using the Adstock model (Broadbent, 1979). The model quantifies the direct effect on the increase in sales that a campaign may have over the weeks following its broadcast and its decrease after that using a geometric decay model:
Adstock t = Advertising t + λ Adstock t-1
MARIANO MÉNDEZ SUÁREZ & MACARENA ESTEVEZ
UNIVERSIA BUSINESS REVIEW | FOURTH QUARTER 2016 | ISSN: 1698-5117
29
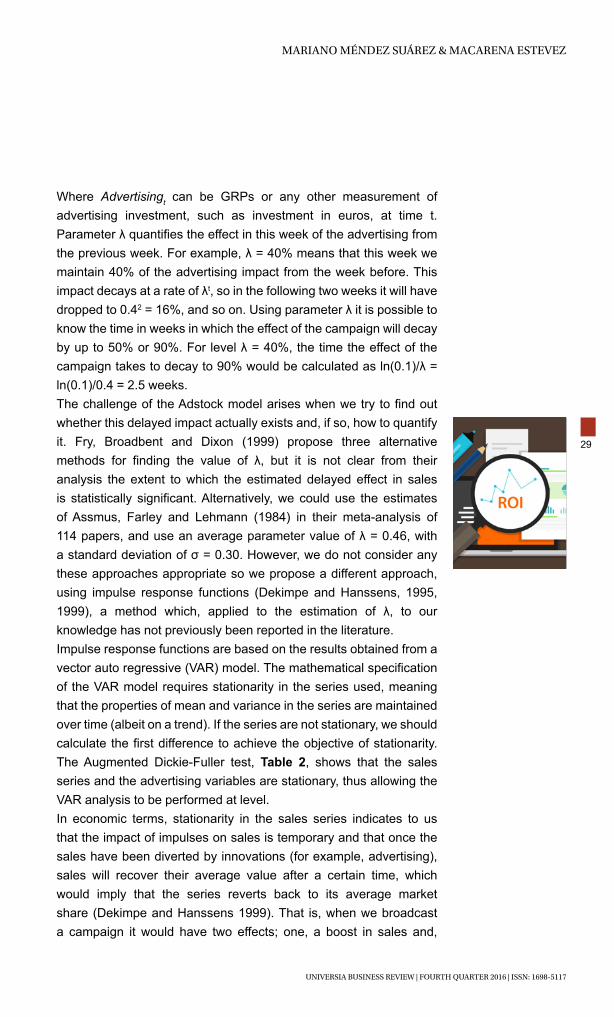
Where Advertisingt can be GRPs or any other measurement of advertising investment, such as investment in euros, at time t. Parameter λ quantifies the effect in this week of the advertising from the previous week. For example, λ = 40% means that this week we maintain 40% of the advertising impact from the week before. This impact decays at a rate of λt, so in the following two weeks it will have dropped to 0.42 = 16%, and so on. Using parameter λ it is possible to know the time in weeks in which the effect of the campaign will decay by up to 50% or 90%. For level λ = 40%, the time the effect of the campaign takes to decay to 90% would be calculated as ln(0.1)/λ = ln(0.1)/0.4 = 2.5 weeks.The challenge of the Adstock model arises when we try to find out whether this delayed impact actually exists and, if so, how to quantify it. Fry, Broadbent and Dixon (1999) propose three alternative methods for finding the value of λ, but it is not clear from their analysis the extent to which the estimated delayed effect in sales is statistically significant. Alternatively, we could use the estimates of Assmus, Farley and Lehmann (1984) in their meta-analysis of 114 papers, and use an average parameter value of λ = 0.46, with a standard deviation of σ = 0.30. However, we do not consider any these approaches appropriate so we propose a different approach, using impulse response functions (Dekimpe and Hanssens, 1995, 1999), a method which, applied to the estimation of λ, to our knowledge has not previously been reported in the literature.Impulse response functions are based on the results obtained from a vector auto regressive (VAR) model. The mathematical specification of the VAR model requires stationarity in the series used, meaning that the properties of mean and variance in the series are maintained over time (albeit on a trend). If the series are not stationary, we should calculate the first difference to achieve the objective of stationarity. The Augmented Dickie-Fuller test, Table 2, shows that the sales series and the advertising variables are stationary, thus allowing the VAR analysis to be performed at level.In economic terms, stationarity in the sales series indicates to us that the impact of impulses on sales is temporary and that once the sales have been diverted by innovations (for example, advertising), sales will recover their average value after a certain time, which would imply that the series reverts back to its average market share (Dekimpe and Hanssens 1999). That is, when we broadcast a campaign it would have two effects; one, a boost in sales and,
CALCULATION OF MARKETING ROI IN MARKETING MIX MODELS, FROM ROMI, TO MARKETING-CREATED VALUE FOR SHAREHOLDERS, EVAM
UNIVERSIA BUSINESS REVIEW | FOURTH QUARTER 2016 | ISSN: 1698-5117
30 two, an increase in awareness. In order to maintain these effects we must continue to advertise, because otherwise the effect on sales will gradually diminish once we stop advertising, falling to a level similar to the initial one. If the series is not stationary, the effect of the impact would be permanent, diverting it from its original properties; for example, we broadcast a campaign and this increases our sales, and then we stop running it and sales are maintained at the new level achieved.Impulse Response Functions using the VAR modelThe following equation shows the VAR model used for K = 2 delays determined by the Hannan-Quinn (1979) criteria and which for stationary series is as follows:
Yi,t is the vector (6x1) of endogenous variables: Sales, GRPS 20”, GRPS 20” SA, Press, Internet and GRPS 20” of Main Competitor. A is the constants vector (6x1), B(k)i the coefficient matrix (6x6) for lag k, Ci,t the vector of exogenous variables including seasonal variables that affect the sales series and Ui,t~N(0,Σu) the covariance matrix of the residuals. Once the VAR model has been estimated, its calculated its equivalent vector of infinite-order moving averages, which will allow us to know the response of sales to an impulse in advertising variables of 1 standard deviation. In Figure 1 we can see graphs showing the sales response to the increase of advertising variables, with a confidence interval of 95% obtained through bootstrapping using the Gretl program.
Table 2. Augmented Dickie-Fuller test, with constant, of the advertising variables
VARIABLE T STATISTIC
Sales -4.83***
GRPS 20” -7.40***
GRPS 20” SA -5.59***
Press -9.40***
Internet -4.23***
GRPS 20” Main Competitor -7.79***
*** Significant at 0.1%

MARIANO MÉNDEZ SUÁREZ & MACARENA ESTEVEZ
UNIVERSIA BUSINESS REVIEW | FOURTH QUARTER 2016 | ISSN: 1698-5117
31
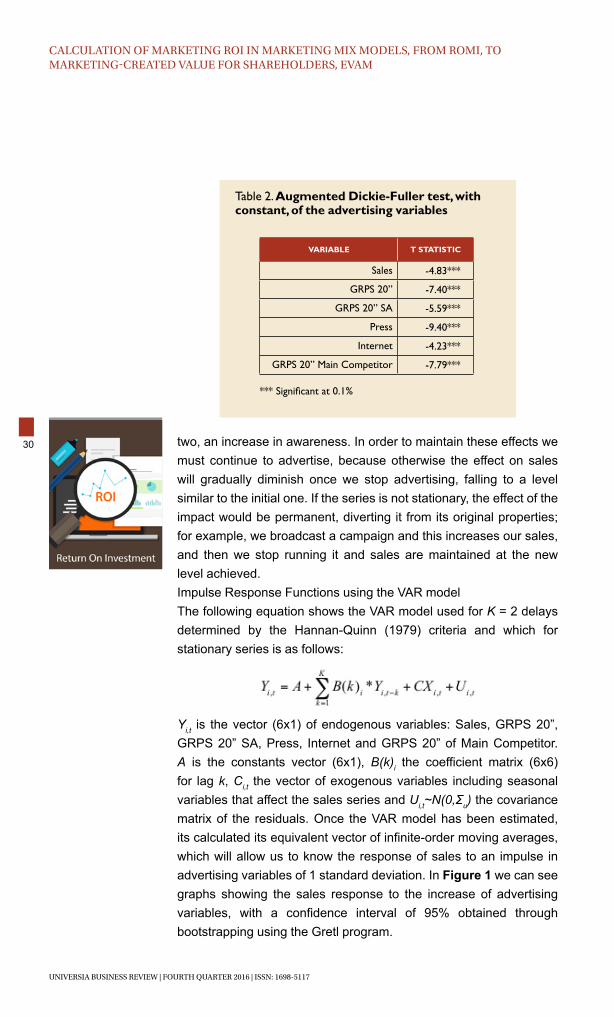
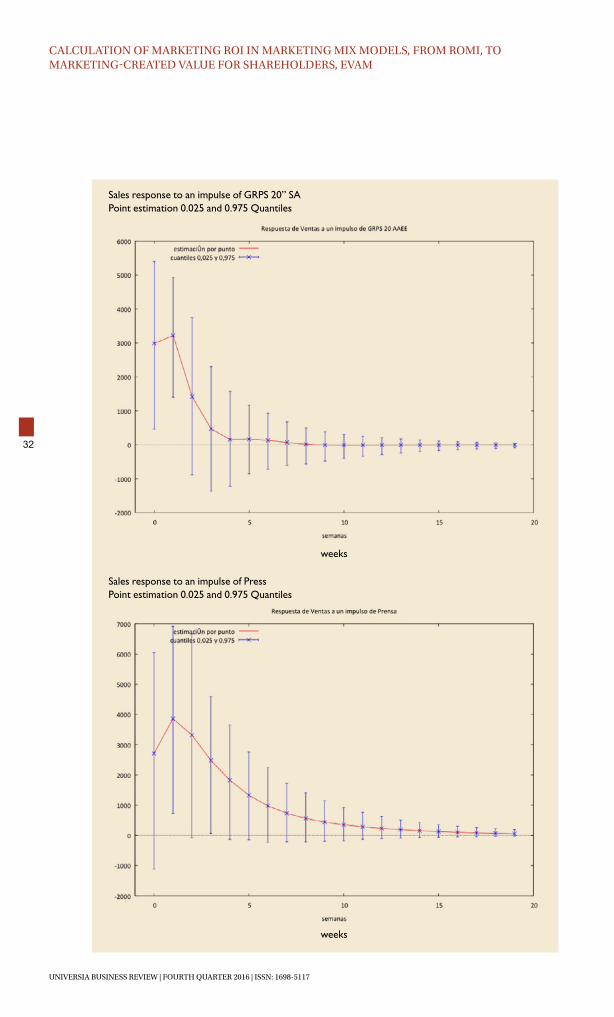
Once we have obtained the response of sales to the increase in advertising variables we can then estimate their duration with a confidence interval of 95% and assume that there is no effect when the confidence interval line includes 0. Based on this we can establish as a hypothesis that the response decays to 90% in the middle of the week where it disappears definitively, thereby obtaining the value that will allow us to estimate λ, Table 3.We can see that we get the longest-lasting effect from Internet advertising. We consider this result to be logical given that the product has an effect on health and that the advertising received while browsing the Internet may be given more attention, thus generating a longer-lasting impact over time. The next variable with
Figure 1. Graphs showing the Impulse Response of sales to advertising innovations with a 95% confidence interval
Sales response to an impulse of GRPS 20”Point estimation 0.025 and 0.975 Quantiles
weeks
CALCULATION OF MARKETING ROI IN MARKETING MIX MODELS, FROM ROMI, TO MARKETING-CREATED VALUE FOR SHAREHOLDERS, EVAM
UNIVERSIA BUSINESS REVIEW | FOURTH QUARTER 2016 | ISSN: 1698-5117
32
Sales response to an impulse of GRPS 20” SAPoint estimation 0.025 and 0.975 Quantiles
weeks
Sales response to an impulse of PressPoint estimation 0.025 and 0.975 Quantiles
weeks

MARIANO MÉNDEZ SUÁREZ & MACARENA ESTEVEZ
UNIVERSIA BUSINESS REVIEW | FOURTH QUARTER 2016 | ISSN: 1698-5117
33
Sales response to an impulse of InternetPoint estimation 0.025 and 0.975 Quantiles
weeks
Sales response to an impulse of GRPS 20” Main CompetitorPoint estimation 0.025 and 0.975 Quantiles
weeks

CALCULATION OF MARKETING ROI IN MARKETING MIX MODELS, FROM ROMI, TO MARKETING-CREATED VALUE FOR SHAREHOLDERS, EVAM
UNIVERSIA BUSINESS REVIEW | FOURTH QUARTER 2016 | ISSN: 1698-5117
34
Table 3. Estimation of λ
WEEK IN WHICH THE IMPULSE RESPONSE
DISAPPEARS
APPROXIMATE AVERAGE WEEK IN
WHICH THE RESPONSE DECAYS TO 90% (η)
ESTIMATION OFλ FOR A DECAY OF 90%. λ = LN
(0.1)/ η
GRPS 20” 3 2.5 λ = 0.4
GRPS 20” SA 2 1.5 λ = 0.2
Press 2 1.5 λ = 0.2
Internet 5 4.5 λ = 0.6
GRPS 20” Main Competitor No response - -
the greatest impact is GRPS 20”, followed by GRPS 20” SA and then Press. All these significant variables would be included in the model after performing the Adstock transformation, each one with its estimated λ coefficient. As we can see in Figure 1, the potential negative impact of GRPS 20” Main Competitor is not statistically significant at a confidence interval of 95%, which may be logical given that the potential negative impact is distributed among all competitors, and will therefore not be included in the model.
6. SALES MODELLING We will separate the variables that we will use to explain sales into three groups. The first includes the marketing mix variables: distribution, brand awareness, television advertising in different campaigns and formats and advertising in other media; the second includes information about competitors, such as price differentials with DBs; and the third group includes the economic and social factors that affect sales, such as the seasonality of the same, variations in the economic cycle, and interest in searching for the category on the Internet. The model responds to the following equation:
Yt is the value of the dependent variable Sales at time t, βi is the coefficient of independent variable xit at time t and εt is a white-noise error term. Although Gujarati (2004, pg. 168) recommends to always include a constant term in the regression models to avoid any specification problems and the risk of multicollinearity that results in a

MARIANO MÉNDEZ SUÁREZ & MACARENA ESTEVEZ
UNIVERSIA BUSINESS REVIEW | FOURTH QUARTER 2016 | ISSN: 1698-5117
35
greater variance of the coefficients (a less precise model), the author makes and exception when there is a strong a priori expectation. In our case, given the significant effort invested by the brand in maintaining a very high level of distribution, a strong emphasis is placed on knowing the individual effect of this variable and although the constant variable provides information about the sales baseline and will include the effect of distribution, we have decided not to include it and to use instead the weighted distribution variable.To know in more detail the relationship between the variables of the adjusted model we calculated the correlation matrix, which we can see in Table 4.
Table 4. Correlation matrix of the variables included in the adjusted model
CORRELATIONS 1 2 3 4 5 6 7 8 9 10 11 12
1. Sales 100%
2. Weighted Distribution % 25.3% 100%
3. Price diff. with DB -60.0% -18.5% 100%
4. PII SD 39.3% 2.1% -33.6% 100%
5. PII L 49.5% 17.2% -41.4% 11.2% 100%
6. PII TPR 36.1% 14.0% -37.2% 25.6% 30.6% 100%
7. GRPS 20" Ad40 19.1% -7.2% 27.2% -16.1% -1.9% -7.7% 100%
8. GRPS SA Ad20 25.9% -14.3% -15.9% 16.1% 7.5% -7.3% 109% 100%
9. Press € Ad20 18.2% 10.0% 6.5% 1.0% 11.5% 27.6% 25.6% -8.9% 100%
10. Internet € Ad60 35.0% 11.0% -36.1% 15.9% 36.1% 7.7% -2.2% 10.8% 10.4% 100%
11. Brand Awareness 27.3% 12.7% -35.0% 25.0% 31.6% 44.7% -32.9% -8.4% 12.8% 19.0% 100%
12. Search. Cat. Internet 55.3% 15.8% -60.2% 36.5% 23.6% 20.5% -15.0% 13.9% 4.3% 38.4% 22.6% 100%
Once the structure of the correlation matrix has been verified we will then create the model, Graph 1; since it has a R2 of 86.08% we interpret that we have captured 86% of the variability of the sales.The variables included in the model, their coefficients and percentage of contribution to the total sales of the entire period can be seen in Table 5.The regression coefficient indicates the variation in sales due to the increase in one unit in the explanatory variable, maintaining the rest constant. If the coefficient is positive it means that this variable has a positive contribution to sales and vice versa.

CALCULATION OF MARKETING ROI IN MARKETING MIX MODELS, FROM ROMI, TO MARKETING-CREATED VALUE FOR SHAREHOLDERS, EVAM
UNIVERSIA BUSINESS REVIEW | FOURTH QUARTER 2016 | ISSN: 1698-5117
36
Graph 1. Sales and estimated sales for the model. R2 = 86.08%
In Graph 2 we can see the individual contribution of the different marketing mix variables to the total sales. The weighted distribution is notable, accounting for 63.8% of sales, followed by brand awareness which contributes 32.4% of the sales. In third place is the negative effect of the price differential with the distributor brand which subtracts 15.2% from sales. The advertising variable, which is the sum of the advertising effect of all the media in the short term, contributes 6.8% to total sales.
7. ANALYSIS OF THE MODEL VARIABLES Weighted DistributionThe contribution of the weighted distribution variable to total sales is 63.8% and we can assume that a distribution as wide as that of the brand forms the basis of the sales baseline. This variable, although it could be likened to the constant of the regression, includes information that the constant would not clarify, for example, how sales would be affected by the loss of a specific market or the loss of a specific distribution channel.
Promotional Intensity IndexesThe sales obtained through promotions are the sum of the effects of the Promotional Intensity Indexes with Special Display (PII SD), the Promotional Intensity Index with Leaflets (IIP F) and the Promotional Intensity Index with Temporary Price Reduction (PII TPR), giving a joint sales contribution of 6.2%.

MARIANO MÉNDEZ SUÁREZ & MACARENA ESTEVEZ
UNIVERSIA BUSINESS REVIEW | FOURTH QUARTER 2016 | ISSN: 1698-5117
37
Table 5. Variables of the model, coefficients and the contribution of each to sales
VARIABLES OF THE MODELREGRESSION COEFFICIENT
SIGNIFICANCECONTRIBUTION
TO TOTAL SALES
Marketing Mix Variables
Weighted Distribution 2,254.41 *** 63.8%
Promotional Intensity Index with Special Display 3,846.17 *** 2.0%
Promotional Intensity Index Leaflets 1,419.76 *** 2.1%
Promotional Intensity Index Temporary Price Reduction
769.09 *** 2.1%
Gross Rating Points 20” with AdStock 0.4 49.48 *** 5.7%
Gross Rating Points 20” Special Actions with AdStock 0.2
205.44 *** 0.6%
Investment in Press in Euros with AdStock 0.2 0.48 *** 0.3%
Investment in Internet in Euros with AdStock 0.6 0.14 * 0.2%
Brand Awareness 1,188.29 *** 32.4%
Special Dummy Action May 2011 36,969.52 *** 0.1%
Special Dummy Action October 2013 24,568.46 *** 0.1%
Competitor-Related Variables
Differential Price with distributor brand -27,657.31 *** -15.2%
Social Environment, Macroeconomic and Seasonal Variables
Category search interest in Internet 326.56 *** 5.9%
Dummy First week of the month 8,458.72 *** 0.6%
Dummy Last week of the month 6,893.39 *** 0.4%
Dummy Easter Week -62,503.81 *** -0.4%
Dummy August Bank Holiday -24,541.24 *** -0.1%
Dummy December Bank Holiday -43,066.85 *** -0.2%
Dummy Week of Christmas Eve -75,482.25 *** -0.4%
Dummy Week of New Year’s Eve -74,859.59 *** -0.4%
Dummy Week of King’s Day -32,526.73 *** -0.2%
Dummy July -12,433.65 *** -0.3%
Dummy August -30,521.51 *** -0.8%
Dummy November -9,426.75 ** -0.2%
Dummy Years 2013-2014 21,746.94 *** 1.8%
*** Significant at 1%. ** Significant at 5%. * Significant at 10%. R2 = 86.08%.
Since the regression is performed without a constant, and to avoid the overestimation of the coefficient of determination R2 and to ensure that it is between 0 and 1, we use the alternative formula:
Yt is the value of the dependent variable in t, the estimated value of the variable and the average of the dependent variable.

CALCULATION OF MARKETING ROI IN MARKETING MIX MODELS, FROM ROMI, TO MARKETING-CREATED VALUE FOR SHAREHOLDERS, EVAM
UNIVERSIA BUSINESS REVIEW | FOURTH QUARTER 2016 | ISSN: 1698-5117
38 Short-term advertisingThis includes the variables television GRPs and investment in euros, in press and Internet, all of them transformed in Adstock. A large part of the advertising broadcasted consisted of providing information about the qualities of the product and its beneficial effect on health; the aim was not only to make sales in the short term but also to create brand awareness in the category in order to promote future sales.The contribution of television advertising in both campaigns and special actions (SA) accounts for 6.3% of sales. Advertising in Press and Internet has a joint sales contribution of 0.5%, giving us a total of 6.8%.
Brand AwarenessClary and Dyson (2004) state that the current effect of short-term advertising (represented by the variables with Adstock) on sales is insufficient for campaigns to be profitable. We need to also measure the accumulated effect of advertising in the long term in order to know the real return from advertising. In our case, a contribution of 6.8% from short-term advertising (and going by our experience over the years, the effect is usually less) to total sales does not justify the high economic volume invested since, as we will see later, we will obtain a negative ROMI. However, when reviewing the literature on the subject we see some interesting conclusions about the effects of short-term advertising. Driver and Foxal (1986) conclude that short-term advertising, apart from the function of generating sales, has other functions that relate to the long-term
Graph 2. Total contribution of the marketing mix variables to sales
63,84% 6,20% 6,79%
32,37%
-15,21%
WeightedDistribution
PromotionalIntensity
Advertising Brand Awareness Differential PriceDistributor Brand
MARIANO MÉNDEZ SUÁREZ & MACARENA ESTEVEZ
UNIVERSIA BUSINESS REVIEW | FOURTH QUARTER 2016 | ISSN: 1698-5117
39
effect: i) Advertising must be accumulated over time in order to reach a level whereby it is effective. ii) The actual recipients of the advertising are not necessarily existing consumers, the impact of advertising can have later effects. iii) Advertising instils habits that will be maintained by future advertising. iv) Advertising is subject to attrition and obsolescence and needs to be renewed. In addition, Aaker and Day (1974) studied the hierarchy of advertising effects and conclude that advertising influences awareness and that this in turn influences purchase behaviour. The accumulative effect of short-term advertising (Clark, Doraszelski, and Draganska 2009) is one of the most important factors for generating awareness.Huang and Sarigöllü (2012) conclude that with regard to consumer goods there is a positive relationship between awareness and sales results by means of the process: awareness -> test -> reinforce. We are aware that in order for this process to be effective it must be complemented with the contribution of distribution and price promotions (variables analysed separately in our model). Macdonald and Sharp (2000) find improvements in the brand’s results in the market in relation to awareness. They state that when consumers are choosing between products with a different level of awareness they show a greater predilection for the better-known products, according to the cycle: choose the product with greater awareness, try other products and then return to the product that has greater awareness. In our case there is a special circumstance, in that the product analysed has positive effects on health and in this case knowledge of the brand reduces the risk perceived by the consumer when making a purchase decision (Moisesku 2009), thereby increasing the likelihood to buy.Srinivasan, Vanhuele and Pauwels (2008) state the importance of including so-called mindset metrics in the marketing mix models, and especially the awareness variable. The results from their study reveal that metrics such as awareness have an effect on sales beyond the direct effects of advertising, price, distribution and promotions. They therefore insist on the need to include in these types of models perceptual metrics that allow the capture of the long-term positive effects of brand creation.Because of these reasons, we consider it appropriate to include this variable in the model, and to use it as an approximation to the long-term effect of advertising, although we are aware that awareness is a very rich variable and is generated by a greater number of variables

CALCULATION OF MARKETING ROI IN MARKETING MIX MODELS, FROM ROMI, TO MARKETING-CREATED VALUE FOR SHAREHOLDERS, EVAM
UNIVERSIA BUSINESS REVIEW | FOURTH QUARTER 2016 | ISSN: 1698-5117
40
than maybe: other communication channels, distribution or the product itself. In our model, the brand awareness variable contributes 32.37% to total sales, the second largest amount after distribution. And it may help to explain the long-term effect of advertising investment strategies in the creation of value for shareholders.
Dummies Special Actions May 2011 and October 2013Including these two dates in the model is due to two special actions which were carried out by the brand in these periods and together they had an impact of 0.2% on total sales.
PriceAs can be expected, the price differential with distributor brand has a negative impact on total sales, this being -15.2%.
Social Environment, Macroeconomic and Seasonal VariablesThese include variables that reflect changes in the environment, such as the interest in searching for the category on the Internet, which contributes 5.9% to sales and the incipient recovery of the Spanish economy in 2013 and 2014, with an impact of 1.8%. Moreover, variables that include the increases in sales in the first and last weeks of the month because of the payment of salaries and the opening of shopping centres in some Autonomous Communities in Spain on the first Sunday of every month, have a joint effect of 1.0%. Lastly, it includes variables that encompass the fall in sales due to seasonal factors, with a joint effect of -2.9%.To summarise, in Graph 3 we can see the individual weekly contribution to sales of the main variables analysed.
8. CALCULATION RETURN ON ADVERTISING: ROMI AND EVAMOnce we have created the model and isolated the contribution of each variable we will have the information we need to be able to quantify in economic terms the return on investment in advertising. In Graph 4 we show the sales generated by television, press and Internet advertising, which we consider to be short-term advertising, and the sales generated through brand awareness, which we consider to represent the long-term impact of advertising.

MARIANO MÉNDEZ SUÁREZ & MACARENA ESTEVEZ
UNIVERSIA BUSINESS REVIEW | FOURTH QUARTER 2016 | ISSN: 1698-5117
41
Graph 3. Individual weekly contribution of the model variables to sales
To illustrate the analysis of the calculation of the ROMI and EVAM we will take the entire year 2013, during which 5.9% of total sales were due to short-term advertising, and 29.9% to the effect of brand awareness or long-term advertising; the joint effect of both variables contribute 35.8% to total sales for the period. To calculate the ROMI and EVAM we will assume a gross margin of 50% (PWC, 2015, pg. 18) of large companies in the sector, for the investment cost we will use a WACC of 10% according to companies in the sector and we will assume a tax rate of 30%, in accordance with the current rates in Spain.
Graph 4. Contribution of short-term advertising and brand awareness to sales

CALCULATION OF MARKETING ROI IN MARKETING MIX MODELS, FROM ROMI, TO MARKETING-CREATED VALUE FOR SHAREHOLDERS, EVAM
UNIVERSIA BUSINESS REVIEW | FOURTH QUARTER 2016 | ISSN: 1698-5117
42
In light of this information and following the previously explained step by step process to calculate the incremental revenue, we obtain the results detailed in Table 6, which shows the financial results of short-term advertising broken down into television, press and Internet and the sum of the effects of short-term advertising and brand awareness representing the long term.If we only take into account the short-term advertising, the ROMI is -33%, and once we subtract the WACC of 10% we get an advertising return of -43%, the EVAM for the period would have been -1.9 M Euros; that is, we would have destroyed value for shareholders of this amount. To calculate the economic impact of brand awareness we do not include the investment made, which would be represented by the accumulated advertising, the investment made in distribution and promotional campaigns of the previous years, given that in financial terms these can be considered sunk costs, costs that are never included when evaluating an investment. By adding the effect of brand awareness the result is totally different, in this second case the ROMI is 308%, and if we subtract the 10% of WACC we get a return of 298% and this would have created value of 9.2 M euros for EVAM shareholders.
Table 6. ROMI, Return and EVAM of the short-term effect, only advertising and long term, advertising and brand awareness
RETURN ON ADVERTISING INVESTMENT
ROMI WACC RETURN EVAM
Short-term effect of Advertising: TV + Press + Internet Advertising
-33% 10% -43% - € 1,954,907
Combined effect of Advertising, a stronger long-term effect represented by Awareness: Brand Awareness + TV advertising + Press + Internet
308% 10% 298% € 9,461,919
9. CONCLUSIONS, LIMITATIONS AND FUTURE LINES OF RESEARCHFor years there have been calls for the standardisation and clarification of the methods used for measuring ROMI (for example, IPA 2008 and Farris et al. 2015). However, the authors have not found real examples of their calculation, describing in detail the marketing mix econometric models needed to obtain them. These

MARIANO MÉNDEZ SUÁREZ & MACARENA ESTEVEZ
UNIVERSIA BUSINESS REVIEW | FOURTH QUARTER 2016 | ISSN: 1698-5117
43
same models also allow a calculation to be made of one of the most common measurements for creating value for shareholders, EVA, which has been adapted by the authors to measure marketing-created value, EVAM.The estimation of the value of λ for Adstock using impulse response functions is a transparent way of measuring the impact of advertising over time and it also allows us to know the significance of the estimations and to establish the decay rate of the advertising effect with greater accuracy.The study highlights the importance of measuring brand awareness and explains how to quantify it as a variable in the marketing mix models. In our case, this variable contributes 32.4% to the total sales of the brand during the period of study and is the second largest after distribution. If we only use short-term advertising to calculate the ROMI for 2013, we get a value of -33%, and the EVAM shows a value decrease for shareholders of -1.9 M euros. However, by adding the effect of brand awareness, the ROMI increases to 298% and the creation of value for shareholders is 9.4 M Euros.The proposed methodology meets three objectives: 1) In the day to day of marketing departments it allows them to measure the results or effectiveness of the activities carried out, and it can be used to reshape the marketing mix and to incentivise or disincentivise certain actions. 2) We can obtain information that shows us the economic efficiency and profitability of investments which, apart from being a key aspect for marketing departments, is also important for financial control departments. 3) As regards senior management and for communicating with shareholders, investors and analysts, the information about value creation through EVAM will result in a greater understanding of the investments made and will improve the information available to help them make more informed decisions about investment allocation.Regarding limitations, we would like to point out that this study has been conducted specifically for a product that affects health, and for which knowledge of the brand is a very important aspect when making a purchase decision, (Moisesku 2009), and we therefore believe that the results cannot be extrapolated to other product categories. But we do believe, however, that the methodology can be extrapolated, which is why we propose a future line of research, a broader study in which we can compare the results of ROMI and EVAM for other categories, especially those that do not have this

CALCULATION OF MARKETING ROI IN MARKETING MIX MODELS, FROM ROMI, TO MARKETING-CREATED VALUE FOR SHAREHOLDERS, EVAM
UNIVERSIA BUSINESS REVIEW | FOURTH QUARTER 2016 | ISSN: 1698-5117
44
potential health-risk component, and can compare the effects of short-term advertising and brand awareness in products with low perceived risk.
REFERENCES Aaker, D. A., Day, G. S. (1974). “A dynamic model of relationships among advertising, consumer awareness, attitudes, and behavior”. Journal of Applied Psychology, 59(3), 281.Assmus, G., Farley, J. U., Lehmann, D. R. (1984). “How advertising affects sales: Meta-analysis of econometric results”. Journal of Marketing Research, 65-74.Bucklin, R. E., Gupta, S. (1999). “Commercial use of UPC scanner data: Industry and academic perspectives”. Marketing Science, 18, 3, 247-273.Broadbent, S. (1979). “One way TV advertisements work”. Journal of the Market Research Society, 21, 3, 139-166.Clary, M., Dyson, P. (2004). “Building the case for long-term advertising”. Admap magazine, 4 February 2014Clark, C. R., Doraszelski, U., & Draganska, M. (2009). “The effect of advertising on brand awareness and perceived quality: An empirical investigation using panel data”. QME, 7(2), 207-236.Dekimpe, M. G., & Hanssens, D. M. (1995). “The persistence of marketing effects on sales”. Marketing Science, 14(1), 1-21.Dekimpe, M. G., & Hanssens, D. M. (1999). “Sustained spending and persistent response: A new look at long-term marketing profitability”. Journal of Marketing Research, 397-412.Driver, J. C., Foxall, G. R. (1986). “Optimal advertising: Adstock and beyond”. https://dspace.lib.cranfield.ac.uk/bitstream/1826/2901/1/M%20&%20L%2086-3.PDFFarris, P. W., Hanssens, D. M., Lenskold, J. D., & Reibstein, D. J. (2015).” Marketing return on investment: Seeking clarity for concept and measurement”. Applied Marketing Analytics, 1(3), 267-282.Fry, T. R., Broadbent, S., & Dixon, J. M. (1999). “Estimating advertising half-life and the data interval bias” (Working Paper No. 6/99). Monash University, Department of Econometrics and Business Statistics.Griffith, J.M. (2004). “The True Value of EVA®”. Journal of Applied Finance, 14, 2, 25-29.Gujarati, D., M. (2004).“Basic Econometrics”. New York: McGraw Hill.Hannan, E. J., Quinn, B. G. (1979). “The determination of the order of an autoregression”. Journal of the Royal Statistical Society. Series B (Methodological), 190-195.Huang, R., Sarigöllü, E. (2012). “How brand awareness relates to market outcome, brand equity, and the marketing mix”. Journal of Business Research, 65(1), 92-99.IPA (Institute of Practitioners in Advertising). (2008). “Measuring Marketing Payback”. http://www.ipa.co.uk/Document/Measuring-marketing-payback-PDF Kimbrough, M. D., Mcalister, L., Mizik, N., Jacobson, R., Garmaise, M. J., Srinivasan, S., Hanssens, D. M. (2009). “Commentaries and rejoinder to “marketing and firm value: metrics, methods, findings, and future directions””. Journal of Marketing Research, 46, 3, 313-329.Kotler P. (1977).”From sales obsession to marketing effectiveness”. Harvard Business Review, 55, 6, 67-75Lenskold Group. (2009 y 2011) “Marketing ROI & Measurement Study”. http://www.lenskold.com Macdonald, E. K., Sharp, B. M. (2000). “Brand awareness effects on consumer decision making for a common, repeat purchase product: A replication”. Journal of business research, 48(1), 5-15.
MARIANO MÉNDEZ SUÁREZ & MACARENA ESTEVEZ
UNIVERSIA BUSINESS REVIEW | FOURTH QUARTER 2016 | ISSN: 1698-5117
45
Mintz, O., Currim, I. S. (2013). “What drives managerial use of marketing and financial metrics and does metric use affect performance of marketing-mix activities?”. Journal of Marketing, 77(2), 17-40.Moisesku, O. I. (2009). “The Importance of Brand Awareness in Consumer’s Buying Decision and Perceived Risk Assessment”. Management & Marketing-Craiova, (1), 103-110.PWC. (2015) Retail & Consumer Insights 2015 Financial Benchmarking. Results for the food, beverage, and household products manufacturers. https://www.pwc.com/us/en/retail-consumer/financial-performance-report/assets/financial-performance-report.pdfRogers, D., Sexton, D. (2012). “Marketing ROI in the Era of Big Data: The 2012 BRITE/NYAMA Marketing in Transition Study”. Columbia Business School, New YorkSeggie, S. H., Cavusgil, E., Phelan, S. E. (2007). “Measurement of return on marketing investment: A conceptual framework and the future of marketing metrics”. Industrial Marketing Management, 36, 834-841Smyth, H., Lecoeuvre L. (2015). “Differences in decision-making criteria towards the return on marketing investment: A project business perspective”. International Journal of Project Management, 33, 1, 29-40Srinivasan, S., Vanhuele, M., Pauwels, K. (2008). “Do mindset metrics explain brand sales?” Marketing Science Institute.Steward, D. W., Henderson Blair, M., Holmes, W., Barns, M., Duffy, M., Riskey, D., Sirkin, K. (2005). “Contributing to the Bottom Line: Marketing Productivity, Effectiveness and Accountability”.The Board Room Project. http://www.themasb.org/wp-content/uploads/2009/04/marketing-productivity-effectiveness-and-accountability-tbp-july-20051.pdf.
NOTES 1. Acknowledgements: We would like to acknowledge the valuable contributions of the editor and an anonymous reviewer. This paper is part of the research project 06/16 funded by ESIC Business & Marketing School in collaboration with CONENTO2. Contact author: ESIC Business & Marketing School; Av. Valdenigrales s/n; 28223 Pozuelo de Alarcón (Madrid); SPAIN3. www.google.com/trends
UNIVERSIA BUSINESS REVIEW | CUARTO TRIMESTRE 2016 | ISSN: 1698-5117
4646
1. INTRODUCCIÓNExiste una presión creciente por parte de la alta dirección de los inversores y analistas financieros para que los departamentos de marketing de las grandes compañías informen sobre la rentabilidad de las inversiones en las campañas realizadas, debido a la gran cantidad de recursos económicos que gestionan. Según las cuentas anuales del año 2014 de la compañía de telecomunicaciones Jazztel, su inversión en marketing y atención al cliente fue de un total de 214,7M de Euros, frente a una inversión en despliegue de fibra óptica (cuya explotación es su actividad principal) de 359,7M de Euros, es decir, la compañía invirtió en actividades de marketing un equivalente a casi un 60% de la inversión en activo fijo.Mientras que las inversiones en activo fijo son siempre evaluadas desde un punto de vista estrictamente financiero, con métricas claras y ampliamente aceptadas, como por ejemplo, el retorno sobre la inversión (Return on Investment, ROI) o el valor económico añadido (Economic Value Added, EVA) y la información siempre se traslada de forma detallada a los accionistas, analistas e inversores para que puedan tomar sus decisiones de asignación de recursos. Las inversiones en marketing no siempre están suficientemente
Cálculo del ROI de marketing en modelos de marketing mix, del ROMI, al valor creado del marketing para los accionistas EVAM1
Recibido: 17 de noviembre de 2015. Aceptado: 16 de octubre de 2016 DOI: 10.3232/UBR.2016.V13.N3.01 CÓDIGO JEL: G30, M31, M37
Calculation of marketing ROI in marketing mix models, from ROMI, to marketing-created value for shareholders, EVAM
Mariano Méndez Suárez2
ESIC Business & Marketing [email protected]
Macarena [email protected]
UNIVERSIA BUSINESS REVIEW | CUARTO TRIMESTRE 2016 | ISSN: 1698-5117
4747
RESUMEN DEL ARTÍCULOEn el presente artículo explicamos mediante un ejemplo real de un producto de gran consumo la construcción de un modelo de Marketing Mix para el cálculo del retorno de la inversión en marketing (ROMI) como métrica de rentabilidad y el cálculo del valor económico añadido del marketing (EVAM) como métrica de creación de valor para los accionistas. Proponemos un método novedoso para la estimación del coeficiente λ del modelo de Adstock mediante funciones de impulso respuesta. Medimos la rentabilidad de la publicidad a corto plazo y el efecto conjunto de la publicidad a corto y a largo plazo utilizando para ello la variable notoriedad de marca medida a través de un tracking de marca a lo largo de todo el periodo analizado. El resultado del análisis indica que la publicidad a corto plazo tiene un retorno negativo que pasa a ser muy positivo cuando tenemos en cuenta su efecto combinado con la notoriedad de marca.
EXECUTIVE SUMMARYIn this paper we explain using a real example of a fast consumer good the construction of a Marketing Mix model for calculating the return on marketing investment (ROMI) as a metric of profitability and the calculation of economic value added of marketing (EVAM) as a metric of shareholders value creation. We propose a novel approach for estimating the coefficient λ of the Adstock model using impulse response functions. We measure the return of short-term advertising and its combination with long-term using as a variable brand awareness measured with a tracking throughout the entire period analyzed. The result of the analysis indicates that short-term advertising has a negative return which happens to be very positive when we consider the combined effect with brand awareness.

CÁLCULO DEL ROI DE MARKETING EN MODELOS DE MARKETING MIX, DEL ROMI, AL VALOR CREADO DEL MARKETING PARA LOS ACCIONISTAS EVAM
UNIVERSIA BUSINESS REVIEW | CUARTO TRIMESTRE 2016 | ISSN: 1698-5117
48
explicadas y debido a la falta de transparencia es complicado para los inversores saber si éstas crean valor o no y en consecuencia si la inversión que se destina a las mismas aporta o no valor a los accionistas (Kimbrough et al. 2009). A pesar de la importancia en la transmisión de la información al mercado del resultado de las estrategias de marketing, todavía hay poco acuerdo en cómo medir la rentabilidad de éstas, incluso dentro de las propias organizaciones.En 1999 Bucklin y Gupta ya abogaban por la estandarización de los métodos de evaluación de la rentabilidad del marketing, debido a la heterogeneidad y opacidad de los utilizados, especialmente por parte de las compañías consultoras. En 2005, Steward et al. desde
la Fundación “The Marketing Accountability Foundation” indican la necesidad de que, aparte de las métricas tradicionales (por ejemplo: notoriedad, intención de compra o recomendación de marca), los resultados de las acciones de marketing sean medibles financieramente con métricas como el Retorno de la Inversión en Marketing (ROMI, Return on Marketing Investment). Desde la Fundación se promueve que se adopten procedimientos estándar, de forma que las rentabilidades obtenidas puedan ser objeto de seguimiento y comparación temporal y transversal por las partes interesadas. Más recientemente Farris et al. (2015) insisten en la estandarización de la definición del ROMI debido a que cada vez tiene mayor aceptación, pero en muchos casos se utiliza e interpreta de formas muy distintas.
El objetivo de este artículo, es explicar y clarificar el cálculo de las métricas financieras del retorno de la inversión en marketing y de estimación del valor creado para los accionistas, especialmente por los efectos a corto y a largo plazo de la publicidad. En la siguiente sección analizamos la implantación de estas métricas financieras. Después definiremos y pondremos un ejemplo de cálculo del retorno de la inversión en marketing (ROMI) y del valor económico añadido en marketing (EVAM, Economic Value Added of Marketing). A continuación, utilizando datos de un proyecto realizado para una compañía de gran consumo, crearemos el modelo econométrico para obtener la aportación de las principales variables que afectan a las ventas y de esta forma poder calcular el ROMI y el EVAM. Finalizamos con las conclusiones, limitaciones y futuras líneas de investigación.
El objetivo de este
artículo, es explicar y
clarificar el cálculo de
las métricas financieras
del retorno de la inver-
sión en marketing y de
estimación del valor
creado para los
accionistas
MARIANO MÉNDEZ SUÁREZ Y MACARENA ESTEVEZ
UNIVERSIA BUSINESS REVIEW | CUARTO TRIMESTRE 2016 | ISSN: 1698-5117
49
2. EL USO DE LAS MÉTRICAS FINANCIERAS Y LAS TRADICIONALES EN MARKETING Desde la definición del concepto de efectividad de marketing de Kotler (1977), ha habido un progresivo interés en el desarrollo de métodos cuantitativos para poder medir el retorno financiero de las acciones de marketing, especialmente la publicidad, con el objetivo de demostrar que éstas son una inversión de la que se espera obtener un beneficio y no un gasto del cual el retorno no es cuantificable. Especialmente en las grandes empresas con alta inversión en publicidad, cada vez es más común que se solicite el cálculo del ROMI como medida de la rentabilidad financiera de las acciones realizadas para demostrar que éstas contribuyen a la creación de valor para los accionistas.Para poder conocer la implantación de la métrica, Lenskold Group realizó en 2009 y 2011 sendos estudios titulados: Marketing ROI & Measurement Study solicitando información sobre el uso de métricas financieras para evaluar el desempeño de marketing, en ambos es-tudios se observa una tendencia creciente en el uso del ROMI. En el estudio de 2011 un 28% de los encuestados declaraba usar el ROMI como indicador de rentabilidad frente a un 36% que declaraban usar alguna otra métrica financiera. Cabe destacar que en el estudio de 2009 la respuesta sobre el uso del ROMI se desagrega en dos grupos, por un lado las empresas consideradas como “altamente eficaces y efectivas” y por otro lado el resto de empresas consultadas. Resulta muy esclarecedor que de las primeras un 54% declarara usar el ROMI como métrica financiera principal frente a un 29% de las segundas.Rogers y Sexton (2012) realizan un estudio que es más explicito so-bre el uso de métricas más tradicionales como notoriedad de marca, intención de compra, o recomendación de marca. De los encuestados un 22% tomaba la mayoría de sus decisiones usando sólo la notorie-dad de marca y de éstos un 60% usaban sólo esta métrica para medir la rentabilidad de sus acciones. En un 82% de los encuestados había confusión sobre el concepto de ROMI, dado que no mencionaron que relaciona la inversión en marketing con el retorno financiero.Por otro lado, en la encuesta de Mintz y Currim (2013) se desagregan los resultados del uso de métricas de marketing en función de los canales mayoritarios para la emisión de publicidad y crean un ranking en el que éstas son ordenadas en función de su uso. Para las empre-sas que realizan publicidad tradicional, entiéndase ésta como la que tiene un alto componente de publicidad en televisión, la métrica más utilizada es la notoriedad de marca con un 60% de los casos, el ROMI
KEY WORDSMarketing Mix modeling, return on Marketing investment ROMI, economic value added of Marketing EVAM, Modeling Advertising Effectiveness.
PALABRAS CLAVEModelos de Marketing Mix, retorno de la inversión en Marketing ROMI, valor económico añadido del Marketing EVA, modelización de la eficacia publicitaria.

CÁLCULO DEL ROI DE MARKETING EN MODELOS DE MARKETING MIX, DEL ROMI, AL VALOR CREADO DEL MARKETING PARA LOS ACCIONISTAS EVAM
UNIVERSIA BUSINESS REVIEW | CUARTO TRIMESTRE 2016 | ISSN: 1698-5117
50
ocupa un puesto 7 con un 32% y el EVAM un puesto 27 con un 4%.Los datos analizados sobre el uso de métricas financieras en mar-keting nos indican que sigue existiendo la necesidad de adaptarlas al lenguaje de la alta dirección, accionistas e inversores a través de herramientas como el ROMI o el EVAM.
3. DEFINICIÓN Y EJEMPLO DE CÁLCULO DEL ROMI Y DEL EVAMFarris et al. (2015) definen el ROMI como el resultado de dividir el incremento de valor financiero creado por las acciones de marketing neto de la inversión en estas acciones entre la inversión en marke-ting. Para calcular el incremento de valor financiero calculamos la diferencia entre las ventas realizadas después de las acciones de marketing (o ventas incrementales) y las ventas esperados, caso de no haberlas realizado (o ventas de nivel base). Para la obtención de las ventas incrementales se utilizan modelos econométricos cuya creación ilustraremos más adelante. Una vez aisladas las ventas incrementales, el proceso de cálculo es el siguiente: 1) multiplicamos estas ventas por el precio obteniendo el ingreso incremental; 2) multiplicamos estas ventas por su coste variable obteniendo el coste variable incremental; 3) hallamos la di-ferencia de forma que obtenemos el margen bruto incremental; 4) a este valor le restamos la inversión realizada en marketing; 5) dividi-mos el valor obtenido por la inversión en marketing, obteniendo de esta forma el ROMI:
Ingreso Incremental
- Coste Variable Incremental Margen Bruto Incremental
- Inversió en Marketing - Inversió en Marketing Beneficio Incremental
ROMI = ------------------------------- = ------------------------------- = -------------------------------
Inversió en Marketing Inversió en Marketing Inversió en Marketing
El resultado de la operación se puede interpretar bien como euros ganados/perdidos por euro invertido, o bien, como porcentaje de ren-tabilidad sobre la inversión realizada en publicidad. Por ejemplo, un ROMI = 0,3 indicaría que hemos ganado 30 euros por cada 100 euros invertidos o bien que la campaña ha tenido una rentabilidad del 30%. En el caso de que el valor hubiera sido negativo de ROMI = -0,3,
MARIANO MÉNDEZ SUÁREZ Y MACARENA ESTEVEZ
UNIVERSIA BUSINESS REVIEW | CUARTO TRIMESTRE 2016 | ISSN: 1698-5117
51
hemos perdido 30 euros por cada 100 euros invertidos o bien una rentabilidad del -30%.En este cálculo no se incluyen los costes fijos ni las amortizaciones, dado que asumimos que éstos no varían por las ventas incrementa-les generadas por la campaña. Cabría preguntarse por la no inclusión del impuesto sobre el beneficio en la formula, ni del ahorro fiscal al ser considerada la publicidad un gasto fiscalmente deducible, pero debido a que hacemos un cociente entre ambos y a pesar de que los valores absolutos disminuirán, la proporción se mantendrá constan-te:
Beneficio Incremental (1-T) Beneficio Incremental
ROMI = --------------------------------- = ---------------------------------
Inversió en Marketing (1-T) Inversió en Marketing
Una vez obtenido el ROMI, hemos de restar el coste de los recursos financieros de la empresa. Este coste es el coste medio ponderado del capital, o por sus siglas en inglés wacc (weighted average cost of capital) que es un promedio del coste de las deudas a largo plazo y de la rentabilidad requerida por los accionistas, o coste del capital. En algunos casos, determinadas compañías usan un valor superior al wacc conocido como rentabilidad mínima exigida (hurdle rate). La diferencia entre el ROMI y el wacc nos indica la rentabilidad obtenida de la campaña:
Rentabilidad = ROMI - wacc
El siguiente paso es calcular el EVAM. Seggie, Cavusgil, y Phelan (2007) se refieren a éste como una métrica que permite comunicar los resultados fuera de los departamentos de marketing, especial-mente a los accionistas, dado que no deja lugar a controversias cau-sadas por las opiniones subjetivas. Smyth y Lecoeuvre (2015) indi-can su pertinencia para aplicarlo a la medición del valor creado para los accionistas de las estrategias de marketing.Financieramente, el EVA mide la aportación de valor para la empresa de las inversiones realizadas después de detraer su coste de finan-ciación; se calcula restando al beneficio antes de intereses y después de impuestos la inversión realizada multiplicada por el coste del ca-pital (para ampliar la información sobre el EVA se puede consultar Griffith 2004). Adaptando la fórmula a los beneficios incrementales
CÁLCULO DEL ROI DE MARKETING EN MODELOS DE MARKETING MIX, DEL ROMI, AL VALOR CREADO DEL MARKETING PARA LOS ACCIONISTAS EVAM
UNIVERSIA BUSINESS REVIEW | CUARTO TRIMESTRE 2016 | ISSN: 1698-5117
52
obtenidos en las acciones de marketing podemos calcular el EVAM como:
EVAM = Beneficio Incremental (1-T) – Inversió en Marketing x wacc
Para ilustrar con un ejemplo el cálculo del ROMI y del EVAM esta-blecemos las siguientes hipótesis: ventas incrementales de 100.000 unidades precio de 9 Euros y coste variable de 6 Euros. Inversión en marketing de 200.000 Euros, wacc del 10% y tasa impositiva del 30%. El ROMI sería:
100,000 x 9
-100,000 x 6 300,000
- 200,000 - 200,000 100,000
ROMI = ------------------ = ------------------ = ----------------- = 0.5
200,000 200,000 200,000
Obtenemos un ROMI del 50% al que hemos de restar el wacc del 10% obteniendo una rentabilidad de la inversión del 40%. El EVAM sería en este caso de 50.000 Euros:
EVAM = 100,000 x (1-0.3) – 200,000 x 0.1 = 70,000 – 20,000 = 50,000
A continuación, basándonos en uno de los trabajos realizados para una compañía de gran consumo, ilustraremos la creación del modelo econométrico para hallar las ventas incrementales y posteriormente el cálculo del ROMI y del EVAM obtenidos.
4. DATOSPara explicar el proceso de obtención de las ventas incrementales, utilizaremos los datos de un producto líder en España en la categoría de productos lácteos con propiedades beneficiosas salud y con un alto nivel de inversión publicitaria, especialmente en televisión. La serie consta de 298 observaciones con periodicidad semanal y acumulada a los domingos entre los años 2009 y 2014. Este periodo es especialmente complicado para la modelización, dado que incluye tanto el punto álgido de la crisis económica acaecida en España, como el inicio de la recuperación de los años
MARIANO MÉNDEZ SUÁREZ Y MACARENA ESTEVEZ
UNIVERSIA BUSINESS REVIEW | CUARTO TRIMESTRE 2016 | ISSN: 1698-5117
53
2013 y 2014. Las ventas de la categoría tienen un alto componente estacional, con influencias positivas de las primera y última semanas del mes y con caídas de ventas muy acusadas en los meses de verano, noviembre, puentes, periodos vacacionales y en el periodo navideño. La base de datos inicial consta de más de mil variables con datos tanto de la propia compañía, como de la competencia y del sector así como otras variables económicas. Esta base de datos aparte del cálculo del ROMI, permite analizar otros aspectos del desempeño de marketing de la marca, como puede ser el cálculo de las elasticidades precio o cruzadas, elasticidades de la publicidad, etc. o bien medir el impacto de las campañas protagonizadas por diferentes “celebrities” o en acciones especiales. Y también medir eficacia del posicionamiento en el primer y último anuncio después de los cortes publicitarios.Tras una especificación inicial se procede al proceso de modelización econométrica. Este proceso consiste en plantear cuáles son las variables relevantes a analizar y que a priori se considera que explicarán en mejor medida y de forma significativa las variaciones de las ventas a lo largo del periodo analizado. A continuación describimos estas variables:
Ventas en volumen (Ventas)Las ventas corresponden exclusivamente a un único producto de la marca y vienen medidas en litros. Al incluir la variable ventas en litros como variable dependiente del modelo, cabría pensar que tendría más sentido utilizar una medida de las ventas en Euros, en vez de una medida en volumen y más teniendo en cuenta que se busca medir el retorno de la inversión en marketing, el problema es que las ventas en Euros es una combinación lineal de las variables ventas en volumen y precio, de forma que si usamos esta variable perdemos la información del impacto del precio en las ventas ya que las variaciones de estas no sabremos si se deben al precio o al volumen. Por otro lado, técnicamente y teniendo en cuenta la metodología usada por la regresión lineal, el hecho de introducir las ventas en valor económico genera algunos problemas y distorsiones a la hora de dirimir la variable causante de la variación de las ventas. Por ejemplo, si partimos de una semana dada en la que las ventas son de 100 unidades y el precio es de 1 Euro, en este caso, la variable ventas en Euros tendría un valor de 100 Euros.

CÁLCULO DEL ROI DE MARKETING EN MODELOS DE MARKETING MIX, DEL ROMI, AL VALOR CREADO DEL MARKETING PARA LOS ACCIONISTAS EVAM
UNIVERSIA BUSINESS REVIEW | CUARTO TRIMESTRE 2016 | ISSN: 1698-5117
54
Una semana después realizamos una disminución de precio a 0,8 Euros acompañada de una campaña de televisión para anunciar la bajada, suponemos que el efecto conjunto de estas dos variables supone un aumento de ventas a 120 unidades y nuestra variable ventas en Euros pasa a ser de 120x0,8 = 96 Euros. La información que recibiría el modelo econométrico sería una disminución de ventas en Euros de un 4% pasando de 100 a 96 Euros (cuando en realidad las ventas en volumen habrían aumentado en un 20%) y un aumento de la inversión en publicidad, lo que el modelo interpretaría como una correlación negativa entre publicidad y ventas al no detectar el efecto precio. Sin embargo, si utilizamos las ventas en volumen aportaríamos al modelo una información bien distinta que no provocaría distorsiones de lógica económica: el aumento de las ventas de 100 a 120 unidades es debido al efecto conjunto de dos variables, por un lado la bajada de precio y por otro el aumento de la publicidad.
Distribución ponderadaLa distribución ponderada es una medida de la calidad de la distribución de un producto, nos indica el porcentaje de supermercados o grandes superficies en las que se vende, pero ponderando este porcentaje por el volumen total de ventas de la categoría en cada centro, es decir, a mayor volumen de ventas en los centros en los que estamos, mayor distribución ponderada. El producto tiene distribución ponderada media del 99,9% y la marca demostró gran interés en conocer cuál es el impacto en ventas de esta variable dado el alto nivel de inversión de su mantenimiento.
Índices de Intensidad PromocionalEstos índices se obtienen dividiendo las ventas realizadas en promoción entre el total de ventas. En nuestro caso se incluyen tres tipos distintos de promociones; Índice de Intensidad Promocional en Exposición Especial (IIP EE); Índice de Intensidad Promocional con Folletos (IIP F), y el Índice de Intensidad Promocional en Reducción Temporal de Precios (IIP RTP).
Gross Rating Points de televisión (GRPS) a 20” y GRPS a 20” Acciones Especiales (AAEE)La medida GRPS sólo tiene en cuenta a las personas que han visto el anuncio emitido y forman parte del público objetivo, excluyendo

MARIANO MÉNDEZ SUÁREZ Y MACARENA ESTEVEZ
UNIVERSIA BUSINESS REVIEW | CUARTO TRIMESTRE 2016 | ISSN: 1698-5117
55
a las que lo han visto pero no forman parte de este público. Es el producto de dos variables que son, el porcentaje de nuestro público objetivo que ha visto el anunció y el número de veces que lo ha visto multiplicado por 100. Por tanto los GRPS son una medida de presión publicitaria exclusivamente sobre nuestro público objetivo, de forma que 200 GRPS podría significar que el 100% de nuestro público objetivo ha visto el anuncio 2 veces o que el 50% de este lo ha visto 4 veces. El hecho de usar esta variable en vez de inversión en euros se debe a que como ocurría en el caso de las ventas la inversión en Euros es una combinación lineal de dos variables, número de GRPS y precio de estos, de forma que si por ejemplo, se da una bajada de precios en los GRPS por circunstancias del mercado televisivo, el modelo econométrico la interpretaría como una disminución en la publicidad (introduciendo una distorsión en el análisis) cuando en realidad el nivel de presión publicitaria se mantiene constante.Dado que las campañas de televisión se componen de anuncios con varias duraciones en cada campaña, en nuestro caso 11 duraciones distintas desde los 5 segundos a los 120 segundos, es necesario homogeneizar estos formatos a un único de 20 segundos, por ejemplo, 2 anuncios vistos de 30 segundos son equivalentes a 3 de 20 segundos. Los datos los proporciona la empresa de audimetría Kantar Media.
Inversión en publicidad en prensa e InternetEn este caso y dado que no se disponía de una medida equivalente a los GRPS de televisión para estas variables, se utiliza directamente la inversión publicitaria en Euros, aún a riesgo de sufrir algunas desviaciones por las fluctuaciones de los precios a lo largo del tiempo.
Notoriedad de marcaLa variable notoriedad de marca se expresa en porcentaje y para su estimación se usan datos de los tracking de marca elaborados por el Instituto IPSOS. Cuantifica las respuestas a la pregunta: ¿antes de hoy ha oído hablar de la marca…? respecto al número total de encuestados. Para el tracking se realizaron durante todo el periodo de análisis 700 entrevistas telefónicas semanales mediante submuestras diarias de 100 entrevistas, dando un total de 36.500 entrevistas por año. Tal y como se puede observar en la Tabla 1, los valores oscilan entre un valor mínimo del 84%, una media del 96%

CÁLCULO DEL ROI DE MARKETING EN MODELOS DE MARKETING MIX, DEL ROMI, AL VALOR CREADO DEL MARKETING PARA LOS ACCIONISTAS EVAM
UNIVERSIA BUSINESS REVIEW | CUARTO TRIMESTRE 2016 | ISSN: 1698-5117
56
y un máximo de 100% y representan el porcentaje de personas que conocen la marca.
Diferencial de precio con la marca de distribución (MMDD)Esta variable mide el impacto del precio en las ventas. Para calcularla se suman las ventas totales semanales en valor (deflactadas por el IPC) de todas las marcas de distribución y se dividen por las ventas totales semanales de todas estas marcas en volumen dando el precio medio semanal, una vez obtenido el dato se resta al precio de la propia marca para averiguar el diferencial.
Interés en la búsqueda de la categoría en InternetEsta variable, mide la frecuencia de búsqueda de las palabras clave relacionadas con las propiedades beneficiosas para la salud de la marca, cubriendo todo el periodo analizado en la regresión, desde 2009 hasta 2014. Los datos, proporcionados por las tendencias de búsqueda Google3, son el resultado de dividir el número de búsquedas de las palabras clave entre el número total de búsquedas en Google en el mismo tiempo y lugar. Para indexar estos valores de 0 a 100, los valores obtenidos por este cociente se dividen por el dato más alto en todo el rango y se multiplican por 100.
Variables estacionales “Dummy”Dentro del modelo se introducirán algunas variables “dummy” o ficticias que toman valores de 0 ó 1, y representaran factores como la estacionalidad. Por ejemplo variable dummy puente de mayo, toma valor 1 en la semana en la que ocurre el puente de mayo y el resto del tiempo toma valor 0. Para poder incluir estas variables en el modelo es necesario que la marca confirme que el fenómeno es un hecho aislado y puntual.En la Tabla 1 se puede observar el resumen estadístico de las variables incluidas en el modelo.

MARIANO MÉNDEZ SUÁREZ Y MACARENA ESTEVEZ
UNIVERSIA BUSINESS REVIEW | CUARTO TRIMESTRE 2016 | ISSN: 1698-5117
57
5. CREACIÓN DEL MODELOAnálisis de la duración del efecto de la publicidad a corto plazo en las ventas, AdstockComo efecto a corto plazo de la publicidad entendemos el impacto en las ventas producido por esta en la propia semana y en las posteriores a la emisión (no hemos de confundirlo con el efecto a largo plazo, meses o años y que representaremos mediante la variable de notoriedad). La duración del impacto de la publicidad a corto plazo se mide mediante el modelo de Adstock (Broadbent, 1979). El modelo cuantifica el efecto directo sobre el aumento en ventas que puede tener una campaña a lo largo de las semanas posteriores a su emisión y su disminución a través de un modelo de decaimiento geométrico:
Adstockt = Publicidadt + λ Adstockt-1
Donde Publicidadt puede ser GRPS o cualquier otra medida de inversión publicitaria, como inversión en Euros, en el momento t. El parámetro λ cuantifica el efecto que en esta semana tiene la publicidad de la semana anterior. Por ejemplo, un λ = 40% implica
Tabla 1. Estadísticos descriptivos de las variables utilizadas en el modelo
MÍNIMO MÁXIMO MEDIA DESV. TÍP.
Ventas en litros 193,295.0 466,824.0 353,282.2 44,870.1
Distribución Ponderada % 99.0 100.0 99.9 0.1
Índice Intensidad Promocional en Exposición Especial 0.2 8.2 1.8 1.4
Índice Intensidad Promocional Folletos 0.0 23.8 5.1 5.6
Índice Intensidad Promocional Reducción Temporal de Precios 0.4 24.8 9.8 5.0
GRPS 20" 0.0 698.2 242.3 140.8
GRPS 20"Acciones Especiales 0.0 119.7 6.1 16.0
Prensa € 0.0 89,233.9 1,737.2 7,200.4
Internet € 0.0 47.256.9 4,954.8 7,532.7
Notoriedad de Marca 84.0 100.0 96.1 3.0
Diferencial de Precio con Marca Distribuidor 1.3 2.8 1.9 0.3
Interés Búsqueda Categoría Internet 31.0 100.0 63.4 15.0
GRPS 20" Competencia 0.0 350.8 44.7 81.7
CÁLCULO DEL ROI DE MARKETING EN MODELOS DE MARKETING MIX, DEL ROMI, AL VALOR CREADO DEL MARKETING PARA LOS ACCIONISTAS EVAM
UNIVERSIA BUSINESS REVIEW | CUARTO TRIMESTRE 2016 | ISSN: 1698-5117
58
que esta semana conservamos el 40% del impacto de la publicidad de la semana anterior, este impacto decae a un ritmo λt, de forma que en las dos semanas posteriores habrá disminuido al 0,42 = 16% y así sucesivamente. A partir del parámetro λ es posible conocer el tiempo en semanas en los que decaerá hasta el 50% o bien al 90% el efecto de la campaña. Para el nivel de λ = 40% el tiempo que tarda el efecto de la campaña en decaer el 90% se calcularía como ln(0,1)/λ = ln(0,1)/0,4 = 2,5 semanas.El reto del modelo de Adstock se plantea a la hora de averiguar si realmente este impacto retardado existe y en su caso cuantificarlo. Fry, Broadbent y Dixon (1999), proponen 3 métodos alternativos para averiguar el valor de λ, pero en su análisis no queda claro hasta qué punto el efecto retardado estimado es significativo en las ventas mediante un contraste estadístico. Como alternativa se podrían usar las estimaciones de Assmus, Farley y Lehmann (1984) en su meta-análisis de 114 artículos y usar un valor medio del parámetro λ = 0,46 con una desviación típica de σ = 0,30. Sin embargo ninguno de estos enfoques nos parece adecuado y proponemos un enfoque distinto a través del uso las funciones de impulso respuesta (Dekimpe y Hanssens, 1995, 1999) método que aplicado a la estimación de λ, bajo nuestro conocimiento, no ha sido utilizado anteriormente en la literatura.Las funciones de impulso respuesta se basan en los resultados obtenidos de un modelo de vector autoregresivo (VAR). La especificación matemática del modelo VAR exige que las series utilizadas sean estacionarias, entendiendo por estacionariedad el mantenimiento de las propiedades de media y varianza a lo largo del tiempo en la serie (aunque sea sobre una tendencia). Caso de que la serie no lo sea, habremos de realizar la primera diferencia para conseguir el objetivo de estacionariedad. El test de Dickie-Fuller aumentado, Tabla 2, nos indica que tanto la serie de ventas como las variables de publicidad son estacionarias, por lo cual se puede realizar el análisis VAR en nivel.
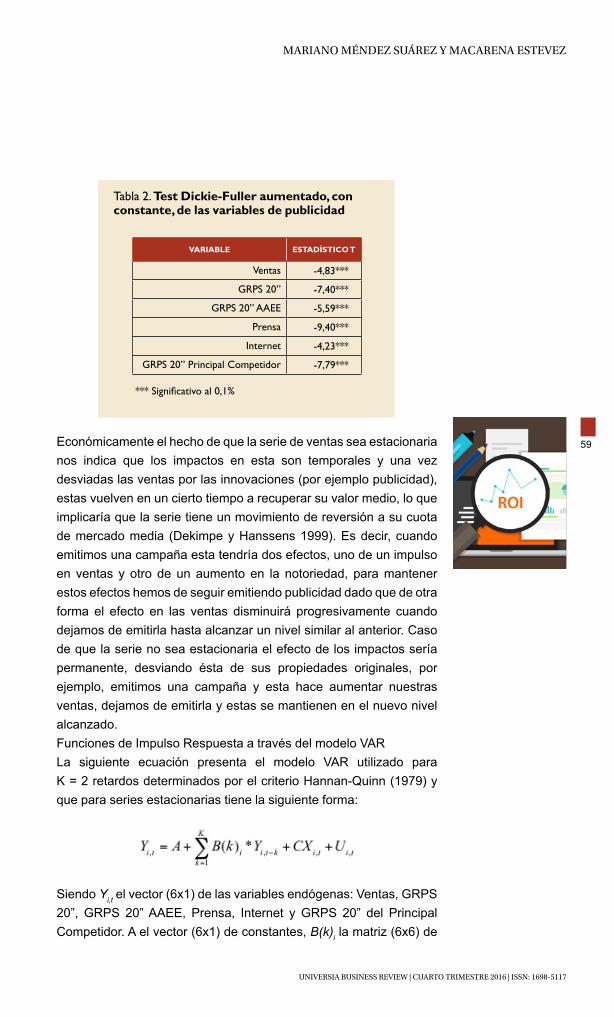
MARIANO MÉNDEZ SUÁREZ Y MACARENA ESTEVEZ
UNIVERSIA BUSINESS REVIEW | CUARTO TRIMESTRE 2016 | ISSN: 1698-5117
59Económicamente el hecho de que la serie de ventas sea estacionaria nos indica que los impactos en esta son temporales y una vez desviadas las ventas por las innovaciones (por ejemplo publicidad), estas vuelven en un cierto tiempo a recuperar su valor medio, lo que implicaría que la serie tiene un movimiento de reversión a su cuota de mercado media (Dekimpe y Hanssens 1999). Es decir, cuando emitimos una campaña esta tendría dos efectos, uno de un impulso en ventas y otro de un aumento en la notoriedad, para mantener estos efectos hemos de seguir emitiendo publicidad dado que de otra forma el efecto en las ventas disminuirá progresivamente cuando dejamos de emitirla hasta alcanzar un nivel similar al anterior. Caso de que la serie no sea estacionaria el efecto de los impactos sería permanente, desviando ésta de sus propiedades originales, por ejemplo, emitimos una campaña y esta hace aumentar nuestras ventas, dejamos de emitirla y estas se mantienen en el nuevo nivel alcanzado.Funciones de Impulso Respuesta a través del modelo VARLa siguiente ecuación presenta el modelo VAR utilizado para K = 2 retardos determinados por el criterio Hannan-Quinn (1979) y que para series estacionarias tiene la siguiente forma:
Siendo Yi,t el vector (6x1) de las variables endógenas: Ventas, GRPS 20”, GRPS 20” AAEE, Prensa, Internet y GRPS 20” del Principal Competidor. A el vector (6x1) de constantes, B(k)i la matriz (6x6) de
Tabla 2. Test Dickie-Fuller aumentado, con constante, de las variables de publicidad
VARIABLE ESTADÍSTICO T
Ventas -4,83***
GRPS 20” -7,40***
GRPS 20” AAEE -5,59***
Prensa -9,40***
Internet -4,23***
GRPS 20” Principal Competidor -7,79***
*** Significativo al 0,1%
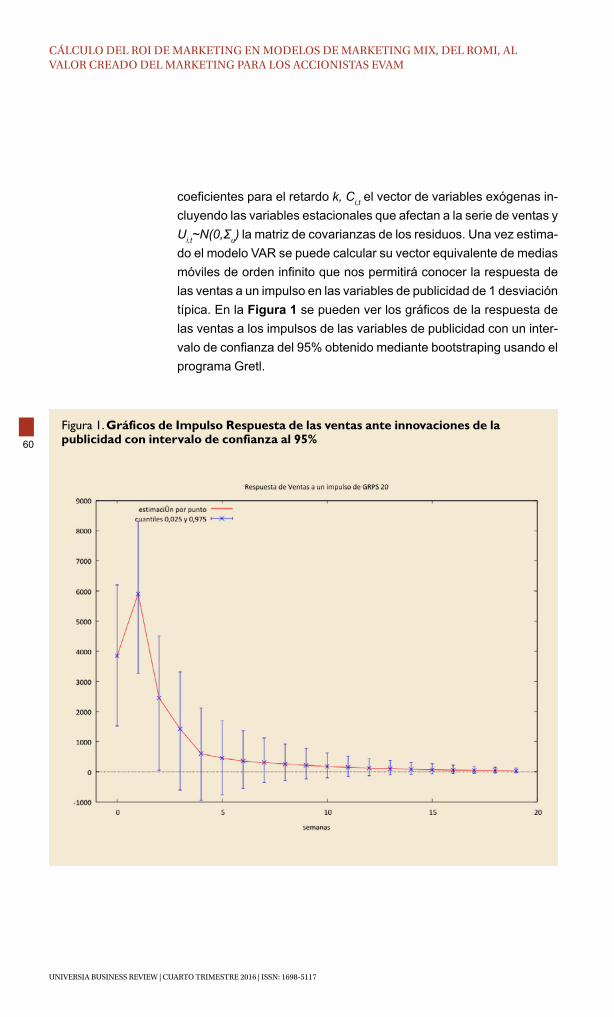
CÁLCULO DEL ROI DE MARKETING EN MODELOS DE MARKETING MIX, DEL ROMI, AL VALOR CREADO DEL MARKETING PARA LOS ACCIONISTAS EVAM
UNIVERSIA BUSINESS REVIEW | CUARTO TRIMESTRE 2016 | ISSN: 1698-5117
60
coeficientes para el retardo k, Ci,t el vector de variables exógenas in-cluyendo las variables estacionales que afectan a la serie de ventas y Ui,t~N(0,Σu) la matriz de covarianzas de los residuos. Una vez estima-do el modelo VAR se puede calcular su vector equivalente de medias móviles de orden infinito que nos permitirá conocer la respuesta de las ventas a un impulso en las variables de publicidad de 1 desviación típica. En la Figura 1 se pueden ver los gráficos de la respuesta de las ventas a los impulsos de las variables de publicidad con un inter-valo de confianza del 95% obtenido mediante bootstraping usando el programa Gretl.
Figura 1. Gráficos de Impulso Respuesta de las ventas ante innovaciones de la publicidad con intervalo de confianza al 95%

MARIANO MÉNDEZ SUÁREZ Y MACARENA ESTEVEZ
UNIVERSIA BUSINESS REVIEW | CUARTO TRIMESTRE 2016 | ISSN: 1698-5117
61
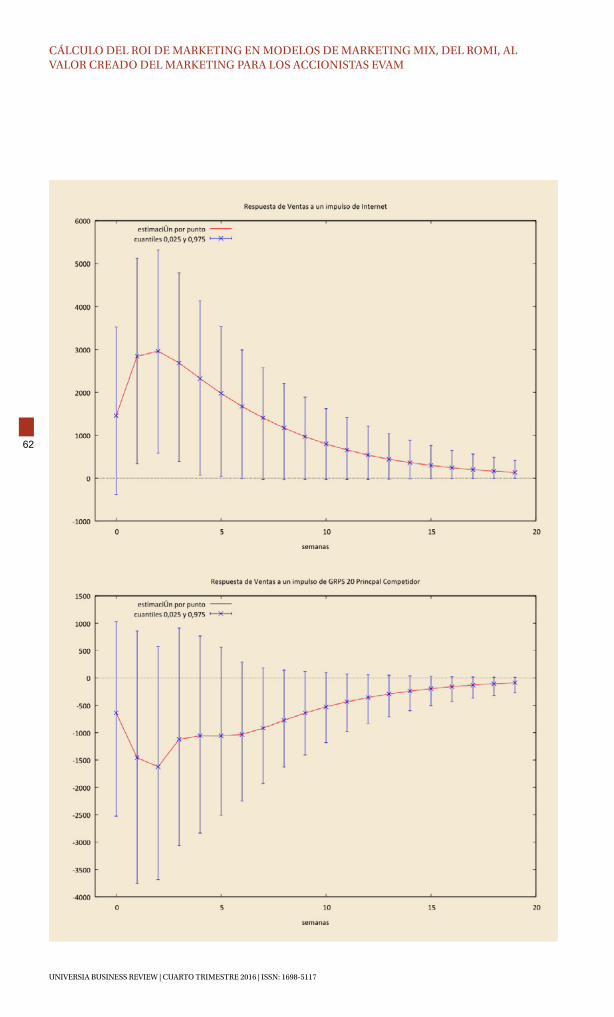
CÁLCULO DEL ROI DE MARKETING EN MODELOS DE MARKETING MIX, DEL ROMI, AL VALOR CREADO DEL MARKETING PARA LOS ACCIONISTAS EVAM
UNIVERSIA BUSINESS REVIEW | CUARTO TRIMESTRE 2016 | ISSN: 1698-5117
62

MARIANO MÉNDEZ SUÁREZ Y MACARENA ESTEVEZ
UNIVERSIA BUSINESS REVIEW | CUARTO TRIMESTRE 2016 | ISSN: 1698-5117
63
Una vez obtenidas respuestas de las ventas al impulso de las varia-bles de publicidad, pasamos a estimar su duración con un intervalo de confianza al 95% y asumiremos que el efecto no existe cuando el intervalo de confianza incluye la línea de 0. A partir de aquí esta-blecemos como hipótesis que la respuesta decae al 90% en la mitad de la semana donde desaparece definitivamente, obteniendo de esta forma el valor que nos permitirá estimar λ, Tabla 3.
Tabla 3. Estimación de λ
SEMANA EN LA QUE DESAPARECE LA RESPUESTA AL
IMPULSO
SEMANA MEDIA APROXIMADA EN LA QUE LA RESPUESTA
DECAE AL 90% (η)
ESTIMACIÓN DE λ PARA UN
DECAIMIENTO DEL 90%. λ = LN (0.1)/ η
GRPS 20” 3 2.5 λ = 0.4
GRPS 20” AAEE 2 1.5 λ = 0.2
Prensa 2 1.5 λ = 0.2
Internet 5 4.5 λ = 0.6
GRPS 20” Principal Competidor
No hay respuesta - -
Podemos observar que el efecto de mayor duración es el de la pu-blicidad en internet y consideramos lógico este resultado, dado que el producto tiene efecto sobre la salud y que la publicidad recibida en la navegación por internet puede ser tomada con mayor atención generando por tanto un impulso de mayor duración en el tiempo. La siguiente variable con mayor impacto son los GRPS 20” seguidos por los GRPS 20” AAEE y la Prensa. Todas estas variables significativas serán incluidas en el modelo después de haber realizado la transfor-mación en Adstock, cada una con su coeficiente λ estimado. Como podemos observar en la Figura 1 el posible impacto negativo de los GRPS 20” del principal competidor no es estadísticamente significa-tivo al incluir todos los intervalos de confianza el 0, lo cual puede ser lógico dado que el posible impacto se reparte entre todos los compe-tidores, por lo tanto no serán contemplados en el modelo.
6. MODELIZACIÓN DE LAS VENTASLas variables que usaremos para explicar las ventas las separamos en tres grupos, el primero incluye las variables del marketing mix: dis-tribución, notoriedad de marca, publicidad en televisión en distintas

CÁLCULO DEL ROI DE MARKETING EN MODELOS DE MARKETING MIX, DEL ROMI, AL VALOR CREADO DEL MARKETING PARA LOS ACCIONISTAS EVAM
UNIVERSIA BUSINESS REVIEW | CUARTO TRIMESTRE 2016 | ISSN: 1698-5117
64
campañas y formatos y publicidad en otros medios; el segundo inclu-ye información de la competencia, como diferenciales de precios con MMDD; y el tercero resume los factores económicos y sociales que afectan a las ventas, como estacionalidad en las mismas, variaciones en el ciclo económico, e interés de la búsqueda en internet de la cate-goría. El modelo responde a la siguiente ecuación:
Donde Yt es el valor de la variable dependiente Ventas en el momento t, βi es el coeficiente de la variable independiente xit en el momento t y εt es un término de error de ruido blanco. Aunque Gujarati (2004, pág. 168) recomienda incluir siempre el término constante dentro de los modelos de regresión para evitar posibles problemas de especifi-cación y también posibles riesgos de multicolinealidad que redunden en una mayor varianza de los coeficientes (una menor precisión del modelo), el autor establece una excepción cuando existe una fuerte expectativa a priori. En nuestro caso, dado el alto esfuerzo dedicado por la marca a tener un nivel muy elevado de distribución, se puso mucho énfasis en conocer el efecto individual de esta variable y aun-que la constante proporciona información acerca del nivel base de las ventas e incluiría el efecto de la distribución, se opto por no incluirla y utilizar en su lugar la variable distribución ponderada.Para conocer en más detalle la relación entre las variables del mo-delo ajustado se realizó el cálculo de la matriz de correlación que se puede observar en la Tabla 4.Una vez verificada la estructura de la matriz de correlación se pro-cede a la creación del modelo, Gráfico 1, dado que tiene un R2 del 86,08% interpretamos que hemos conseguido capturar un 86% de la variabilidad de las ventas.

MARIANO MÉNDEZ SUÁREZ Y MACARENA ESTEVEZ
UNIVERSIA BUSINESS REVIEW | CUARTO TRIMESTRE 2016 | ISSN: 1698-5117
65
Tabla 4. Matriz de Correlación entre las variables del modelo ajustado
CORRELACIONES 1 2 3 4 5 6 7 8 9 10 11 12
1. Ventas 100%
2. Distribución Ponderada % 25.3% 100%
3. Dif. de Precio con MMDD -60.0% -18.5% 100%
4. IIP EE 39.3% 2.1% -33.6% 100%
5. IIP F 49.5% 17.2% -41.4% 11.2% 100%
6. IIP RTP 36.1% 14.0% -37.2% 25.6% 30.6% 100%
7. GRPS 20" Ad40 19.1% -7.2% 27.2% -16.1% -1.9% -7.7% 100%
8. GRPS AAEE Ad20 25.9% -14.3% -15.9% 16.1% 7.5% -7.3% 109% 100%
9. Prensa € Ad20 18.2% 10.0% 6.5% 1.0% 11.5% 27.6% 25.6% -8.9% 100%
10. Internet € Ad60 35.0% 11.0% -36.1% 15.9% 36.1% 7.7% -2.2% 10.8% 10.4% 100%
11. Notoriedad de Marca 27.3% 12.7% -35.0% 25.0% 31.6% 44.7% -32.9% -8.4% 12.8% 19.0% 100%
12. Búsqu. Cat. Internet 55.3% 15.8% -60.2% 36.5% 23.6% 20.5% -15.0% 13.9% 4.3% 38.4% 22.6% 100%
Gráfico 1. Ventas y ventas estimadas por el modelo. R2 = 86.08%
Las variables incluidas en el modelo, sus coeficientes y su porcentaje de aportación individual a las ventas totales de todo el periodo se pueden ver en la Tabla 5.El coeficiente de regresión indica la variación en ventas por el au-mento de una unidad en la variable explicativa, manteniendo el resto constante. Si el coeficiente es positivo significa que esta variable tie-ne contribución positiva a las ventas y viceversa.

CÁLCULO DEL ROI DE MARKETING EN MODELOS DE MARKETING MIX, DEL ROMI, AL VALOR CREADO DEL MARKETING PARA LOS ACCIONISTAS EVAM
UNIVERSIA BUSINESS REVIEW | CUARTO TRIMESTRE 2016 | ISSN: 1698-5117
66
Tabla 5. Variables del modelo, coeficientes y aportación de cada una ellas a las ventas
VARIABLES DEL MODELOCOEFICIENTE
DE REGRESIÓNSIGNIFICACIÓN
APORTACIÓN A LAS VENTAS
TOTALES
Variables del Marketing Mix
Distribución Ponderada 2,254.41 *** 63.8%
Índice Intensidad Promocional en Exposición Especial
3,846.17 *** 2.0%
Índice Intensidad Promocional Folletos 1,419.76 *** 2.1%
Índice Intensidad Promocional Reducción Temporal de Precios
769.09 *** 2.1%
Gross Rating Points 20” con AdStock 0,4 49.48 *** 5.7%
Gross Rating Points 20” Acciones Especiales con AdStock 0,2
205.44 *** 0.6%
Inversión en Prensa en Euros con AdStock 0,2 0.48 *** 0.3%
Inversión en Internet en Euros con AdStock 0,6 0.14 * 0.2%
Notoriedad de Marca 1,188.29 *** 32.4%
Dummy Acción Especial Mayo de 2011 36,969.52 *** 0.1%
Dummy Acción Especial Octubre de 2013 24,568.46 *** 0.1%
Variables Relacionadas con la Competencia
Diferencial precio con marca de distribución -27,657.31 *** -15.2%
Variables del Entorno Social, Macroeconómico y Estacionales
Interés búsqueda de categoría en Internet 326.56 *** 5.9%
Dummy Primera semana mes 8,458.72 *** 0.6%
Dummy Ultima semana mes 6,893.39 *** 0.4%
Dummy Semana Santa -62,503.81 *** -0.4%
Dummy Puente Agosto -24,541.24 *** -0.1%
Dummy Puente Diciembre -43,066.85 *** -0.2%
Dummy Semana de Nochebuena -75,482.25 *** -0.4%
Dummy Semana de Nochevieja -74,859.59 *** -0.4%
Dummy Semana de Reyes -32,526.73 *** -0.2%
Dummy Mes de Julio -12,433.65 *** -0.3%
Dummy Mes de Agosto -30,521.51 *** -0.8%
Dummy Mes de Noviembre -9,426.75 ** -0.2%
Dummy Años 2013-2014 21,746.94 *** 1.8%
*** Significativo al 1%. ** Significativo al 5%. * Significativo al 10%. R2 = 86.08%.Dado que la regresión se realiza sin constante y para evitar la sobrevaloración del coeficiente de determinación R2 y garantizar que se encuentra entre 0 y 1, usamos la fórmula alternativa:
siendo Yt el valor de la variable dependiente en t, el valor estimado de la variable e la media de la variable dependiente.

MARIANO MÉNDEZ SUÁREZ Y MACARENA ESTEVEZ
UNIVERSIA BUSINESS REVIEW | CUARTO TRIMESTRE 2016 | ISSN: 1698-5117
67
En el Gráfico 2 se puede observar la aportación individual de las distintas variables del marketing mix a las ventas totales. Destaca la distribución ponderada, a la que se debe un 63,8% de las ventas, seguida de la notoriedad de marca que aporta un 32,4% de las ven-tas. En tercer lugar se encuentra el efecto negativo del diferencial de precio con la marca de distribución que resta un 15,2% a las ventas. La variable publicidad, que es la suma del efecto de la publicidad en todos los medios en el corto plazo, aporta un 6,8% de las ventas totales.
Gráfico 2. Aportación total a las ventas de las variables de marketing mix
63,84% 6,20% 6,79%
32,37%
-15,21%
DistribuciónPonderada
IntensidadPromocional
Publicidad Notoriedadde Marca
Diferencial PrecioMarca Distribución
7. ANÁLISIS DE LAS VARIABLES DEL MODELODistribución PonderadaLa aportación de la variable distribución ponderada es de un 63,8% a las ventas totales y podemos asumir que una distribución tan amplia como la de la marca es el sustento del nivel base de ventas. Esta variable aunque pudiera asimilarse a la constante de la regresión re-coge información que la constante no aclararía, como por ejemplo, cómo afecta a las ventas la salida de un determinado mercado o la pérdida de un determinado canal de distribución.
Índices de Intensidad PromocionalLas ventas obtenidas a través de promociones son la suma de los efectos de los Índices de Intensidad Promocional en Exposición Es-pecial (IIP EE), el Índice de Intensidad Promocional con Folletos (IIP F), y el Índice de Intensidad Promocional en Reducción Temporal de Precios (IIP RTP) dando una aportación conjunta a las ventas de un 6, 2%.

CÁLCULO DEL ROI DE MARKETING EN MODELOS DE MARKETING MIX, DEL ROMI, AL VALOR CREADO DEL MARKETING PARA LOS ACCIONISTAS EVAM
UNIVERSIA BUSINESS REVIEW | CUARTO TRIMESTRE 2016 | ISSN: 1698-5117
68
Publicidad a corto plazoIncluye las variables GRPS de televisión e inversión en Euros en prensa e Internet, todas ellas transformadas en Adstock. Gran parte de la publicidad emitida consistió en aportar información sobre las cualidades del producto y su efecto beneficioso para la salud, el ob-jetivo no era sólo realizar ventas a corto plazo sino también crear no-toriedad de marca en la categoría para promover las ventas futuras.El aporte de la publicidad en televisión tanto en campañas como en acciones especiales (AAEE), es de un 6,3% de las ventas. La publici-dad en prensa e Internet tienen una aportación conjunta de un 0,5% de las ventas. Dando un total de 6,8%.
Notoriedad de MarcaClary y Dyson (2004) indican que el efecto actual de la publicidad a corto (representada por las variables con Adstock) en las ventas no es suficiente para que las campañas sean rentables siendo necesa-rio medir también el efecto acumulado de la publicidad en el largo plazo para conocer la rentabilidad real de la publicidad. En nuestro caso una aportación de la publicidad a corto de un 6,8% (y por nues-tra experiencia a lo largo de los años, el efecto suele ser menor) a las ventas totales no justifica el alto volumen económico invertido dado que como veremos más adelante obtendremos un ROMI negativo. Sin embargo, revisando la literatura sobre el tema, observamos al-gunas conclusiones interesantes sobre los efectos de la publicidad a corto plazo. Driver y Foxal (1986) concluyen que la publicidad a corto plazo, aparte de la función de generar ventas, tiene otras funciones que se relacionan con el efecto a largo plazo: i) La publicidad se ha de acumular durante un tiempo para alcanzar niveles en los que sea efectiva. ii) Los receptores actuales de la publicidad no son necesa-riamente los consumidores actuales, el impacto de la publicidad pue-de tener efectos posteriores. iii) La publicidad inculca hábitos que la publicidad futura mantendrá. iv) La publicidad está sujeta a desgaste y a obsolescencia y necesita renovación. Por otro lado, Aaker y Day (1974) analizan la jerarquía de efectos generados por la publicidad y concluyen que la publicidad influye en la notoriedad y que ésta a su vez influye en el comportamiento de compra. Siendo uno de los factores más importantes para la generación de la notoriedad el efec-to acumulativo de la publicidad a corto plazo (Clark, Doraszelski, y Draganska 2009).
MARIANO MÉNDEZ SUÁREZ Y MACARENA ESTEVEZ
UNIVERSIA BUSINESS REVIEW | CUARTO TRIMESTRE 2016 | ISSN: 1698-5117
69
Huang y Sarigöllü (2012) concluyen que para bienes de consumo existe una relación positiva entre notoriedad y resultados en ven-tas a través del proceso: notoriedad -> prueba -> refuerzo. Somos conscientes de que para que este proceso sea efectivo, ha de com-plementarse con la contribución de la distribución y promociones de precio (variables analizadas por separado en nuestro modelo). Mac-donald y Sharp (2000) encuentran mejoras en los resultados de la marca en el mercado relacionadas con la notoriedad. Indican que los consumidores ante la elección entre productos con diferencia en notoriedad muestran una mayor predilección por los más conocidos según el ciclo: elección de producto con más notoriedad, prueba de otros productos y vuelta al producto con más notoriedad. En nuestro caso se da la circunstancia especial de que el producto analizado tie-ne efectos positivos para la salud y en este caso, el conocimiento de la marca disminuye el riesgo percibido por el consumidor a la hora de tomar la decisión de compra (Moisesku 2009) aumentando de esta forma la probabilidad de compra.Srinivasan, Vanhuele y Pauwels (2008) indican la pertinencia de incluir en los modelos de marketing mix las denominadas “mindset metrics” y especialmente la variable notoriedad. En su estudio los re-sultados revelan que métricas como la notoriedad tienen un efecto en las ventas más allá de los efectos directos de la publicidad, el precio, la distribución o las promociones. Por ello insisten en la necesidad de incluir en este tipo de modelos métricas perceptuales que permitan capturar los efectos positivos a largo plazo de la creación de marca.Debido a estos motivos, consideramos adecuado incluir esta variable en el modelo y poder utilizarla como una aproximación del efecto a largo plazo de la publicidad, aunque somos conscientes de que la notoriedad es una variable muy rica y generada por un número mayor de variables como pueden ser otros instrumentos de comunicación, la distribución o el propio producto. En nuestro modelo, la variable notoriedad de marca, tiene una contribución a las ventas totales de un 32,37%, la segunda más importante después de la distribución. Y puede ayudar a justificar el efecto a largo plazo de las estrategias de inversión publicitaria en la creación de valor para los accionistas.Dummies Acciones Especiales Mayo de 2011 y Octubre de 2013El hecho de incluir en el modelo estas dos fechas se debe a dos acciones especiales que fueron realizadas por la marca en esos pe-riodos y que de forma conjunta tuvieron un impacto de un 0,2% en las ventas totales.
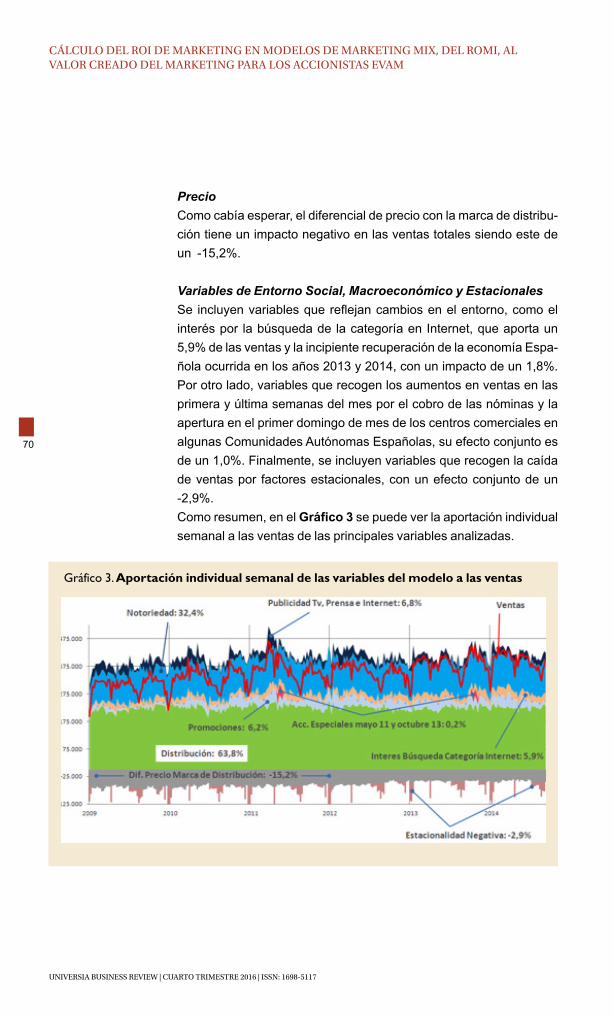
CÁLCULO DEL ROI DE MARKETING EN MODELOS DE MARKETING MIX, DEL ROMI, AL VALOR CREADO DEL MARKETING PARA LOS ACCIONISTAS EVAM
UNIVERSIA BUSINESS REVIEW | CUARTO TRIMESTRE 2016 | ISSN: 1698-5117
70
PrecioComo cabía esperar, el diferencial de precio con la marca de distribu-ción tiene un impacto negativo en las ventas totales siendo este de un -15,2%.
Variables de Entorno Social, Macroeconómico y EstacionalesSe incluyen variables que reflejan cambios en el entorno, como el interés por la búsqueda de la categoría en Internet, que aporta un 5,9% de las ventas y la incipiente recuperación de la economía Espa-ñola ocurrida en los años 2013 y 2014, con un impacto de un 1,8%. Por otro lado, variables que recogen los aumentos en ventas en las primera y última semanas del mes por el cobro de las nóminas y la apertura en el primer domingo de mes de los centros comerciales en algunas Comunidades Autónomas Españolas, su efecto conjunto es de un 1,0%. Finalmente, se incluyen variables que recogen la caída de ventas por factores estacionales, con un efecto conjunto de un -2,9%.Como resumen, en el Gráfico 3 se puede ver la aportación individual semanal a las ventas de las principales variables analizadas.
Gráfico 3. Aportación individual semanal de las variables del modelo a las ventas

MARIANO MÉNDEZ SUÁREZ Y MACARENA ESTEVEZ
UNIVERSIA BUSINESS REVIEW | CUARTO TRIMESTRE 2016 | ISSN: 1698-5117
71
8. CÁLCULO DE LA RENTABILIDAD PUBLICITARIA: ROMI Y EVAMUna vez realizado el modelo y aisladas las aportaciones de cada va-riable, contamos con la información necesaria para cuantificar en tér-minos económicos el retorno de la inversión en publicidad. En el Grá-fico 4 mostramos las ventas generadas por la publicidad emitida en televisión, prensa e Internet, la que consideramos publicidad a corto y las ventas generadas por la notoriedad de marca que consideramos que representa el impacto a largo de la publicidad.
Gráfico 4. Aportación a las ventas de la publicidad a corto y de la notoriedad de marca
Para ilustrar el análisis del cálculo del ROMI y del EVAM tomaremos el año completo de 2013, durante el cual un 5,9% del total de ventas se deben a la publicidad a corto, y un 29,9% al efecto de la notoriedad de marca o publicidad a largo, el efecto conjunto de ambas variables aporta un 35,8% de las ventas totales del periodo. Para el cálculo del ROMI y del EVAM asumimos un Margen Bruto de gran compañía del sector de un 50% (PWC, 2015, pág. 18), para el coste de los recursos financieros usamos un wacc del 10% en consonancia con las empre-sas del sector y asumimos una tasa impositiva del 30%, acorde con las tasas actuales en España.A la luz de esta información y siguiendo paso a paso el proceso de cálculo del beneficio incremental explicado anteriormente, se obtie-nen los resultados que se detallan en la Tabla 6, donde aparecen los resultados financieros desagregados de la publicidad a corto plazo incluyendo televisión, prensa e Internet, y por otro lado, la suma de

CÁLCULO DEL ROI DE MARKETING EN MODELOS DE MARKETING MIX, DEL ROMI, AL VALOR CREADO DEL MARKETING PARA LOS ACCIONISTAS EVAM
UNIVERSIA BUSINESS REVIEW | CUARTO TRIMESTRE 2016 | ISSN: 1698-5117
72
los efectos de la publicidad a corto plazo y la notoriedad de marca representando el largo plazo.
Tabla 6. ROMI, Rentabilidad y EVAM del efecto a corto, sólo publicidad y largo plazo, publicidad y notoriedad de marca
RENTABILIDAD INVERSIÓN PUBLICITARIA
ROMI WACC RENTABILIDAD EVAM
Efecto a Corto Plazo de la Publicidad: Publicidad TV + Prensa + Internet
-33% 10% -43% - € 1,954,907
Efecto combinado de la Publicidad a más efecto a largo representado por la Notoriedad: Notoriedad de Marca + Publicidad TV + Prensa + Internet
308% 10% 298% € 9,461,919
Si sólo tenemos en cuenta la publicidad a corto plazo, el ROMI es de un -33% y una vez restado el wacc de un 10% obtenemos una renta-bilidad de la publicidad de un -43%, el EVAM del periodo habría sido de -1,9 M de Euros, es decir, habríamos destruido valor para los ac-cionistas por este importe. Para calcular el impacto económico de la notoriedad de marca no incluimos la inversión realizada, que estaría representada por la publicidad acumulada, el esfuerzo en distribución y en campañas promocionales de los años anteriores, dado que fi-nancieramente se pueden considerar como costes hundidos, costes que nunca se incluyen al evaluar una inversión. Al añadir el efecto de la notoriedad de marca el resultado es totalmente distinto, en este segundo caso el ROMI es de un 308% al que si restamos el 10% de wacc nos da una rentabilidad del 298% y se habría creado valor para los accionistas de un EVAM de 9,2 M de Euros.
9. CONCLUSIONES, LIMITACIONES Y FUTURAS LÍNEAS DE INVESTIGACIÓNDesde hace años se viene abogando por la estandarización y clarifi-cación de los métodos usados para medir el ROMI (por ejemplo, IPA 2008 y Farris et al. 2015), sin embargo, a los autores nos les consta que se hayan proporcionado ejemplos reales de su cálculo descri-biendo de forma detallada los modelos econométricos de marketing mix necesarios para su obtención. Estos mismos modelos también permiten realizar el cálculo de una de las medidas más comunes de
MARIANO MÉNDEZ SUÁREZ Y MACARENA ESTEVEZ
UNIVERSIA BUSINESS REVIEW | CUARTO TRIMESTRE 2016 | ISSN: 1698-5117
73
la creación de valor para los accionistas, el EVA, que ha sido adap-tada por los autores para medir la creación de valor del marketing, EVAM.La estimación del valor de λ para el Adstock a través de curvas im-pulso respuesta es una forma transparente de medir el impacto de la publicidad en el tiempo y permite además conocer la significación de las estimaciones y fijar con mayor precisión el tiempo de decaimiento del efecto de la publicidad.El estudio destaca la importancia de medir la notoriedad de marca y explica como cuantificarla como variable en los modelos de mar-keting mix. En nuestro caso, esta variable aporta un 32,4% de las ventas totales de la marca en el periodo de estudio y es la segunda más importante después de la distribución. Si sólo usamos la publici-dad a corto para calcular el ROMI del año 2013, éste arroja un valor de un -33%, y el EVAM una disminución de valor para los accionistas de -1,9 M Euros. En cambio, al añadir el efecto de la notoriedad de marca, el ROMI pasa a un 298% y la creación de valor para los accio-nistas a 9,4 M de Euros.La metodología planteada cumple tres objetivos: 1) En el día a día de los departamentos de marketing permite medir los resultados o eficacia de las acciones realizadas, pudiendo servir para remodelar nuestro marketing mix e incentivar o desincentivar determinadas ac-ciones. 2) Permite obtener una información que nos indica la eficien-cia económica y la rentabilidad de las inversiones, que aparte de ser clave para los departamentos de marketing, es trascendente para los departamentos de control financiero. 3) De cara a la alta dirección y para la comunicación con accionistas, inversores y analistas la in-formación de la creación de valor a través del EVAM ayudará a una mejor comprensión de la gestión realizada y a mejorar la información disponible para que éstos puedan tomar sus decisiones de asigna-ción de recursos.Como limitaciones, indicamos que esté análisis ha sido realizado es-pecíficamente para un producto que tiene efectos en la salud, y para el cual el conocimiento de la marca es un aspecto muy importante a la hora de tomar la decisión de compra, (Moisesku 2009), por lo cual, consideramos que los resultados no son extrapolables a otras categorías de productos, sin embargo, pensamos que la metodología sí lo es y por eso proponemos como futura línea de investigación un estudio más amplio en el que se puedan comparar los resultados de ROMI y EVAM para otras categorías, especialmente en las que no
CÁLCULO DEL ROI DE MARKETING EN MODELOS DE MARKETING MIX, DEL ROMI, AL VALOR CREADO DEL MARKETING PARA LOS ACCIONISTAS EVAM
UNIVERSIA BUSINESS REVIEW | CUARTO TRIMESTRE 2016 | ISSN: 1698-5117
74
exista ese componente de riesgo que implica su uso para la salud, y poder comprobar en productos con bajo riesgo percibido, los efectos de la publicidad a corto y de la notoriedad de marca.
REFERENCIAS Aaker, D. A., Day, G. S. (1974). “A dynamic model of relationships among advertising, consumer awareness, attitudes, and behavior”. Journal of Applied Psychology, 59(3), 281.Assmus, G., Farley, J. U., Lehmann, D. R. (1984). “How advertising affects sales: Meta-analysis of econometric results”. Journal of Marketing Research, 65-74.Bucklin, R. E., Gupta, S. (1999). “Commercial use of UPC scanner data: Industry and academic perspectives”. Marketing Science, 18, 3, 247-273.Broadbent, S. (1979). “One way TV advertisements work”. Journal of the Market Research Society, 21, 3, 139-166.Clary, M., Dyson, P. (2004). “Building the case for long-term advertising”. Admap magazine, 4 February 2014Clark, C. R., Doraszelski, U., & Draganska, M. (2009). “The effect of advertising on brand awareness and perceived quality: An empirical investigation using panel data”. QME, 7(2), 207-236.Dekimpe, M. G., & Hanssens, D. M. (1995). “The persistence of marketing effects on sales”. Marketing Science, 14(1), 1-21.Dekimpe, M. G., & Hanssens, D. M. (1999). “Sustained spending and persistent response: A new look at long-term marketing profitability”. Journal of Marketing Research, 397-412.Driver, J. C., Foxall, G. R. (1986). “Optimal advertising: Adstock and beyond”. https://dspace.lib.cranfield.ac.uk/bitstream/1826/2901/1/M%20&%20L%2086-3.PDFFarris, P. W., Hanssens, D. M., Lenskold, J. D., & Reibstein, D. J. (2015).” Marketing return on investment: Seeking clarity for concept and measurement”. Applied Marketing Analytics, 1(3), 267-282.Fry, T. R., Broadbent, S., & Dixon, J. M. (1999). “Estimating advertising half-life and the data interval bias” (Working Paper No. 6/99). Monash University, Department of Econometrics and Business Statistics.Griffith, J.M. (2004). “The True Value of EVA®”. Journal of Applied Finance, 14, 2, 25-29.Gujarati, D., M. (2004).“Basic Econometrics”. New York: McGraw Hill.Hannan, E. J., Quinn, B. G. (1979). “The determination of the order of an autoregression”. Journal of the Royal Statistical Society. Series B (Methodological), 190-195.Huang, R., Sarigöllü, E. (2012). “How brand awareness relates to market outcome, brand equity, and the marketing mix”. Journal of Business Research, 65(1), 92-99.IPA (Institute of Practitioners in Advertising). (2008). “Measuring Marketing Payback”. http://www.ipa.co.uk/Document/Measuring-marketing-payback-PDF Kimbrough, M. D., Mcalister, L., Mizik, N., Jacobson, R., Garmaise, M. J., Srinivasan, S., Hanssens, D. M. (2009). “Commentaries and rejoinder to “marketing and firm value: metrics, methods, findings, and future directions””. Journal of Marketing Research, 46, 3, 313-329.Kotler P. (1977).”From sales obsession to marketing effectiveness”. Harvard Business Review, 55, 6, 67-75Lenskold Group. (2009 y 2011) “Marketing ROI & Measurement Study”. http://www.lenskold.com Macdonald, E. K., Sharp, B. M. (2000). “Brand awareness effects on consumer decision making for a common, repeat purchase product: A replication”. Journal of business research, 48(1), 5-15.Mintz, O., Currim, I. S. (2013). “What drives managerial use of marketing and financial metrics and does metric use affect performance of marketing-mix activities?”. Journal of Marketing, 77(2), 17-40.Moisesku, O. I. (2009). “The Importance of Brand Awareness in Consumer’s Buying Decision

MARIANO MÉNDEZ SUÁREZ Y MACARENA ESTEVEZ
UNIVERSIA BUSINESS REVIEW | CUARTO TRIMESTRE 2016 | ISSN: 1698-5117
75
and Perceived Risk Assessment”. Management & Marketing-Craiova, (1), 103-110.PWC. (2015) Retail & Consumer Insights 2015 Financial Benchmarking. Results for the food, beverage, and household products manufacturers. https://www.pwc.com/us/en/retail-consumer/financial-performance-report/assets/financial-performance-report.pdfRogers, D., Sexton, D. (2012). “Marketing ROI in the Era of Big Data: The 2012 BRITE/NYAMA Marketing in Transition Study”. Columbia Business School, New YorkSeggie, S. H., Cavusgil, E., Phelan, S. E. (2007). “Measurement of return on marketing investment: A conceptual framework and the future of marketing metrics”. Industrial Marketing Management, 36, 834-841Smyth, H., Lecoeuvre L. (2015). “Differences in decision-making criteria towards the return on marketing investment: A project business perspective”. International Journal of Project Management, 33, 1, 29-40Srinivasan, S., Vanhuele, M., Pauwels, K. (2008). “Do mindset metrics explain brand sales?” Marketing Science Institute.Steward, D. W., Henderson Blair, M., Holmes, W., Barns, M., Duffy, M., Riskey, D., Sirkin, K. (2005). “Contributing to the Bottom Line: Marketing Productivity, Effectiveness and Accountability”.The Board Room Project. http://www.themasb.org/wp-content/uploads/2009/04/marketing-productivity-effectiveness-and-accountability-tbp-july-20051.pdf
NOTAS 1. Agradecimientos: Nos gustaría agradecer las valiosas aportaciones del editor y de un revi-sor anónimo. El presente artículo forma parte del proyecto de investigación 06/ 16 financiado por ESIC Business & Marketing School en colaboración con CONENTO.2. Autor de contacto: ESIC Business & Marketing School; Av. Valdenigrales s/n; 28223 Po-zuelo de Alarcón (Madrid); ESPAÑA3. www.google.com/trends