Cadrega s.p.a
21
Andrea Brambilla Filippo Cheli Gianmaria Grandinetti 807927 806811 810661
-
Upload
filippo-cheli -
Category
Business
-
view
50 -
download
0
Transcript of Cadrega s.p.a

Andrea Brambilla
Filippo Cheli
Gianmaria Grandinetti
807927
806811
810661
Summary
Market analysis
Corporate vision
Cadrega’s goals
Conclusions
Analysis by period & trend’s indeces
2

Market analysis
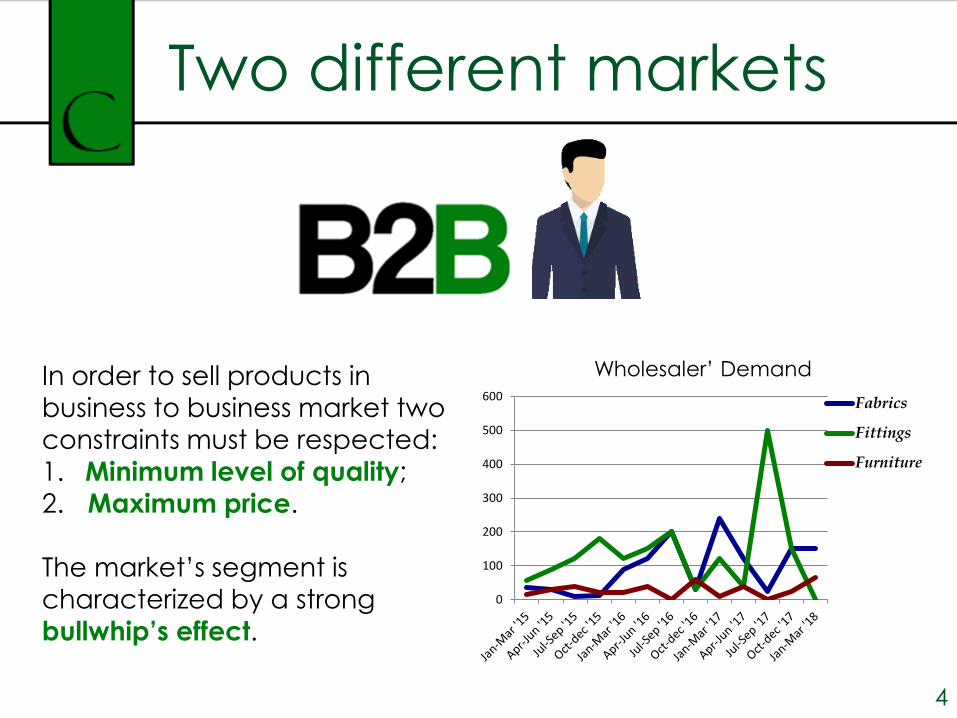
Two different markets
In order to sell products in
business to business market two
constraints must be respected:
1. Minimum level of quality;
2. Maximum price.
The market’s segment is
characterized by a strong
bullwhip’s effect.
4
0
100
200
300
400
500
600 Fabrics
Fittings
Furniture
Wholesaler’ Demand
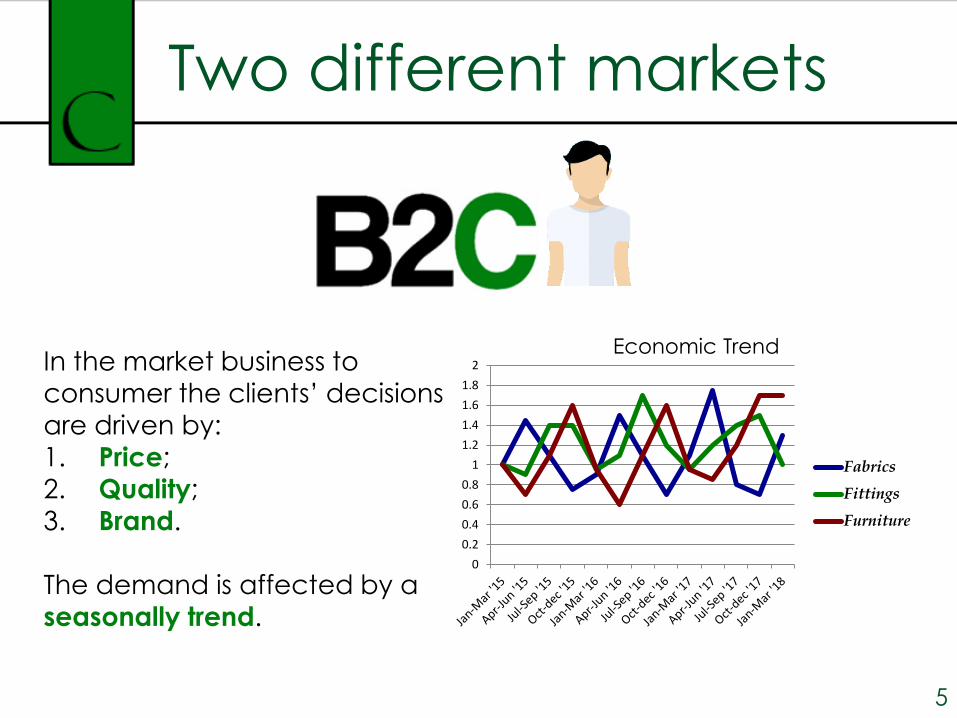
Two different markets
In the market business to
consumer the clients’ decisions
are driven by:
1. Price;
2. Quality;
3. Brand.
The demand is affected by a
seasonally trend.
5
0
0.2
0.4
0.6
0.8
1
1.2
1.4
1.6
1.8
2
Fabrics
Fittings
Furniture
Economic Trend
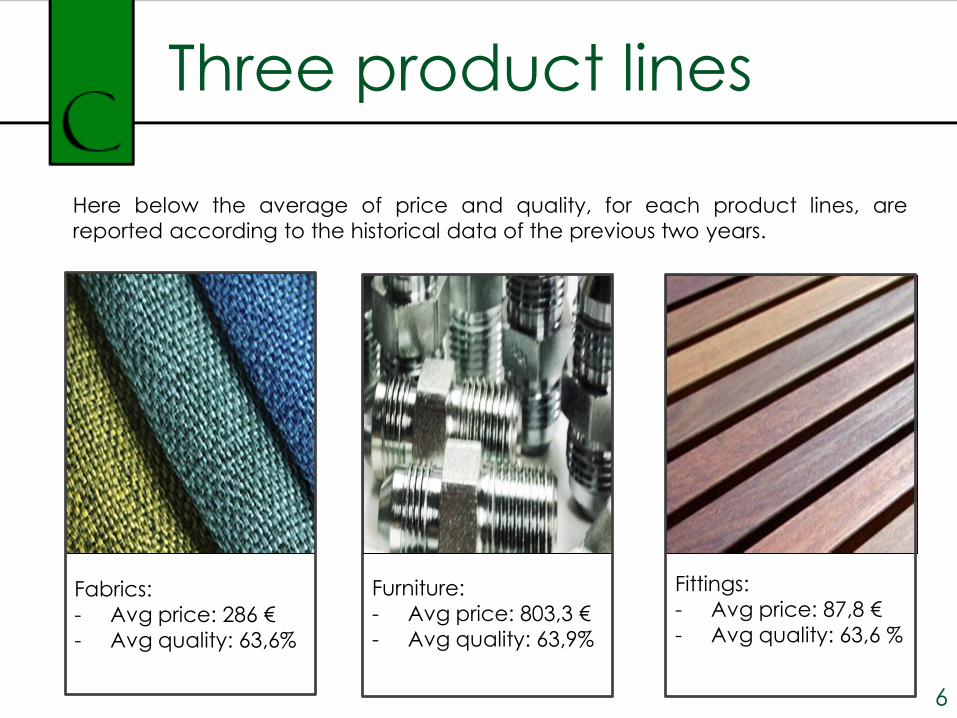
Three product lines
6
Here below the average of price and quality, for each product lines, are
reported according to the historical data of the previous two years.
Fabrics:
- Avg price: 286 €
- Avg quality: 63,6%
Fittings:
- Avg price: 87,8 €
- Avg quality: 63,6 %
Furniture:
- Avg price: 803,3 €
- Avg quality: 63,9%
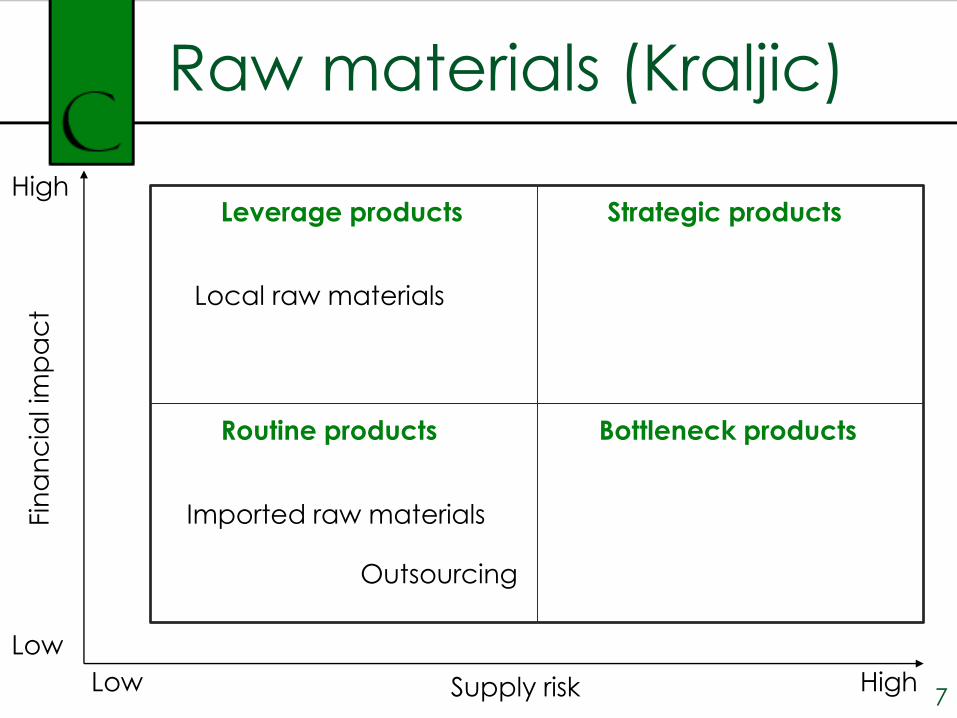
Raw materials (Kraljic)
Leverage products
Routine products
Strategic products
Bottleneck products
Low
Low High
Fin
an
cia
l im
pa
ct
Supply risk 7
High
Imported raw materials
Outsourcing
Local raw materials

8
Corporate strategy
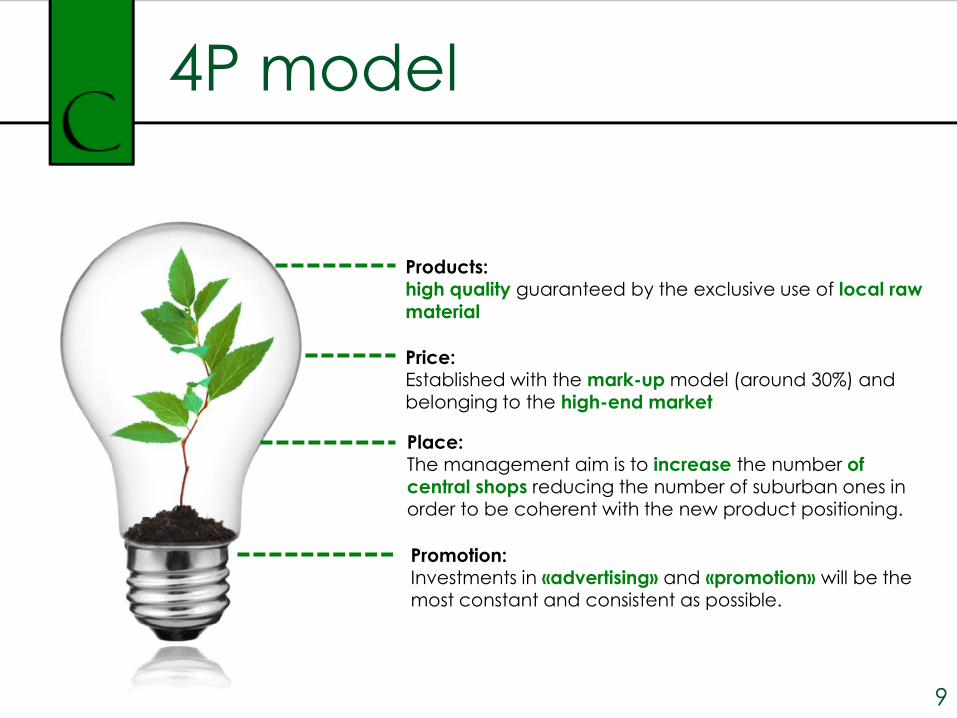
Products: high quality guaranteed by the exclusive use of local raw
material
Price:Established with the mark-up model (around 30%) and belonging to the high-end market
Place:The management aim is to increase the number of
central shops reducing the number of suburban ones in order to be coherent with the new product positioning.
Promotion:Investments in «advertising» and «promotion» will be the most constant and consistent as possible.
9
4P model

10
Cadrega’s goals
11
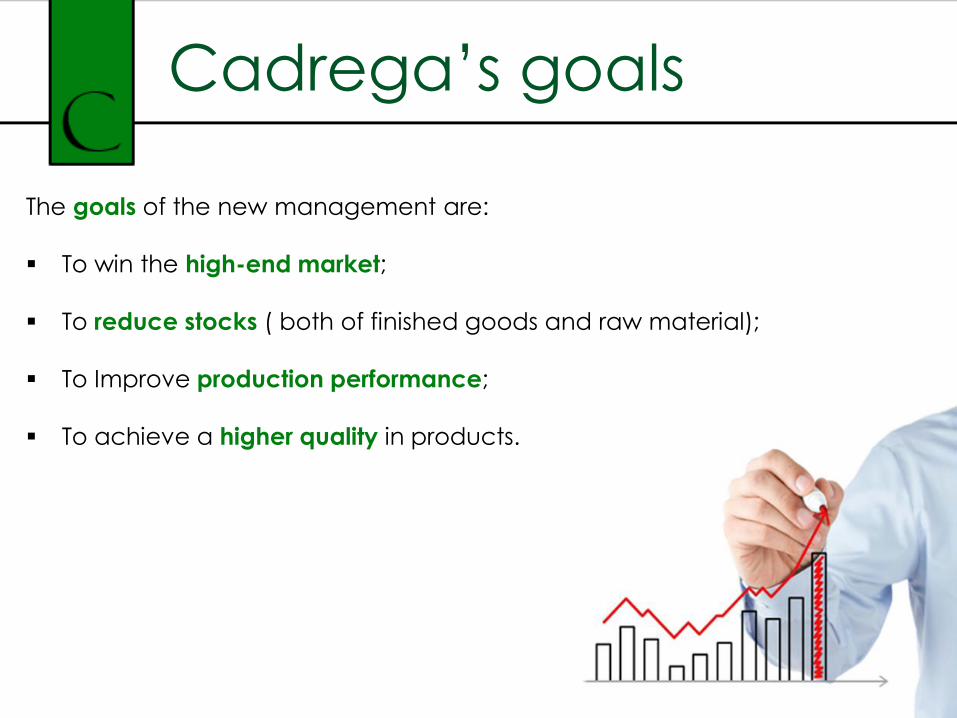
Cadrega’s goals
The goals of the new management are:
To win the high-end market;
To reduce stocks ( both of finished goods and raw material);
To Improve production performance;
To achieve a higher quality in products.
12
Periods’ analysis
13
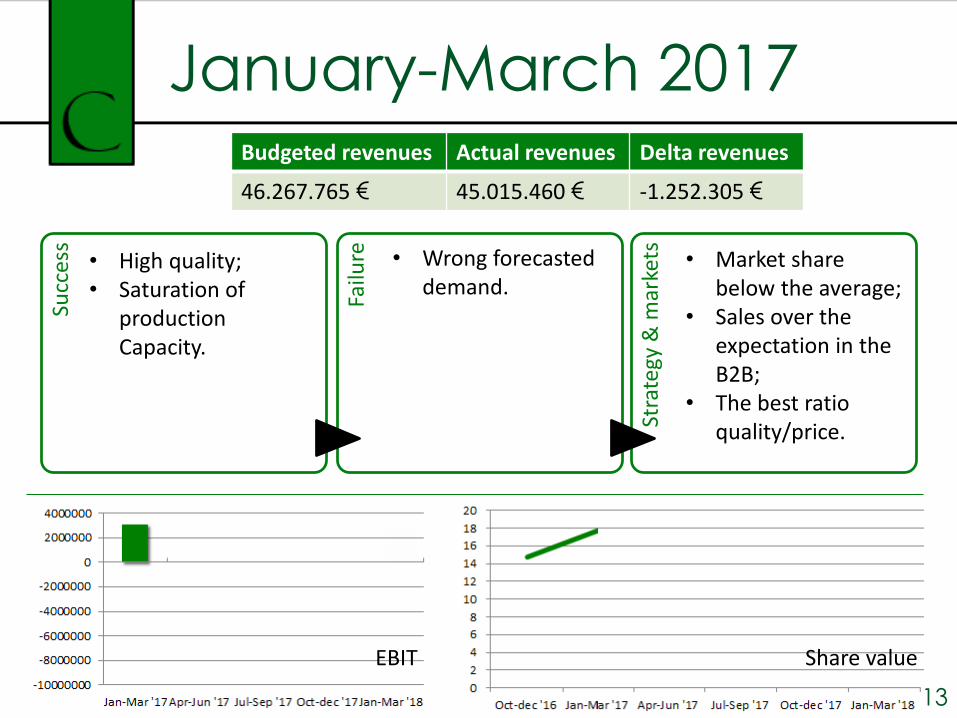
January-March 2017
EBIT Share value
Succ
ess
Failu
re
Stra
tegy
& m
arke
ts• High quality;• Saturation of
production Capacity.
• Market share below the average;
• Sales over the expectation in the B2B;
• The best ratio quality/price.
• Wrong forecasteddemand.
Budgeted revenues Actual revenues Delta revenues
46.267.765 € 45.015.460 € -1.252.305 €
Succ
ess
Failu
re
Stra
tegy
& m
arke
ts
14
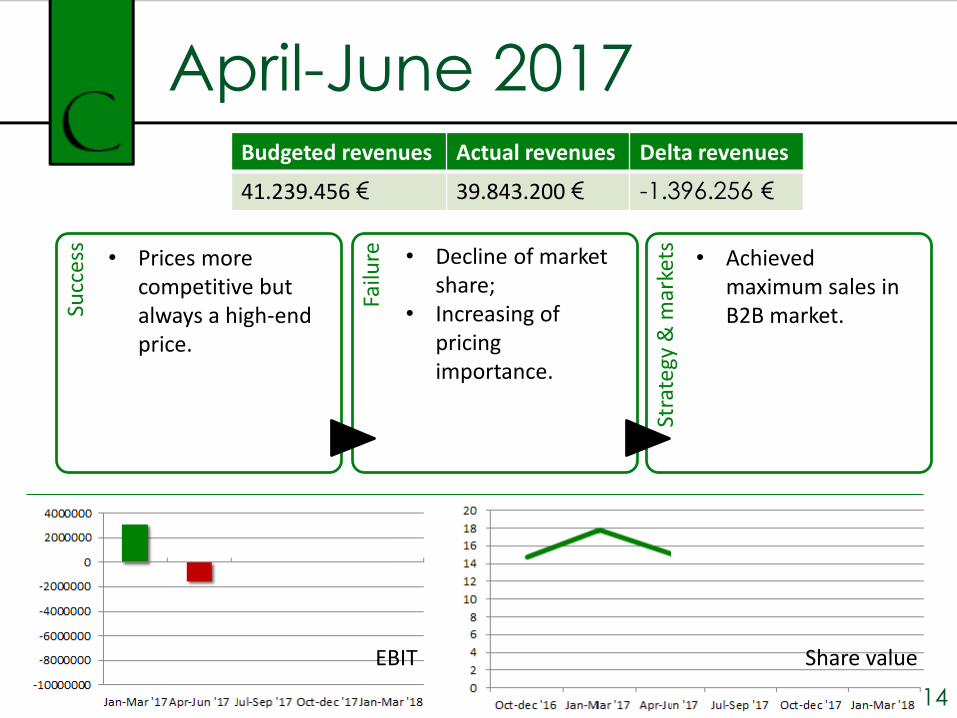
April-June 2017
EBIT Share value
• Prices more competitive butalways a high-end price.
• Achievedmaximum sales in B2B market.
• Decline of market share;
• Increasing of pricingimportance.
Budgeted revenues Actual revenues Delta revenues
41.239.456 € 39.843.200 € -1.396.256 €
Succ
ess
Failu
re
Stra
tegy
& m
arke
ts
15
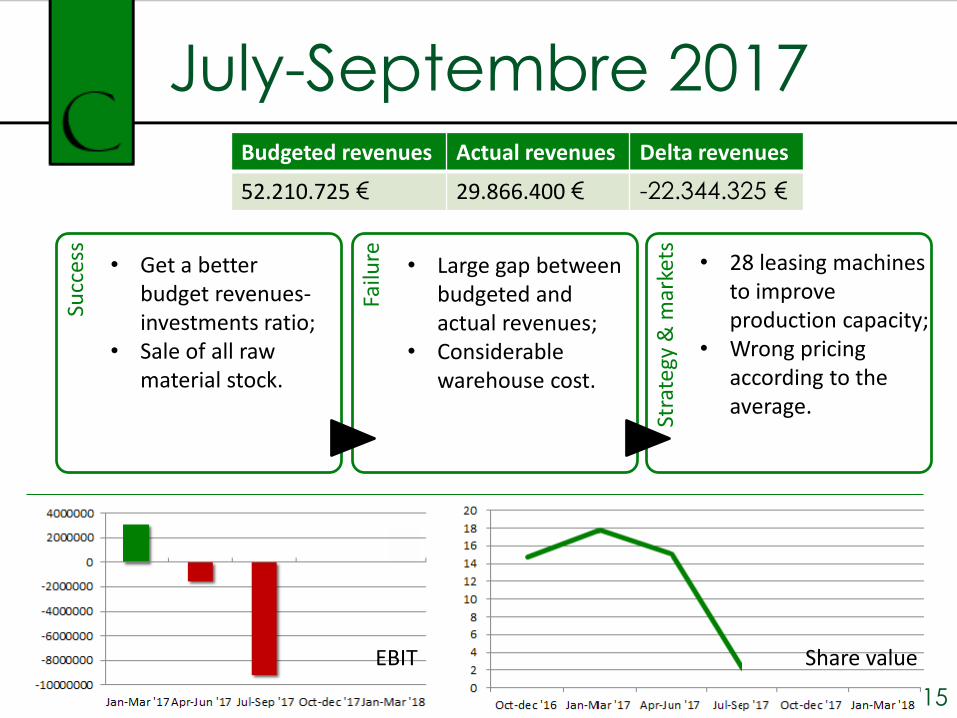
July-Septembre 2017
EBIT Share value
• Get a betterbudget revenues-investments ratio;
• Sale of all rawmaterial stock.
• Large gap betweenbudgeted and actual revenues;
• Considerablewarehouse cost.
• 28 leasing machinesto improveproduction capacity;
• Wrong pricingaccording to the average.
Budgeted revenues Actual revenues Delta revenues
52.210.725 € 29.866.400 € -22.344.325 €
16
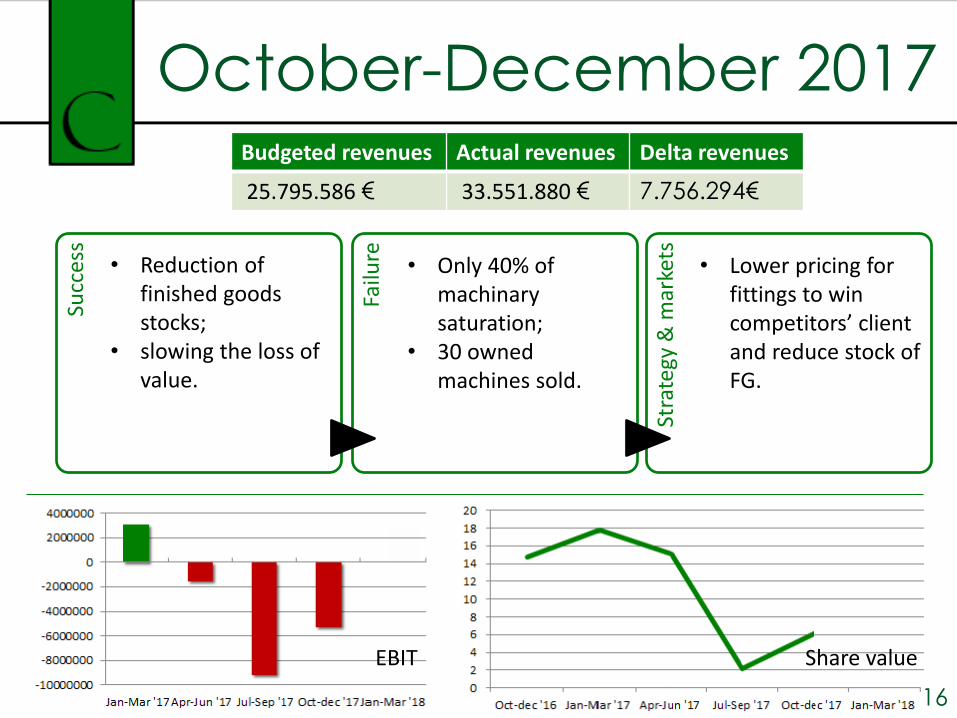
October-December 2017
EBIT Share value
Succ
ess
Failu
re
Stra
tegy
& m
arke
ts
• Reduction of finished goodsstocks;
• slowing the loss of value.
• Lower pricing for fittings to wincompetitors’ client and reduce stock of FG.
• Only 40% of machinarysaturation;
• 30 ownedmachines sold.
Budgeted revenues Actual revenues Delta revenues
25.795.586 € 33.551.880 € 7.756.294€
17
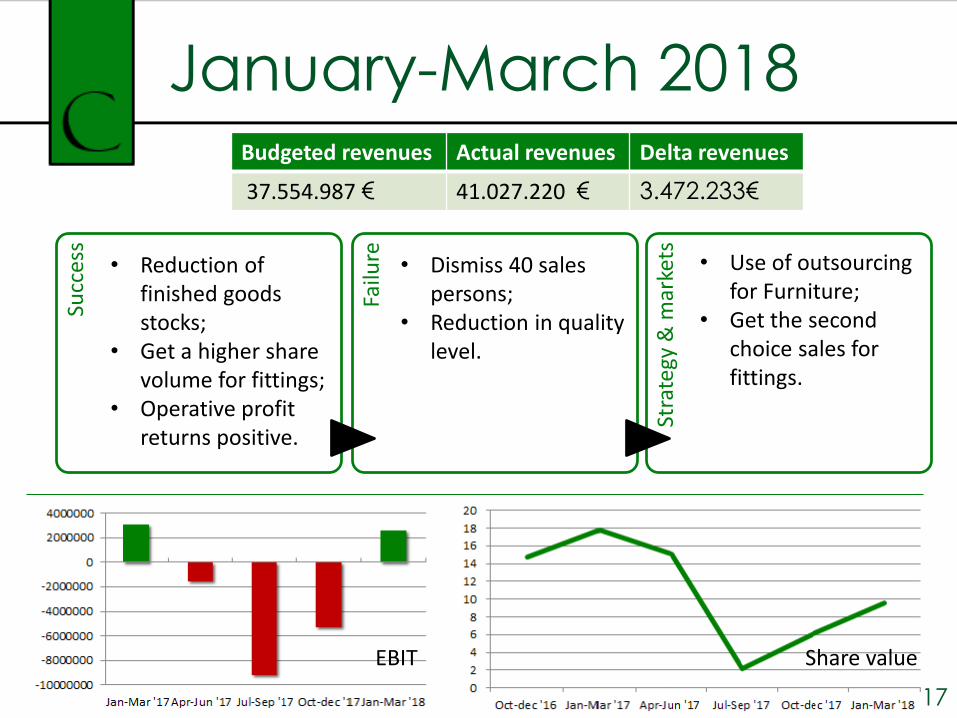
January-March 2018
EBIT Share value
Succ
ess
Failu
re
Stra
tegy
& m
arke
ts
• Reduction of finished goodsstocks;
• Get a higher share volume for fittings;
• Operative profit returns positive.
• Use of outsourcing for Furniture;
• Get the secondchoice sales for fittings.
• Dismiss 40 sales persons;
• Reduction in qualitylevel.
Budgeted revenues Actual revenues Delta revenues
37.554.987 € 41.027.220 € 3.472.233€

Conclusions
19
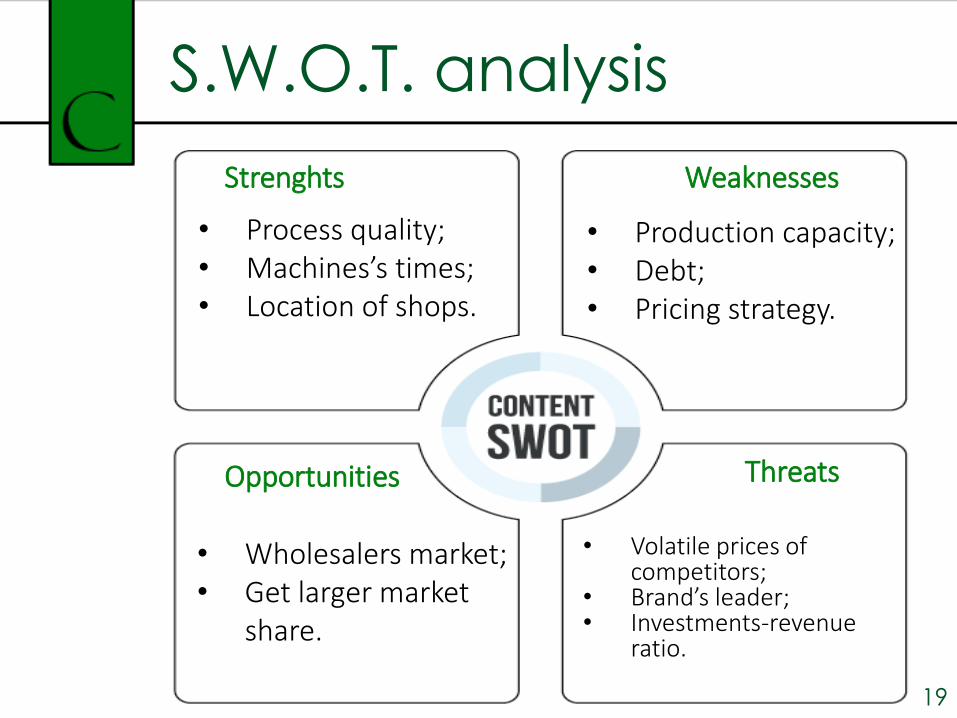
S.W.O.T. analysis
• Process quality;• Machines’s times;• Location of shops.
Strenghts Weaknesses
Opportunities Threats
• Wholesalers market;• Get larger market
share.
• Production capacity;• Debt;• Pricing strategy.
• Volatile prices of competitors;
• Brand’s leader;• Investments-revenue
ratio.
20
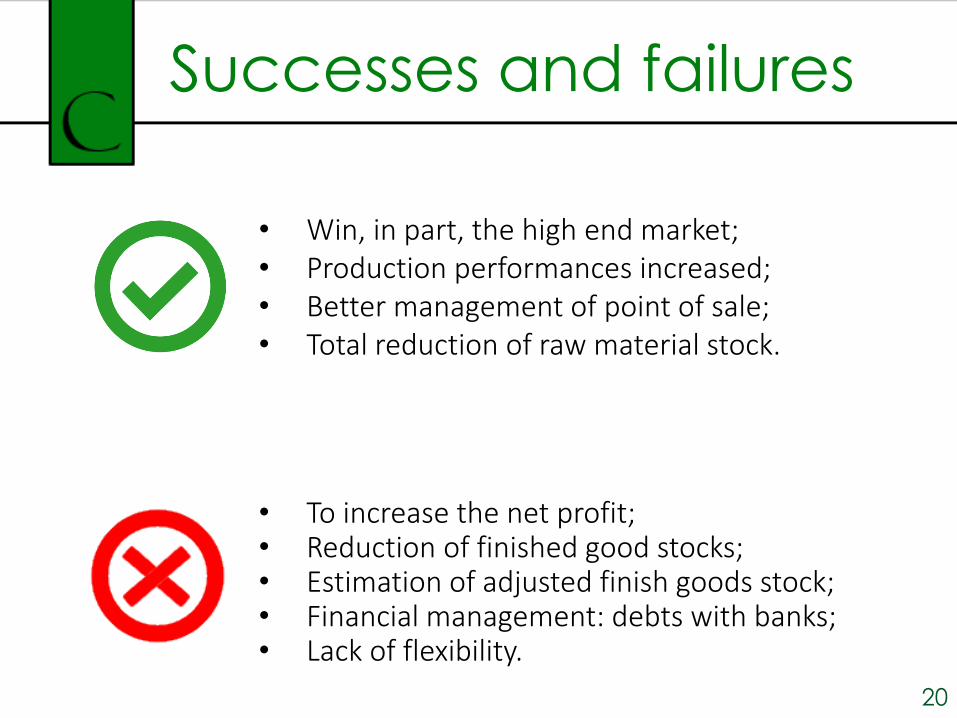
Successes and failures
• Win, in part, the high end market;• Production performances increased;• Better management of point of sale;• Total reduction of raw material stock.
• To increase the net profit;• Reduction of finished good stocks;• Estimation of adjusted finish goods stock;• Financial management: debts with banks;• Lack of flexibility.

Thanks for your
time
21