Xcelsius Present Transform spreadsheets into captivating Presentations! Xcelsius 2008.
CA Clarity-Xcelsius Implementation Guide - On Premise Release 13.3.00

This Documentation, which includes embedded help systems and electronically distributed materials, (hereinafter referred to as the “Documentation”) is for your informational purposes only and is subject to change or withdrawal by CA at any time. This Documentation is proprietary information of CA and may not be copied, transferred, reproduced, disclosed, modified or duplicated, in whole or in part, without the prior written consent of CA.
If you are a licensed user of the software product(s) addressed in the Documentation, you may print or otherwise make available a reasonable number of copies of the Documentation for internal use by you and your employees in connection with that software, provided that all CA copyright notices and legends are affixed to each reproduced copy.
The right to print or otherwise make available copies of the Documentation is limited to the period during which the applicable license for such software remains in full force and effect. Should the license terminate for any reason, it is your responsibility to certify in writing to CA that all copies and partial copies of the Documentation have been returned to CA or destroyed.
TO THE EXTENT PERMITTED BY APPLICABLE LAW, CA PROVIDES THIS DOCUMENTATION “AS IS” WITHOUT WARRANTY OF ANY KIND, INCLUDING WITHOUT LIMITATION, ANY IMPLIED WARRANTIES OF MERCHANTABILITY, FITNESS FOR A PARTICULAR PURPOSE, OR NONINFRINGEMENT. IN NO EVENT WILL CA BE LIABLE TO YOU OR ANY THIRD PARTY FOR ANY LOSS OR DAMAGE, DIRECT OR INDIRECT, FROM THE USE OF THIS DOCUMENTATION, INCLUDING WITHOUT LIMITATION, LOST PROFITS, LOST INVESTMENT, BUSINESS INTERRUPTION, GOODWILL, OR LOST DATA, EVEN IF CA IS EXPRESSLY ADVISED IN ADVANCE OF THE POSSIBILITY OF SUCH LOSS OR DAMAGE.
The use of any software product referenced in the Documentation is governed by the applicable license agreement and such license agreement is not modified in any way by the terms of this notice.
The manufacturer of this Documentation is CA.
Provided with “Restricted Rights.” Use, duplication or disclosure by the United States Government is subject to the restrictions set forth in FAR Sections 12.212, 52.227-14, and 52.227-19(c)(1) - (2) and DFARS Section 252.227-7014(b)(3), as applicable, or their successors.
Copyright © 2013 CA. All rights reserved. All trademarks, trade names, service marks, and logos referenced herein belong to their respective companies.

Contact CA Technologies
Contact CA Support
For your convenience, CA Technologies provides one site where you can access the information that you need for your Home Office, Small Business, and Enterprise CA Technologies products. At http://ca.com/support, you can access the following resources:
■ Online and telephone contact information for technical assistance and customer services
■ Information about user communities and forums
■ Product and documentation downloads
■ CA Support policies and guidelines
■ Other helpful resources appropriate for your product
Providing Feedback About Product Documentation
If you have comments or questions about CA Technologies product documentation, you can send a message to [email protected].
To provide feedback about CA Technologies product documentation, complete our short customer survey which is available on the CA Support website at http://ca.com/docs.


Contents 5
Contents
Chapter 1: Using Xcelsius to Display Real-time CA Clarity PPM Data 7
About CA Clarity PPM-Xcelsius Support ....................................................................................................................... 7
Who Should Read this Guide ........................................................................................................................................ 8
Interactive Portlets ....................................................................................................................................................... 9
Connection Methods for Real-Time Data Exchanges ................................................................................................. 10
CA Clarity PPM Web Service ............................................................................................................................... 10
Query as a Web Service (QaaWS) ....................................................................................................................... 11
Interactive Portlet Parameters ................................................................................................................................... 12
Global Parameters .............................................................................................................................................. 12
Object Parameters .............................................................................................................................................. 15
Chapter 2: Before You Get Started 17
Tools and Resources for an Xcelsius Implementation ................................................................................................ 17
Xcelsius Client Installation Checklist .......................................................................................................................... 18
Install the Xcelsius Client ............................................................................................................................................ 19
Enable Cross-domain CA Clarity PPM Data Transfers ................................................................................................ 19
Install CA Clarity PPM Color Schemes in Xcelsius ....................................................................................................... 20
Install Sample Xcelsius Dashboards............................................................................................................................ 21
Chapter 3: Setting up Interactive Portlets 23
How to Set up an Interactive Portlet for Real-time Data ........................................................................................... 23
Set up the CA Clarity PPM Web Service Connection to Xcelsius Visualizations ......................................................... 24
Set up the QaaWS Connection to Xcelsius Visualizations .......................................................................................... 26
Add a Web Connection Definition .............................................................................................................................. 27
Add Flash Variable Definitions ................................................................................................................................... 29
Test the Data Connection at Design-time .................................................................................................................. 29
Create the Interactive Portlet .................................................................................................................................... 30
Create Object or Global Parameters .......................................................................................................................... 31
Chapter 4: Example: Interactive Portlet using Web Services Connection Method 33
The Problem: Request to Analyze Resource Capacity and Demand .......................................................................... 33
The Solution: Create an Xcelsius Visualization with Real-Time CA Clarity PPM Data ................................................ 33
Create the Visualization and the NSQL Query .................................................................................................... 34
Add the Connection Definition to Link to CA Clarity PPM Data .......................................................................... 38

6 CA Clarity-Xcelsius Implementation Guide - On Premise
Set Up Flash Variables ......................................................................................................................................... 41
Test the Visualization and Create an Interactive Portlet .................................................................................... 43
The Result: Performing the Analysis Based on the Xcelsius Visualization.................................................................. 44
Chapter 5: Example: Using an Object Parameter to Filter Portfolio Investments 45
Appendix A: Stock Interactive Portlets 47
Design Files for Stock Xcelsius Visualizations ............................................................................................................. 47
Stock Queries Used in Xcelsius Dashboards ............................................................................................................... 47
Resource Planning Portlet .......................................................................................................................................... 48
Portfolio Portlet.......................................................................................................................................................... 49
Portfolio Dashboard ............................................................................................................................................ 51
Project Status Portlet ................................................................................................................................................. 55
Investment Overview Dashboard ............................................................................................................................... 57
Chapter 1: Using Xcelsius to Display Real-time CA Clarity PPM Data 7
Chapter 1: Using Xcelsius to Display Real-time CA Clarity PPM Data
This section contains the following topics:
About CA Clarity PPM-Xcelsius Support (see page 7) Who Should Read this Guide (see page 8) Interactive Portlets (see page 9) Connection Methods for Real-Time Data Exchanges (see page 10) Interactive Portlet Parameters (see page 12)
About CA Clarity PPM-Xcelsius Support
Xcelsius is a dashboard tool used to build visualizations that provide a visually rich and interactive approach to analyzing data. You can export a visualization to the Flash file format and create an interactive portlet in CA Clarity PPM. Xcelsius visualizations can display real-time CA Clarity PPM data outside of CA Clarity PPM, such as from a PowerPoint presentation, Word document, and more.
To get optimal performance from your Xcelsius visualizations, follow the guidelines outlined in the BusinessObjects Xcelsius 2008 User Guide. For example, set up complex calculations in the database queries.
The CA Clarity PPM-Xcelsius integration supports the following:
■ Real-time CA Clarity PPM data transfers using CA Clarity PPM Web Services or Business Objects Query as a Web Service as the connection method.
■ Secured data transfers that authenticate CA Clarity PPM users through session IDs and that preserve CA Clarity PPM access rights. Users only see information they have rights to view.
■ Context-aware Xcelsius visualizations automatically filter data based on where the interactive portlet is located in CA Clarity PPM. Some examples:
– Overview page displays unfiltered data, such as all the projects
– Project page displays filtered data, such as projects managed by a particular user.
■ Color scheme consistency between the Xcelsius visualization and CA Clarity PPM.
■ Multiple language support enables users to view information using their preferred language.

Who Should Read this Guide
8 CA Clarity-Xcelsius Implementation Guide - On Premise
In addition to Xcelsius, the following are the primary components used to implement Xcelsius visualizations with real-time CA Clarity PPM data. See the following for details on each of the components:
■ Interactive Portlets (see page 9)
■ Connection Methods (see page 10)
■ Global and Object Parameters (see page 12)
Who Should Read this Guide
Intended Audience
This guide is written for a technical audience. The guide assumes that you are familiar with the following products and know how to perform the following tasks listed under each one:
In Xcelsius:
■ Create visualizations
■ Use the Data Manager
In Studio:
■ Develop and configure CA Clarity PPM Studio objects
■ Use NSQL and WDSL (if you plan to use the web services connection method)
■ Create portlets
In Business Objects:
■ Use Business Objects universes
■ Create queries using the Query as a Web Service tool
What Is Covered
This guide explains how to:
■ Download Xcelsius from CA Clarity PPM and install it
■ Set up to use real-time data from CA Clarity PPM in an Xcelsius visualization
■ Enable cross-domain data transfers that allow real-time data to be displayed in applications other than CA Clarity PPM
■ Set up the CA Clarity PPM color scheme in Xcelsius
■ Install and use the sample Xcelsius files provided with CA Clarity PPM

Interactive Portlets
Chapter 1: Using Xcelsius to Display Real-time CA Clarity PPM Data 9
What Is Not Covered and Where You Can Find the Information
This guide does not explain how to:
■ Use Xcelsius or create visualizations
See the BusinessObjects Xcelsius 2008 User Guide for more information. This guide from SAP provides detailed information about visualizations and the Xcelsius Data Manager.
■ Create NSQL queries.
For more information, see the Studio Developer’s Guide. This guide provides a general overview of interactive portlets for the administrator who wants to add interactive portlets when configuring an object. This guide also provides information about creating queries and NSQL. Also, see the XML Open Gateway Developer Guide for information about WSDL and query WSDLs.
■ Personalize user pages with interactive portlets
For more information, see the Basics User Guide. This guide provides a general overview of the interactive portlets for basic CA Clarity PPM users. The guide is for those who want to personalize pages with interactive portlets or to add interactive portlets to personal dashboards or portlets.
Interactive Portlets
Interactive portlets display visually rich CA Clarity PPM information in real time. Interactive portlets are created in CA Clarity PPM and contain Xcelsius visualizations. These visualization are exported as vector-based graphic Adobe Flash (.SWF) files and imported into CA Clarity PPM. Interactive portlets use global and object parameters with associated Flash variables to establish secured data transfers and to create context-aware visualizations.
Use interactive portlets to:
■ Perform what-if analyses
■ Set up alerts
■ Drill down to go to more detailed information
■ Mouseover areas to view more information
After the Xcelsius visualizations are imported into the interactive portlets, associate them with objects, such as the Project object or Resource object. You can make Xcelsius visualizations available on object pages. Users can personalize their pages and add interactive portlets anywhere in CA Clarity PPM, such as their overview page.
For more information, see the Basics User Guide.
Connection Methods for Real-Time Data Exchanges
10 CA Clarity-Xcelsius Implementation Guide - On Premise
Connection Methods for Real-Time Data Exchanges
To enable real-time data exchanges between Xcelsius and CA Clarity PPM, set up the data connection using one of the following connection methods:
■ CA Clarity PPM Web Service (see page 10). Use this connection method if you want to get real-time CA Clarity PPM data through the CA Clarity PPM Web Service.
■ Query as a Web Service (QaaWS) (see page 11). Use this connection method if you want to get real-time CA Clarity PPM data through the Business Objects Query as a Web Service.
These connections include the data sources that establish real-time data exchanges with CA Clarity PPM. You set up and configure the data connections for your visualizations using the Xcelsius Data Manager.
See the BusinessObjects Xcelsius 2008 User Guide for more information.
CA Clarity PPM Web Service
The CA Clarity PPM Web Service connection method enables a visualization to get real-time data.
The CA Clarity PPM Web Service connection method is a good choice when:
■ Your CA Clarity PPM implementation is integrated with a solution other than Business Objects.
■ You want to use CA Clarity PPM to establish the data source. Experience writing NSQL is required.
■ You are unable to use the Query as a Web Service connection method.
Secured data transfers are established in the following ways:
■ Authorization. A secured session for the logged in CA Clarity PPM user is enabled by creating a Flash variable, such as session_ID, in the Xcelsius visualization. A corresponding a session ID is defined in the Clarity Session ID in SOAP Header global parameter in the interactive portlet. The Flash Variable Name field of the global parameter must reference the exact Flash variable name in the Xcelsius visualization.
Connection Methods for Real-Time Data Exchanges
Chapter 1: Using Xcelsius to Display Real-time CA Clarity PPM Data 11
■ Access control. User access rights are preserved by including an NSQL security clause to help ensure that users see only the data to which they have access.
Example
Xcelsius visualization design files (.XLF) are available to get you started quickly. These samples can help you set up Xcelsius visualizations using the CA Clarity PPM Web Service connection method. To review these samples, download Design Files for Stock Xcelsius Visualizations from CA Clarity PPM on the software downloads page.
Query as a Web Service (QaaWS)
The Query as a Web Service (QaaWS) connection method enables the Xcelsius visualization. QaaWS is used to get real-time CA Clarity PPM data through the web services provided by Business Objects.
The Query as a Web Service connection method is a good choice when:
■ You want to get the real-time CA Clarity PPM data through your Business Objects web services.
■ You prefer to use CA Clarity PPM Business Object universes to establish the data source. Experience writing NSQL is not required.
Important! To use this connection method, you must have access to the Business Objects Query as a Web Service tool. If you are licensed to use CA Clarity PPM through a service provider, contact your service provider to discuss your connection method options.
Secured data transfers are established in the following ways:
■ Authorization. A secured session is established for the logged in CA Clarity PPM user by making the Business Objects Session ID available to the Xcelsius visualization. To establish the session, a flash variable named CELogonToken is created in the Xcelsius visualization and mapped to any cell in an Excel sheet. The interactive portlet uses the Business Objects Session ID global parameter.
■ Access control. User access rights are preserved through Business Objects universes. The stock CA Clarity PPM Business Objects universes are configured so that users see data based on access rights.

Interactive Portlet Parameters
12 CA Clarity-Xcelsius Implementation Guide - On Premise
Interactive Portlet Parameters
Use interactive portlet global and object parameters to define the information that is sent from CA Clarity PPM to the Xcelsius visualization. Interactive portlets use global and object parameters with Flash variables. Flash variables allow the visualization to accept secure data from CA Clarity PPM. The variables are defined when designing the Xcelsius visualization. Map the Flash variables to the interactive portlet by creating a corresponding interactive portlet parameter.
Global Parameters
Global parameters represent information that is available at the global level in CA Clarity PPM. You can view the information on any CA Clarity PPM page where you can include an interactive portlet. For example, you can include an interactive portlet on the overview page, a personal dashboard, or on an object page, such as the Project object.
You create global parameters from the interactive portlet in CA Clarity PPM using Studio. The data for the global parameter is made available to the Xcelsius visualization as a Flash variable. You define the mapping between the Flash variable in Xcelsius and the global parameter in the Global Parameter field. This data is available regardless of where the interactive portlet appears on CA Clarity PPM pages.
Example
Suppose you create the Language global parameter in your interactive portlet and specify the Flash variable name as "Lang". The language preference of the logged in CA Clarity PPM user is available to the Xcelsius visualization in the Flash variable named "Lang".The Language global parameter applies regardless of the CA Clarity PPM page in which you include the interactive portlet.
When configuring either of the web service connection methods in the Xcelsius Data Manager, specify the URL where the web service is hosted. You can explicitly specify the server where your web services are hosted. Alternatively, you can use the same Xcelsius visualization as-is on multiple CA Clarity PPM servers. Create either the Clarity Web Service URL global parameter or the Business Objects Web Service URL global parameter. Then enter the web service URL corresponding to the CA Clarity PPM server on which you view the Xcelsius visualization.
Download the Design Files for Stock Xcelsius Visualizations from the software downloads page. From this download, review the stock Xcelsius visualizations and better understand how these parameters are used.
For more information, see the Basics User Guide.

Interactive Portlet Parameters
Chapter 1: Using Xcelsius to Display Real-time CA Clarity PPM Data 13
The following global parameters are available:
Business Objects Session ID
Authenticates the user when the Query as a Web Service connection method is used to get real-time data.
Xcelsius visualizations using the Query as a Web Service connection method require the Business Objects SessionID global parameter of the user assessing the visualization. This information is made available to the Xcelsius visualization by creating the Business Objects Session ID global parameter.
Connection Method: Query as a Web Service
Required: When using the Query as a Web Service connection method.
Flash Variable Name: Must match the CELogonToken Flash variable name defined in Xcelsius.
Business Objects Web Service URL
Maps to the Web Service URL in Xcelsius when the Query as a Web Service connection method is used for the data exchange.
Connection Method: Query as a Web Service
Required: When using the same Xcelsius visualization as is on multiple CA Clarity PPM servers. Provide the Web Service URL for the CA Clarity PPM server from which the Xcelsius visualization is viewed. Otherwise, explicitly specify the server on which your web services are hosted when setting up the data connection in Xcelsius.
Flash Variable Name: Must match the Flash variable name defined in Xcelsius.
Example:
http://<BO_servername>/dswsbobje/qaawsservices/
Clarity Session ID in SOAP Header
Authenticates users when the CA Clarity PPM Web Service connection method is used to enable the data exchange.
Xcelsius visualizations viewed from CA Clarity PPM using the CA Clarity PPM Web Service connection method to get real-time data require the SessionID of the user. The SessionID is used to authenticate with the web service. This information is made available to the Xcelsius visualization by creating the Clarity Session ID in SOAP Header global parameter.
Connection Method: CA Clarity PPM Web Service
Required: When using the CA Clarity PPM Web Service connection method.
Flash Variable Name: Must match the Flash variable name defined in Xcelsius.
Example:
<n0:Auth><n0:SessionID><CLARITY_SESSION_ID>
</n0:SessionID></n0:Auth>

Interactive Portlet Parameters
14 CA Clarity-Xcelsius Implementation Guide - On Premise
Clarity User Internal ID
Identifies the Internal ID associated with the logged in CA Clarity PPM user.
Example: You can use this global parameter to filter data by the internal ID to allow users to view global, user-specific information from the Xcelsius visualization.
Connection Method: CA Clarity PPM Web Service and Query as a Web Service
Required: No
Flash Variable Name: Must match the Flash variable name defined in Xcelsius.
Clarity User Name
Identifies the user name of the logged in CA Clarity PPM user.
Example: You can use this parameter to filter data by the user name to allow users to view global, user-specific information from the Xcelsius visualization.
Connection Method: Web Service Connection and QaaWS
Required: No
Flash Variable Name: Must match the Flash Variable name defined in Xcelsius.
Clarity Web Service URL
Maps the Web Service URL when you use the CA Clarity PPM Web Service connection method to access CA Clarity PPM web services.
Connection Method: CA Clarity PPM Web Service Connection
Required: When using the same Xcelsius visualization on multiple CA Clarity PPM servers. Provide the Web Service URL for the CA Clarity PPM server from which you view the Xcelsius visualization. Otherwise, explicitly specify the server on which your web services are hosted when setting up the data connection in Xcelsius.
Flash Variable Name: Must match the Flash variable name defined in Xcelsius.
Example:
http://<servername>/niku/xog
Language
Identifies the language preference of the logged in CA Clarity PPM user. The user can determine the language associated with the Xcelsius visualizations using the account settings page.
Connection Method: CA Clarity PPM Web Service Connection and Query as a Web Service
Required: No
Flash Variable Name: Must match the Flash variable name defined in Xcelsius.

Interactive Portlet Parameters
Chapter 1: Using Xcelsius to Display Real-time CA Clarity PPM Data 15
Object Parameters
Object parameters allow CA Clarity PPM object-related information to pass to the Xcelsius visualization.
For example, consider passing information about a project manager to the Xcelsius visualization. To do that, create an object parameter in the interactive portlet that selects the Project object and Manager field. Information is made available to the Xcelsius visualization in the Flash variable by the name entered in the Flash Variable Name field.
Object parameters support stock objects and custom objects.
The object you select when creating an object parameter depends on the value selected for Instance Type when you create the interactive portlet. The following Instance Type options are available:
■ General. Allows the interactive portlet to embed on any CA Clarity PPM page where a portlet is included.
For example, select General as the Instance Type from the interactive portlet page and then select any object from the Object drop down.
■ Object. Restricts the interactive portlet to the selected object. Select an object, such as Resource or Project.
For example, select Project from the Object drop down and Manager from the Field drop down. Then enter Proj_Mgr in the Flash Variable Name field. If the interactive portlet is embedded on a page associated with the Project object, the project manager name is passed to the visualization. The project manager name is passed through the Proj_Mgr Flash variable. If the same interactive portlet is added to the overview page, the Proj_Mgr Flash variable has an empty value. The Xcelsius visualization displays all project information regardless of the project manager.


Chapter 2: Before You Get Started 17
Chapter 2: Before You Get Started
This section contains the following topics:
Tools and Resources for an Xcelsius Implementation (see page 17) Xcelsius Client Installation Checklist (see page 18) Install the Xcelsius Client (see page 19) Enable Cross-domain CA Clarity PPM Data Transfers (see page 19) Install CA Clarity PPM Color Schemes in Xcelsius (see page 20) Install Sample Xcelsius Dashboards (see page 21)
Tools and Resources for an Xcelsius Implementation
The following tools and resources are available to take advantage of Xcelsius visualizations and setting them up for real-time CA Clarity PPM data transfers:
SAP BusinessObjects Xcelsius 2008
Used to download and install the Xcelsius locally on your computer. Use Xcelsius to create visualizations and to set up the data connections.
Note: For this download link to display on the software downloads page, download access rights to install Xcelsius is required. Your CA Clarity PPM administrator must perform the required setup step to copy the Xcelsius setup zip file to a CA Clarity PPM install folder.
Contact your CA Clarity PPM administrator if you are unable to download Xcelsius.
Required: Yes
Download from CA Clarity PPM software downloads page.
For more information, see the Basics User Guide.
CA Clarity UI Themes as Xcelsius Color Schemes
Used to give your Xcelsius visualizations the same colors as your portlets and pages in CA Clarity PPM. The CA Clarity PPM UI themes are available to use in Xcelsius visualizations.
Follow the instructions on the software downloads page for information about making UI themes available as Xcelsius color schemes.
Required: No
Download from CA Clarity PPM software downloads page.
For more information, see the Basics User Guide.

Xcelsius Client Installation Checklist
18 CA Clarity-Xcelsius Implementation Guide - On Premise
Design Files for Stock Xcelsius Visualizations
Used to help you get started with sample implementations. You can use the Xcelsius visualizations design files (.XLF) as is, or you can use them as a starting point to design your own Xcelsius visualizations.
See the CA Clarity-Xcelsius Implementation Guide for more information.
Required: No
Download from CA Clarity PPM software downloads page.
For more information, see the Basics User Guide.
Query as a Web Service tool
Required only if you are using the Query as a Web Service connection method. This tool is available only if you have Business Objects installed.
If you are licensed to use CA Clarity PPM through a service provider, contact your service provider to discuss whether this option is available to you.
Xcelsius Client Installation Checklist
Following is the checklist that helps you prepare for installing Xcelsius Client:
■ You have access rights to download Xcelsius Client.
Xcelsius.zip file is available in the CA Clarity PPM downloads folder, Clarity <install>\webroot\downloads.
Software Download - Xcelsius
Required to download Xcelsius.
Type: Global
■ You have rights to install Xcelsius on your client computer.
Notes: Contact your CA Clarity PPM administrator for access permissions and availability of the Xcelsius.zip file.

Install the Xcelsius Client
Chapter 2: Before You Get Started 19
Install the Xcelsius Client
Install SAP BusinessObjects Xcelsius by downloading the .zip file from Software Downloads page. This installation includes the setup.exe, user guides, tutorials, and more.
Follow these steps:
1. In CA Clarity PPM, open Home, and from Personal, click Account Settings.
The personal information page appears.
2. Click Software Downloads.
3. Click the Download link next to SAP BusinessObjects Xcelsius and save the .zip file to a location on your computer.
4. On your computer, navigate to the .zip file and extract the contents.
5. Run the setup.exe. For example, located in the folder path:
C:\downloads\Xcelsius-SPx\DATA_UNITS\Xcelsius\setup.exe
6. Follow the instructions on the installation wizard to complete the installation.
If you accept all the defaults, Xcelsius is installed on:
c:\Program Files\Business Objects\Xcelsius
Enable Cross-domain CA Clarity PPM Data Transfers
If you plan to display Xcelsius visualizations in any of the following ways, set up for cross-domain data transfers:
■ Dashboard outside CA Clarity PPM
■ Dashboard inside CA Clarity PPM using data from the Business Objects universes
■ Dashboard inside CA Clarity PPM when the application server name is different than the server hosting Web Services
If you are licensed to use CA Clarity PPM through a service provider, contact your service provider to discuss whether this option is available to you.

Install CA Clarity PPM Color Schemes in Xcelsius
20 CA Clarity-Xcelsius Implementation Guide - On Premise
Follow these steps:
1. Create an XML file with the following and save as crossdomain.xml:
<?xml version="1.0"?>
<!DOCTYPE cross-domain-policy SYSTEM
"http://www.macromedia.com/xml/dtds/cross-domain-policy.dtd">
<cross-domain-policy>
<allow-http-request-headers-from domain="*" headers="*" secure="false" />
<allow-access-from domain="*" secure="false" />
</cross-domain-policy>
Note: domain=* allows access from any domain. The domain access can be restricted and this limits the access for outside domains. For example, *.acme.com, www.acme.com (www.acme.com).
2. Add the crossdomain.xml file to the following paths for each connection method:
■ CA Clarity PPM Web Service: <Clarity_home>\tomcat-app-deploy\ROOT
■ Query as a Web Service: /<BO_INSTALL_DIR>/bobje/Tomcat7/webapps/ROOT
Install CA Clarity PPM Color Schemes in Xcelsius
Optionally, install CA Clarity UI Themes as Xcelsius Color Schemes on Xcelsius. Apply CA Clarity PPM color to visualizations to give them the same look-and-feel as a CA Clarity PPM page.
Follow these steps:
1. In CA Clarity PPM, open Home, and from Personal, click Account Settings.
The personal information page appears.
2. Click Software Downloads.
3. Click the Download link next to CA Clarity UI Themes as Xcelsius Color Schemes.
4. Click the Clarity_Color_Schemes_for_XC.zip link and extract the contents to the following location.
<Xcelsius Install Folder>\assets\themes\built-in
CA Clarity PPM color schemes are available in Xcelsius and can be applied to Xcelsius visualizations.

Install Sample Xcelsius Dashboards
Chapter 2: Before You Get Started 21
Install Sample Xcelsius Dashboards
Optionally, install the Design Files for Stock Xcelsius Visualizations on your computer to view sample Xcelsius visualizations. The visualizations are prepopulated with CA Clarity PPM data and Web Service Connection settings.
These sample Xcelsius files are the visualizations added to the stock interactive portlets The following sample Xcelsius files are available to help you get started and to test web service connections:
■ Portfolio Dashboard.xlf. Corresponds to the stock interactive portlet, Portfolio.
■ Resource Dashboard.xlf. Corresponds to the stock interactive portlet, Resource.
You must have the following access right to download these sample files:
Software Download - Xcelsius
Required to download Xcelsius.
Type: Global
Follow these steps:
1. In CA Clarity PPM, open Home, and from Personal, click Account Settings.
The personal information page appears.
2. Click Software Downloads.
3. Click the Download link next to Design Files for Stock Xcelsius Visualizations and save the .zip file to a location on your computer.
4. Navigate to the DesignFiles_for_StockXcelsiusDashboards.zip file and extract the contents to a designated folder. For example:
c:\Xcelsius\ClaritySamples
Open these files in Xcelsius to review best-practice setup and to test web service connections.


Chapter 3: Setting up Interactive Portlets 23
Chapter 3: Setting up Interactive Portlets
This section contains the following topics:
How to Set up an Interactive Portlet for Real-time Data (see page 23) Set up the CA Clarity PPM Web Service Connection to Xcelsius Visualizations (see page 24) Set up the QaaWS Connection to Xcelsius Visualizations (see page 26) Add a Web Connection Definition (see page 27) Add Flash Variable Definitions (see page 29) Test the Data Connection at Design-time (see page 29) Create the Interactive Portlet (see page 30) Create Object or Global Parameters (see page 31)
How to Set up an Interactive Portlet for Real-time Data
The following process provides the basic steps on how to set up an interactive portlet that displays real-time CA Clarity PPM data. These instructions assume that you have installed the required tools for an Xcelsius implementation and have the appropriate access rights.
To get optimal performance from your Xcelsius visualizations, follow the guidelines outlined in the BusinessObjects Xcelsius 2008 User Guide. For example, set up complex calculations in the database queries.
1. In Xcelsius, create the visualization.
Best Practice: Create a mockup of the visualization and create a static visualization in Xcelsius when you first build an interactive portlet.
See the BusinessObjects Xcelsius 2008 User Guide for more information.
2. Set up the web services used to transfer data between CA Clarity PPM and Xcelsius. Do one of the following:
■ Set up a CA Clarity PPM Web Service connection (see page 24).
■ Set up a Query as a Web Service connection (see page 26).
3. In Xcelsius, export the visualization to the Flash (SWF) file format and save this file to your local drive.
See the BusinessObjects Xcelsius 2008 User Guide for more information.
4. In CA Clarity PPM, create the interactive portlet.
For more information, see the Studio Developer’s Guide.

Set up the CA Clarity PPM Web Service Connection to Xcelsius Visualizations
24 CA Clarity-Xcelsius Implementation Guide - On Premise
5. Create global and object parameters.
These interactive portlet parameters are used to define the CA Clarity PPM information that is sent to the Xcelsius visualization. Use these parameters to map to the Flash variables created in Xcelsius to establish the real-time data connection between CA Clarity PPM and Xcelsius.
For more information, see the Studio Developer’s Guide.
Set up the CA Clarity PPM Web Service Connection to Xcelsius Visualizations
Use these steps to do the following:
■ Set up CA Clarity PPM Web Service as the data source
■ Establish real-time data transfers between CA Clarity PPM and the Xcelsius visualization
Follow these steps:
1. In CA Clarity PPM, create a query.
■ Write a SELECT statement to transfer CA Clarity PPM data to Xcelsius.
■ Add the SECURITY in the WHERE clause. You can include access rights information in NSQL statement to add advanced security to interactive portlets.
For more information, see the Studio Developer’s Guide.
2. Complete the following steps:
a. Navigate to CA Clarity PPM Web Services using the following URL.
http://<servername:port>/niku/wsdl/
b. View the web query WDSL associated with the query you created for your interactive portlet.
c. Make note of the URL of the query.
For more information, see the XML Open Gateway Developer Guide.
3. In Xcelsius, open the Data Manager and set up the web service to establish the connection with CA Clarity PPM.
See the BusinessObjects Xcelsius 2008 User Guide for more information.
a. Complete the following fields:
WSDL URL
Defines the URL of the web service to import the URL.

Set up the CA Clarity PPM Web Service Connection to Xcelsius Visualizations
Chapter 3: Setting up Interactive Portlets 25
Method
Defines the Web service connection.
Value: Query
Web Service URL
Defines the mapping for an output value of the Web service to a cell in the embedded spreadsheet.
Query Code
Defines the mapping for an output value of the Web service to a cell in the embedded spreadsheet.
Records
Defines the mapping for an output value of the Web service to a cell in the embedded spreadsheet.
b. Click the Usage tab and select Options to refresh the connection.
c. Click the Advanced tab and define the mapping for SOAP header to a cell in the embedded spreadsheet.
d. Create the following Flash variables. The names used to define these Flash variables are mapped to the interactive portlet as global and object parameters:
– Session ID. Required to receive the Session ID of the CA Clarity PPM user accessing the Xcelsius visualization in CA Clarity PPM. This named Flash variable is mapped to the interactive portlet as the Clarity Session ID in SOAP Header global parameter.
– (Optional) Web Service URL. Optional. Define if you want to use the same Xcelsius visualization as is on multiple CA Clarity PPM servers. This named Flash variable is mapped to the interactive portlet as the Clarity Web Service URL global parameter.
– (Optional) Other CA Clarity PPM information, such as user name, user internal ID, or language. These named Flash variables are mapped to the interactive portlet as the Clarity User Name, Clarity User Internal ID, or Language global parameters, respectively.
– (Optional) CA Clarity PPM object-related information to change the behavior based on where the interactive portlet is located in CA Clarity PPM. These named Flash variables are mapped to the interactive portlet as the object parameters that you create.

Set up the QaaWS Connection to Xcelsius Visualizations
26 CA Clarity-Xcelsius Implementation Guide - On Premise
Set up the QaaWS Connection to Xcelsius Visualizations
Use these steps if you are using the Query as a Web Service (QaaWS) to establish real-time data transfers between CA Clarity PPM and the Xcelsius visualization.
Users who view Xcelsius visualizations that transfer data using the Query as a Web Service connection method must be members of the following Business Objects security groups:
■ QaaWS Group Designer
■ CA-PPM-Reporting-Designer-User
For more information, see the Administration Guide.
Follow these steps:
1. In the Query as a Web Service tool, create the Query. Do the following:
a. Enter a description for the Web Service.
b. Select a Universe.
c. Drag and drop Universe objects and classes to create the Query.
d. View the web query WSDL URL associated with the query you created for the interactive portlet. Make note of the URL of the query.
2. In Xcelsius, open the Data Manager and set up the web service to establish the connection with to CA Clarity PPM.
See the BusinessObjects Xcelsius 2008 User Guide for more information.
a. Complete the following field:
WSDL URL
Defines the URL of the web service to import the URL.
b. Map Output Values of the Web service to the appropriate cells in the spreadsheet.
c. Create the following Flash variables. The names used to define these Flash variables are mapped to the interactive portlet as global and object parameters:
– Session ID. Required to receive the Session ID of the CA Clarity PPM user accessing the Xcelsius visualization in CA Clarity PPM. This named Flash variable is mapped to the interactive port as the Business Objects Session ID global parameter.
Required Name: CELogonToken

Add a Web Connection Definition
Chapter 3: Setting up Interactive Portlets 27
– (Optional) Web Service URL. Optional. Define if you want to use the same Xcelsius visualization as is on multiple CA Clarity PPM servers. This named Flash variable is mapped to the interactive portlet as the Business Objects Web Service URL global parameter.
– (Optional) Other CA Clarity PPM information, such as user name, user internal ID, or language. The named Flash variables are mapped to the interactive portlet as the Clarity User Name, Clarity User Internal ID, or Language global parameters, respectively.
– (Optional) CA Clarity PPM object-related information to change the behavior based on where the interactive portlet is located in CA Clarity PPM. These named Flash variables are mapped to the interactive portlet as the object parameters that you create.
d. Link components to the embedded spreadsheet.
Add a Web Connection Definition
For either the Web Services Connection method or the Query as a Web Service connection method, create a connection definition in Xcelsius using the Data Manager.
The approach to connecting real-time data from CA Clarity PPM to an Xcelsius visualization can vary depending on the following:
■ Your level of experience with Xcelsius and Microsoft Excel spreadsheets (basic as opposed to advanced)
■ Connection choices you make, such as dynamically connecting to multiple Web Service URLs or displaying a visualization in another language
■ The complexity of the visualization you are designing in Xcelsius
To allow real-time CA Clarity PPM data transfers, you must bind elements to cells in the embedded Excel spreadsheet of a visualization. The series of steps enable the components of the visualization to retrieve data from the cells to which they are bound. The external data connection, either the Web Service connection or Query as a Web Service, must be configured to insert data into the embedded spreadsheet. Components that use the data from the external source are then bound to the cells updated by the external connection.

Add a Web Connection Definition
28 CA Clarity-Xcelsius Implementation Guide - On Premise
The following figure shows the Data Manager with a basic external data connection setup:
The following figure illustrates the corresponding, embedded spreadsheet for the web service connection:
Create an external data connection for each query associated with the visualization. In addition, create one for the Flash variables that map to the global and object parameters.
■ Query external data connection. Enables you to link data connection and query elements to cells in the embedded spreadsheet. For example, you might link the following to spreadsheet cells: the WSDL URL, connection method, web service URL, and each query data element.

Add Flash Variable Definitions
Chapter 3: Setting up Interactive Portlets 29
■ Flash Variable external data connection. Enables you to create named Flash variables used in global and object parameters of an interactive portlet, such as the required global parameter, session ID.
For complete information about how to set up a data connection definition, see the following:
■ SAP BusinessObjects Xcelsius 2008 User Guide.
■ The following section in this guide: Example: Interactive Portlet Using Web Services Connection.
■ The sample file Resource Dashboard.xlf. This file is provided as part of the Design Files for Xcelsius Visualizations download available from CA Clarity PPM. You can open the file in Xcelsius to view the Data Manager and the embedded Excel spreadsheet.
Add Flash Variable Definitions
Flash variables are defined in Xcelsius. For each Flash variable, create a corresponding global or object parameter for the interactive portlet in CA Clarity PPM. At runtime, the Web Service URL passes a value from CA Clarity PPM using the parameter to the Flash variable. The Flash variable saves the value to a linked (bound) cell in the embedded spreadsheet. Components in the visualization are also bound to spreadsheet cells and the visualization data is generated from the embedded spreadsheet.
Test the Data Connection at Design-time
After you set up the run-time connection, test the data connection from Xcelsius. Do the test before you export the Xcelsius visualization to a SWF file.
Important! Cross-domain must be enabled if you are logged in to CA Clarity PPM through a different URL than your Web Services URL.
Follow these steps:
1. Log in to CA Clarity PPM, and click the About.
The about page appears.
2. In the User information section, make note of your current session ID.
3. In Xcelsius, do the following:
a. Create a row in the embedded spreadsheet and complete the following actions:
■ In cell a, add a label, such as Design-time Session ID.

Create the Interactive Portlet
30 CA Clarity-Xcelsius Implementation Guide - On Premise
■ In cell b, enter the following:
<n0:Auth><n0:SessionID>0000000__-0z11111:22y222222x2:-3a3b3333333333333</
n0:SessionID></n0:Auth>
where 0000000__-0z11111:22y222222x2:-3a3b3333333333333 is your current session ID
Note: If you close your CA Clarity PPM session, update this cell with your latest session ID.
b. Create a second new row in the embedded spreadsheet and complete the following actions:
■ In cell a, add a label, such as Design-time URL.
■ In cell b, enter the web service URL.
4. In Xcelsius, save the visualization and preview it to test the connection.
If the connection is successful, you are ready to export to a .SWF file. If the connection is not successful recheck your data connection settings.
Create the Interactive Portlet
Use the following procedure to create an interactive portlet and import the Xcelsius visualization.
Before you start, create the Xcelsius visualization and export it to the Flash (.SWF) format.
Follow these steps:
1. In CA Clarity PPM, open Administration, and from Studio, click Portlets.
The portlet list appears.
2. Click New Portlet and select Interactive Portlet.
The create page appears.
3. Complete the following fields:
Portlet Name
Defines the name of the portlet. This name appears on the title bar of the portlet and in the list of available portlets.
Portlet ID
Defines a unique alphanumeric identifier for the portlet.
Content Source
Specifies where the data that appears in the portlet originates.

Create Object or Global Parameters
Chapter 3: Setting up Interactive Portlets 31
Category
Specifies the general area on which the portlet reports data.
Description
Defines the purpose of the portlet and provides any relevant information.
Active
Indicates the portlet is active and is visible to users. You can edit inactive portlets and activate them later.
Default: Selected
Instance Type
Specifies the type of page the portlet can be placed on. If you select General, the portlet can be added to any CA Clarity PPM page. If you select an Object, the portlet can only be added to CA Clarity PPM pages associated with that Object.
Visualization File (.swf)
Specifies the .SWF file used for the interactive portlet content.
Click the Browse icon to select the .SWF file. Do not enter or copy the file path.
4. Save the changes.
The Xcelsius visualization is imported into the interactive portlet.
Create Object or Global Parameters
Interactive portlet object or global parameters define the data that is exchanged between CA Clarity PPM and the Xcelsius visualization. Your CA Clarity PPM administrator defines the Flash variables in Xcelsius while designing the visualization. The Flash variables allow the visualization to accept information from CA Clarity PPM. You use the Flash variable name when you create parameters in the interactive portlet.
Your CA Clarity PPM administrator must first create the Xcelsius visualization and the required Flash variables before you can create object or global parameters.
Important! You can delete object and global parameters from the parameters list page. Use care when deleting global and object parameters. Deleting these parameters can cause data instability in the Xcelsius visualization.
Follow these steps:
1. In CA Clarity PPM, open the interactive portlet.
2. Click Parameters.
The interactive portlet parameters list page appears.
Create Object or Global Parameters
32 CA Clarity-Xcelsius Implementation Guide - On Premise
3. Click New and select either Object Parameter, or Global Parameter from the drop-down.
The properties page appears for the selected parameter type.
4. Complete the following fields:
Global Parameter
(Global Parameter only) Displays the selected global parameter.
Required: Yes
Object
(Object Parameter only) Displays the name of the object to which this object parameter is associated.
Field
(Object Parameter only) Specifies the field name. The values displayed are associated with the selected object.
Required: Yes
Flash Variable Name
Defines the name for the flash variable. This name must be the same as the Flash Variable Name associated with the visualization.
For Global Parameter, BusinessObjects Session ID, displays the required value: CELogonToken
Required: Yes
Description
Defines the description for the parameter.
Limits: 240 characters
Required: No
5. Save the changes.
Chapter 4: Example: Interactive Portlet using Web Services Connection Method 33
Chapter 4: Example: Interactive Portlet using Web Services Connection Method
This section contains the following topics:
The Problem: Request to Analyze Resource Capacity and Demand (see page 33) The Solution: Create an Xcelsius Visualization with Real-Time CA Clarity PPM Data (see page 33) The Result: Performing the Analysis Based on the Xcelsius Visualization (see page 44)
The Problem: Request to Analyze Resource Capacity and Demand
The following scenario example illustrates how you can create interactive portlets and display real-time data using the CA Clarity PPM Web Service connection method.
Human Resources Executive: William
William is a Human Resource executive for Forward, Inc. and is responsible for analyzing resource capacity and demand for the company. William wants to see the resource capacity and demand using full-time equivalent (FTE) so that he can view information centrally and decide on staffing. He wants to analyze data in CA Clarity PPM from the Resource Dashboard.
The Solution: Create an Xcelsius Visualization with Real-Time CA Clarity PPM Data
Administrator: Samantha
Samantha is a CA Clarity PPM administrator for Forward, Inc. She has received a request from William to build a dashboard that can help him analyze resource use. Samantha must use Xcelsius and CA Clarity PPM to implement an Xcelsius visualization using CA Clarity PPM Web Services.
Sample Files for this Example
The solution shown in this example uses a portion of the sample design file Resource Dashboard.xlf that comes with the download: Design Files for Stock Xcelsius Visualizations. The supporting xid_qry_resCapDemand query is available from the WDSL Query to create or review the NSQL used in this example.

The Solution: Create an Xcelsius Visualization with Real-Time CA Clarity PPM Data
34 CA Clarity-Xcelsius Implementation Guide - On Premise
Create the Visualization and the NSQL Query
1. In Xcelsius, Samantha designs a visualization that includes:
– A gauge displaying the average forecasted use by FTE or by hours
– A bar graph of capacity and demand
The following figure illustrates the model for her visualization:
2. Samantha then maps the components in the visualization to the appropriate fields in CA Clarity PPM using the embedded Excel spreadsheet.
For information about how to map data in Xcelsius, refer to the SAP Xcelsius 2008 User Guide, or see the sample design file Resource Dashboard.xlf.
3. In CA Clarity PPM, Samantha creates a query that defines the SELECT statements for the data source. The query also defines the SECURITY clause to restrict user access to the data. She names the query xid_qry_resCapDemand.
The following illustration shows an abbreviated version of the xid_qry_resCapDemand query to demonstrate the SELECT statements and the SECURITY clause.

The Solution: Create an Xcelsius Visualization with Real-Time CA Clarity PPM Data
Chapter 4: Example: Interactive Portlet using Web Services Connection Method 35
SELECT @SELECT:DIM:USER_DEF:IMPLIED:TEAM:cal.month_key:month_key@,
@SELECT:DIM_PROP:USER_DEF:IMPLIED:TEAM:cal.period_start_date:start_date@,
@SELECT:DIM_PROP:USER_DEF:IMPLIED:TEAM:cal.period_end_date:end_date@,
@SELECT:DIM_PROP:USER_DEF:IMPLIED:TEAM:
ROUND(SUM(amts.avail_hrs),0):capacity_hrs@,
@SELECT:DIM_PROP:USER_DEF:IMPLIED:TEAM:
ROUND(SUM(amts.alloc_hrs),0):demand_hrs@,
@SELECT:DIM_PROP:USER_DEF:IMPLIED:TEAM:
ROUND(SUM(amts.avail_hrs)/stdcal.avail,2):capacity_fte@,
@SELECT:DIM_PROP:USER_DEF:IMPLIED:TEAM:
ROUND(SUM(amts.alloc_hrs)/stdcal.avail,2):demand_fte@,
@SELECT:DIM_PROP:USER_DEF:IMPLIED:TEAM:stdcal.avail:month_hrs@
FROM SRM_RESOURCES r
INNER JOIN PRJ_RESOURCES prjr ON r.ID = prjr.prid
LEFT OUTER JOIN SRM_RESOURCES rl ON prjr.prprimaryroleid = rl.ID
INNER JOIN NBI_DIM_CALENDAR_TIME cal ON cal.hierarchy_level = 'MONTH'
INNER JOIN ( SELECT full_name, res_id, role_id, SUM(@NVL@(avail_hrs,0)) avail_hrs,
SUM(@NVL@(alloc_hrs,0)) alloc_hrs, slice_date
FROM (
SELECT r.ID res_id, r.full_name, prjr.prprimaryroleid role_id, SUM(@NVL@(s.slice,0))
avail_hrs, 0 alloc_hrs, s.slice_date
FROM SRM_RESOURCES r
INNER JOIN PRJ_RESOURCES prjr ON r.ID = prjr.prid AND prjr.prisrole <> 1
INNER JOIN PRJ_BLB_SLICES_M_AVL s ON r.ID = s.prj_object_id
WHERE r.is_active = 1
AND s.slice_date BETWEEN @[email protected]_DOM_FIRST_FCT(@SYSDATE@) AND
@[email protected]_DOM_LAST_FCT(DATEADD(MM,5,@SYSDATE@))
GROUP BY r.ID, r.full_name, prjr.prprimaryroleid, s.slice_date
UNION ALL
SELECT r.ID res_id, r.full_name, prjr.prprimaryroleid role_id, 0 avail_hrs,
SUM(@NVL@(s.slice,0)) alloc_hrs, s.slice_date
FROM PRTEAM tm
INNER JOIN SRM_RESOURCES r ON tm.prresourceid = r.ID
INNER JOIN PRJ_RESOURCES prjr ON r.ID = prjr.prid
INNER JOIN PRJ_BLB_SLICES_M_ALC s ON tm.prID = s.prj_object_id
WHERE r.is_active = 1
AND s.slice_date BETWEEN @[email protected]_DOM_FIRST_FCT(@SYSDATE@) AND
@[email protected]_DOM_LAST_FCT(DATEADD(MM,5,@SYSDATE@))
GROUP BY r.ID, prjr.prprimaryroleid, r.ID, r.full_name, tm.prid, s.slice_date
) A
GROUP BY full_name, res_id, role_id, slice_date
) amts ON r.ID = amts.res_id AND amts.slice_date BETWEEN cal.period_start_date AND
cal.period_end_date

The Solution: Create an Xcelsius Visualization with Real-Time CA Clarity PPM Data
36 CA Clarity-Xcelsius Implementation Guide - On Premise
LEFT OUTER JOIN (SELECT r.ID res_id, SUM(s.slice) avail, s.slice_date
FROM SRM_RESOURCES r
LEFT OUTER JOIN PRJ_BLB_SLICES s ON r.ID = s.prj_object_id
INNER JOIN PRJ_BLB_SLICEREQUESTS sr ON s.slice_request_id = sr.ID AND sr.request_name =
'MONTHLYRESOURCEAVAILCURVE'
WHERE r.unique_name = 'xc_admin'
GROUP BY r.ID, s.slice_date
) stdcal on stdcal.slice_date BETWEEN cal.period_start_date AND cal.period_end_date
WHERE @FILTER@
AND @WHERE:SECURITY:RESOURCE:r.id@
GROUP BY cal.month_key, cal.period_start_date, cal.period_end_date,stdcal.avail
HAVING @HAVING_FILTER@
4. Samantha navigates to the CA Clarity PPM Web Services using the following URL and views the web query WDSL:
http://<servername:port>/niku/wsdl/Query
A list of queries appears in XOG WSDL.

The Solution: Create an Xcelsius Visualization with Real-Time CA Clarity PPM Data
Chapter 4: Example: Interactive Portlet using Web Services Connection Method 37
5. Samantha locates Query and selects the xid_qry_resCapDemand query.
The WDSL for the query appears.
6. Samantha makes note of the query URL (also known as the WDSL URL).
Samantha works with the Xcelsius Data Manager next to link the visualization to CA Clarity PPM data.
The Solution: Create an Xcelsius Visualization with Real-Time CA Clarity PPM Data
38 CA Clarity-Xcelsius Implementation Guide - On Premise
Add the Connection Definition to Link to CA Clarity PPM Data
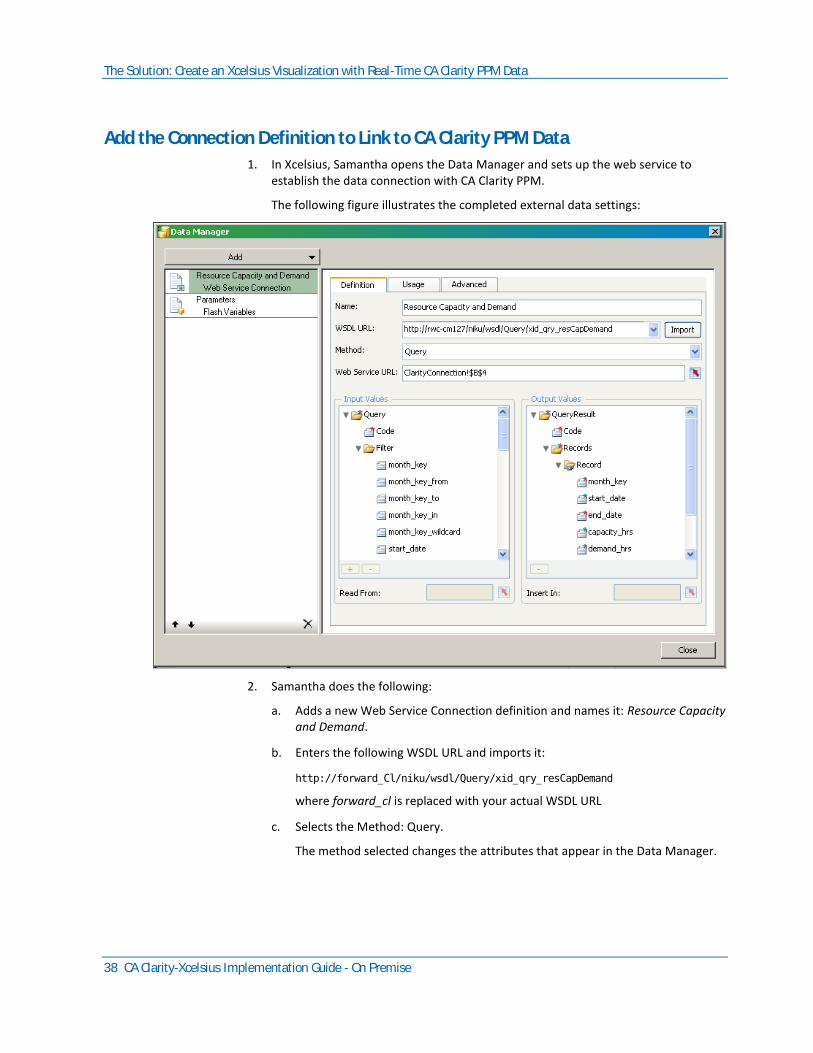
1. In Xcelsius, Samantha opens the Data Manager and sets up the web service to establish the data connection with CA Clarity PPM.
The following figure illustrates the completed external data settings:
2. Samantha does the following:
a. Adds a new Web Service Connection definition and names it: Resource Capacity and Demand.
b. Enters the following WSDL URL and imports it:
http://forward_Cl/niku/wsdl/Query/xid_qry_resCapDemand
where forward_cl is replaced with your actual WSDL URL
c. Selects the Method: Query.
The method selected changes the attributes that appear in the Data Manager.
The Solution: Create an Xcelsius Visualization with Real-Time CA Clarity PPM Data
Chapter 4: Example: Interactive Portlet using Web Services Connection Method 39
d. Leaves the Data Manager open.
The next series of steps involve linking or binding data to cells in the embedded spreadsheet.
3. In the embedded spreadsheet, Samantha creates two worksheets and names them:
– ClarityConnection. Used to link values related to the Web Services connection, such as the Web Service URL and NSQL.
– ResCapDemand. Used to link values associated with the real-time data that populates the visualization components.
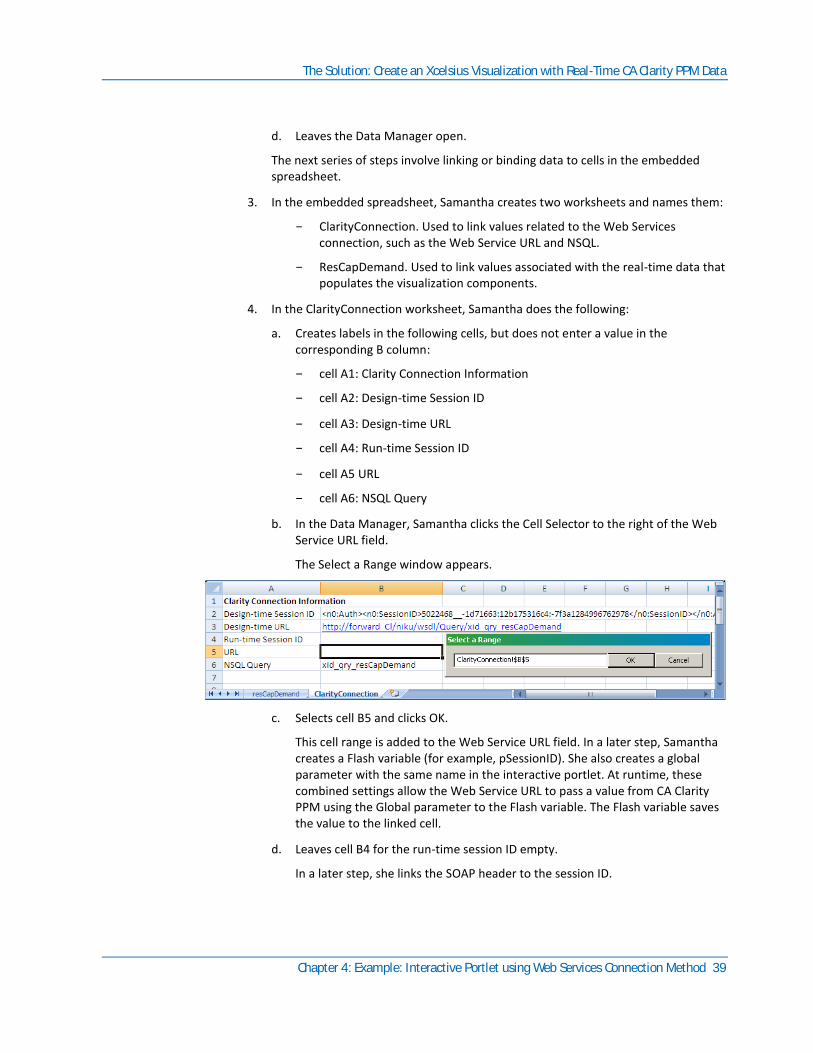
4. In the ClarityConnection worksheet, Samantha does the following:
a. Creates labels in the following cells, but does not enter a value in the corresponding B column:
– cell A1: Clarity Connection Information
– cell A2: Design-time Session ID
– cell A3: Design-time URL
– cell A4: Run-time Session ID
– cell A5 URL
– cell A6: NSQL Query
b. In the Data Manager, Samantha clicks the Cell Selector to the right of the Web Service URL field.
The Select a Range window appears.
c. Selects cell B5 and clicks OK.
This cell range is added to the Web Service URL field. In a later step, Samantha creates a Flash variable (for example, pSessionID). She also creates a global parameter with the same name in the interactive portlet. At runtime, these combined settings allow the Web Service URL to pass a value from CA Clarity PPM using the Global parameter to the Flash variable. The Flash variable saves the value to the linked cell.
d. Leaves cell B4 for the run-time session ID empty.
In a later step, she links the SOAP header to the session ID.

The Solution: Create an Xcelsius Visualization with Real-Time CA Clarity PPM Data
40 CA Clarity-Xcelsius Implementation Guide - On Premise
5. Using the same cell linking technique used for the Web Services URL, Samantha does the following:
a. In Data Manager, links Code (from the Input Values section) to cell B6 of the ClarityConnection worksheet.
This action links the query to the visualization.
b. In the ClarityConnection worksheet cell B6, enters the name of the following query:
xid_qry_resCapDemand
The value of this cell is manually entered because once a query is created, it is absolute.
c. In the ClarityConnection worksheet cell B2, enters an active CA Clarity PPM session ID in the following SOAP format:
<n0:Auth><n0:SessionID>0000</n0:SessionID></n0:Auth>
where 0000 is her current Clarity Session ID.
Note: To get your current session ID, go to the About page in CA Clarity PPM, and copy and paste the session ID.
This information will enable you to test the real-time CA Clarity PPM data connection from Xcelsius.
d. In the ClarityConnection worksheet cell B3, enters the Web Service URL.
This link is used at design-time to preview and test the connection from Xcelsius.
The one remaining cell to define is the Run-time session ID. This cell is addressed in a later step when creating Flash variables.
In the next set of steps, Samantha selects the data and selects a range of records. The range varies depending on the number of fields in the query and the number of records expected from the output.
Best Practice: In the worksheet, reserve the first column and first row for labels. To optimize performance, keep the output to 20 rows.
6. Samantha does the following to define the destination output for the data:
a. (Optional) In the resCapDemand worksheet, creates the column labels and creates a border and background to identify the perimeter of the data range. For this example, the cell range is B2 to I21 (eight columns and 20 rows).
b. In the Data Manager, links Record (from the Output Values section) using the Cell Selector to a range of cells in the resCapDemand worksheet.
7. In the Data Manager, Samantha does the following:
a. On the Usage tab, selects the Refresh Before Components Are Loaded option.

The Solution: Create an Xcelsius Visualization with Real-Time CA Clarity PPM Data
Chapter 4: Example: Interactive Portlet using Web Services Connection Method 41
b. On the Advanced tab, links the SOAP Header to cell B2 on the ClarityConnection tab.
Samantha creates Flash variables next.
Set Up Flash Variables
Samantha is ready to create the Flash variables that map to the global and object parameters in the interactive portlet.
1. In the Data Manager, Samantha adds a new Flash Variable definition and names it parameters.
2. Samantha selects CSV as the Variable Format.
3. Samantha creates the required session ID Flash variable and does the following:
– Enters the Name: pSessionID.
– Links to the Session ID cell B4 in the ClarityConnection worksheet.
This named Flash variable is mapped to the interactive portlet as the Clarity Session ID in SOAP Header global parameter.
The Solution: Create an Xcelsius Visualization with Real-Time CA Clarity PPM Data
42 CA Clarity-Xcelsius Implementation Guide - On Premise
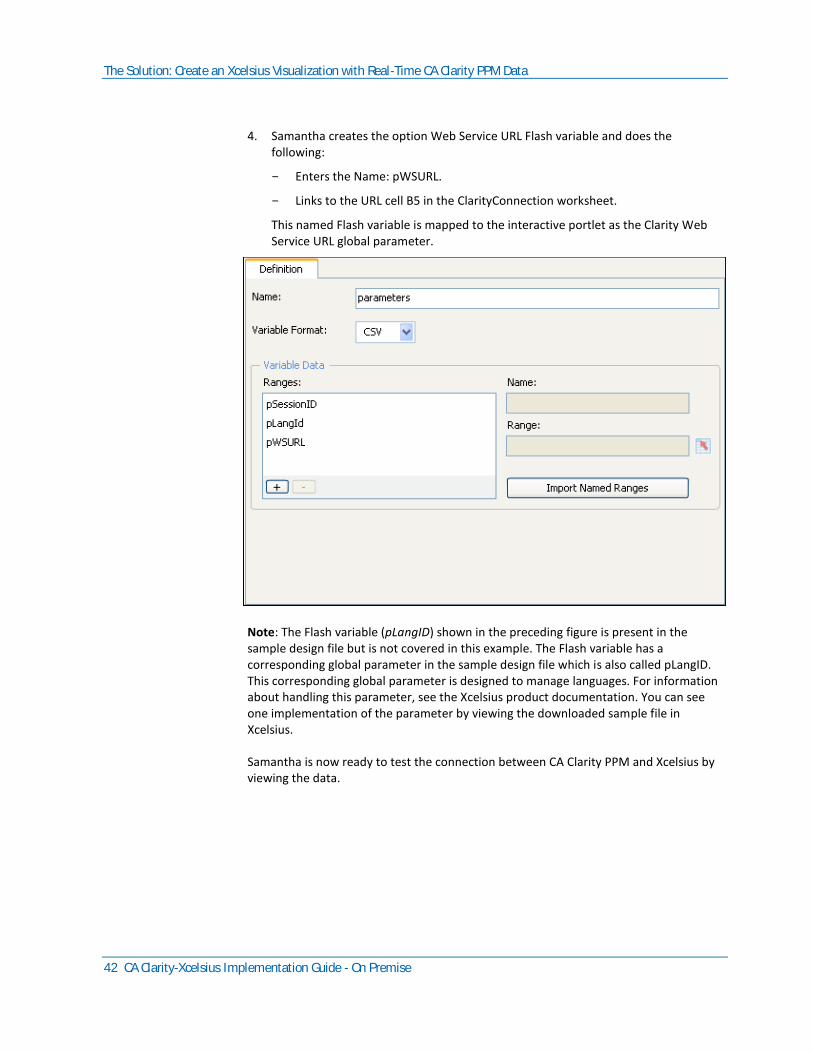
4. Samantha creates the option Web Service URL Flash variable and does the following:
– Enters the Name: pWSURL.
– Links to the URL cell B5 in the ClarityConnection worksheet.
This named Flash variable is mapped to the interactive portlet as the Clarity Web Service URL global parameter.
Note: The Flash variable (pLangID) shown in the preceding figure is present in the sample design file but is not covered in this example. The Flash variable has a corresponding global parameter in the sample design file which is also called pLangID. This corresponding global parameter is designed to manage languages. For information about handling this parameter, see the Xcelsius product documentation. You can see one implementation of the parameter by viewing the downloaded sample file in Xcelsius.
Samantha is now ready to test the connection between CA Clarity PPM and Xcelsius by viewing the data.
The Solution: Create an Xcelsius Visualization with Real-Time CA Clarity PPM Data
Chapter 4: Example: Interactive Portlet using Web Services Connection Method 43
Test the Visualization and Create an Interactive Portlet
Samantha now views the visualization in Xcelsius to make certain the connection is good and data is moving from CA Clarity PPM to Xcelsius. When the test is done, Samantha can create the interactive portlet that displays the visualization in CA Clarity PPM
1. In Xcelsius, Samantha selects Preview from the File menu.
She sees that information is populating the bar graph and determines that the visualization is working exactly as designed.
2. From the File menu, Samantha selects Export, and then selects Flash (SWF). She indicates a place on her computer where the SWF file (capDemand.swf) is to be stored.
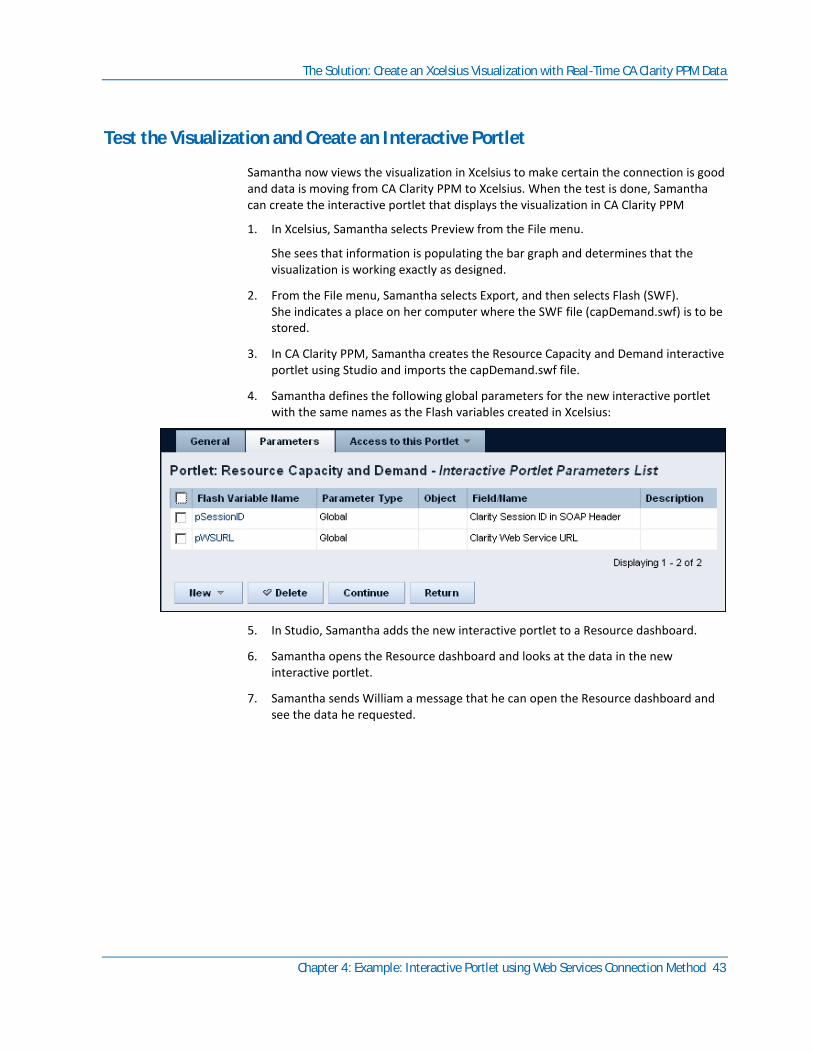
3. In CA Clarity PPM, Samantha creates the Resource Capacity and Demand interactive portlet using Studio and imports the capDemand.swf file.
4. Samantha defines the following global parameters for the new interactive portlet with the same names as the Flash variables created in Xcelsius:
5. In Studio, Samantha adds the new interactive portlet to a Resource dashboard.
6. Samantha opens the Resource dashboard and looks at the data in the new interactive portlet.
7. Samantha sends William a message that he can open the Resource dashboard and see the data he requested.
The Result: Performing the Analysis Based on the Xcelsius Visualization
44 CA Clarity-Xcelsius Implementation Guide - On Premise
The Result: Performing the Analysis Based on the Xcelsius Visualization
Executive: William
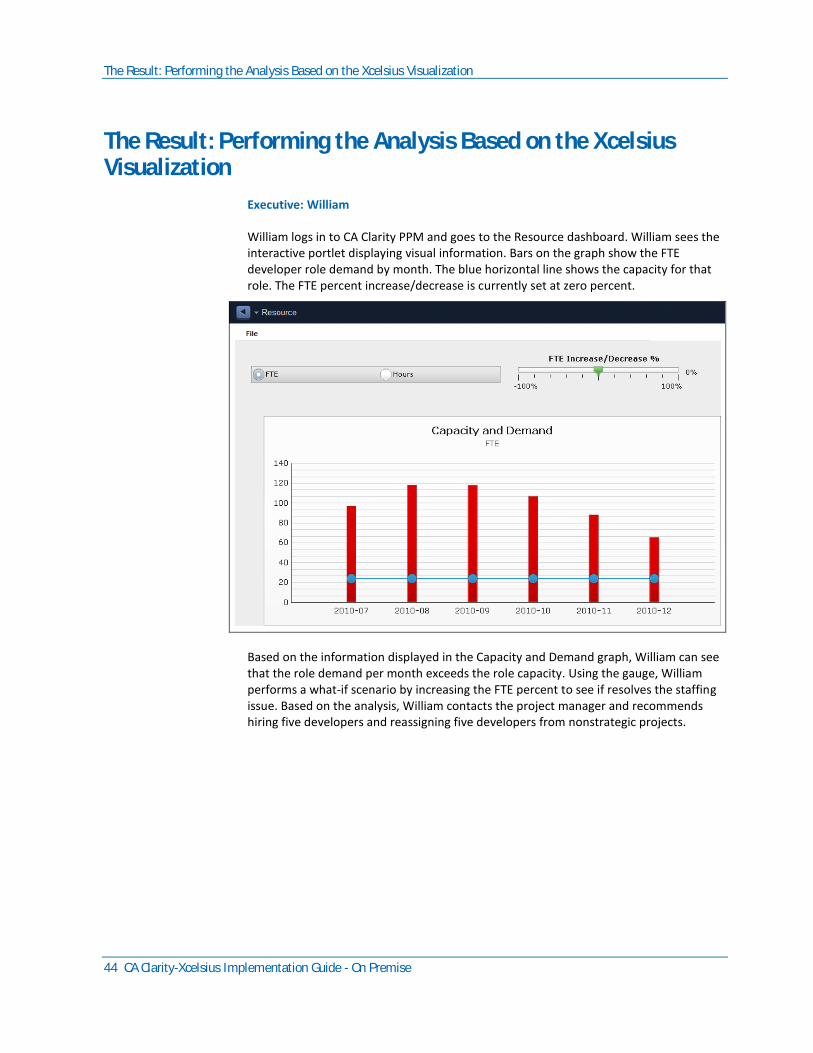
William logs in to CA Clarity PPM and goes to the Resource dashboard. William sees the interactive portlet displaying visual information. Bars on the graph show the FTE developer role demand by month. The blue horizontal line shows the capacity for that role. The FTE percent increase/decrease is currently set at zero percent.
Based on the information displayed in the Capacity and Demand graph, William can see that the role demand per month exceeds the role capacity. Using the gauge, William performs a what-if scenario by increasing the FTE percent to see if resolves the staffing issue. Based on the analysis, William contacts the project manager and recommends hiring five developers and reassigning five developers from nonstrategic projects.

Chapter 5: Example: Using an Object Parameter to Filter Portfolio Investments 45
Chapter 5: Example: Using an Object Parameter to Filter Portfolio Investments
Suppose that Samantha, the administrator responsible for designing Xcelsius visualizations and adding them to interactive portlets, wants to create an Xcelsius visualization that can filter portfolio investments for analysis.
Samantha creates a prototype, identifies the CA Clarity PPM data needed, and determines that the portfolio ID can be used to filter portfolio investments. Samantha designs an Xcelsius visualization for portfolios that has the following:
■ A filter to select investments for the analysis
■ A set of charts to display the data
Samantha sets up the Xcelsius visualizations for real-time CA Clarity PPM data exchanges using the CA Clarity PPM Web Services connection method. She creates a Flash variable named pPortfolioID, which is used to filter the data in the visualization based on the portfolio ID. The exact Flash variable is mapped to the interactive portlet using an object parameter. She exports the visualization as a .SWF file.
In CA Clarity PPM, Samantha does the following from Studio:
1. Creates an interactive portlet named Portfolio.
2. Creates global parameters that maps to the Flash variable names created for the CA Clarity PPM Web Services connection.
3. Creates an object parameter based on the Portfolio object and maps it to the Flash variable named pPortfolioID.
4. Defines the object parameter based on the following properties:

The Result: Performing the Analysis Based on the Xcelsius Visualization
46 CA Clarity-Xcelsius Implementation Guide - On Premise
5. Adds the interactive portlet to the Portfolio object.
Users who have access to the Portfolios menu can view the Portfolio interactive portlet and analyze select investments in their portfolio.

Appendix A: Stock Interactive Portlets 47
Appendix A: Stock Interactive Portlets
This section contains the following topics:
Design Files for Stock Xcelsius Visualizations (see page 47) Stock Queries Used in Xcelsius Dashboards (see page 47) Resource Planning Portlet (see page 48) Portfolio Portlet (see page 49) Project Status Portlet (see page 55) Investment Overview Dashboard (see page 57)
Design Files for Stock Xcelsius Visualizations
Stock Xcelsius visualization design files (.xlf files) are provided to help you get started with Clarity and Xcelsius. You can use .xlf files as they are without modification, or you can use them as a starting point for your own designs.
Best Practice: Always make copies of the stock Xcelsius dashboards, visualization files, and queries before applying any customizations. Customize the copied versions. CA provides periodic updates to the stock dashboards that overwrite any changes you make directly to them.
For information about downloading the design files, see Install Sample Xcelsius Dashboards (see page 21).
Stock Queries Used in Xcelsius Dashboards
The queries shown in the following table are used in the stock Xcelsius dashboards.
Query ID
Budget and Forecast by Goal - v13 xid.qry.bdgtFcstGoal
Investment Approval Status - v13 xid.qry.invApprSts
Issues - v13 xid.qry.issues
Project Hours by Role - v13 xid.qry.prjHrsRole
Project Information - v13 xid.qry.prjInfo
Risks - v13 xid.qry.risks
Spending Plan by Month - v13 xid.qry.spendByMonth

Resource Planning Portlet
48 CA Clarity-Xcelsius Implementation Guide - On Premise
Resource Planning Portlet
Description
The Resource portlet is an interactive portlet that contains Xcelsius visualizations with multiple components. The visualizations help you identify resource forecasted utilization and also the capacity and demand of the roles in the next six months. The gauge component measures the forecasted resource utilization. The column graph gives a comparison between demand and capacity by month. The pie chart shows capacity by role and demand by role. This same information is displayed in the list, except it displays incremental cost information. The grid component displays the capacity and demand for a role for the next six months. Incremental cost in the grid displays the increase or decrease in cost when the FTE/hours slider is increased or decreased respectively.
Prerequisites
■ The following must exist in CA Clarity PPM:
– Entities, departments, fiscal periods
– Location OBS
– Roles
– Projects
■ Resources must be:
– Financially enabled
– Associated with roles
– Added to projects
– Assigned project tasks
■ Projects must be:
– Financially enabled
– Associated with tasks
– Associated with a rate source
■ The following jobs must be run to display data in the portlets:
– Update Business Objects Report Tables
– Cost Matrix Extraction
– Time Slicing
■ Add this dashboard to a tab on the resource planning page.

Portfolio Portlet
Appendix A: Stock Interactive Portlets 49
Information Displayed
Average Forecasted Utilization
Displays the utilization of roles in an organization.
Role Capacity/Demand
Displays the total capacity in percentage. Each pie segment represents the total capacity and demand for a role.
Capacity and Demand
Displays the total capacity and demand for all roles.
Capacity and Demand by Role
Displays the total capacity and demand for each role for six months starting with the current month. You can replace a role with resources that can complete the work.
The following columns display on the Capacity and Demand by Role chart:
Role
Displays the roles associated for this project.
Incremental Cost
Displays the increase or decrease in cost when FTE or hours are increased or decreased respectively. The values are taken from the cost matrix.
Capacity
Displays the total number of available hours for the associated resource.
Demand
Displays the total number of assigned or allocated hours for the associated resource.
Remaining Capacity
Displays the difference between the total demand and the total capacity for six months for all investments.
Portfolio Portlet
Description
The Portfolio portlet is an interactive portlet that contains Xcelsius visualizations for a selected portfolio.

Portfolio Portlet
50 CA Clarity-Xcelsius Implementation Guide - On Premise
Prerequisites
■ Run the following jobs:
– Time Slicing
– Datamart Extraction
– Datamart Rollup - Time Facts and Time Summary
– Rate Matrix Extraction
■ Add the interactive portlet to a tab on a Portfolio page layout using one of the following techniques:
From Studio:
1. Add a new tab to any Portfolio Page Layout.
2. Add the Xcelsius interactive dashboard portlet to the tab content.
3. Publish the Portfolio Page.
4. Assign the Portfolio Page Layout to a Portfolio.
Personalize an existing portfolio layout:
1. With the portfolio open, navigate to the tab, and click the Personalize icon, or the Manage Tabs icon.
2. Add the Xcelsius interactive dashboard portlet to the tab content.
3. Save the changes.
Information Displayed
Portfolio Dashboard
■ Budget/Forecast by Goal
■ Balance
■ Investment Financial Grid

Portfolio Portlet
Appendix A: Stock Interactive Portlets 51
View Investment Information
Follow these steps:
1. Open the portfolio and navigate to the Xcelsius Dashboard tab.
Note: Navigation depends on how you or the CA Clarity PPM administrator configures this portlet.
A list of investments from the selected portfolio appears.
2. In the left pane, select the investments to factor into the analysis.
3. Move the selected investments to the right pane by clicking the appropriate arrow.
4. Click Update.
5. Click Filter.
The Portfolio Dashboard appears.
Add or Remove Investments
To select or remove investments, select the Filter check box to display the list box of selected and available investments.
Follow these steps:
1. To select or remove investments from the analysis, complete the following actions:
■ To remove investments, move the investments from the right to the left pane.
■ To add investments, move the investments to the right pane.
2. Click Update.
3. Click Filter.
Portfolio Dashboard
Description
Use Portfolio Dashboard to analyze the impact to your portfolio by adding and removing investments from the dashboard.
Prerequisites
The following must exist in CA Clarity PPM:
■ Projects that are activated, approved, and financially enabled
■ Project cost plans

Portfolio Portlet
52 CA Clarity-Xcelsius Implementation Guide - On Premise
■ Project issues and risks
■ Posted project costs
■ Project baselines
■ Portfolio. Add the projects as individual investments to the content page in the portfolio.
Information Displayed
Portfolio
Displays the portfolio name.
Manager
Displays the manager associated with this portfolio.
Start
Displays the start date of the portfolio.
Finish
Displays the end date of the portfolio.
Currency
Displays the currency selected for the portfolio.
Benefit
Displays the portfolio benefit defined in the properties page.
Budget
Displays the budget defined for the portfolio.
Approved Investments Budget
Displays the approved investment budget for all investments in the portfolio.
Cost Variance
Displays a stoplight that shows a view of a portfolio performance.
Values:
■ Green. Approved investment's planned cost is less than that of the portfolio.
■ Red. Approved investment's planned cost is greater than that of the portfolio.

Portfolio Portlet
Appendix A: Stock Interactive Portlets 53
Budget/Forecast by Goal
Description
The Budget/Forecast by Goal displays a column chart. Goals for all investments for a portfolio are represented in the Y-axis, and budget and forecast amounts from the cost plan are represented in the X-axis.
Balance
Description
The Balance portlet displays a bubble graph that shows how the score of each investment balances between corporate alignment and the finish date. Investments use three factors when scoring; business alignment, cost, and risk. For example, if you defined a budget for a portfolio for this year only, its costs restrict to this year. In addition, changing the planned cost of an investment changes its bubble size.
Information Displayed
Schedule Finish Date
Displays the scheduled finish date of this investment.
Alignment Score
Investments appear on the graph somewhere between good and poor according to their alignment with business goals. An investment with a low y-coordinate (distance from the origin) lies somewhere within the red zone on the graph. Investments move up the graph vertically based on their business alignment scores.
Values: Bubble colors display the risk color
■ Green (65 and 100). Investment is well aligned.
■ Yellow (35 and 64). Investment is average aligned.
■ Red (0 and 34). Investment is poorly aligned.
■ White. Alignment data is undefined.
Planned Cost
Displays the planned cost for the investment.
Investment Financial Grid
Description
The Investment Financial Grid tab on the portfolio dashboard page displays all the investments that you have access to and the ones that match the filter settings that you selected.

Portfolio Portlet
54 CA Clarity-Xcelsius Implementation Guide - On Premise
Information Displayed
Investment
Displays the name of the investment in the drop-down. Click an investment name to view the detailed properties for that investment.
Goal
Defines the goal of this project.
Values: Cost Avoidance, Cost Reduction, Grow the Business, Infrastructure Improvement, or Maintain the Business.
Alignment
Displays how well the investment aligns to the organization’s business goal. The higher the value, the stronger the alignment. This metric is used in portfolio analysis when you use comparable business alignment criteria across all portfolio investments.
Values:
■ Green (65 and 100). Investment is well aligned.
■ Yellow (35 and 64). Investment is average aligned.
■ Red (0 and 34). Investment is poorly aligned.
■ White. Alignment data undefined.
Risk
Displays a stoplight that helps you assess the risk of a project. The project total risk score determines the color of the stoplight, including:
Values:
■ Green (0 to 33). Project is low risk.
■ Yellow (34 to 68). Project is medium risk.
■ Red (68 to 100). Project is high risk.
■ White. Risk data undefined.
Stage
Defines the stage in the project lifecycle.
Start
Displays the start for this particular project.
Planned Cost
Defines the amount of money available for investments in this project. This information is important when planning a portfolio because it helps you decide how much more money you need to spend on an investment.

Project Status Portlet
Appendix A: Stock Interactive Portlets 55
Actual Cost
Displays the actuals for the entire project (the sum of all actuals posted for the investment). Like Planned Cost, this information is important when planning a portfolio. Actual Cost helps you decide how much more money you need to spend on an investment.
Remaining Cost
Displays the difference between the planned costs and the actual costs.
Role Allocation Demand
Displays the total effort required to complete the investment tasks.
Role Actuals
Displays the aggregated total actuals of all the resources and roles irrespective of their investment role for each investment.
Remaining Role Allocation
Displays the aggregated total remaining allocation value for all resources and roles.
Project Status Portlet Description
Use the Project Status Portlet to analyze a single project.
Prerequisites
The following must exist in CA Clarity PPM:
■ Projects that are activated, approved, and financially enabled.
■ Project cost plans.
■ Project issues and risks.
■ Posted project costs.
■ Project baselines.
■ Add the portlet to the project Dashboard tab on any project page layout.
Information Displayed
Manager
Specifies the manager of the investment.
Start
Displays the start of the investment.

Project Status Portlet
56 CA Clarity-Xcelsius Implementation Guide - On Premise
Finish
Displays the end of the investment.
Baseline Finish
Displays the baseline finish date.
Status
Displays a graphical representation of the status. For example, if the status is "Approved," the visual representation is a green stoplight. The selection is displayed as a stoplight symbol when saved.
Values: Red, Yellow, and Green
Investment Allocation Hours by Role
Displays the roles assigned for an investment in hours.
Spending Plan by Month
Displays the cost plan for the month.
Schedule Variance
Displays the difference between the baseline finish and the finish dates. If there is no baseline, the variance is the current date minus the finish date.
Issues
Displays the issue name, status, and priority.
Values:
■ Green. No high or medium priority issues exist.
■ Yellow. Medium priority issues exist.
■ Red. High priority issues exist.
■ White. Issue status not defined
Risks
Displays the risk name, status, and priority.
Values:
■ Green (0 to 33). Project is low risk.
■ Yellow (34 to 68). Project is medium risk.
■ Red (68 to 100). Project is high risk.
■ White. Risk data is undefined.
Buttons
Investment
Navigates to the properties page.

Investment Overview Dashboard
Appendix A: Stock Interactive Portlets 57
Issues
Navigates to the Issues list for the project.
Risks
Navigates to the Risks list for the project.
Investment Overview Dashboard
Description
Use the Investment Overview Dashboard to analyze your investments. You can select from the following filter criteria to determine the investments that appear in the Selection drop-down field on the dashboard:
■ Project Manager
■ Status (approved or unapproved)
■ Active
■ Investment Type
Prerequisites
The following must exist in CA Clarity PPM:
■ Projects that are activated, approved, and financially enabled
■ Project cost plans
■ Project issues and risks
■ Posted project costs
■ Project baselines
Suggested Use
■ Add this dashboard to a tab on the Overview page layout. For example, create a tab named Investment Overview.
Information Displayed
Investment
Displays the name of the investment. Click an investment name to view the detailed properties for that investment.
Manager
Defines the manager of the investment.

Investment Overview Dashboard
58 CA Clarity-Xcelsius Implementation Guide - On Premise
Start
Displays the start of this particular investment.
Finish
Displays the end of this particular investment.
Baseline Finish
Displays the baseline finish date.
Status
Displays a graphical representation of the status. For example, if the status is "Approved," the visual representation of the status is a Green stoplight. The selection is displayed as a stoplight symbol when saved.
Values: Red, Yellow, and Green.
Investment Allocation Hours by Role
Displays the roles assigned for an investment in hours.
Spending Plan by Month
Displays the cost plan for the month.
Schedule Variance
Displays the difference between the baseline finish and the finish dates. In the absence of baseline, it is the current date minus finish date.
Issues
Displays the issue name, status, and priority.
Values:
■ Green. No high or medium priority issues exist.
■ Yellow. Medium priority issues exist.
■ Red. High priority issues exist.
■ White. Issue status not defined.
Risks
Displays the risk name, status, and priority.
Values:
■ Green (0 to 33). Project is low risk.
■ Yellow (34 to 68). Project is medium risk.
■ Red (68 to 100). Project is high risk.
■ White. Risk data undefined.
Investment Overview Dashboard
Appendix A: Stock Interactive Portlets 59
Buttons
Investment
Navigates to the investment in CA Clarity PPM.
Issues
Navigates to the Issues list for a project.
Risks
Navigates to the Risks list for a project.