Xcelsius Tips and Tricks_Present
36
] ARVIND SINGH [ ASUG ASSOCIATE MEMBER MEMBER SINCE: 2008 APRIL ZANELLI [ ASUG INSTALLATION MEMBER MEMBER SINCE: 2005 GRAZIELLA SBALCHIERO [ ASUG INSTALLATION MEMBER MEMBER SINCE: 2009 Xcelsius Tips and Tricks Aparna Srinivasan
-
Upload
hexaware-technologies -
Category
Documents
-
view
289 -
download
3
description
Xcelsius provides rich visualization graphics to create dashboards right from senior management to power users and regular business users in an organization
Transcript of Xcelsius Tips and Tricks_Present

]
ARVIND SINGH[ASUG ASSOCIATE MEMBER MEMBER SINCE: 2008
APRIL ZANELLI[ASUG INSTALLATION MEMBER MEMBER SINCE: 2005
GRAZIELLA SBALCHIERO[ASUG INSTALLATION MEMBER MEMBER SINCE: 2009
Xcelsius Tips and Tricks
Aparna Srinivasan

Real Experience. Real Advantage.
[
2
Agenda
About my company Introduction to Xcelsius dashboards Dashboard samples for various data sources Tips and Tricks in implementing these dashboards Questions
Real Experience. Real Advantage.
[ Hexaware - A Thumbnail View
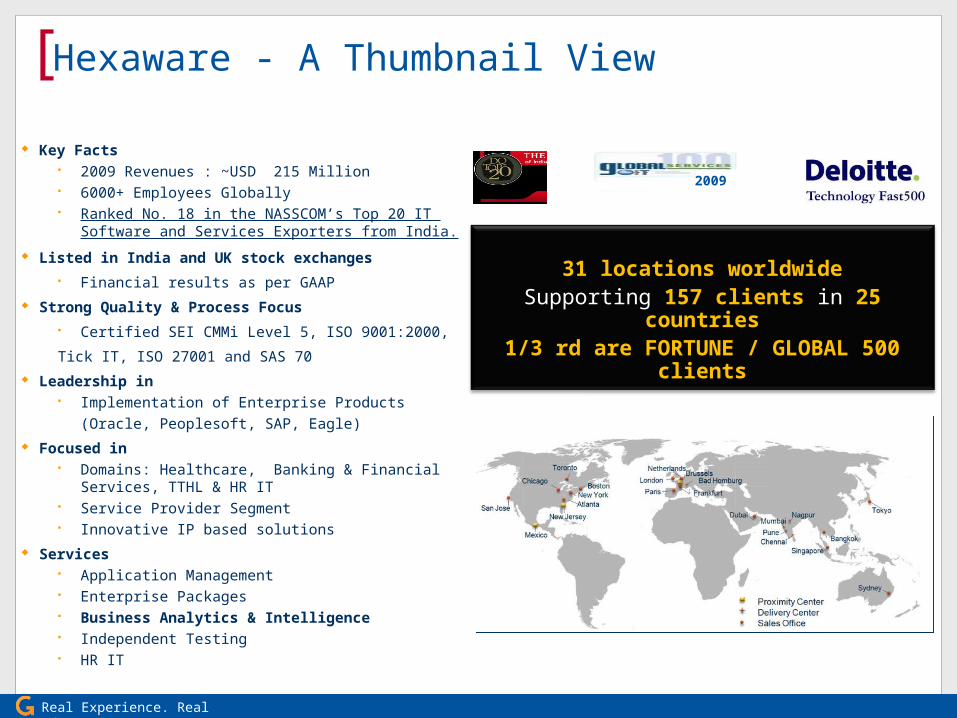
Key Facts 2009 Revenues : ~USD 215 Million 6000+ Employees Globally Ranked No. 18 in the NASSCOM’s Top 20 IT
Software and Services Exporters from India.
Listed in India and UK stock exchanges Financial results as per GAAP
Strong Quality & Process Focus Certified SEI CMMi Level 5, ISO 9001:2000,
Tick IT, ISO 27001 and SAS 70 Leadership in
Implementation of Enterprise Products (Oracle, Peoplesoft, SAP, Eagle)
Focused in Domains: Healthcare, Banking & Financial
Services, TTHL & HR IT Service Provider Segment Innovative IP based solutions
Services Application Management Enterprise Packages Business Analytics & Intelligence Independent Testing HR IT
31 locations worldwideSupporting 157 clients in 25
countries1/3 rd are FORTUNE / GLOBAL
500 clients
2009
Real Experience. Real Advantage.
[ Hexaware’s BI practice
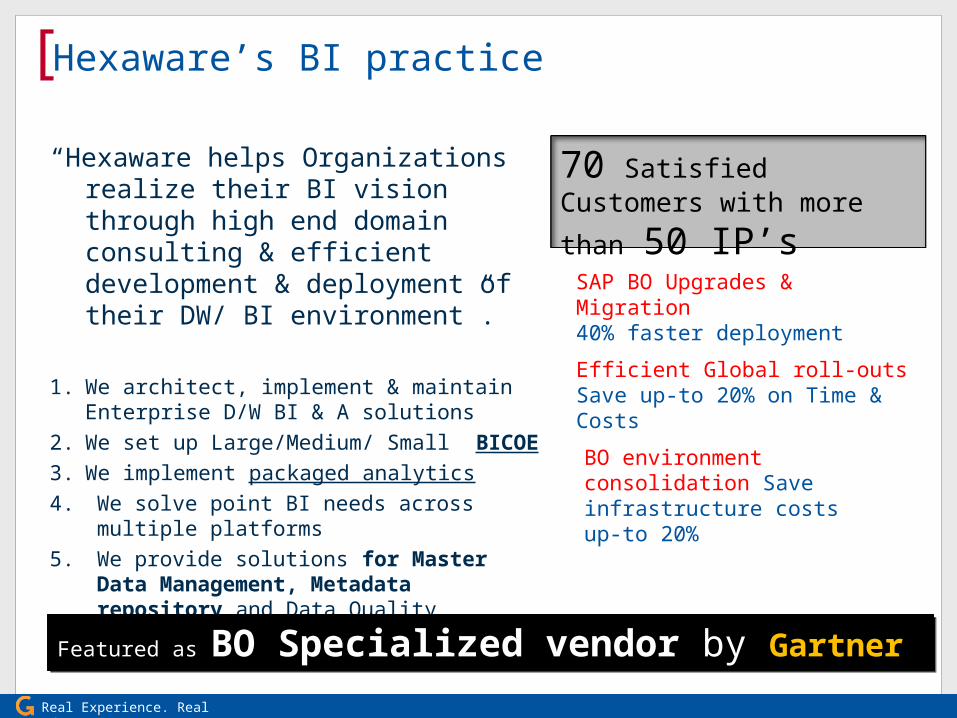
“Hexaware helps Organizations realize their BI vision through high end domain consulting & efficient development & deployment of their DW/ BI environment”.
1. We architect, implement & maintain
Enterprise D/W BI & A solutions2. We set up Large/Medium/ Small BICOE3. We implement packaged analytics4. We solve point BI needs across multiple
platforms5. We provide solutions for Master Data
Management, Metadata repository and Data Quality
70 Satisfied Customers with
more than 50 IP’s
Featured as BO Specialized vendor by GartnerFeatured as BO Specialized vendor by Gartner
SAP BO Upgrades & Migration 40% faster deployment
Efficient Global roll-outs Save up-to 20% on Time & Costs
BO environment consolidation Save infrastructure costs up-to 20%

Real Experience. Real Advantage.
[ Hexaware’s BI practice
“Hexaware helps Organizations realize their BI vision through high end domain consulting & efficient development & deployment of their DW/ BI environment”.
1. We architect, implement & maintain
Enterprise D/W BI & A solutions2. We set up Large/Medium/ Small BICOE3. We implement packaged analytics4. We solve point BI needs across multiple
platforms5. We provide solutions for Master Data
Management, Metadata repository and Data Quality
70 Satisfied Customers with
more than 50 IP’s
Featured as BO Specialized vendor by GartnerFeatured as BO Specialized vendor by Gartner
SAP BO Upgrades & Migration 40% faster deployment
Efficient Global roll-outs Save up-to 20% on Time & Costs
BO environment consolidation Save infrastructure costs up-to 20%
Real Experience. Real Advantage.
[
6
Client portfolio
Client is a worldwide information technology company with approximately 23,000 employees serving commercial organizations and government agencies throughout the world
Around 7,000 users use the Business Objects installation with 10,000+ reports

Real Experience. Real Advantage.
[
7
Introduction to Xcelsius dashboards
Xcelsius provides rich visualization graphics to create dashboards right from senior management to power users and regular business users in an organization
Xcelsius dashboard can implement object level security as well as data level security personalizing dashboards
Xcelsius can fetch data from various data sources that makes dashboard development easier
Xcelsius dashboards can be deployed to various portals also utilizing the portal data in some cases

Real Experience. Real Advantage.
[
8
Dashboard samples for various data sources – QAAWS and Live Office deployed in Infoview
Real Experience. Real Advantage.
[
9
Dashboard samples for various data sources – QAAWS and Live Office deployed in Infoview Live Office integrates with Microsoft Office,
embedding up-to-the-minute corporate data in Microsoft PowerPoint, Excel, and Word documents
Query as a Web Service (QAAWS) lets you create custom web services for specific queries using Business Objects Web Services.
Real Experience. Real Advantage.
[
10
Dashboard samples for various data sources – QAAWS and Live Office deployed in Infoview The server component of QAAWS isinstalled
automatically when BusinessObjects Enterprise XI Release 2 Service Pack 2 with Web Intelligence.
The server component of Live Office is installed automatically with BusinessObjects Premium while keys need to be purchased for Professional edition.
Client tool for QAAWS needs to be purchased as a separate license.
Client components of both Live Office and QAAWS is available in the collaterals CD in the Adds-on folder.

Real Experience. Real Advantage.
[
11
Dashboard samples for various data sources – Drill down report from the main dashboard

Real Experience. Real Advantage.
[
12
Dashboard samples for various data sources – Drill down report from the main dashboard Drill down can be provided from the main
dashboard to an other Xcelsius dashboard with more details or a Web intelligence report
Even PDF documents that have been generated from other tools can be viewed in the Xcelsius dashboards
Flash variables can be used to receive data from the main dashboard

Real Experience. Real Advantage.
[
13
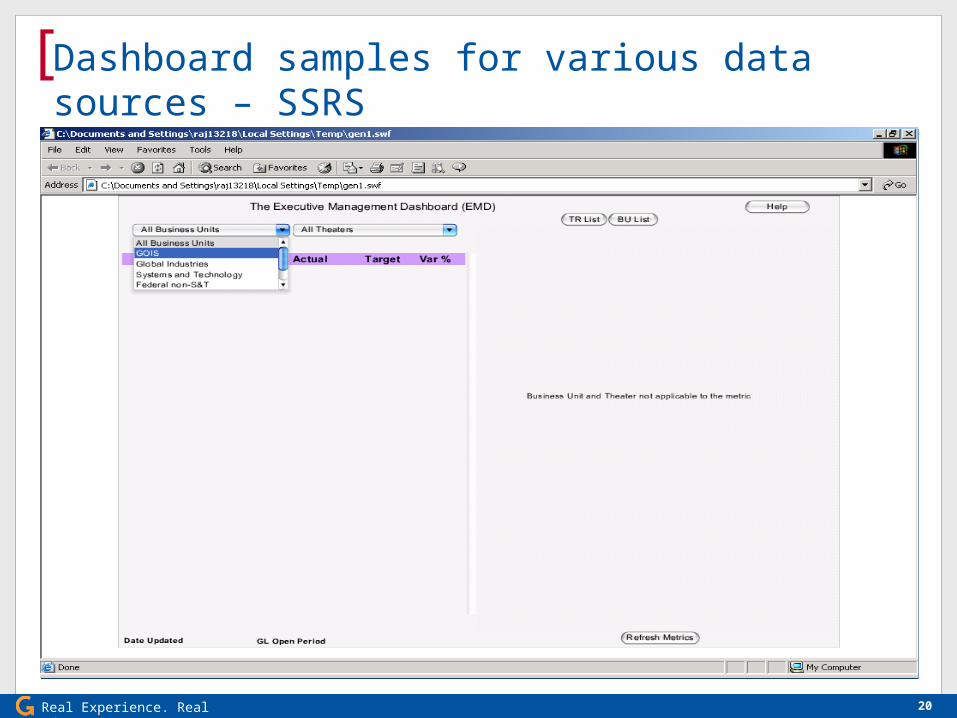
Dashboard samples for various data sources – SSRS(Reporting Service connecter)

Real Experience. Real Advantage.
[
14
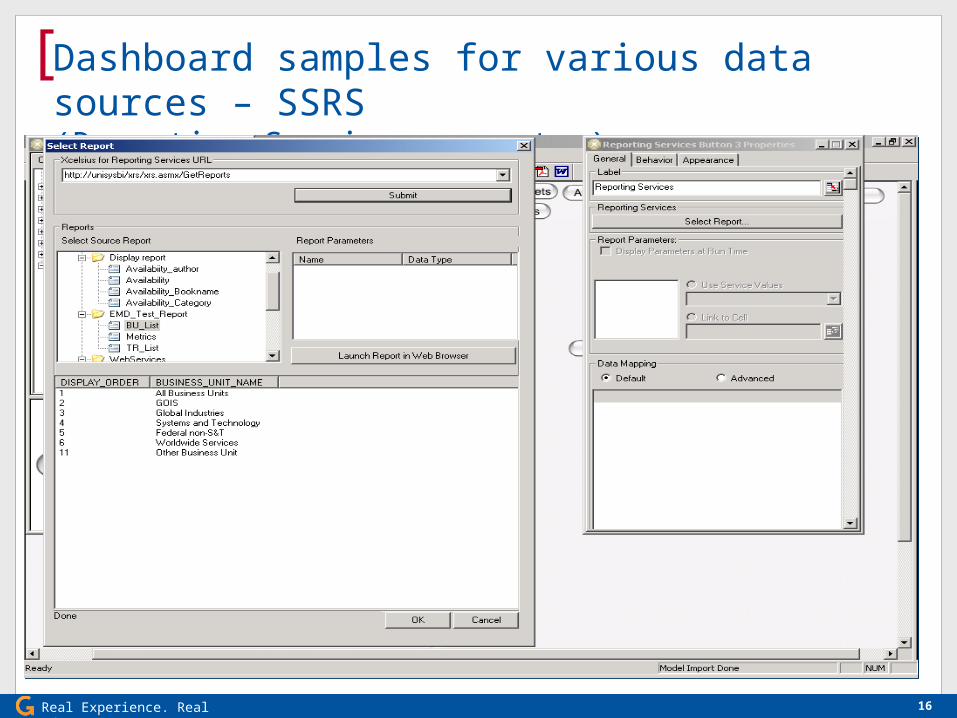
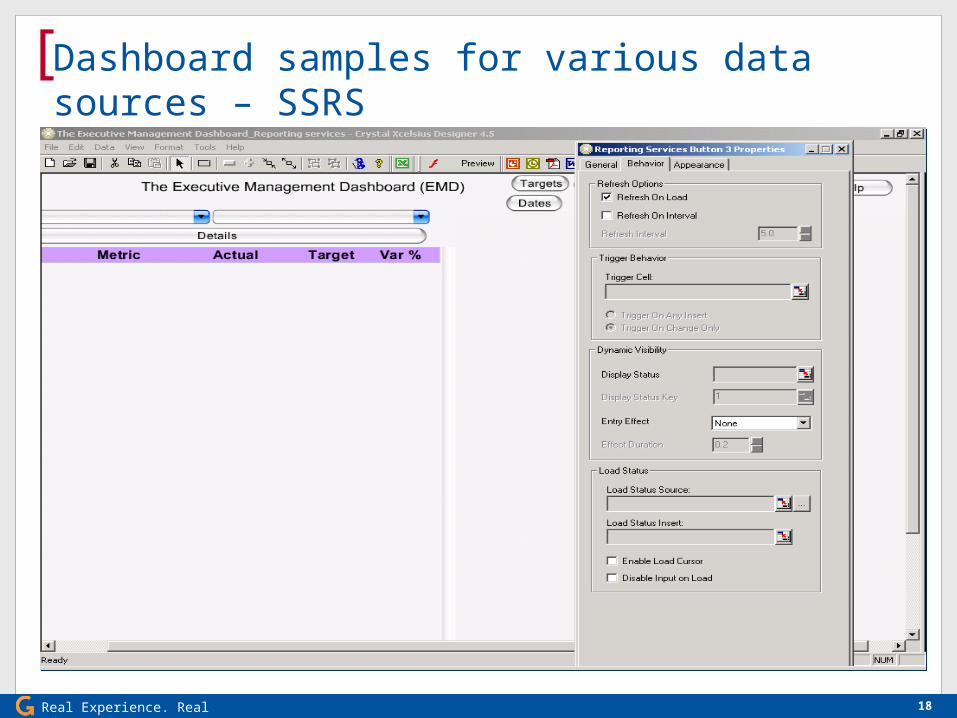
Dashboard samples for various data sources – SSRS (Reporting Service connecter) Data from SQL Server reporting services can
source the Xcelsius dashboards Xcelsius Reporting Services (XRS) gateway needs
to be installed on a web server where IIS and the .NET framework are installed and configured

Real Experience. Real Advantage.
[
15
Dashboard samples for various data sources – SSRS (Reporting Service connector)
Real Experience. Real Advantage.
[
16
Dashboard samples for various data sources – SSRS (Reporting Service connecter)

Real Experience. Real Advantage.
[
17
Dashboard samples for various data sources – SSRS (Reporting Service connecter)
Real Experience. Real Advantage.
[
18
Dashboard samples for various data sources – SSRS (Reporting Service connecter)

Real Experience. Real Advantage.
[
19
Dashboard samples for various data sources – SSRS (Reporting Service connecter)
Real Experience. Real Advantage.
[
20
Dashboard samples for various data sources – SSRS (Reporting Service connecter)

Real Experience. Real Advantage.
[
21
Dashboard samples for various data sources – Sharepoint Lists (Consumer, Provider, Param connecters)

Real Experience. Real Advantage.
[
22
Dashboard samples for various data sources – Sharepoint Lists (Consumer, Provider, Param connecters)

Real Experience. Real Advantage.
[
23
Dashboard samples for various data sources – Sharepoint Lists (Consumer, Provider, Param connecters)

Real Experience. Real Advantage.
[
24
Dashboard samples for various data sources – Sharepoint Lists (Consumers, Providers, Params) Xcelsius for SharePoint server (XSP) installs a web
part container into the SharePoint web part library. After installation and configuration, the web part
container can be added to the Web Part Gallery within SharePoint and any user with the appropriate rights can add the web part container to a page within the site.
The slides in the previous dashboards depict point in time, trends and scorecard features

Real Experience. Real Advantage.
[
25
Dashboard samples for various data sources – SharePoint Lists (Consumers, Providers, Params) Add the Xcelsius document to the SharePoint
document list Copy the shortcut to the uploaded document Go the SharePoint page Click on Modify Shared web part Add a web part
From the web part-gallery list select Crystal Xcelsius web-part
Specify URL (paste the shortcut you copied from the document list) and apply
Possible to customize models Real-time – Change chart type, title etc Use Modify Shared web part at run time

Real Experience. Real Advantage.
[
26
Dashboard using QAAWS and Live Office deployed in a SharePoint portal

Real Experience. Real Advantage.
[
27
Dashboard using QAAWS and Live Office deployed in a SharePoint portal – An alternate to previous design

Real Experience. Real Advantage.
[
28
Dashboard using QAAWS and Live Office deployed in a SharePoint portal Xcelsius dashboards can be viewed in Infoview
utilizing the Business Objects login credentials Xcelsius dashboards can be deployed to a
SharePoint portal which may be the corporate information sharing portal Data from SSRS, QAAWS, LiveOffice or SharePoint
lists can be used in Xcelsius dashboards deployed in the SharePoint portals

Real Experience. Real Advantage.
[
29
Tips and Tricks in implementing dashboards
Drilling in an Xcelsius dashboard Using the same layout as the main dashboard with
further dimensionality (Drill down) Using a different layout as the main dashboard with
more dimensionality (Drill through) Using web intelligence reports
Security in an Xcelsius dashboard Security can be implemented in an Xcelsius
dashboard in a way similar to implementing security in the Web Intelligence reports
The @variable(‘BOUSER’) can be used to implement security in the dashboards
Real Experience. Real Advantage.
[
30
Tips and Tricks in implementing dashboards
Connectivity to the various data sources Xcelsius can fetch data from any database using the
universe layer integrated with Live Office and Query As a Web Service
Xcelsius can talk to the existing SQL Server Reporting Services and fetch data using the Reporting Services connector
Xcelsius can fetch data from the SharePoint lists using consumer and update information using provider connectors
Deploy to other portal and embed in other objects Xcelsius dashboards can be deployed to the Sharepoint
portals Xcelcius dashboards can be embedded in Crystal reports Xcelsius dashboards can be embedded in Powerpoint
presentations so that data can be displayed as and when a presentation is given to the management

Real Experience. Real Advantage.
[
31
Tips and Tricks in implementing dashboards
Creating new chart templates Charts can be overlayed over each other and parts
of information can be shown and hidden by using display features
When charts with different axes are overlayed over each other calculations should be made such that the axis values synchronize
Performance parameters Xcelsius requires a robust data model so that
summarized data can be fetched in few seconds or less
Leverage parameters at the database, universe and report levels when fetching data

Real Experience. Real Advantage.
[
32
Tips and Tricks in implementing dashboards
Relative URL for Deployments Relative URLs should be used for the QAAWS queries and
drill down reports that will facilitate migration of dashboard from one environment to the other.
Sample: /dswsbobje/qaawsservices/EMD_FinQ?WSDL ../../../../opendoc/openDocument.jsp?
sType=wid&sDocName=EMD_Finance_A_Level1&sReportName=Customer Orders – Daily
Dynamic table size When implementing security in the dashboard, some
users will have more number of metrics than the others In the table of metrics, it is advisable to have the vertical
scroll bar that will be displayed for users with metrics spanning more then the screen height
Real Experience. Real Advantage.
[
33
Tips and Tricks in implementing dashboards
Excel Model A lot of flexibility is achieved by modeling the excel
diligently The controls, dimensions, data for the charts, tables,
drills, PDF documents can be placed in different tabs in an excel sheet so that the model can be easily extensible and maintainable
The naming convention for the data should be standardized across all excel models so that users can find what each of the tabs refer to
Coloring can specified for input, logic and dynamic visibility components, a legend describing them in a sheet
VLOOKUP, HLOOKUP should be used on smaller data sets For larger data sets aggregation needs to be done in the
server side
Real Experience. Real Advantage.
[
34
Tips and Tricks in implementing dashboards
Formatting For displaying status symbols when the number of
KPIs are not fixed, use the +, = and - symbols to indicate Green, Yellow and Red
Running a SWF Hosted on a Web Server The content in a swf file attempting to call content
files (images, XML data, etc.) using a URL file reference will not be able displayed unless the local drive has been listed as a trusted location in the Flash Player security settings
When running a swf file from Infoview, a cross-domain policy file needs to be placed in the in the Web server root. If not, the swf file may not be able to connect to the Web server to get data when you run the SWF hosted on your Web server.
Real Experience. Real Advantage.
[
35
Questions?
SAP Help portal
http://help.sap.com/businessobject/product_guides/
Aparna Srinivasan [email protected] 91-91764 09949

Real Experience. Real Advantage.
[
36
[
] Thank you for participating.
SESSION CODE:
513
Please remember to complete and return your evaluation form following this session.
For ongoing education on this area of focus, visit the Year-Round Community page at www.asug.com/yrc