C H A P T E R Discrimination in the Labor Market 9.
14
C H A P T E R Discrimination in the Labor Market 9
-
Upload
roy-atkinson -
Category
Documents
-
view
214 -
download
0
Transcript of C H A P T E R Discrimination in the Labor Market 9.

C H A P T E R
Discrimination in the Labor Market
9

© 2003 South-Western
2
Median Earnings Ratios for Year-Round Full-TimeWorkers by Race and Gender, 1940–2000
Figure 9.1
SOURCE: U.S. Bureau of the Census, Money Income of Households, Families, and Persons, P–60, nos. 69, 80, 105, 132, 156, 174, 193, 197, and 200. And, beginning in 2000, PINC-05 <http://ferret.bls.census.gov/macro/032001/perinc/new05_032.htm> 1940 data actually corresponds to 1939.

© 2003 South-Western
3
Wage Differentials Caused by Employer Prejudice
Figure 9.2

© 2003 South-Western
4
Wage Discrimination by a Monopsonist
Figure 9.3

© 2003 South-Western
5
Hypothetical Frequency Distribution of Worker Productivity among Blacks and Whites
Figure 9.4

© 2003 South-Western
6
Amounts of On-the-Job Training Received by Race and Gender
Table 9.1
SOURCE: Based on information contained in Jonathan R. Veum, “Training among Young Adults: Who, What Kind, and For How Long?” Monthly Labor Review (August 1993): 27–32.

© 2003 South-Western
7
Distribution of Race/Gender Groups across Occupations with Varying Promotion Opportunities, 2001
Table 9.2
SOURCE: Occupation classification is made by Waddoups and Assane, “Mobility and Gender in a Segmented Labor Market: A Closer Look,” appendix; distribution of workers across occupations from Bureau of Labor Statistics, Employment and Earnings (January 2002), Table 11.
© 2003 South-Western
8
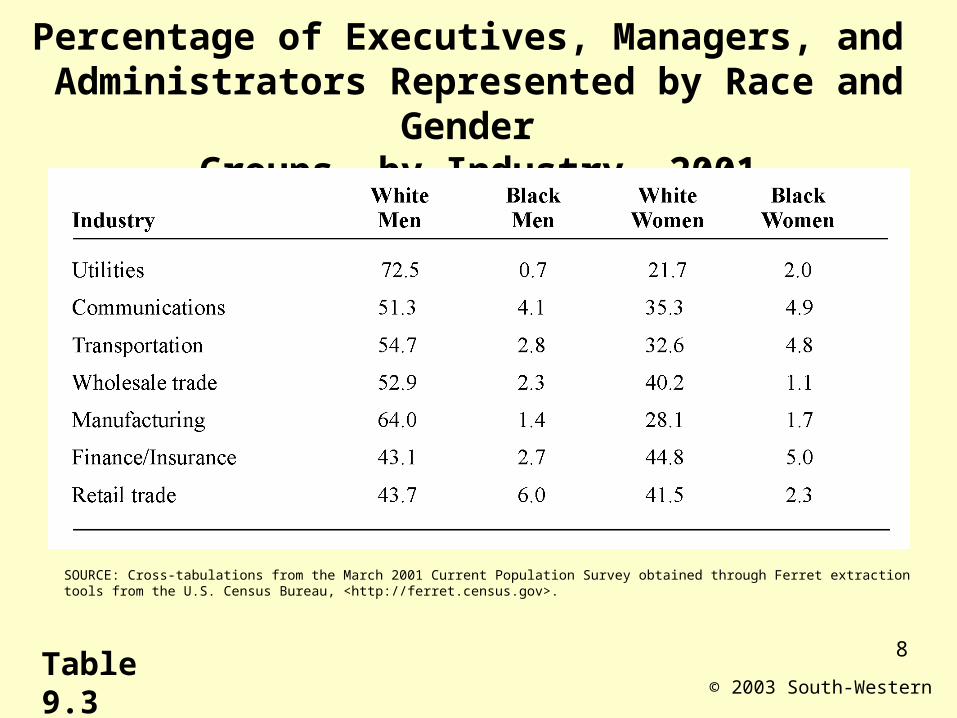
Percentage of Executives, Managers, and Administrators Represented by Race and Gender
Groups, by Industry, 2001
Table 9.3
SOURCE: Cross-tabulations from the March 2001 Current Population Survey obtained through Ferret extraction tools from the U.S. Census Bureau, <http://ferret.census.gov>.

© 2003 South-Western
9
Mean Values of Worker Characteristics and Percentage of Wage Gap Explained
Table 9.4
SOURCE: Based on Garey Durden and Patricia Gaynor, “More on The Cost of Being Other Than White and Male: Measurement of Race, Ethnic, and Gender Effects on Yearly Earnings,” American Journal of Economics and Sociology 57 (January 1998), Table 1 and unpublished tables.

© 2003 South-Western
10
The Residual Approach to Measuring Wage Discrimination
Figure 9.5

© 2003 South-Western
11
Dimensions of Black Economic Progress, 1960–2000
Table 9.5
SOURCES: Earnings: Bureau of the Census, Money Income of Households, Families and Persons in the United States, P-60 series, <http:// ferret.bls.census.gov/macro/032001/perinc/new05_032.htm>. Education: National Center for Educational Statistics, U.S. Department of Education, Office of Educational Research and Improvement, Digest of Educational Statistics; education statistics calculated from the 2001 March Supplement of the Current Population Survey. Occupational representation: Bureau of the Census, Statistical Abstract of the United States, various issues. Employment/Population ratios: E. Jacobs, ed., Handbook of Labor Statistics (Lanham, Md.: Bernan Press, 1998) and Ferret extraction tool from <http//ferret.bls.census.gov>. Householder information:<http://www.census.gov/population/www/socdemo/hh-fam.html>. Family income statistics: http://www.census.gov/hhes/income/histinc/f05.html. Poverty: Bureau of the Census, Poverty in the U.S. 2000 Current Population Reports Consumer Income Series, P-60, no. 214.

© 2003 South-Western
12
Relationship Between Monthly Salary and Job Worth Points for Men and Women, Washington State, 1974
Figure 9.6
SOURCE: Donald J. Treiman and Heidi I. Hartmann, eds., Women, Work, and Wages (Washington, D.C.: National Academy Press, 1981): 61. Used with permission.

© 2003 South-Western
13
Number of Hours Required to Receive Full-Time Wage Premium by Race and Gender Groups
Table 9.6
SOURCE: Based on information contained in Susan L. Averett and Julie L. Hotchkiss, “Discrimination in the Payment of Full-Time Wage Premiums,” Industrial and Labor Relations Review 49 (January 1996): 287–301, Tables 3a–3d.

E N D