C Davis Department of utrition C Agriculture and atural ...
16
Volume 43 Nutrition Perspectives Issue 2, April – June 2018 UC Davis Department of Nutrition, UC Agriculture and Natural Resources, and Center for Nutrition in Schools Dark Chocolate Consumption May Help Improve Aspects of Vision Chocolate, a popular treat enjoyed by many worldwide, may also be providing health benefits to those who consume it. Chocolate, or more specifically, flavanol-rich dark chocolate, may help improve cardiovascular function, increase blood flow to the nervous system, and even enhance mood and cognition. A recent study adds another potential benefit to dark chocolate consumption: improvements to certain aspects of vision (1). In a new study published in JAMA Ophthalmology examines whether dark and milk chocolate can improve visual acuity (how clear or sharp your vision is) or contrast sensitivity (how much contrast a person needs to distinguish an object from the background) (2,3). Thirty participants were randomized to consume either a bar of dark chocolate (containing 316.3 mg of flavanols) or milk chocolate (containing 40 mg of flavanols). About an hour and 45 minutes later, each participate underwent testing for visual acuity, and both small-letter and large-letter contrast sensitivity. Using a cross-over design, participants returned at least three days later to repeat the procedure with the other type of chocolate. Table of Contents Dark Chocolate Consumption May Help Improve Aspects of Vision 1 FDA Finalizes Guidance to Help Food Establishments Meet Menu Labeling Requirements 3 Food Waste Resonates Beyond the Trash Bin 4 FDA Approves First Continuous Glucose Monitoring System with a Fully Implantable Glucose Sensor 6 Does a Beverage Tax Change Intake? 8 Some Facts about Omega-3 Fatty Acids 10 Maternal Caffeine Intake During Pregnancy and Childhood Overweight 14 Chocolate continued on page 2
Transcript of C Davis Department of utrition C Agriculture and atural ...

Volume 43
Nutrition PerspectivesIssue 2, April – June 2018
UC Davis Department of Nutrition, UC Agriculture and Natural Resources, and Center for Nutrition in Schools
Dark Chocolate Consumption May Help Improve Aspects of Vision
Chocolate, a popular treat enjoyed by many worldwide, may also be providing health benefits to those who consume it. Chocolate, or more specifically, flavanol-rich dark chocolate, may help improve cardiovascular function, increase blood flow to the nervous system, and even enhance mood and cognition. A recent study adds another potential benefit to dark chocolate consumption: improvements to certain aspects of vision (1).
In a new study published in JAMA Ophthalmology examines whether dark and milk chocolate can improve visual acuity (how clear or sharp your vision is) or contrast sensitivity (how much contrast a person needs to distinguish an object from the background) (2,3).
Thirty participants were randomized to consume either a bar of dark chocolate (containing 316.3 mg of flavanols) or milk chocolate (containing 40 mg of flavanols). About an hour and 45 minutes
later, each participate underwent testing for visual acuity, and both small-letter and large-letter contrast sensitivity. Using a cross-over design, participants returned at least three days later to repeat the procedure with the other type of chocolate.
Table of Contents Dark Chocolate Consumption May Help Improve Aspects of Vision
1
FDA Finalizes Guidance to Help Food Establishments Meet Menu Labeling Requirements
3
Food Waste Resonates Beyond the Trash Bin 4
FDA Approves First Continuous Glucose Monitoring System with a Fully Implantable Glucose Sensor
6
Does a Beverage Tax Change Intake? 8
Some Facts about Omega-3 Fatty Acids 10
Maternal Caffeine Intake During Pregnancy and Childhood Overweight
14
Chocolate continued on page 2

Volume 43
2
Overall, they found small but statistically significant differences in visual acuity and small-letter contrast sensitivity with consumption of dark chocolate compared to milk chocolate, indicating that dark chocolate may cause small improvements in vision. When the scores were combined into a composite score, they found that 80 percent of participants had an improvement in with dark chocolate compared to milk chocolate.
While improvements in participant visual acuity and contrast sensitivity were observed, neither were measured prior to consumption of either chocolate, or after consumption of a food containing no flavanols. As a result, researchers were only able to compare the effects of dark
chocolate to milk chocolate, but not to baseline vision without either chocolate or to the effects of a food without flavanols. Furthermore, by taking measurements only at one time point after consumption of each chocolate, the
authors aren’t able to determine how long the improvements in vision persist. The authors attributed the effects on vision to the flavanol content of the chocolate and noted that flavonoids have a short half-life and can be cleared from the blood in as little as four hours. The authors suggested that additional testing would be needed to further elaborate on
these results and determine real-world effects outside of a lab setting.
Chocolate (Continued from page 1)
EditorSheri Zidenberg-Cherr, Ph.D.Nutrition Specialist
Managing EditorAnna M. Jones, Ph.D.
Sheri Zidenberg-Cherr, Ph.D., Nutrition Specialist, Anna M. Jones, Ph.D., and staff prepare NUTRITION PERSPECTIVES. This newsletter is designed to provide research-based information on ongoing nutrition and food-related programs. It is published quarterly (four times annually) as a service of the UC Davis Center for Nutrition in Schools, the University of California Agriculture and Natural Resources and the United States Department of Agriculture. NUTRITION PERSPECTIVES is available online, free of charge, at http://nutrition.ucdavis.edu/perspectives. Questions or comments on articles may be addressed to: NUTRITION PERSPECTIVES, Department of Nutrition, University of California, Davis, CA 95616-8669. Phone:(530) 752-3387; FAX: (530) 752-8905.
Visual acuity is a measurement of how sharp a person's vision is.
References:
1. Rabin JC, Karunathilake N, Patrizi K. Effects of Milk vs Dark Chocolate Consumption on Visual Acuity and Contrast Sensitivity Within 2 Hours: A Randomized Clinical Trial. JAMA Ophthalmol. 2018 Jun 1;136(6):678-681. doi: 10.1001/jamaophthalmol.2018.0978.
2. Visual Acuity: What is 20/20 Vision? American Optometric Association. https://www.aoa.org/patients-and-public/eye-and-vision-problems/glossary-of-eye-and-vision-conditions/visual-acuity
3. Owsley C. Contrast sensitivity. Ophthalmol Clin North Am. 2003 Jun;16(2):171-7.
By Anna M. Jones, Department of Nutrition, University of California, Davis.

Issue 2, April – June 2018
3
FDA Finalizes Guidance to Help Food Establishments Meet Menu Labeling Requirements
The U.S. Food and Drug Administration finalized an existing draft guidance document to further assist restaurants and similar retail food establishments to implement the requirements of the menu labeling final rule. Completing work on menu labeling is an important part of a comprehensive, multi-year Nutrition Innovation Strategy announced in March by FDA Commissioner Scott Gottlieb aimed at providing consumers with easier access to nutritious, affordable foods by empowering them with information and facilitating industry innovation toward healthier foods that consumers want.
The menu labeling rule applies to restaurants and similar retail food establishments if they are part of a chain of 20 or more locations, doing business under the same name, and offering for sale substantially the same menu items. Covered establishments have to disclose the number of calories contained in standard items on menus and menu boards, or for self-service foods and foods on display, in a manner in close proximity and clearly associated with the standard menu item. Businesses must also provide, upon request, the following nutrition information: total calories; total fat; saturated fat; trans fat; cholesterol; sodium; total carbohydrates; sugars; fiber; and protein. In addition, a statement must be displayed about the availability of such written information. On menus and menu boards, a statement must
be included concerning daily caloric intake, indicating that 2,000 calories a day is used for general nutrition advice, but calorie needs vary.
The Supplemental Guidance for Industry addresses public and stakeholder comments and expands upon the draft version issued in November 2017 by providing further clarity on the FDA’s practical and flexible approach to
several components of the final rule. The question-and-answer style guidance includes graphics and pictures to illustrate the many ways that industry can comply with the provisions of the menu labeling final rule. It addresses such questions as how to distinguish a menu/menu board from marketing materials like coupons and calorie disclosure signage for self-service
foods, like buffets and “grab and go” foods.
Many establishments are already displaying menu labeling information. By May 7, covered establishments nationwide were expected to comply with the rule. During the first year of implementation, the FDA will work cooperatively with covered establishments to achieve high levels of compliance with the menu labeling requirements. The agency intends to allow establishments a reasonable opportunity to make corrections for minor violations and plans to continue with education and training.
Menus are required to be labeled with the number of calories in each item, and
additional must be available upon request.
Menu Continued on Page 4

Volume 43
4
The FDA will continue to provide a number of resources for industry, including an educational module and fact sheets. In addition, the FDA will publish a compliance plan soon that outlines its strategy for compliance and enforcement.
The FDA recognizes the need to implement menu labeling requirements in a way that meets the needs of consumers, but is also pragmatic and not overly burdensome to restaurants and similar retail food establishments. They plan to work closely with industry and consumers in the next year to implement the rule’s requirements.
The Supplemental Guidance can be found at: https://www.fda.gov/Food/GuidanceRegulation/Guidance DocumentsRegulatoryInformation/ucm583487.htm. Source: FDA Constituent Updates; May 7, 2018; https://www.fda.gov/Food/NewsEvents/ConstituentUpdates/ucm605524.htm
Food Waste Resonates Beyond the Trash BinHere’s a thought to chew on before you
toss out that unfinished meal or oddly shaped fruit or vegetable: U.S. consumers waste nearly a pound of food per person per day. So says a study published by a team of Agricultural Research Service (ARS) and university scientists in the journal PLOS ONE.
That food waste, in turn, is equivalent to about one-third the daily calories that each American consumes—about 327 million individuals. Interestingly, fruits and vegetables—key components of a high-quality diet (as defined by the 2015-2020 Dietary Guidelines for Americans)—were the most wasted food items, the team determined from their computer-aided analysis of eight years of available food survey data.
Menu (Continued from page 3)
The menu labeling rule applies to restaurants and similar retail food establishments if they
are part of a chain of 20 or more locations.
U.S. consumers waste nearly a pound of food per person per day.
Food Waste Continued on Page 5

Issue 2, April – June 2018
5
Zach Conrad, a postdoctoral nutritionist with the ARS Grand Forks (North Dakota) Human Nutrition Research Center, together with fellow nutritionist Lisa Jahns and colleagues from the University of Vermont and University of New Hampshire, conducted the food-waste study to fill gaps left by prior research that sought to establish links between diet quality and environmental impacts. In this study, the team notes that food waste should be factored into such efforts because of the substantial resources used to produce food, including cropland and amendments like pesticide and fertilizer, as well as irrigation water.
For example, using a powerful computing tool known as the U.S. Foodprint Model, the team determined that from 2007 to 2014, U.S. consumers discarded 150,000 tons of food daily—waste that corresponded to the yearly use of an estimated 30 million acres of land (7 percent of total U.S. harvested cropland), 780 million pounds of pesticide, 1.8 billion pounds of nitrogen fertilizer and 4.2 trillion gallons of irrigated water. Each represents potential costs to the environment and the farmers who dedicate their time, land and other resources to growing or raising food that’s meant to be eaten.
The study also found that—
• U.S. consumers wasted almost a pound (422 grams) of food per person daily, which is equal to 30 percent of daily calories consumed and 25 percent of daily food eaten by weight.
• Of 22 food groups studied, fruits, vegetables, and mixed fruit and vegetable dishes (39 percent of total) were wasted the most—followed by dairy (17 percent) and meat and mixed-meat dishes (14 percent).
• Growing fruits and vegetables—signatures of diet quality required less land than other crops but more water and pesticide.
The researchers note that while their study used the best-available food survey data, there are limitations to it and that additional research is needed. The findings nonetheless underscore the
Food Waste (Continued from page 4)
Fruits and vegetables were found to be the most wasted food items.
The wasted food corresponds to the yearly use of an estimated 30 million acres of
land, 780 million pounds of pesticide, 1.8 billion pounds of nitrogen fertilizer and
4.2 trillion gallons of irrigated water.Food Waste Continued on Page 6

Volume 43
6
importance of improving diet quality hand in hand with using measures that reduce food waste and avoid overburdening the environment. Efforts like the U.S. Food Loss and Waste Challenge to create greater awareness of food waste issues, educating consumers on properly preparing and storing fruits and vegetables, and discerning natural ripening from spoilage can also help.
“Food waste is an issue that plays out at many different levels,” says Conrad. “Looking at them holistically will become increasingly important to finding sustainable ways of meeting the needs of a growing world population.”Reference:
1. Conrad Z, Niles MT, Neher DA, Roy ED, Tichenor NE, Jahns L (2018) Relationship between food waste, diet quality, and environmental sustainability. PLoS ONE 13(4): e0195405. https://doi.org/10.1371/journal.pone.0195405
Source: Jan Suskiw. USDA ARS Research News; April 18, 2018; https://www.ars.usda.gov/news-events/news/research-news/2018/food-waste-resonates-beyond-the-trash-bin/
Improving diet quality can go hand in hand with reducing food waste and sustainability efforts.
FDA Approves First Continuous Glucose Monitoring System with a Fully Implantable Glucose Sensor
The U.S. Food and Drug Administration approved the Eversense Continuous Glucose Monitoring (CGM) system for use in people 18 years of age and older with diabetes. This is the first FDA-approved CGM system to include a fully implantable sensor to detect glucose, which can be worn for up to 90 days.
“The FDA is committed to advancing novel products that leverage digital technology to improve patient care,” said FDA Commissioner Scott Gottlieb, M.D. “These technologies allow patients to gain better control over their health. This approval of a more seamless digital system that gives patients the ability to effectively manage a chronic disease like diabetes is a vivid illustration of the potential for these mobile platforms. The FDA is creating a new and more carefully tailored regulatory approach for software products, including mobile medical apps, that will enable efficient oversight of these digital technologies and
Glucose Monitor Continued on page 7
The vast majority of blood glucose monitors require test strips and f inger
pricks.
Food Waste (Continued from page 5)

Issue 2, April – June 2018
7
maintain FDA’s gold standard for product review. We’re advancing a more modern approach for these products that’s carefully adapted to the unique characteristics of these opportunities.”
People with diabetes either do not make enough insulin (type 1 diabetes) or cannot use insulin properly (type 2 diabetes). When the body does not have enough insulin, or cannot use it effectively, sugar builds up in the blood. High blood sugar levels can lead to heart disease, stroke, blindness, kidney failure and amputation of toes, feet or legs. Individuals living with diabetes must regularly monitor their glucose levels as part of the management of the disease. This includes making sure that diabetes management accessories, like most current glucose sensors, are replaced on a regular basis (generally, every seven days) to ensure that an overall CGM system is properly functioning.
The Eversense CGM system uses a small sensor that is implanted just under the skin by a qualified health care provider during an outpatient procedure. After it is implanted, the sensor regularly measures glucose levels in adults with diabetes for up to 90 days. The implanted sensor works with a novel light-based technology to measure glucose levels and send information to a mobile app to alert users if glucose levels are too high (hyperglycemia) or too low (hypoglycemia). The sensor is coated with a fluorescent chemical which, when exposed to blood sugar, produces a small amount of light that is measured by the sensor. Every five minutes, measurements are sent to a compatible mobile device (e.g., smart phone or tablet) that is running a device-specific mobile app.
The FDA evaluated clinical study data from 125 individuals aged 18 and older with diabetes and reviewed the device’s effectiveness by comparing readings obtained by the Eversense CGM system to those obtained by a laboratory-based glucose analyzer. The safety of the Eversense CGM system’s 90-day implantable sensor, and the procedure used to implant it, was also evaluated during the clinical studies. During these studies, the proportion
High blood sugar can lead to a myriad of health issues,
including heart disease, blindness, and kidney failure.
Glucose Monitor (Continued from page 6)
People with diabetes either do not make enough insulin (type 1 diabetes) or cannot
use insulin properly (type 2 diabetes).
Glucose Monitor Continued on page 8

Volume 43
8
Glucose Monitor (Continued from page 7)of individuals experiencing a serious adverse event with the implanted sensor was less than 1 percent. The safety of this novel system will also be evaluated in a post-approval study. The FDA held an Advisory Committee meeting to provide an independent assessment of the safety and effectiveness of the Eversense CGM system. In an 8 to 0 vote, the committee recommended that the benefits of the Eversense CGM system outweigh the risks for patients with diabetes.
Potential adverse effects related to insertion, removal and wear of the sensor include allergic reaction to adhesives, bleeding, bruising, infection, pain or discomfort, scarring or skin discoloration, sensor fracture during removal, skin inflammation, thinning, discoloration or redness. Other risks associated with use of the CGM system may include
hypoglycemia or hyperglycemia in cases where information provided by the device is inaccurate
or where alerts are missed.
The FDA granted approval of the Eversense Continuous Glucose Monitoring System to Senseonics, Inc.
The FDA, an agency within the U.S. Department of Health and Human Services, protects the public health by assuring the safety, effectiveness, and security of human and veterinary drugs, vaccines and other
biological products for human use, and medical devices. The agency also is responsible for the safety and security of our nation’s food supply, cosmetics, dietary supplements, products that give off electronic radiation, and for regulating tobacco products.
Beverage Continued on page 9
The proportion of individuals who experienced adverse events with the device was less than
1 percent, however the FDA will continue to evaluate the safety of the device.
Source: FDA News and Events; June 21, 2018; https://www.fda.gov/NewsEvents/Newsroom/PressAnnouncements/ucm611454.htm
Does a Beverage Tax Change Intake?On January 1, 2017, Philadelphia
Pennsylvania became the second U.S. city, after Berkeley California, to levy a beverage tax on sugar-sweetened beverages, including soda, energy drinks, and fruit drinks. The reasoning behind these taxes is that these beverages offer no nutritive value beyond empty calories, and a tax would decrease consumption while

Issue 2, April – June 2018
9
also providing revenue to the city. But do they actually reduce consumption? That is the question that researchers at Drexel sought to answer in a recent study (1).
In Philadelphia, every beverage sold is subject to an excise tax of 1.5 cents per ounce, paid by the distributer, with the exception of 100 percent fruit juice, water, and beverages containing at least 50 percent milk. For most beverages, this means about a 20 percent increase in price if the retailer passes the entire price increase onto the consumer. Unlike the Berkeley beverage tax, the Philadelphia beverage tax does not exclude diet beverages.
Using a random digit dialing phone survey, the researchers contacted a random sample of people living in Philadelphia (n=889) to inquire about their beverage purchases between January 16 and February 28, shortly after the beverage tax when into effect on January 1. They also surveyed individuals in similar cities located in New Jersey and Delaware to serve as a comparison group (n=878). Specifically, the researchers wanted to know if the beverage tax resulted in fewer people drinking sugar-sweetened
beverage on a daily basis, and if it resulted in reduced frequency of consuming sugar-sweetened beverages.
Overall, the odd of someone consuming a sugar-sweetened beverage daily in the Philadelphia group dropped by 40 percent in relation to the comparison cities. The likelihood of drinking an energy drink daily was even lower, with a drop of 64 percent. The frequency of drinking regular soda also decreased by almost 40 percent when compared to the other cities.
These results are interesting because they show an immediate difference in people’s habits following the implementation of a beverage tax. The authors did note, however, that the study took place in the winter months, and consumption patterns might be different in the summer. Further studies are also needed to determine if other types of foods and beverages are being purchased instead and what those may be.
Beverage (Continued from page 8)
After the tax was implemented, those living in Philadelphia were less likely to drink soda or energ y drinks daily, and drank soda less frequently.
Further studies are needed to determine the kinds of
foods or beverages that are being purchased instead of
sugar-sweetened beverages.
Reference:
1. Zhong Y, Auchincloss AH, Lee BK, Kanter GP. The Short-Term Impacts of the Philadelphia Beverage Tax on Beverage Consumption. Am J Prev Med. 2018 Jul;55(1):26-34. doi: 10.1016/j.amepre.2018.02.017. Epub 2018 Apr 12.
By Anna M. Jones, Department of Nutrition, University of California, Davis.

Volume 43
10
Some Facts about Omega-3 Fatty Acids
What are omega-3 fatty acids?
Omega-3 fatty acids are a type of fat that are important to human health. These fatty acids are found mostly in fish and plant oils (1). There are 3 main types of Omega-3 fatty acids: α-linolenic acid (ALA), eicosapentaenoic acid (EPA), and docosahexaenoic acid (DHA) (2). Consumption of omega-3 fatty acids is an important part of a healthy diet (3).
What are the health benefits of omega-3 fatty acids?
Role of Omega-3 Fatty Acids in Inflammation and Chronic Disease Prevention
Omega-3 fatty acids help maintain body temperature and reduce inflammation. Inflammation is one of the ways the body fights infection and recovers from injury. However, long-term inflammation can lead to serious diseases like heart disease, cancer, and other illnesses (4,5). Omega-3 fatty acids may also help reduce symptoms of asthma, depression, and some autoimmune diseases (6).
Omega-3 Fatty Acid and Pregnancy
Consuming omega-3 fatty acids may improve pregnancy outcomes. An increase in dietary omega-3s during pregnancy has been shown to benefit both the mother and baby. Consuming DHA during pregnancy is important for brain and eye development of the baby and has been shown to lower the severity of
cold symptoms in infants (7).
What are the current recommendations for consumption of omega-3 fatty acids?
The Dietary Guidelines for Americans 2015-2020 recommends 450-500 milligrams of omega-3 fatty acids per day (2,3). Those with coronary heart disease should consume 1 gram of omega-3 fatty acid per day, preferably from fatty fish (9)
Omega-3 Continued on page 11

Issue 2, April – June 2018
11
What is the omega-3 fatty acid content of commonly consumed fish?
Some common seafood items with omega-3 fatty acids are salmon, tilapia, oyster, herring, and canned tuna (Table 1).
Omega-3 (Continued from page 10)
Omega-3 Continued on page 12
Table 1: Omega-3 fatty acid content of commonly consumed seafood
Fish (Raw) ALA (mg/3oz) EPA (mg/30z) DHA (mg/3oz)
Catfish 46 14 48
Clams 13 37 54
Cod 0 19 38
Crab 7 24 0
Flounder or Sole 15 93 117
Grouper 8 23 187
Haddock 2 39 31
Halibut 9 56 109
Herring 88 603 733
Lobster 37 87 58
Mahi Mahi 4 17 75
Orange Roughy 3 13 3
Oyster 139 230 300
Pollock 0 17 36
Red Snapper 3 43 221
Salmon 126 733 938
Shrimp 2 26 26
Tilapia 38 6 100
Tuna, canned 1 8 56

Volume 43
12
Omega-3 (Continued from Page 11)What is the omega-3 fatty acid content of commonly consumed plant oils, nuts, and seeds?
Examples of plant oils and nut/seeds that are good sources of omega-3 fatty acids include: flaxseed oil, canola oil, walnut oil, canola oil, olive oil, flaxseed, walnuts, pistachio, pumpkin and squash seeds, and pine nuts (8).
Table 2: Omega-3 fatty acid content of commonly consumed plant oils, nuts, and seeds.
Plant Oils ALA (mg/1 tbsp) EPA (mg/1 tbsp) DHA (mg/1 tbsp)
Olive Oil 46 14 48
Soybean Oil 923 0 0
Canola Oil 1279 0 0
Corn Oil 158 0 0
Walnut Oil 38 6 100
Flaxseed Oil 6703 0 0
Coconut Oil 3 0 0
Nuts/Seeds
Brazil nuts 24 0 0
Pine Nuts 151 0 0
Pistachio 261 0 0
Walnuts, black 3,346 0 0
Almonds 4 0 0
Peanuts 37 0 0
Pumpkin and Squash Seeds
155 0 0
Sunflower Seeds 103 0 0
Flaxseed 38,3326 0 0
What are the current recommendations for fish consumption?
The American Heart Association recommends at least 12 ounces of different types of fatty fish each week. One serving of fish is about 3 ounces (9).
Omega-3 Continued on page 13
Issue 2, April – June 2018
13
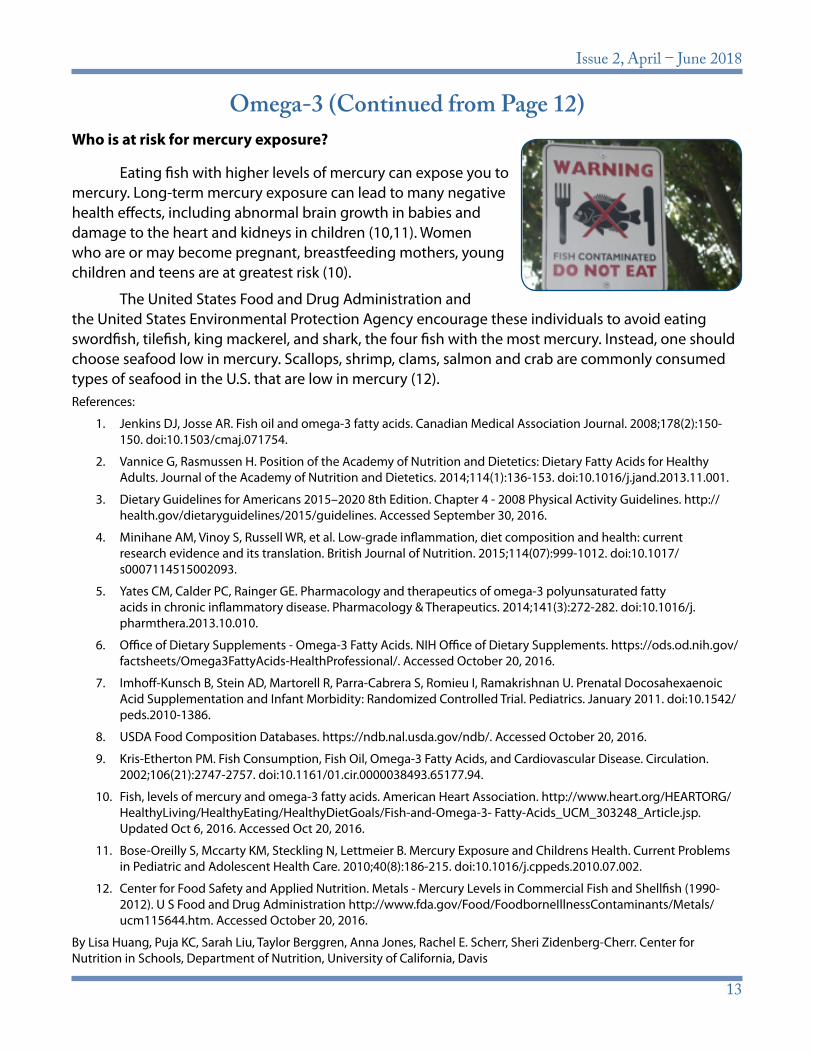
Who is at risk for mercury exposure?
Eating fish with higher levels of mercury can expose you to mercury. Long-term mercury exposure can lead to many negative health effects, including abnormal brain growth in babies and damage to the heart and kidneys in children (10,11). Women who are or may become pregnant, breastfeeding mothers, young children and teens are at greatest risk (10).
The United States Food and Drug Administration and the United States Environmental Protection Agency encourage these individuals to avoid eating swordfish, tilefish, king mackerel, and shark, the four fish with the most mercury. Instead, one should choose seafood low in mercury. Scallops, shrimp, clams, salmon and crab are commonly consumed types of seafood in the U.S. that are low in mercury (12).References:
1. Jenkins DJ, Josse AR. Fish oil and omega-3 fatty acids. Canadian Medical Association Journal. 2008;178(2):150-150. doi:10.1503/cmaj.071754.
2. Vannice G, Rasmussen H. Position of the Academy of Nutrition and Dietetics: Dietary Fatty Acids for Healthy Adults. Journal of the Academy of Nutrition and Dietetics. 2014;114(1):136-153. doi:10.1016/j.jand.2013.11.001.
3. Dietary Guidelines for Americans 2015–2020 8th Edition. Chapter 4 - 2008 Physical Activity Guidelines. http://health.gov/dietaryguidelines/2015/guidelines. Accessed September 30, 2016.
4. Minihane AM, Vinoy S, Russell WR, et al. Low-grade inflammation, diet composition and health: current research evidence and its translation. British Journal of Nutrition. 2015;114(07):999-1012. doi:10.1017/s0007114515002093.
5. Yates CM, Calder PC, Rainger GE. Pharmacology and therapeutics of omega-3 polyunsaturated fatty acids in chronic inflammatory disease. Pharmacology & Therapeutics. 2014;141(3):272-282. doi:10.1016/j.pharmthera.2013.10.010.
6. Office of Dietary Supplements - Omega-3 Fatty Acids. NIH Office of Dietary Supplements. https://ods.od.nih.gov/factsheets/Omega3FattyAcids-HealthProfessional/. Accessed October 20, 2016.
7. Imhoff-Kunsch B, Stein AD, Martorell R, Parra-Cabrera S, Romieu I, Ramakrishnan U. Prenatal Docosahexaenoic Acid Supplementation and Infant Morbidity: Randomized Controlled Trial. Pediatrics. January 2011. doi:10.1542/peds.2010-1386.
8. USDA Food Composition Databases. https://ndb.nal.usda.gov/ndb/. Accessed October 20, 2016.
9. Kris-Etherton PM. Fish Consumption, Fish Oil, Omega-3 Fatty Acids, and Cardiovascular Disease. Circulation. 2002;106(21):2747-2757. doi:10.1161/01.cir.0000038493.65177.94.
10. Fish, levels of mercury and omega-3 fatty acids. American Heart Association. http://www.heart.org/HEARTORG/HealthyLiving/HealthyEating/HealthyDietGoals/Fish-and-Omega-3- Fatty-Acids_UCM_303248_Article.jsp. Updated Oct 6, 2016. Accessed Oct 20, 2016.
11. Bose-Oreilly S, Mccarty KM, Steckling N, Lettmeier B. Mercury Exposure and Childrens Health. Current Problems in Pediatric and Adolescent Health Care. 2010;40(8):186-215. doi:10.1016/j.cppeds.2010.07.002.
12. Center for Food Safety and Applied Nutrition. Metals - Mercury Levels in Commercial Fish and Shellfish (1990-2012). U S Food and Drug Administration http://www.fda.gov/Food/FoodborneIllnessContaminants/Metals/ucm115644.htm. Accessed October 20, 2016.
By Lisa Huang, Puja KC, Sarah Liu, Taylor Berggren, Anna Jones, Rachel E. Scherr, Sheri Zidenberg-Cherr. Center for Nutrition in Schools, Department of Nutrition, University of California, Davis
Omega-3 (Continued from Page 12)

Volume 43
14
Women who are pregnant are advised to limit caffeine to under 200 mg/day.
Maternal Caffeine Intake During Pregnancy and Childhood Overweight
For a healthy pregnancy, many women choose to follow the advice of their obstetrician and various health agencies and avoid several different foods and beverages they enjoyed before they became pregnant. Many have heard that limiting caffeine during pregnancy is recommended and cut back on their intake or abstain entirely. There are several negative health outcomes that may be linked to high caffeine consumption during pregnancy, including risk of miscarriage and low birth weight (1-4). Researchers in Norway were interested in learning whether there are additional downsides to high caffeine consumption during pregnancy—increased risk of their infant growing very quickly (known as excess growth), which may result in higher risk for
obesity later in life, or increased risk of their child being overweight or obese at age 8 (5).
Data from the Norwegian Mother and Child Cohort Study, a study of pregnant women and their children that spanned 1999 to 2008, were used to examine the relationship between caffeine intake and risk of excess growth or being overweight at age 8. Over 50,000 women and child pairs were included in the analysis (n=50,943). The researchers calculated average daily intake of caffeine from not just beverages, but also other sources, such as chocolate. From this they were able to divide the study participants into four groups: low intake (0-49 mg/day), average intake (50-199 mg/day), high intake (200-299 mg/day) or very high intake (over 300 mg/day). By comparing infant’s growth and child’s BMI percentile between the four groups, they were able to determine if there was a different level of risk for these outcomes depending on caffeine intake.
They found that the infants of
Caffeine Continued on page 15
Coffee, which contains between 95 and 165 per cup, is consumed by over 90 percent U.S. adults.

Issue 2, April – June 2018
15
Caffeine (Continued from page 14)mothers who had high or very high intake caffeine were more likely to experience excess growth, with the risk of excess growth increasing with increasing intake of caffeine by the mother. Mothers with average intake were 15 percent more likely to have an infant with excess growth. This risk increased to 30 percent with high intake, and 66 percent with very high intake. In addition, children of mothers who consumed the most caffeine (over 300 mg/day) were 29 percent more likely to be overweight at age 8 than those whose mothers who had low intake of caffeine. The differences in risk between average or high intake compared to low intake were not statistically significant.
Currently, pregnant women are advised to limit caffeine to less than 200 milligrams per day, which is about the amount found in about one to two cups of coffee (depending on the roast) (6). The authors concluded that their findings contribute additional support to this recommendation.
References:
1. EFSA EFSA-PoDPNutrition and Allergies (NDA). Scientific Opinion on the safety of caffeine. EFSA Journal 2015;13:4102.
2. Mort JR, Kruse HR. Timing of blood pressure measurement related to caffeine consumption. Ann Pharmacother 2008;42:105–10.
3. Tomimatsu T, Lee SJ, Peña JP, et al. Maternal caffeine administration and cerebral oxygenation in near-term fetal sheep. Reprod Sci 2007;14:588–94.
4. VKM. Risk assessment of “other substances”– Caffeine. Opinion of the Panel on Food Additives, Flavourings, Processing Aids, Materials in Contact with Food and Cosmetics of the Norwegian Scientific Committee for Food Safety. Oslo, Norway: VKM, 2015.
5. Papadopoulou E, Botton J, Brantsæter AL et al. Maternal caffeine intake during pregnancy and childhood growth and overweight: results from a large Norwegian prospective observational cohort study. BMJ Open. 2018 Apr 23;8(3):e018895. doi: 10.1136/bmjopen-2017-018895.
6. Nutrition During Pregnancy Frequently Asked Questions. American College of Obstetricians and Gynecologists; Feb 2018; https://www.acog.org/Patients/FAQs/Nutrition-During-Pregnancy
By Anna M. Jones, Department of Nutrition, University of California, Davis.
In addition to caffeine, pregnant women are advised to avoid certain types of
f ish that are high in mercury, raw and undercooked eggs, meat, and sefood, and
foods linked to Listeria outbreaks.

Volume 43 Issue 2, April – June 2018
The University of California prohibits discrimination against or harassment of any person employed by or seeking employment with the University on the basis of race, color, national origin, religion, sex, gender, gender expression, gender identity, pregnancy, physical or mental disability, medical condition (cancer-related or genetic characteristics), genetic information (including family medical history), ancestry, marital status, age, sexual orientation, citizenship, status as a protected veteran or service in the uniformed services.University policy prohibits retaliation against any employee or person seeking employment for bringing a complaint of discrimination or harassment. University policy also prohibits retaliation against a person who assists someone with a complaint of discrimination or harassment, or participates in any manner in an investigation or resolution of a complaint of discrimination or harassment. Retaliation includes threats, intimidation, reprisals, and/or adverse actions related to employment.The University of California is an Equal Opportunity/Affirmative Action Employer. All qualified applicants will receive consideration for employment without regard to race, color, religion, sex, national origin, disability, age or protected veteran status.University policy is intended to be consistent with the provisions of applicable State and Federal laws. Inquiries regarding the University’s equal employment opportunity policies may be directed to: Academic: Susan Carlson, Ph.D., Vice Provost – Academic Personnel, UC Office of the President. (510) 987-9479. E-mail: [email protected] and Management: Dwaine B. Duckett, VP – Human Resources, UC Office of the President. (510) 987-0301. E-mail: [email protected]
University of California, Davis
Nutrition PerspectivesNutrition Department
One Shields Ave.Davis, CA 95616
Phone:530.752.3387
Fax:530.752.8905
Nutrition PerspectivesUniversity of California, Davis
Nutrition DepartmentOne Shields AveDavis, CA 95616