BUY In pole position - Business Standardbsmedia.business-standard.com/_media/bs/data/...by traders...
13
RESULTS REVIEW 4QFY17 30 MAY 2017 City Union Bank BUY In pole position CUBK’s earnings were in line with estimates, with healthy and broad based loan growth (11% QoQ), superior NIM (4.2%), stable core C-I ratio (47%) and a dip in LLP (78bps). While slippages were higher QoQ, the overall stressed book was lower sequentially at 2.3% with repayments in the restructured book. For FY16, CUBK’s divergence (w.r.t NPA classification) stood at 16/3.5% for GNPA/PAT. The mgmt hinted that the normal divergence stands at ~Rs 150-250mn for the last several years (except Rs 920mn in FY13). CUB is gradually addressing the concerns on asset quality and cost (absorbed the wage revision impact in FY17). Lower stressed assets, conservative provisions towards SR’s, healthy NIM and CRAR, and superior RoA profile provide comfort. Weak regional PSBs give CUBK an opportunity to revive growth and reap the oplev benefits. Maintain BUY with a TP of Rs 179 (2.5x Mar-19E ABV of Rs 72). Highlights of the quarter Slippages were higher at Rs 1.4bn (2.4% annu. vs. 2.2% QoQ), with the largest A/c of Rs 170-180mn. GNPA (Rs 6.8bn, 2.8%) rise was restricted (+5% QoQ) with higher aggregate reduction (Rs 1.1bn, +61% QoQ). The management maintained its stress watch-list of 3-4 ACs with exposures of Rs 500mn. Our slippages assumption at 1.75% provides an upside risk over FY17-19E. NIMs were flat QoQ at 4.2%, with 19bps drop in yields, even as the CD ratio jumped to ~80%. Given the resilient performance, we have tweaked our NIM estimate to 3.8% from 3.7% earlier. Loan growth (~11% QoQ) was healthy and broad- based, driven by strong growth in Agri and traders segments. The QoQ decline in the MSME segment was largely attributable to PSLC sell outs. We factor ~18% CAGR over FY17-19E, given healthy CRAR and the weak position of regional PSBs. Financial Summary (Rs mn) 4QFY17 4QFY16 YoY (%) 3QFY17 QoQ (%) FY16 FY17P FY18E FY19E Net Interest Income 3,106 2,645 17.4% 3,070 1.2% 9,810 11,988 13,542 15,426 PPOP 2,476 2,240 10.5% 2,736 -9.5% 8,333 9,937 10,904 12,077 APAT 1,289 1,122 14.8% 1,266 1.8% 4,447 5,028 5,750 6,607 EPS (Rs) 2.1 1.9 14.3% 2.1 1.8% 7.4 8.4 9.6 11.0 RoAE (%) (ex revaluations) 15.5 15.2 15.0 14.9 RoAA (%) 1.50 1.51 1.52 1.51 Adj. BVPS (Rs) 45.6 52.6 61.5 71.6 P/ABV (x) 3.62 3.14 2.68 2.30 P/E (x) 22.2 19.7 17.2 15.0 Source: Company, HDFC sec Inst Research INDUSTRY BANKS CMP (as on 29 May 2017) Rs 165 Target Price Rs 179 Nifty 9,605 Sensex 31,109 KEY STOCK DATA Bloomberg CUBK IN No. of Shares (mn) 601 MCap (Rs bn) / ($ mn) 99/1,542 6m avg traded value (Rs mn) 119 STOCK PERFORMANCE (%) 52 Week high / low Rs 185/103 3M 6M 12M Absolute (%) 14.6 23.2 55.0 Relative (%) 6.4 5.3 38.3 SHAREHOLDING PATTERN (%) Promoters - FIs & Local MFs 13.0 FPIs 36.7 Public & Others 50.3 Source : BSE Darpin Shah [email protected] +91-22-6171-7328 Pranav Gupta [email protected] +91-22-6171-7337 HDFC securities Institutional Research is also available on Bloomberg HSLB <GO> & Thomson Reuters
Transcript of BUY In pole position - Business Standardbsmedia.business-standard.com/_media/bs/data/...by traders...
RESULTS REVIEW 4QFY17 30 MAY 2017
City Union Bank BUY
In pole position CUBK’s earnings were in line with estimates, with healthy and broad based loan growth (11% QoQ), superior NIM (4.2%), stable core C-I ratio (47%) and a dip in LLP (78bps). While slippages were higher QoQ, the overall stressed book was lower sequentially at 2.3% with repayments in the restructured book.
For FY16, CUBK’s divergence (w.r.t NPA classification) stood at 16/3.5% for GNPA/PAT. The mgmt hinted that the normal divergence stands at ~Rs 150-250mn for the last several years (except Rs 920mn in FY13).
CUB is gradually addressing the concerns on asset quality and cost (absorbed the wage revision impact in FY17). Lower stressed assets, conservative provisions towards SR’s, healthy NIM and CRAR, and superior RoA profile provide comfort. Weak regional PSBs give CUBK an opportunity to revive growth and reap the oplev benefits. Maintain BUY with a TP of Rs 179 (2.5x Mar-19E ABV of Rs 72).
Highlights of the quarter Slippages were higher at Rs 1.4bn (2.4% annu. vs. 2.2%
QoQ), with the largest A/c of Rs 170-180mn. GNPA (Rs 6.8bn, 2.8%) rise was restricted (+5% QoQ) with higher aggregate reduction (Rs 1.1bn, +61% QoQ). The management maintained its stress watch-list of 3-4 ACs with exposures of Rs 500mn. Our slippages assumption at 1.75% provides an upside risk over FY17-19E.
NIMs were flat QoQ at 4.2%, with 19bps drop in yields, even as the CD ratio jumped to ~80%. Given the resilient performance, we have tweaked our NIM estimate to 3.8% from 3.7% earlier.
Loan growth (~11% QoQ) was healthy and broad-based, driven by strong growth in Agri and traders segments. The QoQ decline in the MSME segment was largely attributable to PSLC sell outs. We factor ~18% CAGR over FY17-19E, given healthy CRAR and the weak position of regional PSBs.
Financial Summary (Rs mn) 4QFY17 4QFY16 YoY (%) 3QFY17 QoQ (%) FY16 FY17P FY18E FY19E Net Interest Income 3,106 2,645 17.4% 3,070 1.2% 9,810 11,988 13,542 15,426 PPOP 2,476 2,240 10.5% 2,736 -9.5% 8,333 9,937 10,904 12,077 APAT 1,289 1,122 14.8% 1,266 1.8% 4,447 5,028 5,750 6,607 EPS (Rs) 2.1 1.9 14.3% 2.1 1.8% 7.4 8.4 9.6 11.0 RoAE (%) (ex revaluations)
15.5 15.2 15.0 14.9
RoAA (%)
1.50 1.51 1.52 1.51 Adj. BVPS (Rs)
45.6 52.6 61.5 71.6
P/ABV (x)
3.62 3.14 2.68 2.30 P/E (x)
22.2 19.7 17.2 15.0
Source: Company, HDFC sec Inst Research
INDUSTRY BANKS CMP (as on 29 May 2017) Rs 165 Target Price Rs 179 Nifty 9,605
Sensex 31,109
KEY STOCK DATA
Bloomberg CUBK IN
No. of Shares (mn) 601
MCap (Rs bn) / ($ mn) 99/1,542
6m avg traded value (Rs mn) 119
STOCK PERFORMANCE (%)
52 Week high / low Rs 185/103
3M 6M 12M
Absolute (%) 14.6 23.2 55.0
Relative (%) 6.4 5.3 38.3
SHAREHOLDING PATTERN (%)
Promoters -
FIs & Local MFs 13.0
FPIs 36.7
Public & Others 50.3
Source : BSE
Darpin Shah [email protected] +91-22-6171-7328 Pranav Gupta [email protected] +91-22-6171-7337
HDFC securities Institutional Research is also available on Bloomberg HSLB <GO> & Thomson Reuters
CITY UNION BANK : RESULTS REVIEW 4QFY17
Five Quarters At A Glance
Change In Estimates
(Rs mn) FY18E FY19E
Old New Change Old New Change NII 12,769 13,542 6.1% 15,219 15,426 1.4% PPOP 11,501 10,904 -5.2% 12,615 12,077 -4.3% PAT 5,752 5,750 0.0% 6,640 6,607 -0.5% Adj. BVPS (Rs) 60.8 61.5 1.2% 69.9 71.6 2.5%
Source: HDFC sec Inst Research
Rs mn 4QFY16 1QFY17 2QFY16 3QFY17 4QFY17 YoY Growth QoQ Growth Net Interest Income 2,645 2,800 3,012 3,070 3,106 17.4% 1.2% Non-interest Income 1,073 1,111 1,042 1,428 1,258 17.3% -11.9% Treasury Income 351 491 415 793 357 1.7% -55.0% Operating Income 3,717 3,911 4,054 4,498 4,364 17.4% -3.0% Operating Expenses 1,477 1,554 1,686 1,762 1,888 27.8% 7.1% Pre-Provision Profits 2,240 2,358 2,367 2,736 2,476 10.5% -9.5% Other Provisions 708 707 670 920 713 0.6% -22.5% PBT 1,532 1,650 1,697 1,816 1,764 15.1% -2.9% Provision For Tax 410 415 460 550 475 15.9% -13.6% PAT 1,122 1,235 1,237 1,266 1,289 14.8% 1.8% Balance Sheet items/ratios Deposits 272 279 284 300 301 10.9% 0.4% CASA % 20.4 20.6 20.7 23.9 23.4 300 bps -55 bps Advances 213 212 222 218 241 13.5% 10.6% CD Ratio (%) 78.3 75.9 78.2 72.7 80.1 181 bps 736 bps CAR (%) 15.6 15.3 14.8 14.9 15.8 25 bps 95 bps Tier I (%) 15.1 14.8 14.4 14.4 15.4 27 bps 97 bps Profitability Yield On Advances (%) 12.6 12.4 12.2 12.1 11.9 -73 bps -19 bps Cost Of Deposits (%) 7.4 7.1 6.9 6.7 6.6 -77 bps -5 bps NIM (%) 3.96 4.07 4.20 4.18 4.20 24 bps 2 bps Cost-Income Ratio (%) 39.7 39.7 41.6 39.2 43.3 353 bps 408 bps Tax Rate (%) 26.8 25.1 27.1 30.3 26.9 17 bps -335 bps Asset quality Gross NPA (Rs mn) 5,120 5,550 5,980 6,499 6,820 33.2% 4.9% Net NPA (Rs mn) 3,232 3,340 3,586 3,707 4,083 26.4% 10.2% Gross NPAs (%) 2.41 2.62 2.69 2.98 2.83 42 bps -15 bps Net NPAs (%) 1.53 1.59 1.63 1.72 1.71 18 bps -1 bps Delinquency Ratio (%) 2.51 1.89 2.25 2.15 2.42 -9 bps 27 bps Coverage Ratio Calc. (%) 36.9 39.8 40.0 43.0 40.1 324 bps -284 bps Coverage Ratio Reported (%) 60.0 60.0 60.0 62.0 61.0 100 bps -100 bps Restructured Book (%) 0.96 0.89 0.84 0.87 0.56 -40 bps -31 bps
Inline with estimates with stable NIM performance
Opex growth was led by~16% QoQ increase in other opex mainly owing to annual maintainence costs
In FY17, CUBK provided ~Rs 430mn towards SR’s anticipating future haircuts
Growth was largely broad-based driven by traders (+14% QoQ) and large corp (+12%) QoQ)
The sequential uptick of +33% in Agri and fall of ~3% in MSME was attributed to PSLC trading to meet the regulatory thresholds
NIM continues to be stable cushioned by a drop in COF
Despite slippages of ~Rs 1.38bn, accretion it GNPA’s was contained due to sequentially higher W/O’s of ~Rs 505mn. Divergence with RBI stood at a mere Rs 820mn
Sharp sequential dip was due to a repayment of ~Rs 220mn by a single exposure of ~Rs 750mn
Page | 2
CITY UNION BANK : RESULTS REVIEW 4QFY17
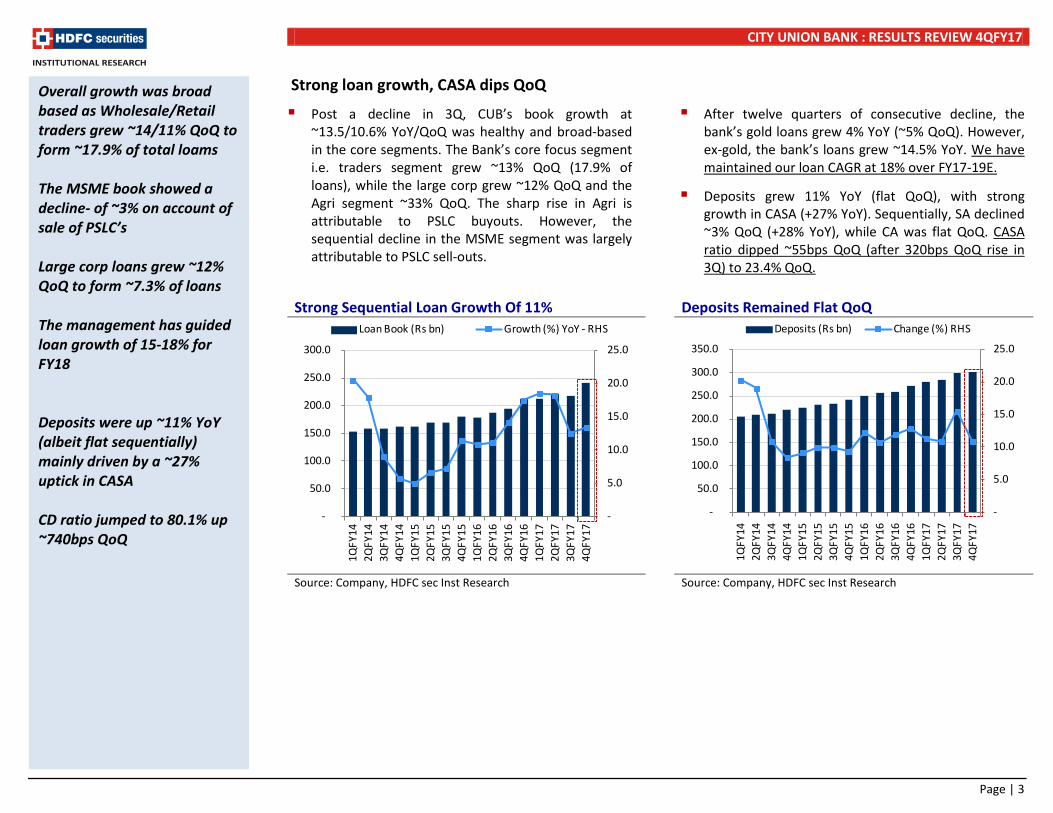
Strong loan growth, CASA dips QoQ
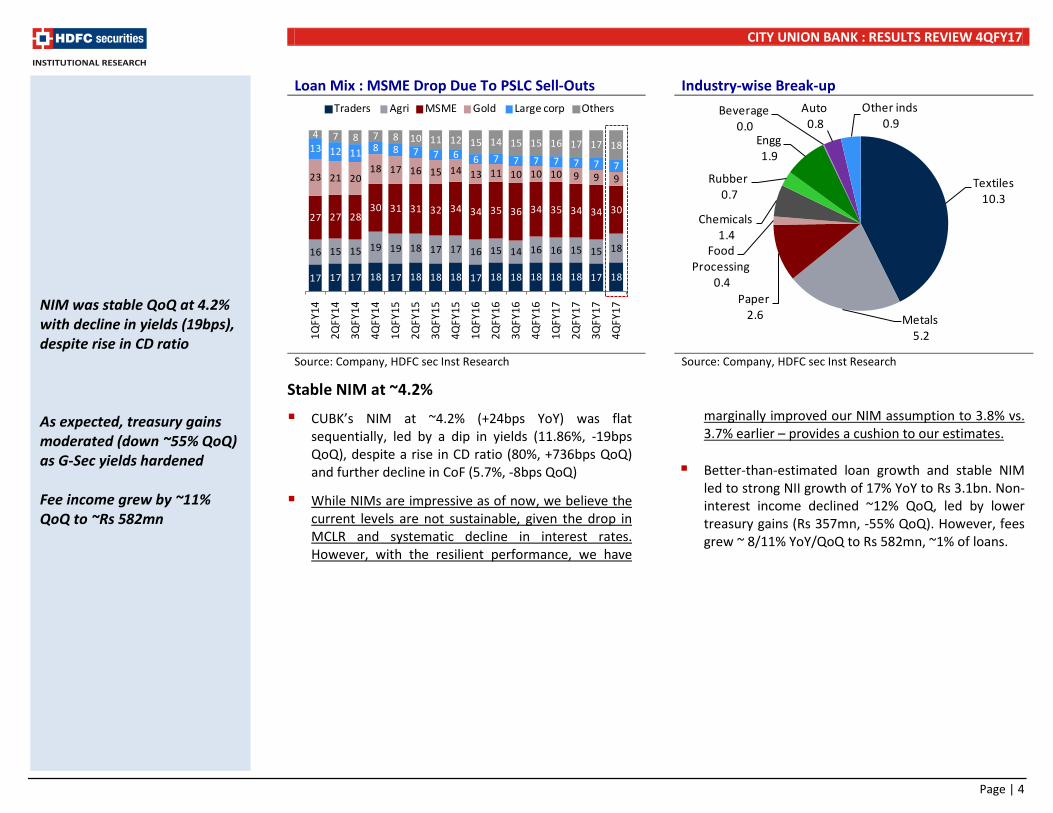
Post a decline in 3Q, CUB’s book growth at ~13.5/10.6% YoY/QoQ was healthy and broad-based in the core segments. The Bank’s core focus segment i.e. traders segment grew ~13% QoQ (17.9% of loans), while the large corp grew ~12% QoQ and the Agri segment ~33% QoQ. The sharp rise in Agri is attributable to PSLC buyouts. However, the sequential decline in the MSME segment was largely attributable to PSLC sell-outs.
After twelve quarters of consecutive decline, the bank’s gold loans grew 4% YoY (~5% QoQ). However, ex-gold, the bank’s loans grew ~14.5% YoY. We have maintained our loan CAGR at 18% over FY17-19E.
Deposits grew 11% YoY (flat QoQ), with strong growth in CASA (+27% YoY). Sequentially, SA declined ~3% QoQ (+28% YoY), while CA was flat QoQ. CASA ratio dipped ~55bps QoQ (after 320bps QoQ rise in 3Q) to 23.4% QoQ.
Strong Sequential Loan Growth Of 11% Deposits Remained Flat QoQ
Source: Company, HDFC sec Inst Research Source: Company, HDFC sec Inst Research
Overall growth was broad based as Wholesale/Retail traders grew ~14/11% QoQ to form ~17.9% of total loams The MSME book showed a decline- of ~3% on account of sale of PSLC’s Large corp loans grew ~12% QoQ to form ~7.3% of loans The management has guided loan growth of 15-18% for FY18 Deposits were up ~11% YoY (albeit flat sequentially) mainly driven by a ~27% uptick in CASA CD ratio jumped to 80.1% up ~740bps QoQ
-
5.0
10.0
15.0
20.0
25.0
-
50.0
100.0
150.0
200.0
250.0
300.0
350.0
1QFY
14
2QFY
14
3QFY
14
4QFY
14
1QFY
15
2QFY
15
3QFY
15
4QFY
15
1QFY
16
2QFY
16
3QFY
16
4QFY
16
1QFY
17
2QFY
17
3QFY
17
4QFY
17
Deposits (Rs bn) Change (%) RHS
-
5.0
10.0
15.0
20.0
25.0
-
50.0
100.0
150.0
200.0
250.0
300.0 1Q
FY14
2QFY
143Q
FY14
4QFY
141Q
FY15
2QFY
153Q
FY15
4QFY
151Q
FY16
2QFY
163Q
FY16
4QFY
161Q
FY17
2QFY
173Q
FY17
4QFY
17
Loan Book (Rs bn) Growth (%) YoY - RHS
Page | 3
CITY UNION BANK : RESULTS REVIEW 4QFY17
Loan Mix : MSME Drop Due To PSLC Sell-Outs Industry-wise Break-up
Source: Company, HDFC sec Inst Research Source: Company, HDFC sec Inst Research
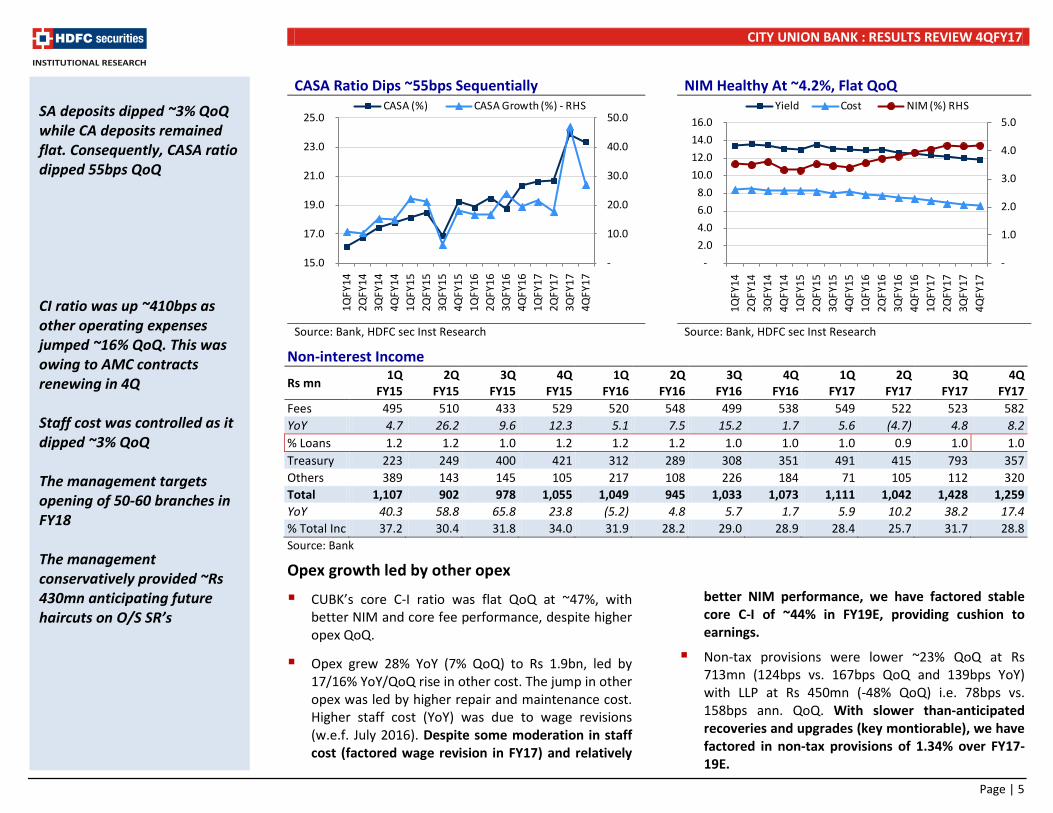
Stable NIM at ~4.2%
CUBK’s NIM at ~4.2% (+24bps YoY) was flat sequentially, led by a dip in yields (11.86%, -19bps QoQ), despite a rise in CD ratio (80%, +736bps QoQ) and further decline in CoF (5.7%, -8bps QoQ)
While NIMs are impressive as of now, we believe the current levels are not sustainable, given the drop in MCLR and systematic decline in interest rates. However, with the resilient performance, we have
marginally improved our NIM assumption to 3.8% vs. 3.7% earlier – provides a cushion to our estimates.
Better-than-estimated loan growth and stable NIM led to strong NII growth of 17% YoY to Rs 3.1bn. Non-interest income declined ~12% QoQ, led by lower treasury gains (Rs 357mn, -55% QoQ). However, fees grew ~ 8/11% YoY/QoQ to Rs 582mn, ~1% of loans.
NIM was stable QoQ at 4.2% with decline in yields (19bps), despite rise in CD ratio As expected, treasury gains moderated (down ~55% QoQ) as G-Sec yields hardened Fee income grew by ~11% QoQ to ~Rs 582mn
17 17 17 18 17 18 18 18 17 18 18 18 18 18 17 18
16 15 15 19 19 18 17 17 16 15 14 16 16 15 15 18
27 27 28 30 31 31 32 34 34 35 36 34 35 34 34 30
23 21 20 18 17 16 15 14 13 11 10 10 10 9 9 9
13 12 11 8 8 7 7 6 6 7 7 7 7 7 7 7
4 7 8 7 8 10 11 12 15 14 15 15 16 17 17 18
1QFY
14
2QFY
14
3QFY
14
4QFY
14
1QFY
15
2QFY
15
3QFY
15
4QFY
15
1QFY
16
2QFY
16
3QFY
16
4QFY
16
1QFY
17
2QFY
17
3QFY
17
4QFY
17
Traders Agri MSME Gold Large corp Others
Textiles10.3
Metals5.2
Paper 2.6
Food Processing
0.4
Chemicals1.4
Rubber 0.7
Engg1.9
Beverage 0.0
Auto0.8
Other inds0.9
Page | 4
CITY UNION BANK : RESULTS REVIEW 4QFY17
CASA Ratio Dips ~55bps Sequentially NIM Healthy At ~4.2%, Flat QoQ
Source: Bank, HDFC sec Inst Research Source: Bank, HDFC sec Inst Research
Non-interest Income
Rs mn 1Q
FY15 2Q
FY15 3Q
FY15 4Q
FY15 1Q
FY16 2Q
FY16 3Q
FY16 4Q
FY16 1Q
FY17 2Q
FY17 3Q
FY17 4Q
FY17 Fees 495 510 433 529 520 548 499 538 549 522 523 582 YoY 4.7 26.2 9.6 12.3 5.1 7.5 15.2 1.7 5.6 (4.7) 4.8 8.2 % Loans 1.2 1.2 1.0 1.2 1.2 1.2 1.0 1.0 1.0 0.9 1.0 1.0 Treasury 223 249 400 421 312 289 308 351 491 415 793 357 Others 389 143 145 105 217 108 226 184 71 105 112 320 Total 1,107 902 978 1,055 1,049 945 1,033 1,073 1,111 1,042 1,428 1,259 YoY 40.3 58.8 65.8 23.8 (5.2) 4.8 5.7 1.7 5.9 10.2 38.2 17.4 % Total Inc 37.2 30.4 31.8 34.0 31.9 28.2 29.0 28.9 28.4 25.7 31.7 28.8 Source: Bank
Opex growth led by other opex
CUBK’s core C-I ratio was flat QoQ at ~47%, with better NIM and core fee performance, despite higher opex QoQ.
Opex grew 28% YoY (7% QoQ) to Rs 1.9bn, led by 17/16% YoY/QoQ rise in other cost. The jump in other opex was led by higher repair and maintenance cost. Higher staff cost (YoY) was due to wage revisions (w.e.f. July 2016). Despite some moderation in staff cost (factored wage revision in FY17) and relatively
better NIM performance, we have factored stable core C-I of ~44% in FY19E, providing cushion to earnings.
Non-tax provisions were lower ~23% QoQ at Rs 713mn (124bps vs. 167bps QoQ and 139bps YoY) with LLP at Rs 450mn (-48% QoQ) i.e. 78bps vs. 158bps ann. QoQ. With slower than-anticipated recoveries and upgrades (key montiorable), we have factored in non-tax provisions of 1.34% over FY17-19E.
SA deposits dipped ~3% QoQ while CA deposits remained flat. Consequently, CASA ratio dipped 55bps QoQ CI ratio was up ~410bps as other operating expenses jumped ~16% QoQ. This was owing to AMC contracts renewing in 4Q Staff cost was controlled as it dipped ~3% QoQ The management targets opening of 50-60 branches in FY18 The management conservatively provided ~Rs 430mn anticipating future haircuts on O/S SR’s
-
10.0
20.0
30.0
40.0
50.0
15.0
17.0
19.0
21.0
23.0
25.0
1QFY
14
2QFY
14
3QFY
14
4QFY
14
1QFY
15
2QFY
15
3QFY
15
4QFY
15
1QFY
16
2QFY
16
3QFY
16
4QFY
16
1QFY
17
2QFY
17
3QFY
17
4QFY
17
CASA (%) CASA Growth (%) - RHS
-
1.0
2.0
3.0
4.0
5.0
-
2.0
4.0
6.0
8.0
10.0
12.0
14.0
16.0
1QFY
14
2QFY
14
3QFY
14
4QFY
14
1QFY
15
2QFY
15
3QFY
15
4QFY
15
1QFY
16
2QFY
16
3QFY
16
4QFY
16
1QFY
17
2QFY
17
3QFY
17
4QFY
17
Yield Cost NIM (%) RHS
Page | 5
CITY UNION BANK : RESULTS REVIEW 4QFY17
C-I Up ~410Bps QoQ Provisions Cost Lower QoQ
Source: Bank, HDFC sec Inst Research Source: Bank, HDFC sec Inst Research
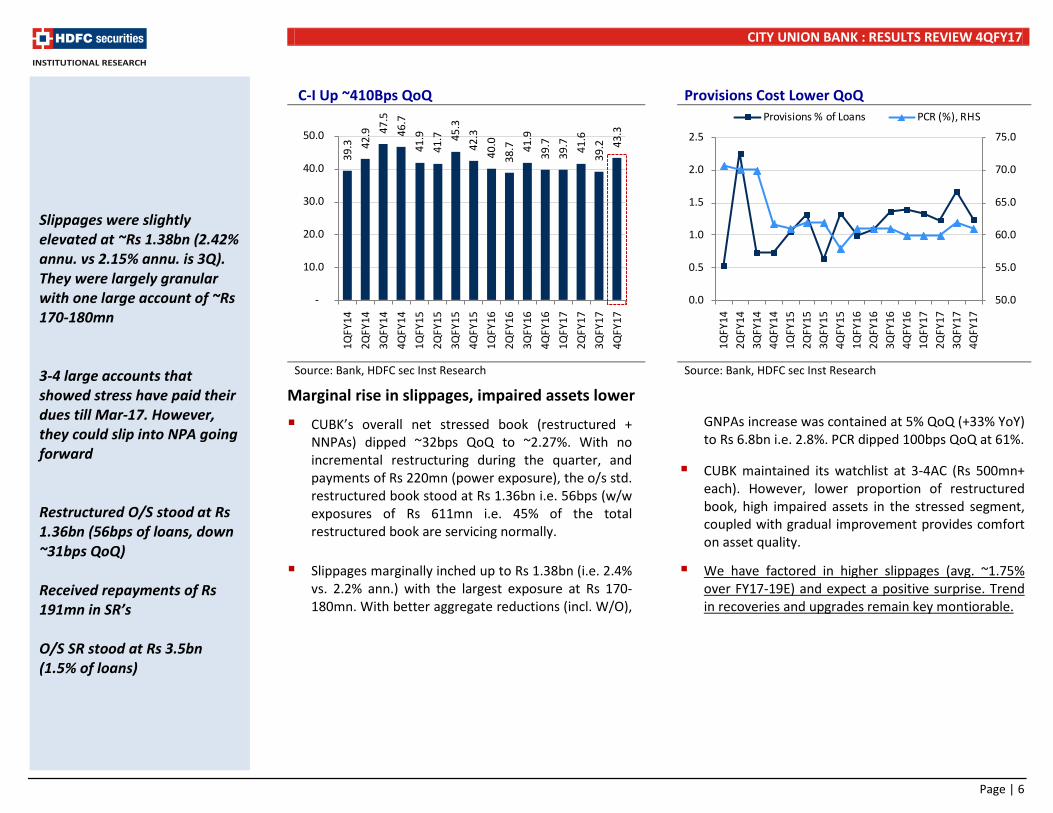
Marginal rise in slippages, impaired assets lower
CUBK’s overall net stressed book (restructured + NNPAs) dipped ~32bps QoQ to ~2.27%. With no incremental restructuring during the quarter, and payments of Rs 220mn (power exposure), the o/s std. restructured book stood at Rs 1.36bn i.e. 56bps (w/w exposures of Rs 611mn i.e. 45% of the total restructured book are servicing normally.
Slippages marginally inched up to Rs 1.38bn (i.e. 2.4% vs. 2.2% ann.) with the largest exposure at Rs 170-180mn. With better aggregate reductions (incl. W/O),
GNPAs increase was contained at 5% QoQ (+33% YoY) to Rs 6.8bn i.e. 2.8%. PCR dipped 100bps QoQ at 61%.
CUBK maintained its watchlist at 3-4AC (Rs 500mn+ each). However, lower proportion of restructured book, high impaired assets in the stressed segment, coupled with gradual improvement provides comfort on asset quality.
We have factored in higher slippages (avg. ~1.75% over FY17-19E) and expect a positive surprise. Trend in recoveries and upgrades remain key montiorable.
Slippages were slightly elevated at ~Rs 1.38bn (2.42% annu. vs 2.15% annu. is 3Q). They were largely granular with one large account of ~Rs 170-180mn 3-4 large accounts that showed stress have paid their dues till Mar-17. However, they could slip into NPA going forward Restructured O/S stood at Rs 1.36bn (56bps of loans, down ~31bps QoQ) Received repayments of Rs 191mn in SR’s O/S SR stood at Rs 3.5bn (1.5% of loans)
39.3
42.9
47.5
46.7
41.9
41.7
45.3
42.3
40.0
38.7
41.9
39.7
39.7
41.6
39.2
43.3
-
10.0
20.0
30.0
40.0
50.0
1QFY
14
2QFY
14
3QFY
14
4QFY
14
1QFY
15
2QFY
15
3QFY
15
4QFY
15
1QFY
16
2QFY
16
3QFY
16
4QFY
16
1QFY
17
2QFY
17
3QFY
17
4QFY
17
50.0
55.0
60.0
65.0
70.0
75.0
0.0
0.5
1.0
1.5
2.0
2.5
1QFY
14
2QFY
14
3QFY
14
4QFY
14
1QFY
15
2QFY
15
3QFY
15
4QFY
15
1QFY
16
2QFY
16
3QFY
16
4QFY
16
1QFY
17
2QFY
17
3QFY
17
4QFY
17
Provisions % of Loans PCR (%), RHS
Page | 6

CITY UNION BANK : RESULTS REVIEW 4QFY17
Slippages Within Expected Levels Restructured Book Dips 31bps QoQ
Source : Bank Source : Bank
Asset Quality Movement
(Rs mn) 1Q
FY15 2Q
FY15 3Q
FY15 4Q
FY15 1Q
FY16 2Q
FY16 3Q
FY16 4Q
FY16 1Q
FY17 2Q
FY17 3Q
FY17 4Q
FY17 Opening 2,931 3,083 3,379 3,607 3,358 3,594 3,983 4,599 5,120 5,550 5,980 6,499
Slippages 3,704 834 655 1,086 776 976 1,264 1,274 1,005 1,219 1,183 1,388
% Ann. 9.15 2.02 1.55 2.48 1.72 2.13 2.65 2.51 1.89 2.25 2.15 2.42
Upgrades 14 68 60 85 88 116 245 97 62 233 56 205
Recoveries 3,173 152 311 512 193 194 155 192 182 220 146 357
Write-Offs 365 319 56 738 259 277 248 464 331 336 462 505
Closing 3,083 3,378 3,607 3,358 3,594 3,983 4,599 5,120 5,550 5,980 6,499 6,820
QoQ % 5.2 9.6 6.8 (6.9) 7.0 10.8 15.5 11.3 8.4 7.7 8.7 4.9 Source: Bank
Restructured book remains lower vs. peers Sharp drop in restructured book led by repayments of Rs 220mn in a large power sector exposure of ~Rs 770mn.
-1.0 2.0 3.0 4.0 5.0 6.0 7.0 8.0 9.0 10.0
0
500
1,000
1,500
2,000
2,500
3,000
3,500
4,000
1QFY
14
2QFY
14
3QFY
14
4QFY
14
1QFY
15
2QFY
15
3QFY
15
4QFY
15
1QFY
16
2QFY
16
3QFY
16
4QFY
16
1QFY
17
2QFY
17
3QFY
17
4QFY
17
Rs mn Ann (%) LHS
-
0.5
1.0
1.5
2.0
2.5
-
0.5
1.0
1.5
2.0
2.5
3.0
3.5
1QFY
14
2QFY
14
3QFY
14
4QFY
14
1QFY
15
2QFY
15
3QFY
15
4QFY
15
1QFY
16
2QFY
16
3QFY
16
4QFY
16
1QFY
17
2QFY
17
3QFY
17
4QFY
17
Restructured loans (Rs bn) % of Loans RHS
Page | 7
CITY UNION BANK : RESULTS REVIEW 4QFY17
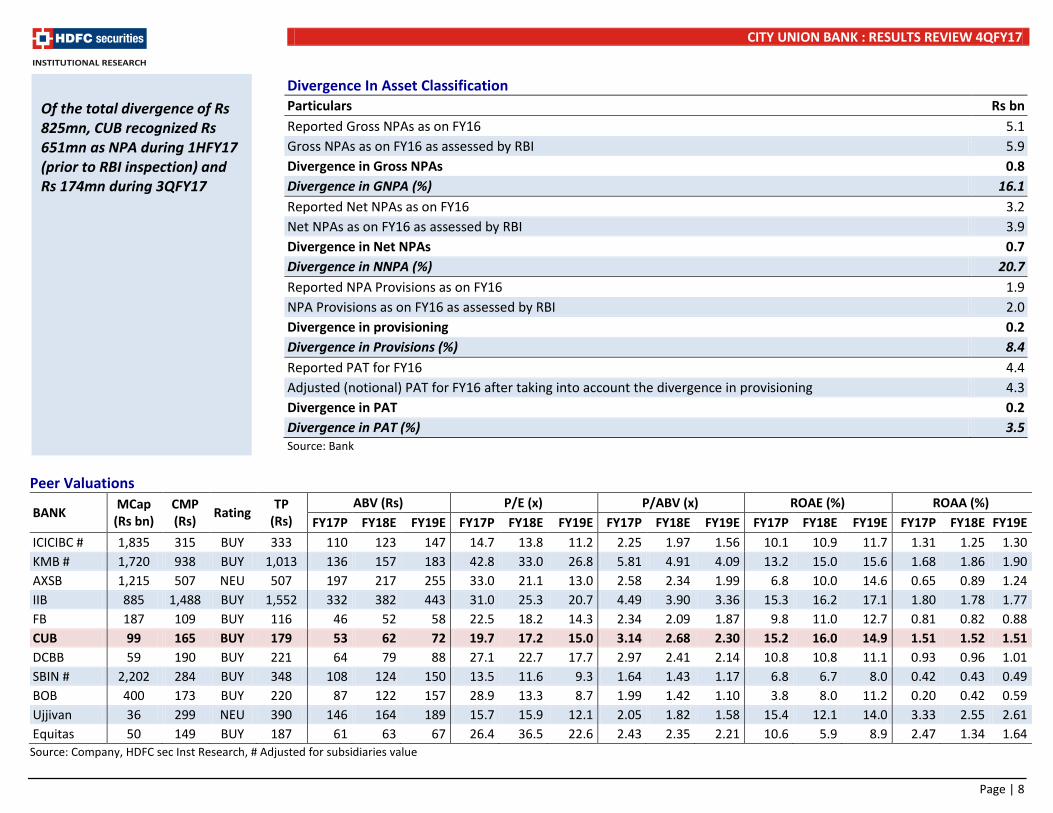
Divergence In Asset Classification Particulars Rs bn Reported Gross NPAs as on FY16 5.1 Gross NPAs as on FY16 as assessed by RBI 5.9 Divergence in Gross NPAs 0.8 Divergence in GNPA (%) 16.1 Reported Net NPAs as on FY16 3.2 Net NPAs as on FY16 as assessed by RBI 3.9 Divergence in Net NPAs 0.7 Divergence in NNPA (%) 20.7 Reported NPA Provisions as on FY16 1.9 NPA Provisions as on FY16 as assessed by RBI 2.0 Divergence in provisioning 0.2 Divergence in Provisions (%) 8.4 Reported PAT for FY16 4.4 Adjusted (notional) PAT for FY16 after taking into account the divergence in provisioning 4.3 Divergence in PAT 0.2 Divergence in PAT (%) 3.5 Source: Bank
Peer Valuations
BANK MCap
(Rs bn) CMP (Rs)
Rating TP
(Rs) ABV (Rs) P/E (x) P/ABV (x) ROAE (%) ROAA (%)
FY17P FY18E FY19E FY17P FY18E FY19E FY17P FY18E FY19E FY17P FY18E FY19E FY17P FY18E FY19E ICICIBC # 1,835 315 BUY 333 110 123 147 14.7 13.8 11.2 2.25 1.97 1.56 10.1 10.9 11.7 1.31 1.25 1.30 KMB # 1,720 938 BUY 1,013 136 157 183 42.8 33.0 26.8 5.81 4.91 4.09 13.2 15.0 15.6 1.68 1.86 1.90 AXSB 1,215 507 NEU 507 197 217 255 33.0 21.1 13.0 2.58 2.34 1.99 6.8 10.0 14.6 0.65 0.89 1.24 IIB 885 1,488 BUY 1,552 332 382 443 31.0 25.3 20.7 4.49 3.90 3.36 15.3 16.2 17.1 1.80 1.78 1.77 FB 187 109 BUY 116 46 52 58 22.5 18.2 14.3 2.34 2.09 1.87 9.8 11.0 12.7 0.81 0.82 0.88 CUB 99 165 BUY 179 53 62 72 19.7 17.2 15.0 3.14 2.68 2.30 15.2 16.0 14.9 1.51 1.52 1.51 DCBB 59 190 BUY 221 64 79 88 27.1 22.7 17.7 2.97 2.41 2.14 10.8 10.8 11.1 0.93 0.96 1.01 SBIN # 2,202 284 BUY 348 108 124 150 13.5 11.6 9.3 1.64 1.43 1.17 6.8 6.7 8.0 0.42 0.43 0.49 BOB 400 173 BUY 220 87 122 157 28.9 13.3 8.7 1.99 1.42 1.10 3.8 8.0 11.2 0.20 0.42 0.59 Ujjivan 36 299 NEU 390 146 164 189 15.7 15.9 12.1 2.05 1.82 1.58 15.4 12.1 14.0 3.33 2.55 2.61 Equitas 50 149 BUY 187 61 63 67 26.4 36.5 22.6 2.43 2.35 2.21 10.6 5.9 8.9 2.47 1.34 1.64
Source: Company, HDFC sec Inst Research, # Adjusted for subsidiaries value
Of the total divergence of Rs 825mn, CUB recognized Rs 651mn as NPA during 1HFY17 (prior to RBI inspection) and Rs 174mn during 3QFY17
Page | 8
CITY UNION BANK : RESULTS REVIEW 4QFY17
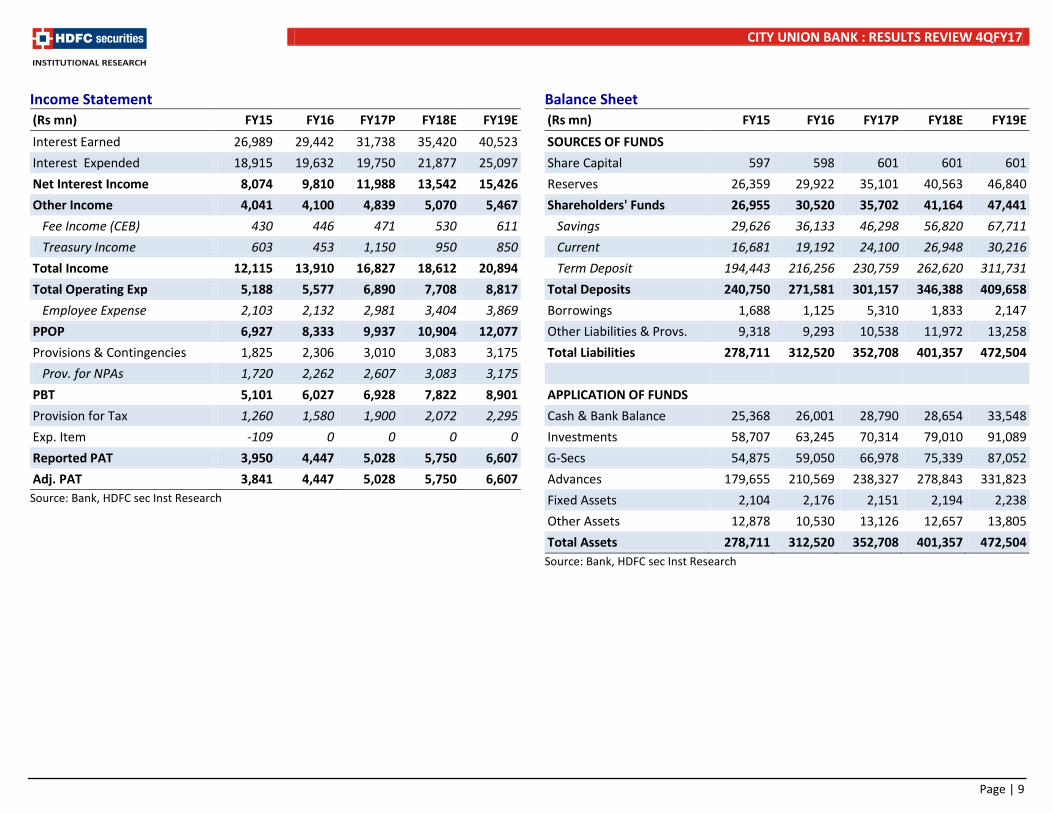
Income Statement (Rs mn) FY15 FY16 FY17P FY18E FY19E
Interest Earned 26,989 29,442 31,738 35,420 40,523
Interest Expended 18,915 19,632 19,750 21,877 25,097
Net Interest Income 8,074 9,810 11,988 13,542 15,426
Other Income 4,041 4,100 4,839 5,070 5,467
Fee Income (CEB) 430 446 471 530 611
Treasury Income 603 453 1,150 950 850
Total Income 12,115 13,910 16,827 18,612 20,894
Total Operating Exp 5,188 5,577 6,890 7,708 8,817
Employee Expense 2,103 2,132 2,981 3,404 3,869
PPOP 6,927 8,333 9,937 10,904 12,077
Provisions & Contingencies 1,825 2,306 3,010 3,083 3,175
Prov. for NPAs 1,720 2,262 2,607 3,083 3,175
PBT 5,101 6,027 6,928 7,822 8,901
Provision for Tax 1,260 1,580 1,900 2,072 2,295
Exp. Item -109 0 0 0 0
Reported PAT 3,950 4,447 5,028 5,750 6,607
Adj. PAT 3,841 4,447 5,028 5,750 6,607 Source: Bank, HDFC sec Inst Research
Balance Sheet (Rs mn) FY15 FY16 FY17P FY18E FY19E
SOURCES OF FUNDS
Share Capital 597 598 601 601 601
Reserves 26,359 29,922 35,101 40,563 46,840
Shareholders' Funds 26,955 30,520 35,702 41,164 47,441
Savings 29,626 36,133 46,298 56,820 67,711
Current 16,681 19,192 24,100 26,948 30,216
Term Deposit 194,443 216,256 230,759 262,620 311,731
Total Deposits 240,750 271,581 301,157 346,388 409,658
Borrowings 1,688 1,125 5,310 1,833 2,147
Other Liabilities & Provs. 9,318 9,293 10,538 11,972 13,258
Total Liabilities 278,711 312,520 352,708 401,357 472,504
APPLICATION OF FUNDS
Cash & Bank Balance 25,368 26,001 28,790 28,654 33,548
Investments 58,707 63,245 70,314 79,010 91,089
G-Secs 54,875 59,050 66,978 75,339 87,052
Advances 179,655 210,569 238,327 278,843 331,823
Fixed Assets 2,104 2,176 2,151 2,194 2,238
Other Assets 12,878 10,530 13,126 12,657 13,805
Total Assets 278,711 312,520 352,708 401,357 472,504 Source: Bank, HDFC sec Inst Research
Page | 9

CITY UNION BANK : RESULTS REVIEW 4QFY17
Key Ratios
FY15 FY16 FY17P FY18E FY19E
VALUATION RATIOS
EPS (Rs) 6.6 7.4 8.4 9.6 11.0
Earnings Growth (%) 13.8 12.6 13.1 14.4 14.9
BVPS (Rs) 45.2 51.0 59.4 68.5 78.9
Adj. BVPS (Rs) 41.3 45.6 52.6 61.5 71.6
ROAA (%) 1.49 1.50 1.51 1.52 1.51
ROAE (%) 16.7 15.5 15.2 15.0 14.9
P/E (x) 24.9 22.2 19.7 17.2 15.0
P/ABV (x) 4.00 3.62 3.14 2.68 2.30
P/PPOP (x) 14.2 11.8 10.0 9.1 8.2
Dividend Yield (%) 0.7 0.7 0.2 0.3 0.3
PROFITABILITY
Yield On Advances (%) 12.7 12.1 11.5 11.2 11.0
Yield On Investment (%) 8.3 8.9 8.1 7.9 7.6
Cost Of Funds (%) 8.1 7.6 6.8 6.7 6.6
Cost of Deposits (%) 8.0 7.5 6.8 6.6 6.5
Core Spread (%) 4.6 4.5 4.7 4.6 4.4
NIM (%) 3.34 3.65 3.94 3.89 3.79
OPERATING EFFICIENCY
Cost/Avg. Asset Ratio (%) 2.0 1.9 2.1 2.0 2.0
Cost-Income Ratio (Excl Treasury) 45.1 41.4 43.9 43.6 44.0
BALANCE SHEET STRUCTURE
Loan Growth (%) 11.6 17.2 13.2 17.0 19.0
Deposit Growth (%) 9.3 12.8 10.9 15.0 18.3
C/D Ratio (%) 74.6 77.5 79.1 80.5 81.0
Equity/Assets (%) 9.7 9.8 10.1 10.3 10.0
Equity/Advances (%) 15.0 14.5 15.0 14.8 14.3
CASA (%) 19.2 20.4 23.4 24.2 23.9
Capital Adequacy Ratio (CAR, %) 16.5 15.6 15.8 15.5 15.2
W/w Tier I CAR (%) 16.0 15.1 15.4 15.1 14.9
FY15 FY16 FY17P FY18E FY19E
ASSET QUALITY
Gross NPLs (Rsm) 3,358 5,120 6,820 7,700 8,144
Net NPLs (Rsm) 2,328 3,232 4,083 4,176 4,389
Gross NPLs (%) 1.86 2.41 2.83 2.73 2.43
Net NPLs (%) 1.30 1.53 1.71 1.50 1.32
Slippages (%) 2.50 2.20 2.14 1.90 1.70
Coverage Ratio (%) 58.0 60.0 61.0 66.0 67.4
Provision/Avg. Loans (%) 0.97 1.05 1.12 1.15 1.00
ROAA TREE
Net Interest Income 3.05% 3.32% 3.60% 3.59% 3.53%
Non-interest Income 1.53% 1.39% 1.45% 1.34% 1.25%
Treasury Income 0.23% 0.15% 0.35% 0.25% 0.19%
Operating Cost 1.96% 1.89% 2.07% 2.04% 2.02%
Provisions 0.69% 0.78% 0.90% 0.82% 0.73%
Provisions For NPAs 0.62% 0.69% 0.76% 0.79% 0.70%
Tax 0.48% 0.53% 0.57% 0.55% 0.53%
ROAA 1.45% 1.50% 1.51% 1.52% 1.51%
Leverage (x) 11.2 10.3 10.0 9.8 9.9
ROAE 16.3% 15.5% 15.2% 15.0% 14.9% Source: Bank, HDFC sec Inst Research
Page | 10

CITY UNION BANK : RESULTS REVIEW 4QFY17
RECOMMENDATION HISTORY
Rating Definitions BUY : Where the stock is expected to deliver more than 10% returns over the next 12 month period NEUTRAL : Where the stock is expected to deliver (-)10% to 10% returns over the next 12 month period SELL : Where the stock is expected to deliver less than (-)10% returns over the next 12 month period
Date CMP Reco Target 24-May-16 103 BUY 120
8-Jul-16 122 BUY 132 11-Nov-16 151 BUY 163 9-Feb-17 157 BUY 175
30-May-17 165 BUY 179
70
90
110
130
150
170
May
-16
Jun-
16
Jul-1
6
Aug
-16
Sep-
16
Oct
-16
Nov
-16
Dec
-16
Jan-
17
Feb-
17
Mar
-17
Apr
-17
May
-17
City Union Bank TP
Page | 11
CITY UNION BANK : RESULTS REVIEW 4QFY17
Disclosure: We, Darpin Shah, MBA & Pranav Gupta, ACA, authors and the names subscribed to this report, hereby certify that all of the views expressed in this research report accurately reflect our views about the subject issuer(s) or securities. HSL has no material adverse disciplinary history as on the date of publication of this report. We also certify that no part of our compensation was, is, or will be directly or indirectly related to the specific recommendation(s) or view(s) in this report. Research Analyst or his/her relative or HDFC Securities Ltd. does not have any financial interest in the subject company. Also Research Analyst or his relative or HDFC Securities Ltd. or its Associate may have beneficial ownership of 1% or more in the subject company at the end of the month immediately preceding the date of publication of the Research Report. Further Research Analyst or his relative or HDFC Securities Ltd. or its associate does not have any material conflict of interest. Any holding in stock –No HDFC Securities Limited (HSL) is a SEBI Registered Research Analyst having registration no. INH000002475. Disclaimer: This report has been prepared by HDFC Securities Ltd and is meant for sole use by the recipient and not for circulation. The information and opinions contained herein have been compiled or arrived at, based upon information obtained in good faith from sources believed to be reliable. Such information has not been independently verified and no guaranty, representation of warranty, express or implied, is made as to its accuracy, completeness or correctness. All such information and opinions are subject to change without notice. This document is for information purposes only. Descriptions of any company or companies or their securities mentioned herein are not intended to be complete and this document is not, and should not be construed as an offer or solicitation of an offer, to buy or sell any securities or other financial instruments. This report is not directed to, or intended for display, downloading, printing, reproducing or for distribution to or use by, any person or entity who is a citizen or resident or located in any locality, state, country or other jurisdiction where such distribution, publication, reproduction, availability or use would be contrary to law or regulation or what would subject HSL or its affiliates to any registration or licensing requirement within such jurisdiction. If this report is inadvertently send or has reached any individual in such country, especially, USA, the same may be ignored and brought to the attention of the sender. This document may not be reproduced, distributed or published for any purposes without prior written approval of HSL. Foreign currencies denominated securities, wherever mentioned, are subject to exchange rate fluctuations, which could have an adverse effect on their value or price, or the income derived from them. In addition, investors in securities such as ADRs, the values of which are influenced by foreign currencies effectively assume currency risk. It should not be considered to be taken as an offer to sell or a solicitation to buy any security. HSL may from time to time solicit from, or perform broking, or other services for, any company mentioned in this mail and/or its attachments. HSL and its affiliated company(ies), their directors and employees may; (a) from time to time, have a long or short position in, and buy or sell the securities of the company(ies) mentioned herein or (b) be engaged in any other transaction involving such securities and earn brokerage or other compensation or act as a market maker in the financial instruments of the company(ies) discussed herein or act as an advisor or lender/borrower to such company(ies) or may have any other potential conflict of interests with respect to any recommendation and other related information and opinions. HSL, its directors, analysts or employees do not take any responsibility, financial or otherwise, of the losses or the damages sustained due to the investments made or any action taken on basis of this report, including but not restricted to, fluctuation in the prices of shares and bonds, changes in the currency rates, diminution in the NAVs, reduction in the dividend or income, etc. HSL and other group companies, its directors, associates, employees may have various positions in any of the stocks, securities and financial instruments dealt in the report, or may make sell or purchase or other deals in these securities from time to time or may deal in other securities of the companies / organizations described in this report. HSL or its associates might have managed or co-managed public offering of securities for the subject company or might have been mandated by the subject company for any other assignment in the past twelve months. HSL or its associates might have received any compensation from the companies mentioned in the report during the period preceding twelve months from t date of this report for services in respect of managing or co-managing public offerings, corporate finance, investment banking or merchant banking, brokerage services or other advisory service in a merger or specific transaction in the normal course of business. HSL or its analysts did not receive any compensation or other benefits from the companies mentioned in the report or third party in connection with preparation of the research report. Accordingly, neither HSL nor Research Analysts have any material conflict of interest at the time of publication of this report. Compensation of our Research Analysts is not based on any specific merchant banking, investment banking or brokerage service transactions. HSL may have issued other reports that are inconsistent with and reach different conclusion from the information presented in this report. Research entity has not been engaged in market making activity for the subject company. Research analyst has not served as an officer, director or employee of the subject company. We have not received any compensation/benefits from the subject company or third party in connection with the Research Report. HDFC securities Limited, I Think Techno Campus, Building - B, "Alpha", Office Floor 8, Near Kanjurmarg Station, Opp. Crompton Greaves, Kanjurmarg (East), Mumbai 400 042 Phone: (022) 3075 3400 Fax: (022) 2496 5066 Compliance Officer: Binkle R. Oza Email: [email protected] Phone: (022) 3045 3600 HDFC Securities Limited, SEBI Reg. No.: NSE-INB/F/E 231109431, BSE-INB/F 011109437, AMFI Reg. No. ARN: 13549, PFRDA Reg. No. POP: 04102015, IRDA Corporate Agent License No.: HDF 2806925/HDF C000222657, SEBI Research Analyst Reg. No.: INH000002475, CIN - U67120MH2000PLC152193 Mutual Funds Investments are subject to market risk. Please read the offer and scheme related documents carefully before investing.
Page | 12
CITY UNION BANK : RESULTS REVIEW 4QFY17
HDFC securities Institutional Equities Unit No. 1602, 16th Floor, Tower A, Peninsula Business Park, Senapati Bapat Marg, Lower Parel, Mumbai - 400 013 Board : +91-22-6171 7330 www.hdfcsec.com
Page | 13