Business Viability assessment study of small holder dairy ... · PDF fileBusiness Viability...
52
Business Viability assessment study of small holder dairy farming in Zambia Patrick Kawambwa 2 , Guido Hendriksen 2 , Emelly Zandonda 1 and Libati Wanga 1 1 Mulungushi University and 2 Wageningen UR This research was (partly) funded by MUSIKA, Dairy Association of Zambia, Agri-Profocus, SNV Zambia, Mulungushi University, Alterra Wageningen-UR and NUFFIC Alterra Wageningen UR Wageningen, August 2014 Alterra report ISSN 1566-7197
Transcript of Business Viability assessment study of small holder dairy ... · PDF fileBusiness Viability...

Business Viability assessment study of small holder dairy farming in Zambia
Patrick Kawambwa2, Guido Hendriksen2, Emelly Zandonda1 and Libati Wanga1 1Mulungushi University and 2Wageningen UR
This research was (partly) funded by MUSIKA, Dairy Association of Zambia, Agri-Profocus, SNV Zambia,
Mulungushi University, Alterra Wageningen-UR and NUFFIC
Alterra Wageningen UR
Wageningen, August 2014
Alterra report
ISSN 1566-7197

Patrick Kawambwa2, Guido Hendriksen2, Emelly Zandonda1 and Libati Wanga1, 2014. Business
Viability assessment study of small holder dairy farming in Zambia. Wageningen, Alterra
Wageningen UR (University & Research centre), Alterra report, 3 figures, 15 tables.
Abstract
Keywords: small holder dairy farming Zambia
The pdf file is free of charge and can be downloaded via the website
www.wageningenUR.nl/en/alterra (scroll down to Publications - Alterra reports). Alterra does not
deliver printed versions of the Alterra reports.
© 2014 Alterra (an institute under the auspices of the Stichting Dienst Landbouwkundig
Onderzoek), P.O. Box 47, 6700 AA Wageningen, The Netherlands, T +31 (0)317 48 07 00, E
[email protected], www.wageningenUR.nl/en/alterra. Alterra is part of Wageningen UR
(University & Research centre).
• Acquisition, duplication and transmission of this publication is permitted with clear
acknowledgement of the source.
• Acquisition, duplication and transmission is not permitted of any parts of this publication for
which the copyrights clearly rest with other parties and/or are reserved.
Alterra assumes no liability for any losses resulting from the use of the research results or
recommendations in this report.
Alterra report ISSN 1566-7197
Photo cover: Patrick Kawambwa

Contents
Preface 5
Summary 7
1 Introduction 9
2 Methodology 11
3 Results 16
4 Conclusions and recommendations 38
References 41
Annex 1. Questionaire 42
Annex 2. Calculations value share 47


Business Viability assessment study of small holder dairy farming in Zambia | 5
Preface
The dairy sector has been indicated as a key business opportunity for smallholders in Zambia. In
addition to providing a valuable source of regular income and nutrition to rural populations, it is a food
product that has growing interest among consumers, including the growing middleclass in Zambia, a
fairly urbanized country. Zambia has still a low average consumption of milk and milk products. The
potential to grow is therefore recognised. To better understand the bottlenecks and possibilities to
accellerate the development of the dairy sector is was therefore concluded by Agri-Pro-Focus and Musica
that a field survey among small holder dairy farmers could bring facts to the surface. This initiative was
welcomed by the Dairy Association of Zambia. To carry out the field survey the organizations used the
student exchange programme between Wageningen UR and Mulungushi University to implement the
field survey. We believe that this report on the field survey provides valuable information on the currrent
situation and the opportunities for the dairy smallholders in Zambia. It can inform individual
stakeholders to make better informed investment decisions.
Claire van der Kleij Agri-Hub coordinato Agri-Pro-Focus
Brian Kapotwe, Leader dairy group Agri-Pro-Focus

Acknowledgements The authors with to thank sincerely all who have provided support. Institutions involved include
Wageningen UR, especially Kees van ‘t Klooster and Gert van Dijk, Mulungushi University,
especially Moses Daura, while the Dairy Association of Zambia (DAZ) in the person of Victor
Ngandu provided assistance including a vehicle and several staff members of SNV Zambia,
especially Brian Kapotwe and Nchimunya Kasango provided contributions through technical advice
on design and execution of the scope of work for the study. Agri Pro Focus (APF) in the person of
Claire van der Kleij coordinated and managed the process of the study and APF provided a
matching grant. MUSIKA provided technical advice on design and execution of the scope of the
study through Dean Lihonde, Andrew Sinyangwe and Jonathan Mwewa and provided logistical
support. Also advice was received from C. Mumba and G.S. Pandey from School of Veterinary
Medicine of the University of Zambia (UNZA).

Business Viability assessment study of small holder dairy farming in Zambia | 7

Summary
A field survey and focussed group discussions have been carried in Zambia among 66 small scale dairy
farmers and their cooperatives to collect data on factors affecting the profitability of dairy farming in
Zambia. The dairy farmers were situated in the four provinces of Zambia along the line of rail (Southern,
Lusaka, Central and Copperbelt). The findings show that the small holder dairy chain is profitable and
can further contribute to economic growth and employment in Zambia. There is considerable scope
to increase this contribution. Most farmers currrently produce less than 10 l of milk per day.
Production levels are still low in general and drop another 30% in the dry season. No effective ways of
conserving high quality feed for the dry season are practiced, 70 % of farmers do not have pasture to
harvest feed for the dry season. Few young people are attracted to the sector, it is thought that
increasing profitability will make dairy production more attractive to the youth. Labour costs are a
substantial part of production costs. Efficiency of labour is therefore important. Ease of access to water
is relevant, as besides saving labour this would also increase production levels. Small scale dairy
farmers should develop ways and means to increase productivity. Better availability of inputs
would certainly help, as well as improvement in the delivery of milk, currently hampered by large
distances from farms to milk collection centres and very limited cooling capacity. More
collaboration with processors is also suggested as a way of increasing the total value of the dairy
chain and agree on fair and equitable distribution of revenues within the value chain. Some specific
suggestions for what could strengthen an enabling environment are also derived from the study:
Discourage export of maize bran, encourage local breeding stocks and work on better diets for the
dairy cows, especially during the dry season. Training of farmers to practice pasture production is
one way to improve profitability of the small scale dairy milk production. Extension offices, dairy
institutions together with the Dairy Association of Zambia can go into the field or visit famers on
their farms or at their cooperatives to enlighten them on the benefits of pasture growing. The
farmers can be trained on how and what type of pastures to grow for their dairy animals e.g.
Napier grass and on what size of land to grow the pasture as well as the management practices to
be carried out. These institutions should as well explain in detail to the farmer on how to harvest
and conserve the pasture for the dry period or dry season when food for the animals is minimal.
By doing so, the farmers will have costs on concentrates reduced, due to the availability of pasture
in the dry period. By growing the correct required pasture, animals will be provided with adequate
nutrition levels to continue producing high quality milk even in the dry period at higher volumes
than what is currently being produced. With reduced dependence on concentrates in the dry period
as well as presence of high quality pasture, as well as increased volume of milk produced, farm
incomes will rise. Pasture management requires labour, which can be in short supply. In such a
case, dairy farmers could organize themselves at cooperative level to have some mechanization to
reduce labour requirements. More local breeding of high grade dairy animals by commercial
farmers and/or more local entrepreneurs or cooperatives offering A.I. services would also be
beneficial for small scale farmers and reduce dependency on costly imports.
At the end of 2013 the government of Zambia has lifted the export ban on maize bran and now
allows maize farmers and millers to export their maize bran to the neighbouring countries.
However demand for maize bran is constantly on the rise and this had led to increase in price for
maize bran. The small scale farmer therefore tends to incur high costs on feeding his or her dairy
animals. Dairy Association of Zambia should discuss and agree with the government to reduce
drastically the amount of maize bran being exported to other countries. The government should
calculate the benefits of using maize bran for the local dairy industry as compared to export
earnings and subsequently stop commercial farmers from exporting maize bran and instead
encourage the local use of maize bran in the dairy sector.
Business Viability assessment study of small holder dairy farming in Zambia | 9
Currently Zambia dairy milk market has two major processors. This has led to local monopolies
and therefore tends to affect pricing of raw milk. The processors being small in number are able to
dictate what price they will purchase the raw milk from the farmer. Therefore, dairy association of
Zambia, Zambia national farmers union and the government (ministry of agriculture and livestock)
should seize the opportunity to encourage competition between processing firms. DAZ should
encourage cooperatives to engage into vertical integration where they are able to carry out
processing activities of raw milk, such as Choma and Mpima dairy cooperatives. This will help the
farmer sell his milk at a relatively better price than currently thereby increasing profitability of the
small scale dairy farmer. If there are good business plans for the cooperatives the economic
empowerment could fund dairy cooperatives to help them acquire the equipment to enable them
start adding value to the milk. Formal registration of women should be encouraged by DAZ. The
dairy value chain should encourage more women in the chain. Quality of milk and rearing young
calves will improve with more women in the sector. More transparency in the chain between
cooperatives and processors could be encouraged as the mutual benefits of increasing quantity
and quality of milk produced is recognized and an equitable distribution of these benefits within
the chain can be achieved. Initiatives of DAZ to boost the total value of the chain must be based
on transparency in the chain, allowing all players in the chain to benefit from this boost, including
farmers, cooperatives, processors and service providers. This would create more employment and
take farmers out of poverty.


Business Viability assessment study of small holder dairy farming in Zambia | 11
1 Introduction
1.1 Global dairy outlook
The dairy sector has come to be recognised as an important industry, especially in relation to rural
and peri-urban development. Dairy products provide high-quality protein and micronutrients
generally lacking in cereal-based diets but which are especially important for children and child-
bearing women. It has also been said that the dairy industry has the potential to create as many
as 200 jobs for every 1 million litres of milk produced and distributed annually (Mumba & Pandey,
2012)1.
At its core, the dairy industry’s perpetual drive to optimize production has led to a willingness to
adopt new technologies that enable more to be done with less. Farmers are producing more milk
per cow and dairy processors are increasing output and reducing operating costs. Due to a focus
on efficiency, the dairy industry has shown steady growth the past five years despite an economy
that has slowly recovered from a hard-hit decline. During this period the global compound annual
growth rate (CAGR) is 4.1% according to Global Industry Analysts.
Global sales of dairy products are forecast to pass the reach $500 billion per annum soon. . India,
US and China have in that order the world largest production. Parmalat, a major processor in
Zambia is since 2011 part of Lactalis, the number 3 dairy processor in the world. Two countries
with a large dairy cooperative are Netherlands and New Zealand. These cooperatives are also
among the top 5 dairy processors in this World.
Underlying reasons for the increasing global demand for dairy products and rising exports are:
• Population growth
• Popularity of dairy products
• Westernization of diets (to include more dairy)
• Broader array and appeal of dairy products
1.2 An Overview of the Dairy Sector in Africa
Substantial growth potential exists in Sub-Saharan Africa for expanding the dairy industry by
bringing the traditional cattle sector into the formal dairy system. In a country like Uganda, the
dairy sector contributes around 40-50 percent of the livestock Gross Domestic Product (GDP) and
17-19 percent of the overall agricultural GDP (DDA, 2002). Dairy is an important livelihood option,
1
Omore et al, 2004 says that for every 100 litres per day of milk collected, processed and marketed, up to four jobs are created both on and off the farm
site

especially for rural and peri-urban citizens, and can develop into a dynamic sector of the economy
(Staal et al, 2008).
In the case of Kenya, 55 percent of the milk produced enters the market, although around 75
percent of this is sold through informal channels (FAO, 2011). Milk-based enterprises are
attractive in Kenya, supporting more than 1.8 million smallholder households engaged in dairy
production.
1.2.2 Zambia’s Dairy Sector
Currently, over 80 percent of all raw milk (253 million litres per annum) produced in Zambia
comes from the traditional sector. In monetary terms, milk from the traditional sector is worth
over US$80 million per annum. The bulk of this milk (over 90 percent), however, does not reach
the formal market. As of 2008, only 84,000 tonnes of processed dairy products in Zambia came
out of the local dairy sector, compared to Zimbabwe’s 389,000 tonnes; South Africa’s 3.2 million
tonnes; and Kenya’s 4 million tonnes. Zambia therefore imports significant quantities of milk
powder that is processed to cover the deficits of pasteurised milk, estimated at 6 million USD/a
(Valeta, 2004).
Productivity within the Zambian traditional dairy sector is currently at 2 litres per cow per day.
Emergent farmers who also keep cross breeds produce between 12 and 15 litres, while commercial
producers are at between 17 and 24 litres.
Average milk production per cow in selected countries:
As can be seen from the table above the overall average of 8.2 litres is lower than Zimbabwe,
Botswana, Kenya and South Africa’s. Naturally, low productivity has implications on pricing.
Literature shows that Zambian pricing for raw milk per litre (about $0.60) is relatively high that of
Kenya ($0.30). South Africa is at $0.40 per litre. The price of milk in Zambia is influenced by a
number of factors, notably low production volumes to serve the urban demand. Zambia is blessed
with a relatively good transport system along the line of rail, where most of the dairy production
Country Average production in liter per cow
Botswana
Kenya
South Africa
Zambia
Zimbabwe
9.6
15.1
15.1
8.2
8.6

Business Viability assessment study of small holder dairy farming in Zambia | 13
and consumption in concentrated. Import of fresh milk is expensive and processors therefore
prefer local sourcing. A similar pattern emerges even for pricing of processed milk (ACF, 2012;
FAOSTATS, 2009; World Bank, 2011).
Transformation of the traditional dairy sector (through improved breeds, better animal
management and increased herds) seems to present greater scope for expansion (when compared
to the commercial sector) so as to meet the growing demand for milk, while at the same time also
improving rural livelihoods. With more than 20 million hectares of grazing land, Zambia has the
capacity (even with current animal management practices) to raise its cattle population from the
current 3 million herds to over 7 million. Kenya has 13.5 million animals on almost the same
grazing land size as Zambia, while Zimbabwe has 5.4 million herds of cattle on 12.1 million
hectares of grazing land.
Zambia’s annual per capita milk consumption stands between16.5 to 19.4 litres, compared to the
200 litres recommended by the World Health Organisation (WHO) and the Food and Agriculture
Organisation (FAO). In a recent study for East Africa it can be seen that although there are
variations in local situations, generally speaking the dairy sector is more developed in Kenya than
in some other countries (Makoni et al., 2014).
Although smallholder milk producers have increasingly organized themselves around dairy
cooperatives that manage milk collection centres (MCCs), most have restricted themselves to the
bulking, chilling and marketing of raw milk. Very few offer additional services to farmers such as
veterinary services, dairy equipment services, artificial insemination (AI), animal feed, training,
microfinance, and such other services that are often essential to enhancing productivity and,
subsequently, to the growth of the sector.
A recent consultative process within the Zambian dairy sector identified the following key issues:
i. Limited profitability in the sector for businesses/cooperatives, believed to be largely
linked to issues of productivity and capacity to negotiate pricing;
ii. Limited production volumes which affects opportunities linked to scale; and
iii. The need for increased investment into collection and processing facilities to stimulate
production and profitability.
Valeta (2004) argues that the current value chain relationship leans heavily in favour of milk
processors. While the producer price may not typically go beyond US$0.60 per litre, the processor
is able to sell posturized milk for more than US$1.60, giving them much bigger gross margins than
the farmer.
Mumba & Pandey (2012) point out that Zambia’s adoption rate of good animal husbandry practices
(under 35 percent) is still low. This they attribute to the poor provision of extension services as
well as expensive or unavailable veterinary drugs and vaccines. The country’s socialist history has
also left many farmers still believing that these products and services should be provided free of

charge by Government. Another barrier is the widely-held misconception that commercial milk
production can only be undertaken with exotic animal breeds. Yet, a substantial overall amount of
milk that is of even better quality (because of higher fat content) can be obtained from local
breeds than from foreign breeds. A combination of factors mentioned above have resulted into
continued low productivity and poor market linkages.
Advances in technology now make it possible to use the “Village Milk System” promoted by the
FAO. This is a safe low-cost, small scale milk pasteurisation mechanism that can be used by rural
milk producer groups. However, limited access to electricity, as well as poor state of roads have
major effects on the rate of establishment of MCCs in many rural parts of the country that have
high traditional cattle populations.
Not surprisingly, most MCCs that seem to be performing relatively better than others are found
along the main national transport network and especially around urban centres where basic
infrastructure is available. However, the increasing density of dairy units around the urban areas
may create new challenges, such as the risk of the spread of disease between herds. Zambia has
seen recent cases of e.g. Food and Mouth disease, Liver fluke, CBPP and Tick-borne diseases. This
is especially challenging due to the inability of Government Veterinary and Health Departments to
provide guidelines and enforce regulations.
At a regional level, the operationalisation of the Common Market for Eastern and Southern Africa
(COMESA) has opened Zambia to the threat of competition from the more efficient and productive
Kenyan and South African dairy farmers. Unless productivity issues are addressed, the Zambian
producers will in the long run inevitably succumb to such competition.
Prior studies of the Zambia dairy sector have highlighted the following as being key to moving past
the current state of affairs:
• Enhance commercial livestock breeding capacity;
• Better animal healthcare mechanisms;
• Improved feeding through appropriate supplementation;
• Greater access to, and use of, A.I. to improve smallholder cattle breeds; and
• Higher levels of entrepreneurship and commercial orientation amongst smallholder dairy
farmers.
Various other studies from across Africa indicate that the majority of smallholder dairy farmers
depend on a cooperative or self-help groups to bulk and market their milk. In several instances,
these marketing channels tend to operate more from a social perspective and with very little
commercial orientation. However in Zambia with its low dairy density and high transportation
costs, bulking of milk is an important means to reduce the transportation costs from smallholder to
processor. In some rural societies is more for status and subsistence purposes.
Business Viability assessment study of small holder dairy farming in Zambia | 15
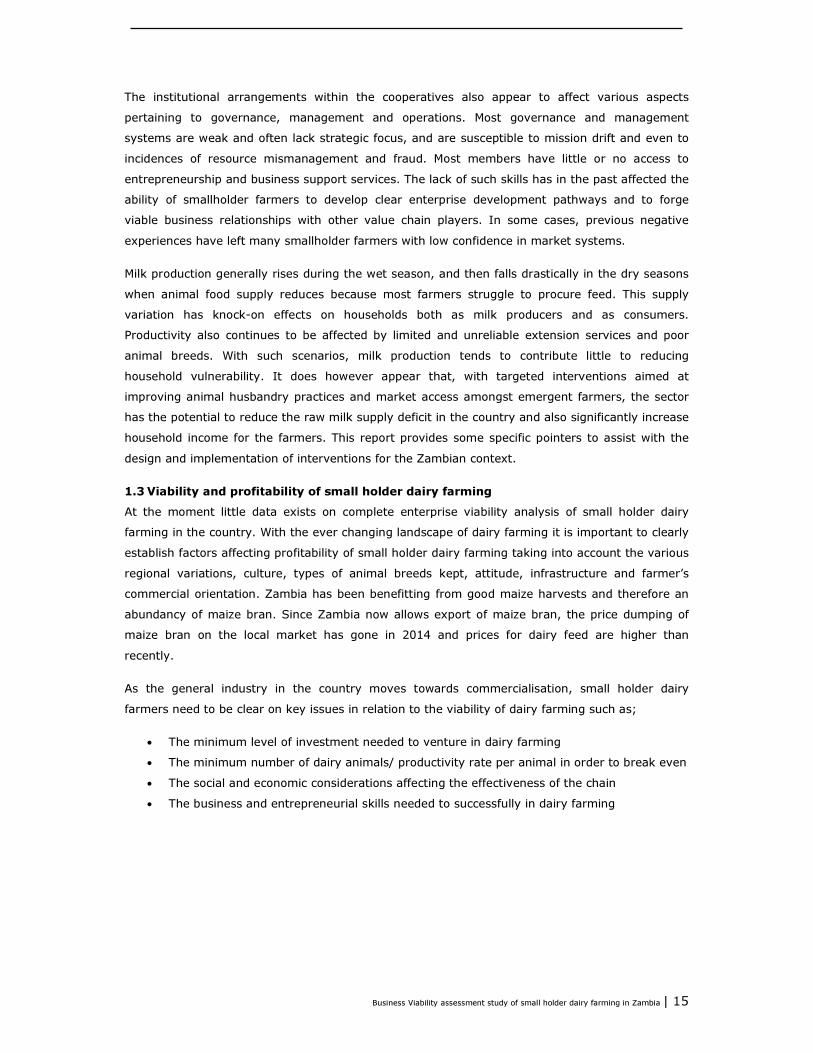
The institutional arrangements within the cooperatives also appear to affect various aspects
pertaining to governance, management and operations. Most governance and management
systems are weak and often lack strategic focus, and are susceptible to mission drift and even to
incidences of resource mismanagement and fraud. Most members have little or no access to
entrepreneurship and business support services. The lack of such skills has in the past affected the
ability of smallholder farmers to develop clear enterprise development pathways and to forge
viable business relationships with other value chain players. In some cases, previous negative
experiences have left many smallholder farmers with low confidence in market systems.
Milk production generally rises during the wet season, and then falls drastically in the dry seasons
when animal food supply reduces because most farmers struggle to procure feed. This supply
variation has knock-on effects on households both as milk producers and as consumers.
Productivity also continues to be affected by limited and unreliable extension services and poor
animal breeds. With such scenarios, milk production tends to contribute little to reducing
household vulnerability. It does however appear that, with targeted interventions aimed at
improving animal husbandry practices and market access amongst emergent farmers, the sector
has the potential to reduce the raw milk supply deficit in the country and also significantly increase
household income for the farmers. This report provides some specific pointers to assist with the
design and implementation of interventions for the Zambian context.
1.3 Viability and profitability of small holder dairy farming
At the moment little data exists on complete enterprise viability analysis of small holder dairy
farming in the country. With the ever changing landscape of dairy farming it is important to clearly
establish factors affecting profitability of small holder dairy farming taking into account the various
regional variations, culture, types of animal breeds kept, attitude, infrastructure and farmer’s
commercial orientation. Zambia has been benefitting from good maize harvests and therefore an
abundancy of maize bran. Since Zambia now allows export of maize bran, the price dumping of
maize bran on the local market has gone in 2014 and prices for dairy feed are higher than
recently.
As the general industry in the country moves towards commercialisation, small holder dairy
farmers need to be clear on key issues in relation to the viability of dairy farming such as;
• The minimum level of investment needed to venture in dairy farming
• The minimum number of dairy animals/ productivity rate per animal in order to break even
• The social and economic considerations affecting the effectiveness of the chain
• The business and entrepreneurial skills needed to successfully in dairy farming

2 Methodology
2.1 Objectives of the Study
2.1.1 Aim
This study aims at assessing the relative profitability of smallholder dairy farming and determining
the socio-economic factors affecting it. The purpose is to identify what the highest cost centres are
for dairy stakeholders and provide recommendations on how to lower the costs, improve price
setting to achieve increased economies of scale for a business.
2.1.2 The objectives are
1. To analyse the small holder dairy value chain in Zambia
2. To assess viability/profitability of small holder farming taking into account the following;
a. The cluster/regional variations in relative profitability.
b. The social economic factors
3. To provide recommendations on how to improve dairy farming.
2.1.3 Scope of Analysis
In order to ensure that a complete analysis of the factors around profitability are analysed, the
study looked the following aspects of the dairy enterprise.
• Production processes,
• The costs involved,
• Gross margins,
• Transportation,
• The minimum production levels needed to reach viable dairy production in Zambia,
In establishing the relative profitability of small holder dairy farming in Zambia, the study aimed to
establish the following;
• The cluster/ regional variations in relative profitability for small holder dairy farming
• Some social and economic factors that affect profitability
• Profitability at primarily the first stages of the value chain, namely (Production)
Based on a detailed context analysis further data has been collected on;
• Type of animal breeds kept by small holder farmers and their related gross margins
• Types of business services available to farmers and level of accessibility
• Comparative analysis of production potential versus actual production
• Comparative analysis of production and productivity for selected animal breeds
• Comparative analysis of average production costs per region
Most people use gross margin analysis to calculate profits of dairy at an individual farm level due
to the fact that it is the simplest and most practical method of assessing enterprise profitability
and it is widely used in farm management economics. However in complete enterprise costing
(PBA and CBA) the fixed costs are also allocated, unlike for gross margin analysis where only the
outputs and variable costs are allocated to individual enterprises. A database has been build that
also holds data for fixed costs. Required data have been collected or if no (accurate) numbers are
available data have been entered as estimates.

Business Viability assessment study of small holder dairy farming in Zambia | 17
Through this study, the research has properly effectively analysed profitability in the following
ways;
1. Analysis of costs and gross margins required to make profit through the formal
dairy market for individual farmers, cooperative (or milk collection centre) and
processors.
2. Formulation of recommendations for improvements to dairy stakeholders including
government.
2.2 Research Design
A cross-sectional survey design employing qualitative and quantitative data collection techniques
was used. The study sites included 7 districts from 4 provinces; namely Central Province (Kabwe
and Chibombo districts), Southern Province (Mazabuka, Namwala, Monze, and Choma districts),
Copperbelt Province (Luanshya district), and Lusaka Province (Chilanga and Lusaka districts).
2.2.1 Study Sample and Sampling Technique
The study had a target selection of 12 dairy cooperatives ( 6 in Southern 2 in Lusaka, 2 in
Central and 2 in Copperbelt Provinces) and individual farmers that were member of these
cooperatives. The study was done together with the Dairy Association of Zambia. The study was
conducted in two teams. One team collected data around Lusaka and North of Lusaka and the
second team collected data in Southern province.
Multi-stage sampling which included both purposive and random sampling was employed in this
study. Patton (1990) claims that: “The logic and power of purposive sampling lies in selecting
information-rich cases for an in-depth study. Information-rich cases are those from which one can
learn a great deal about issues of central importance to the research. In this study, information
rich cases were those farmers regularly delivering milk to milk collection centers (MCCs).
2.2.2 Data Collection Instruments
The study used triangulation in data collection through the use of interviews and reviewing of
documents. Silverman (2000) points out that triangulation in data collection involves the use of
two or more methods and can help to explain the richness and complexity of data. This avoids a
situation where research results are generated exclusively on one method (Patton, 1990;
Freebody, 2003). The assumption is that some of the methods have weaknesses and exclusive
reliance on one could bias or even distort the researcher’s work.
The collection of data was by the following methods which included
� Questionnaire: which had semi structured questions.

� Focused group discussion: The five members of the executive of twelve cooperatives were
interviewed.
� Individual interviews: Retailers and processors were also interviewed.
In total over 100 farmers have been interviewed in Southern Province. Analysis of the data was
done with the SPSS version 21. For the analysis 6 farmers per cooperative were randomly taken
for analyses from cooperatives in Southern Province, from the other cooperatives 5 farmers per
cooperative have been included in the data analyses, making a data set of 66 farms.
2.2.3 Area Covered
The areas and the cooperatives covered in the study are as follows:
� Southern Province, (Cooperative covered Niko, Namwala central, Magoye, Monze dairy,
Silwili and Choma dairy).
� Copper belt, (Fisenge and Mpatamatu).
� Central, (Chibombo and Mpima).
� Lusaka, (Mapepe and Palabana)

Business Viability assessment study of small holder dairy farming in Zambia | 19
3 Results
3.1 Analysis of small holder dairy value chain
In the analysis of the value chain for viability / profitability the following were taken into
consideration;
1. The environment in which the chain was operating,
2. The activeness of the stakeholders in the chain ,
3. The extent to which the farmers and cooperatives were involved,
4. The value share, and the challenges in the chain.
3.1.1 The small holder value chain
The small holder dairy value chain, excluding the informal sector, is represented below in figure 1,
where information flows are indicated the flows will go in both directions;
Functioning Actors Supporters
Retail
ing
Processing
collecting
Producing
Input
supplyingAgro input supplier
Farmers producing-±
7million/year
M74.6%.F25% Y 1.4%
Cooperatives MCC
collect ± 7million/year
Processor-Parmalat
7million litre/year
S/
Mark
et
30%
Groceri
es
10%
Vend
ors-
25%
Consuming Consumers consumers consumers
Publ
ic h
ealth
insp
etor
s
Zam
bia
Natio
nal F
arm
ers
Uni
on
Dairy
ass
ocia
tion
of Z
ambi
a
Dept
of V
eter
inar
y an
d De
partm
ent o
f Agr
icul
ture
Bank
s
Smallholder dairy value chain
Whosaling Wholesale
Information flow
K12.00
Sale
K9.79
Finances
Money flow
Information flow
Export 35-45%
Sale @K2.70
Sale K3.40
Sale K8.60
Figure 1. Dairy Value Chain in Zambia

3.1.2 Illustrations of the environment in which the chain is operating
The government has supported the dairy chain as it could be seen that most of the milk collection
centres (MCC) were constructed with support from government or NGO’s (approximately 80% of
MCC’s in survey) and later handed over to cooperatives. In addition government had put up a
number of Artificial insemination facilities in some milk collection centres, however we did not find
them functional in e.g. Chibombo and Mapepe.
For good dairy production the availability of good livestock feed is essential. However on-farm
production of livestock feed as well as availability on the market are both low. Maize bran has been
promoted as a livestock need, but currently its export is promoted, meaning less availability for
the dairy sector. Also the infrastructure for milk storage and transport with lack of cooling capacity
is a bottleneck in increasing the impact of the dairy sector on the economy, more rural
electrification or on-farm energy production would ease this issue. Smallholders using communal
land (53% of farmers in survey) and wishing to produce silage or other forms of livestock feed
would benefit from a more secure land tenure situation. A good finalized dairy development
strategy would also provide a stable policy environment that makes it easier for individuals to
invest in the dairy sector and get access to credit. Presently the Country is finalizing its livestock
development policy while establishing the dairy Industry Development Board following the enactment of
the Dairy Industry Development Act of 2010 on 16 th April 2010. Zambia would be in a position to
have higher export earnings from the dairy sector when the volumes of local production would
grow substantially.
3.1.3 Stakeholders and their Functions in the Chain
a) Actors
The following actors where identified in the chain and there functions;
1. Agro input supplier: The agro input suppliers in the chain where the ones providing
the inputs such drugs, chemicals, dairy equipment and other necessary requirements
for the farmers. Quite a number of agro input suppliers are active in the major
agricultural production areas in Zambia. More suppliers importing high quality pre-
mixes would have a positive impact on the quality of livestock feed on the market.
2. Farmers: small holder dairy farmers were very active in the chain as they were the
ones involved producing milk which they sold to their cooperatives. They kept the
chain running as they were the producers of the raw material (Milk).
3. Processors: The chain had two major processors, Parmalat and Zam-milk. These
processor were responsible to adding value to the milk collected from the cooperative.
The processors also provided the incomes to the farmers in their monthly payments as
they were buying milk from the farmers.
4. Retailer. The retailers included the following, Supermarkets, Groceries and vendors
who were responsible in selling the milk and dairy products to the consumers.

Business Viability assessment study of small holder dairy farming in Zambia | 21
b) Supporters
The supporters in the chain and their functions were as follows;
1. Banks; Zambia national Commercial Bank, ZANACO is one of the banks which is
providing loans in form of Heifers. The bank is very active but the interest rates are
very high. This is deterring most of the farmers to get the loans as they have no
security. The condition of giving farmers who have at least one or more cows before is
also preventing the new entrants without animals from accessing the loans. No
evidence was found that farmers within cooperatives would borrow each other money
as a means to widen availability of funds for investments and reduce interest rates.
2. Extension Services; The veterinary and agricultural extension are involved in the
provision of veterinary services to the farmers. But from the focused group discussion
it was found out that there was inadequate veterinary staff on the ground. Due to this
farmers faced a challenge of high disease incidences. The officers were trained in
animal health management and had little know how specifically in dairy management.
This also led to farmers having inadequate knowledge in dairy management as the
veterinary and agricultural extension officers were biased to their field. Cooperatives
could also actively organize sharing best practices between members to increase skills
of members.
3. Dairy Association of Zambia; The Dairy Association of Zambia (DAZ) was very active
in the chain supporting farmers and processors. DAZ was linking farmers to input
suppliers, capacity building of the farmers in dairy management and helping in
importing the breeding stock for the farmers.
4. Zambia National farmers’ union; The union acts as an interface between farmers and
government in lobbying for the improvement of policies that could favour the dairy
farmers and working hand in hand with DAZ to find ways of improving the conditions
of the farmer. Some suggestions are given under the recommendations in this report.
5. Public Health Inspectors; The Public health inspectors were responsible for the
monitoring of the hygienic standards in the chain and ensuring that the premises are
kept to standard. More transparent pricing for milk grades and cooperatives informing
members on the importance of hygienic standards would also help in increasing
hygiene.
3.1.4 Extent to which farmers and cooperatives are involved in the chain
Of course farmers and cooperatives are part of the chain. However their influence is limited, even
though they provide 70% of fresh milk from smallholders. An example to this effect was on the
price determination of milk, that is basically dictated by the processors. The possibilities for
farmers to translate high input costs in better prices are very limited. To be efficient in production
is about the only for many farmers to make sure they generate a positive income. The price was
determined by the processor and this price was passed on to the farmers. The processor had
control over the chain including the cooperative. DAZ could only lobby to adjust for a better price.

If the processor was not willing to adjust, the price remained the same. The processors provide an
incentive for milk quality as the price level between the 3 different grade of milk quality (based on
cell count) is 20 ngwee per grade. This helps in stimulating quality of milk and therefore the
possibility for the processor to add more value to the milk by producing higher value products.
This study is based on data collected from members of cooperatives. Some smallholder dairy
producers are not members of cooperatives, but 70% of the marketed milk from smallholders is
produced by members of cooperatives. It can be assumed that these farmers have even less
influence in the dairy sector. It can be expected that the influence of smallholders will be fairly
limited until they organize the processing and marketing of dairy themselves through their
cooperatives.
Challenges in the chain:
a) Governance , Information flow and Transparency in the chain
DAZ was currently actively disseminating information in the chain and actively linking cooperatives
to input suppliers. Good transparancy in the chain is important to maximize total value of the
chain and get an equitable distribution of the benefits. The processors are also members of DAZ
but do not provide information on processing costs of milk. The processors are not perceived as
transparent in their dealings to the cooperatives or farmers.
b) Few competing processors
Currently the power dynamics and control of the chain is all in the hands of the processor as he
determines the key factors of the chain like prices. The processor only consults the shareholders in
determining the price and not farmers. There is need to involve the farmers’ association DAZ in
determining the price and the two should come up with a model on how prices should be
determined in future. The chain was facing a challenge of having limited processors as the sector
was relatively small. Some farmers asked said that some of the current processors were showing
some monopolistic tendencies in certain areas. The data gathered from focussed group discussions
with cooperative executives indicated that new processors who came into the chain had problems
such as;
No capacity to collect all the milk produced by farmers at milk collection centres and payments by
the new processors were erratic.
The best way to increase competition between processors is to increase the total value of the dairy
chain. In this way it is possible to raise profits for processors, while at the same time increase the
profits for the farmers. To achieve this it is necessary to increase quantity of milk (lower
transportation costs, higher volumes) as well as quality of the milk (enabling production of high
value products like cheese). Then it is attractive for processors, and attractive for new processors
to entere the market. Alternative scenarios for cooperatives include start processing and marketing
themselves. This will not be easy because it requires investments, good management and the risks
increase. Of course this would need careful business planning where a transition phase with part of

Business Viability assessment study of small holder dairy farming in Zambia | 23
the milk sold to processors and part of the milk processed by the cooperative (based on own
marketing possibilities) is likely. Cooperatives could build capital for such investments by
withholding a certain fraction of the milk price. This would mean sacrificing some short term
income for the members in exchange for long term profitability, and it may be difficult to reach
consensus between members as their short-term needs might be high. On the other hand there
are plenty examples around the world whereby small scale dairy farmers escaped the poverty trap
by taking this route, e.g. in the Netherlands one dairy cooperative is now among the top five dairy
processors in the world, bringing strong revenues to its members.
3.2 Viability of small holder dairy farming
Factors affecting Profitability
a) Lactation Length
The lactation length had a serious effect on the profitability of the chain. When the lactation length
is short then the farmers will lose some profits from lack of production of milk.
In southern region i.e. Southern Province only 22% of the dairy cows had a lactation length of
between 251 and 300 days, while 21% in the Copperbelt, Central and Lusaka had same range of
lactation length of between 251 and 300 days. According to Adams et al (2009) under feeding of
cows especially in terms of energy or an imbalanced ration was a major cause of short lactation
length and excessive drops in milk generally accompanying this. This short lactation length was a
result of poor nutrition as most farmers in the chain depended on use of high quantities
concentrates and maize stover as major source of feeds. Figure 2 shows how varying the lactation
length are. The lactation length had severe effects on the profitability of the dairy industry. The
farmers with short lactation length were losing money as the animal dried up quickly. In some
cases animals where drying up within 150days.

Figure 2. Distribution of lactation length in survey.
b) Milk yield
The milk yields are given in table 1. While the milk yields did not show a difference
between the various provinces and cooperatives in the rain season, there was a marked difference
among provinces and cooperatives in milk yield in the dry season. In drier areas the milk yields in
the dry season are lower.
Rain Season
The analysis of the result showed that milk yield was as given in table 1 where the yields
are split over the two distinct seasons of Zambia, the rain season and the dry season, with a
distinct differences in grass availability, resulting in lower milk yields in the dry season
Table 1. Distribution of average milk yield in survey

Business Viability assessment study of small holder dairy farming in Zambia | 25
NUMBER OF
FARMERS
LITRES/DAY PERCENTAGE
32 ≤ 10 48.5%
16 11 -15 24.2%
13 16 -20 19.7%
5 ≥ 21 7.6%
Dry Season
NUMBER OF
FARMERS
LITRES/DAY PERCENTAGE
37 ≤ 7 56.1%
16 8 – 11 24.2%
4 12 – 14 6.1%
9 ≥ 15 13.6%
c) Number of milking animals
The average herd size for the whole covered area was as given in table 2:
Table 2. Average herd size of farmers in survey.
NUMBER OF MILKING ANIMALS PERCENTAGE OF FARMERS
3 – 5 53%
6 – 9 30.3%
10 – 13 9.1%
14 – 17 4.5%
>18 3%
Most of the farmers 53% had 3-5 milking animals. With the current economic situation and the
inflation farmers should be encouraged to have at least 10 or more milking animals to realise a
better profit and be able to expand. Having 3-5 anaimals will support the family but will not
enable the farmer to purchase the replacement stock which are expensive.
d) Maize bran
The export of maize bran by government had severe impact on the dairy industry as the remaining
maize bran was inadequate and becomes expensive because of high demand. This resulted in
pushing up the production costs of milk. According to Kasalo (2013) he urged government to
restrict the exports of maize bran to cushion the negative impact on the countries production of
dairy products. He further said that reducing export of maize bran would also cushion the price of
the commodity. The increase in the price of maize bran due to shortage has resulted in a higher
cost of dairy products. And according to ZNFU (2013) they state that there was uncontrolled and
unprecedented export of maize bran / molasses which had a negative bearing on domestic
livestock. Consequently in the last year the local price of bran increased to high levels.

This was evident from the cost of production calculated from the two regions. The cost of
production was quite high, as in southern province the production of a litre of milk was at K1.85
except for Niko and Namwala central who their production cost was around K1.30. This was
because they were not using any concentrates and were keeping local breeds. For the Northern
region which include Lusaka, Central and Copper belt the cost of production was also high and was
around K2.28 per litre.
e) Animal Feeding (Pasture and Concentrates)
Pasture and Concentrate usage; The use of crop residues, mostly maize stover, was highly
pronounced in the small holder dairy value chain, This caused a big difference in production costs
between the rain season and dry season: Animals producing 8 litres in the rainy season could
drop to 5.5 litre in the dry season representing a drop of 31 % . The drop was also attributed to
lack of quality feeds during this period.
According to Mohd et.al. (2013) dairy animals, because of their high requirement for a higher
plane of nutrition, need more of nutritious forage and will almost always require feed
supplementation. In view of this, high quality grasses and legumes are required for the
productivity of the animals. The findings in the survey showed that most of the small holder dairy
farmers where using maize stover whose nutritive value was very low and no supplementation of
any nature, but there was high use of concentrates not supported with nutritive grasses.
The analysis on the data collected on pasture growing shows that 46 farmer’s equivalent to 70%
where not growing pastures and 20 farmers equivalent 30 % where growing or buying pastures in
the chain. Tables 3 to 8 give some details.
For those growing pastures the land size used was as given in table 3:
Table 3. Land size used by farmers in survey.
NUMBER OF
FARMERS
SIZE OF LAND PERCENTAGE
15 ≥ 1Ha 23 %
3 2Ha 5 %
2 ≤ 4Ha 3 %
46 Not Growing 70 %
Table 3 shows that 23 % were growing ≥ 1Ha, 5 % were growing 2 Ha of pasture and 3% were
growing ≤ 4Ha. The major part of the farmers interviewed 70 % were not growing pastures, but
depended on crop residues and grazing animals on natural veldts or standing hay which was of
poor quality.
Table 4. Pasture yields of farmers in survey.
Pasture yield
NUMBER OF
FARMERS
YIELD PERCENTAGE
15 ≥ 2 tonnes 23 %
4 2.1 – 4 tonnes 6 %
1 4.1 – 5 tonnes 2 %
46 0 70 %

Business Viability assessment study of small holder dairy farming in Zambia | 27
Table 5. Types of pasture grown by farmers in survey
NUMBER OF
FARMERS
TYPE PERCENTAGE
3 Hay 5 %
11 Silage 17 %
2 Hay& silage 3 %
4 Other (such as: cow candy) 6 %
46 Not growing 70 %
Table 6. Costs of seeds for farmers in survey.
NUMBER OF
FARMERS
COST OF SEED(ZMW) PERCENTAGE
13 ≤ 1000 20 %
1 1001 – 2000 1 %
1 2001 – 3001 1 %
51 NOT SPENDING 77 %
Table 7. Costs of fertilizer for farmers in survey
NUMBER OF
FARMERS
COST OF FERTILIZER
(ZMW)
PERCENTAGE
2 ≤ 200 3 %
3 201 – 400 5 %
5 401 – 600 7 %
56 NOT SPENDNG 85 %
Table 8. Cash expenditures on weeding by farmers in survey.
NUMBER OF
FARMERS
COST OF WEEDING (ZMW) PERCENTAGE
6 ≤ 150 9 %
1 151 - 200 1 %
3 ≥ 201 4 %
56 NOT SPENDING 85 %
Use of concentrates
Several rough indicators, , i.e. a study from GART and information from DAZ, assume that
approximately 1 kg of concentrates is sufficient for cow grazing in the dry season to produce 2
litres of milk. This means that a cow who produce 10 Litres of milk per day, should then have
access to 5 kg of concentrates.
The findings on the small holder farm level shows that the 79% of the farmers use concentrates.
Because the members of the cooperatives from Namwala Centre and Niko (both traditional beef
animals) do not use any concentrate to feed the cow, we can say that out of the 10 other
cooperatives 96 % of the farmers use concentrates. 53% of the farmers purchases their
concentrates from agro-dealers and 26 % of the farmers use home-made concentrates. If in terms
of nutrient recycling more manure would be used to increase productivity of grass, this would also

have a positive impact on milk yields and less concentrates would be needed. However in Zambia
manure is not much used by small-scale farmers to fertilize their pastures.
The analysis on the usage of concentrates gave results as given in tables 9 and 10. There was no
signicifant difference in costs of concentrates per province.
Table 9. Concentrates used by farmers in survey.
NUMBER OF FARMERS TYPE OF CONCENTRATE PERCENTAGE
17 Homemade 26 %
35 Buying from Agro Dealers 53 %
14 Not Using 21 %
Table 10. Cash expenditures for purchase of concentrates by farmers in survey.
NUMBER OF FARMERS COST (ZMW) PERCENTAGE
34 ≤ 5000 51 %
1 5001 – 10000 1 %
31 NOT PURCHASING 47 %
f) Labour and Payments
The minimum wage in Zambia is 700 ZMW per month (source: wageindicator.org/Zambia).
The use of hired labour and family labour upon analysis of the data gave us table 11 and 12.
There was no difference in the use of family labour across provinces and cooperatives.
Table 11. Type of labour used by farmers in survey.
NUMBER OF FARMERS TYPE OF LABOUR PERCENTAGE
49 Family 74 %
13 Hired 20 %
4 Both 6 %
Table 12. Salaries paid by farmers in survey.
NUMBER OF
FARMERS
AMOUNT (ZMW) PERCENTAGE
33 ≤ 500 50 %
4 501 – 600 6 %
29 USING FAMILY LABOUR 44 %
From the analysis we can say that there are no farmers who meet the minimum wage for their
workers. This means that the farmers employ their workers in an informal way. We can conclude
that the price of labour is higher in Copperbelt and Central province compared with the price in
Southern province. Because of the high costs farmers have resorted to use of family labour.
g) Breeding/AI

Business Viability assessment study of small holder dairy farming in Zambia | 29
AI is important in improving the productivity of the local dairy animals. In the study it was found
out that in southern province only 22% were using AI and Northern region of the study only
35.1%were using AI. According to Madalane et.al. (1990) economic gains which can be accrued
from the choice of the breeding strategy and continuous F1 heifer replacement program may have
a sound economic basis particularly for low management farms and crossbreeding is the best
alternative for such animals. No data on animal weight have been recorded in this study. The
visual impression is that the domestic breeds are low in weight, and with good calf/heifer rearing
these weights and the production capacity of animals can be increased.
h) Gender in the chain
Sustainability of the chain can only be guaranteed when there is equity of participation. Rubin and
Manfre (2011) state that when women participate fully in agricultural value chain the qualtiy of
products is improved. They further stated that women contribute time, energy, creativity and
knowledge to production, processing and marketing. These inherent characteristics are not
common in men. In the survey it was found that the participation of women was only 25% as
opposed to men who were at 73 % and the youth were at 1.4%.This is a serious scenario which
need urgent attention in the dairy value chain. For continuity and ensuring that the smallholder
dairy chain continues to flourish more women and the youth is needed.
The data collected from the focused group discussion showed the membership as in table 13:
Table 13. Membership distribution of cooperatives.
Membership in the Cooperatives
Dairy cooperative Name
Membership
Female Male Youth
Fisenge 109 2 9
Mpatamatu 10 20 8
Chibombo 12 14
Mpima 66 134
Palabana 26 71 10
Mapepe 23 34
Magoye 100 600
Monze 67 233
Siwili 14 128
Choma 30 50
Niko 5 75
Namwala central 22 66
Total 484 1427 27
Total in percentages 25% 73.6% 1.4%
Total amount of members 1938

Figure 3. Membership distribution of cooperatives in survey.
The result shows that the chain had more men i.e. 74 %, women 25% and youth 1%.
i) Land tenure
The results showed that farmers who had land on title and those who had traditional land where as
in table 14:
Table 14. Land tenure position of farmers in survey.
NUMBER OF FARMERS AMOUNT PAID PERCENTAGE OF FARMERS
28 ≥ ZMW1000 42 %
1 ZMW 1100 – 1500 1 %
37 TRADITIONAL LAND 57 %
From the analysis of the results it indicated that 53% of the dairy farmers where using traditional
land which restricted their freedom of practising the needed activities like growing pasture needed
for the animals. In traditional land there no freedom to have control over your land as neighbours
can easily encroach on your land. Farmers are always living with uncertainties as headmen can
decide to do anything with the land. Farmers are not free.
This therefore calls for farmers to start having title deeds on their land where they can have
freedom to practice what they have been taught without interference from the neighbours
j) Water sources
From the focused group discussions with cooperative member in Magoye, Niko and Namwala
central the farmers complained about the distance to the source of water for the animals. Animals

Business Viability assessment study of small holder dairy farming in Zambia | 31
had to walk about on average 5km per day to have accessto the source of water. This calls for
DAZ and government to help in sinking the boreholes for farmers to access clean water for the
animals in the nearby places as it contributed to farmers having less milk due to animals wasting
their energy in walking long distances to the river to get water and back.
k) Distance to Milk collection centre
In nearly all the focused group discussions the issue of distance to the milk collection centre came
up. Farmers were asking for ways in which milk quality can be maintained at farm level. The
request was for DAZ and Government (MAL) to source the solar coolers which farmers can buy.
This will enable them cool the milk at farm level before they deliver it to the milk collection centre.
The major complaint was that most of the milk dropped in grade due to high microbe
multiplication and this came as a result of distance to the MCC. The processors measure the grade
and a premium is paid for milk of better grade. Farmer on average are living 6 km from the milk
collection centres and due to high temperature milk goes bad before it reaches the collection
centres.
3.3 VALUE SHARE IN THE CHAIN
Information on value share in the chain is important for all stakeholders to know. In this research
processors could not release some information. Data in that part of the chain is therefore limited.
According to the Agricultural Consultative forum (2012), for a MCC to make a profit they need
increase the levels of production in their localities. Lack of data has made it difficult for the
Ministry of Agriculture and Livestock to plan and implement policies based on verified facts and
figures. However we have derived the information as in table 15:
Table 15. Value share in the chain
FORMULAE USED:
1. Gross Income = revenue – variable costs
2. Added Value = price received by actor – price paid by actor
3. Value Share = added value x 100/ final revenue
4. Gross Margin = gross income x 100/ final revenue
SELLING PRICES OF MILK:
1. Super markets K9.79 per liter
2. Grocery Stores K10.50 per liter
3. Vendors K12.00 per liter
4. Farmer to cooperative K2.70 per liter
5. Cooperative to Parmalat K3.40 per liter
6. Parmalat to retailers K8.60 per liter
VARIABLE COST PERCENTAGES:
1. Farmers 67% of revenue generated
2. Cooperatives 9% of revenue generated
3. Processor 40% of revenue generated (Assumption)
4. Supermarket 10% of revenue generated (Assumption)

5. Vendors 10% of revenue generated
6. Groceries 7% of revenue generated
VALUE SHARE TABLE, see annex 2 for the calculations:
3.3.1 MEASURES OF PROFITABILITY
The profitability level in the chain was measured using the gross margin and the break-even point.
The determinants in the calculation were based on milk yield in the rain season, dry season and
the variable costs. The variable costs included concentrates, labour, transport, drugs and breeding
costs (AI or Bull Hire). The processors in Zambia do not adjust their price for milk between
seasons to reflect the difference in scarcity of milk. This could be introduced by them as a
mechanism to enhance milk production in the dry season and thereby get a more even supply of
milk throughout the year.
Central Province, Lusaka Province and Copperbelt Province
1. Wet Season
Facts from data collected
Farmers are milking 5 animals on average
Lactation period is 7 months
Animals give 13 litres per animal per day
Selling price of milk to cooperative is K2.70
Farmers sell 1 bull calf @ K1000.00
CHAIN
ACTOR
VARIABLE
COSTS
REVENUE GROSS
INCOME
ADDED
VALUE
VALUE
SHARE
GROSS
MARGIN
Farmers K1.80 K2.70 K0.90 K2.70 28 % 33 %
Cooperatives K2.94 K3.40 K0.46 K0.70 7 % 14 %
Processor K4.76 K8.60 K3.84 K5.20 53 % 45 %
Supermarkets K9.46 K9.79 K0.33 K1.19 13 % 3 %

Business Viability assessment study of small holder dairy farming in Zambia | 33
Gross Income:
5 Animals x 13 litres x 210 days x K2.70 K36855.00
1 Bull calf @ K1000.00 K1000.00
Total K37855.00
Variable Costs:
Concentrates 0.5kg/l x 5 animals x 210 days x 13l x K2 K13650.00
2 Labour x K500 x 12 months K12000.00
Transport K140 x 7 months K980.00
Drugs K140 x 12 months K1680.00
Bull hire K25 x 5 animals K125.00
Concentrates (dry period) 60 days x 1kg x K2 K120.00
Total K28555.00
Gross Profit K9300.00
Cost of producing a litre of milk = K28555/ (5 x 13 x 210) = K2.10
Cost of production in % = 75 %
Gross profit in % = 25 %
2. Dry Season
Facts from data collected
Farmers are milking 5 animals on average
Lactation period is 7 months
Animals give 9.5 litres per animal per day
Selling price of milk to cooperative is K2.70
Farmers sell 1 bull calf @ K1000.00
Gross Income:
5 Animals x 9.5 litres x 210 days x K2.70 K26932.50
1 Bull calf @ K1000.00 K1000.00
Total K27932.50
Variable Costs:
Concentrates 0.5kg/l x 5 animals x 210 days x 9.5l x K2 K9975.00
2 Labour x K500 x 12 months K12000.00
Transport K140 x 7 months K980.00
Drugs K140 x 12 months K1680.00
Bull hire K25 x 5 animals K125.00
Concentrates (dry period) 60 days x 1kg x K2 K120.00
Total K24880.00
Gross Profit K3052.50
Cost of producing a litre of milk = K24880/ (5 x 9.5 x 210) = K2.50
Cost of production in % = 89 %
Gross profit in % = 11 %
Break-Even Point
Formula:
Fixed Costs Assumptions
Building @ K10 000 and 25 years life span (depreciation) K400
Maintenance of building @ 10% of cost K1000
Machinery (chuff cutter) @ K2000 and 10 years life span K200
Maintenance of chuff cutter @ 10% of cost K200
Animal investment @ 16% interest (7 x 12000 x 16%) K13 440

K15 240
Breakeven point = K 15,240 / (K 2.70 – K 2.28)= 36,300 litres
CENTRAL PROVINCE (ZAM MILK) with a different milk pricing
1. Wet Season
Facts from data collected
Farmers are milking 5 animals on average
Lactation period is 7 months
Animals give 13 litres per animal per day
Selling price of milk to cooperative is K2.50
Farmers sell 1 bull calf @ K1000.00
Gross Income:
5 Animals x 13 litres x 210 days x K2.50 K34125.00
1 Bull calf @ K1000.00 K1000.00
Total K35125
Variable Costs:
Concentrates 0.5kg/l x 5 animals x 210 days x 13l x K2 K13650.00
2 Labour x K500 x 12 months K12000.00
Transport K140 x 7 months K980.00
Drugs K140 x 12 months K1680.00
Bull hire K25 x 5 animals K125.00
Concentrates (dry period) 60 days x 1kg x K2 K120.00
Total K28555.00
Gross Profit K6570.00
Cost of producing a litre of milk = K28555/ (5 x 13 x 210) = K2.10
Cost of production in % = 81 %
Gross profit in % = 19 %
2. Dry Season
Facts from data collected
Farmers are milking 5 animals on average
Lactation period is 7 months
Animals give 9.5 litres per animal per day
Selling price of milk to cooperative is K2.50
Farmers sell 1 bull calf @ K1000.00
Gross Income:
5 Animals x 9.5 litres x 210 days x K2.50 K24937.50
1 Bull calf @ K1000.00 K1000.00
Total K25937.50
Variable Costs:
Concentrates 0.5kg/l x 5 animals x 210 days x 9.5l x K2 K9975.00
2 Labour x K500 x 12 months K12000.00
Transport K140 x 7 months K980.00
Drugs K140 x 12 months K1680.00
Bull hire K25 x 5 animals K125.00
Concentrates (dry period) 60 days x 1kg x K2 K120.00
Total K24880
Gross Profit K1057.50
Cost of producing a litre of milk = K24880/ (5 x 9.5 x 210) = K2.50
Cost of production in % = 96 %
Gross profit in % = 4%

Business Viability assessment study of small holder dairy farming in Zambia | 35
SOUTHERN PROVINCE:
1. Wet Season
Facts from data collected
Farmers are milking 7 animals on average
Lactation period is 7 months
Animals give 8 Litres per animal per day on average
Average Selling price of milk to cooperative is K2.70
The farmers sell 1 bull calf @ K1500.00 Average price
Gross Income:
7 Animals x 8 litres x 210 days x K2.70 K31 752.00
1 Bull calf sale @ K1500.00 K1500.00
Total K33 252.00
Variable costs:
2 Labour x K300 x 12 months K7200.00
Transport K140 x 7months x 1 K980.00
Drugs K140 x 12 months K1680.00
Concentrates 0.5kg/l x 8l x 7 lactating animals x 210 days x K2 K11760.00
Concentrates (dry period) 60 days x 1kg x K2 K120.00
Total K21740.00
Gross profit K11512.00
Cost of producing a litre of milk = 21740/ (7 x 8 x 210) = K1.85
Cost of production in % = production cost / price received x 100%
Gross profit in % = (price received – production cost) / price received x 100%
Cost of production % = 69 %
Gross profit in % = 31 %
2. Dry Season
Facts from data collected
Farmers are milking 7 animals on average
Lactation period is 7 months
Animals give 5.5 Litres per animal per day on average
Selling price of milk to cooperative is K2.70
The farmers sell 1 bull calf @ K1500.00
Gross Income:
7 Animals x 5.5 litres x 210 days x K2.70 K21 829.50
1 Bull calf sale @ K1500.00 K1500.00
Total K23 329.50
Variable costs:
2 Labour x K300 x 12 months K7200.00
Transport K140 x 7months x 1 K980.00
Drugs K140 x 12 months K1680.00
Concentrates 0.5kg/l x 5.5l x 7 lactating animals x 210 days x K2 K8085.00
Concentrates (dry period) 60 days x 1kg x K2 K120.00
Total K18 065.00
Gross profit K5 264.00
Cost of producing a litre of milk = 18 065/ (7 x 5.5 x 210) = K2.20
Cost of production % = 77 %

Gross profit in % = 23 %
Break-Even Point
Breakeven point = K 15,240 / (K 2.70 – K 2.02) = 22,400 litres
NIKO AND NAMWALA CENTRAL (Using traditional beef animals)
1. Wet Season
Facts from data collected
Farmers a milking 7 animals on average
Lactation period is 7 months
Animals give 3.5 litres of milk per animal per day on average
Selling price of milk to cooperative is K2.80
Farmers sell 1 bull calf @ K 1600.00
Gross Income:
7 Animals x 3.5 litres x 210 days x K2.80 K14406.00
1 Bull calf @ K1600.00 K1600.00
Total K16006.00
Variable Costs:
1 Labour x K300 x 12 months K3600.00
Transport K70 x 7 months K490.00
Drugs K140 x 12 months K1680.00
Total K5770.00
Gross profit K10236.00
Cost of producing a litre of milk = K5770/ (7 x 3.5 x 210) = K1.10
Cost of production % = 36%
Gross profit in % = 64%
2. Dry Season
Facts from data collected
Farmers a milking 7 animals on average
Lactation period is 7 months
Animals give 2.5 litres of milk per animal per day on average
Selling price of milk to cooperative is K2.80
Farmers sell 1 bull calf @ K 1600.00
Gross Income:
7 Animals x 2.5 litres x 210 days x K2.80 K10290.00
1 Bull calf @ K1600.00 K1600.00
Total K11890.00
Variable Costs:
1 Labour x K300 x 12 months K3600.00
Transport K70 x 7 months K490.00
Drugs K140 x 12 months K1680.00
Total K5770.00
Gross profit K6120.00
Cost of producing a litre of milk = K5770/ (7 x 2.5 x 210) = K1.60
Cost of production % = 47%
Gross profit in % = 53%

Business Viability assessment study of small holder dairy farming in Zambia | 37
3.4 SOCIAL ECONOMIC FACTORS AFFECTING PROFITABILITY IN THE CHAIN
1. Artificial Insemination: people being suspicious that AI brings animals of GMO nature.
2. The chain has more men than women; 73.6% men, 25% women and 1.4% youth.
3. Land used in most of small holder dairy is under tradition.
4. Women are capable but they are suppressed mostly by men in the chain.
5. The distance to the milk collection centre is affecting quality thus resulting in affecting
profit margins.

4 Conclusions and recommendations
CONCLUSIONS
Small holder dairy chain is profitable but the export of maize bran, the costs of veterinary drugs ,
short lactation length, farmers non growing pastures, importation of breeding stock at high
cost(loans with high interest rates) are threatening the viability and profitability of the chain.
RECOMMENDATIONS
1. Train farmers in pasture production and conservation for use in dry season as
opposed to use only maize stover.
With our rule of thumb that 1 kg of concentrates at K2/kg, production will increase 2 l at K2.80/l,
it is obviously better to feed animals well. Over the years extension offices have trained the small
scale farmer to feed animals on maize stover in the dry season. The stover has low protein content
which does not meet the required protein and energy levels the dairy animals need. This has led to
reduced milk quality as well as reduced milk yield obtained in the dry season. Milk quality is
affected negatively due to low or poor protein supplementation in the dry period as a result of
feeding the dairy animals only with maize stover or poorly harvested pasture. This ultimately has
been followed by a reduction in returns to the farmer thereby affecting the profitability negatively.
Therefore, the training of farmers to practice pasture production is one way to improve profitability
of the small scale dairy milk production. Extension offices, dairy institutions together with the
Dairy Association of Zambia can go into the field or visit famers on their farms or at their
cooperatives to enlighten them on the benefits of pasture growing. The farmers can be trained on
how and what type of pastures to grow for their dairy animals e.g. Napier grass and on what size
of land to grow the pasture as well as the management practices to be carried out. These
institutions should as well explain in detail to the farmer on how to harvest and conserve the
pasture for the dry period or dry season when food for the animals is minimal. By doing so, the
farmers will have costs on concentrates reduced, due to the availability of pasture in the dry
period. By growing the correct required pasture, he animals will be provided with adequate
nutrition levels to continue producing high quality milk even in the dry period at higher volumes
than what is currently being produced. With reduced dependence on concentrates in the dry period
as well as presence of high quality pasture, as well as increased volume of milk produced, the
farmer will be able to earn more income than currently. Pasture management requires labour,
which can be in short supply. In such a case, dairy farmers could organize themselves at
cooperative level to have some mechanization to reduce labour requirements.
2. Encourage local commercial farmers to start breeding high grade dairy animals
for sale to small scale farmers.
Import of exotic breeds of dairy animals from South Africa is there, but at a high cost, even the
new loan scheme from ZANACO and DAZ The interest rate on these loans is 16%. This rate is
however still high for a small scale dairy farmer. Local commercial farmers could engage more in
local breeding of high grade dairy animals for sale. This would allow small scale farmers to

Business Viability assessment study of small holder dairy farming in Zambia | 39
purchase high grade breeds locally at a price lower than that of the imported animals from South
Africa. This will reduce the capital investment for the small scale farmer as well as reduce the costs
on replacement heifers. This will allow the small scale farmer to have a larger Gross profit from his
or her dairy enterprise thereby profitability would have been increased.
3. Dairy association of Zambia to lobby government to stop exportation of maize
bran – DAZ to help some private partners to start producing maize bran for
farmers locally.
Over the recent years Zambia has recorded a bumper harvest in maize production. At the end of
2013 the government of Zambia has lifted the export ban on maize bran and now allows maize
farmers and millers to export their maize bran to the neighbouring countries. However demand for
maize bran is constantly on the rise and this had led to increase in price for maize bran. The small
scale farmer therefore tends to incur high costs on feeding his or her dairy animals. Dairy
Association of Zambia should discuss and agree with the government to reduce drastically the
amount of maize bran being exported to other countries. The government should calculate the
benefits of using maize bran for the local dairy industry as compared to expert earnings and
subsequently stop commercial farmers from exporting maize bran and instead encourage the
farmers and millers to engage into maize bran processing. This will result in a high availability of
maize bran on the local market for the small scale farmer to purchase at a lower price. The farmer
will therefore face lower costs on production (feeding) which will directly increase the profit the
farmer will obtain.
4. Minimize costs to dairy farmers of inputs like drugs, acaricides, pasture seeds,
fertilizers, AI and dairy equipment.
Zambia currently does not practice the manufacture of dairy equipment such as cooling tanks,
chillers, tractors as well as extracting semen from bulls for AI. The country however does practice
the production of seed for pasture, production of vaccines and other chemicals used for dairy
activities. The importation of equipment results in high costs on the equipment which are faced by
the dairy farmer as well as the cooperative. Therefore the Dairy Association of Zambia should
come in and lobby with government together with the Zambia National Farmers Union to remove
any tariffs on inputs to the dairy sector. Tariffs on fertilizer inputs such as phosphate rock, tariffs
on equipment such as cooling tanks, chaff cutters, imported semen should all be lobbied for
removal. This will reduce the cost of purchase and cost of use of these inputs thereby reducing the
cost on production that the farmer will face. The result will be an increase in profits obtained by
the farmer. It would also be good if many private sector companies compete for prices and quality
of services to the dairy chain.
5. Encourage a variety of processing channels.
Currently Zambia dairy milk market has two major processors in Zam milk and Parmalat. This has
led to local monopolies and therefore tends to affect pricing of raw milk. The processors being
small in number are able to dictate what price they will purchase the raw milk from the farmer.
Therefore, dairy association of Zambia, Zambia national farmers union and the government

(ministry of agriculture and livestock) should seize the opportunity to encourage competition
between processing firms. DAZ should encourage cooperatives to engage into vertical integration
where they are able to carry out processing activities of raw milk, such as Choma and Mpima dairy
cooperatives. This will help the farmer sell his or her milk at a relatively better price than currently
thereby increasing profitability of the small scale dairy farmer.
In addition the government should extend the economic empowerment fund to dairy cooperatives
so that they can acquire the equipment to enable them start adding value to the milk they produce
like Mpima and Choma dairy cooperatives.
6. Gender
Encourage all stakeholders to embrace the gender equity. Formal registration of women should be
encourages by DAZ. The dairy sector should also become more attractive to youth for the sake of
continuity in case of their parents getting very old and unable to perform certain functions in the
dairy. Increasing profitability will certainly help in attracting youth, but campaigns may also be
good to bring young people with fresh ideas into the dairy sector.
The dairy value chain should encourage more women in the chain as most of the women are
widowed and have a responsibility of taking care of their families i.e. feeding them and paying of
school fees. So dairy farming can be a good source of the income and the needed proteins for the
family. Quality of milk and rearing young calves will improve with more women in the sector.
7. Transparency in the chain
From the focused group discussions we had with the processors it was discovered that the
processors were holding on to certain information and could not release it. The information on the
cost of production was not released and farmer did not know how the price for milk were
determined. DAZ also was given some information but not on the cost of production. More
transparency in the chain between cooperatives and processors could be encouraged as the
mutual benefits of increasing quantity and quality of milk produced is recognized and an equitable
distribution of these benefits within the chain can be achieved. Initiatives of DAZ to boost the total
value of the chain must be based on transparancy in the chain, allowing all players in the chain to
benefit from this boost, including farmers, cooperatives, processors and service providers. This
would create more employment and take farmers out of poverty.

Business Viability assessment study of small holder dairy farming in Zambia | 41
References
• Adams, R.S, L.J. Hutchinson and V.A. Ishler. 2009. Evolution of Milk Production In the
Notrth Eastern Region of Romania, Agro-life scientific Journal –volume 2 , Issue 1 , 2013
(ISSN 2285-5718), University of Agronomic Science and Veterinary Medicine Of
Bucharest, Romania.
• The Agricultural Consultative forum. 2012. Policy Brief. Vol 1 issue 2, July 2012.
Performance and Competiveness of the Dairy value chain in Zambia.
• Freebody, P.R. 2003. Qualitative Research in Education. 248 pp. SAGE Publishers. Newbury
Park, CA, USA.
• Kasalo, J. 2013. DAZ. Times of Zambia, 29 July 2013.
• Madalene F.E, R.L. Teodero, A.M. Lemos, J.B.N. Montiro and R.T. Barbosa. 1990. Journal of
Dairy Science volume 73, Issue 7 pages 1887-1901
• Makoni, N.; Mwai, R.; Redda, T.; Zijpp, A.J. van der; Lee, J. van de. 2014. White Gold :
Opportunities for Dairy Sector Development Collaboration in East Africa. Report 14-006.
Wageningen UR
• Mariuki, H.G, Dairy Development in Kenya, FAO 2011 .
• Mohd M.A, M. Najib M and P.K. Eng. 2013. Pasture and fodder establishment and
management for smallholder dairy Production.
• Mumba, C., K.L. Samui, G.S. Pandey, B.M. Hang’ombe, M. Simuunza, G. Tembo and S.W.
Muliokela. 2011. Economic analysis of the viability of smallholder dairy farming in Zambia.
Livestock Research for Rural Development 23 (06).
• Mumba, C. K.L. Samui, G.S. Pandey and G. Tembo. 2012. Econometric analysis of the
socio-economic factors affecting the profitability of smallholder dairy farming in Zambia.
Livestock Research for Rural Development 24 (04).
• Mumba, C., G.S. Pandey and C. van der Jagt. 2013. Milk production potential, marketing
and income oppportunities in key traditional cattle keeping areas of Zambia. Livestock
Research for Rural Development 25 (04).
• Pandey G.S, Voskuil G.C.J. 2011. Manual on improved feeding of Dairy cattle by
smallholder farmers, Golden Valley Agricultural Research Trust, May 2011.
• Pandey, G.S., B.M. Hang’ombe, F. Mushabati and A. Kataba. 2013. Prevalence of
tuberculosis among southern Zambian cattle and isolation of Mycobacterium bovis in raw
milk obtained from tuberculin positive cows. Veterinary World, EISSN: 2231-0916.
• Patton, M.Q. 1990. Qualitative evaluation and research methods (2nd ed.). 532 pp. Sage
Publications. Newbury Park, CA.
• Silverman, D. 2000. Doing qualitative research: a practical handbook. 316 pp. SAGE publishers, Newbury Park, CA.Staal, S.J., Pratt, A.N and M. Jabbar. 2008. ‘A Comparison of
Dairy Policies and Development in South Asia and East Africa’, PPLPI Working Paper No.
44-1 Pro-Poor Livestock Policy Initiative, International Livestock Research Institute. Addis
Ababa.
• Rubin, D. and C. Manfre. 2011. Promoting Gender equitable in Agriculture value chain;
Issues, Opportunities and Next step.
• Valeta, A.M. 2004. Zambia Dairy Policy Study. RATES Centre, Nairobi
• World Bank, 2011. Report No. 62377-ZM. “Zambia: What Would it Take for Zambia’s Beef
and Dairy Industries to achieve their Potential? Finance & Private Sector Development Unit
Africa Region
• ZNFU 2013. National Budget submission.

Annex 1: Questionnaire for Farmers.
Section A: Background Information
Name of Farmer………………………………Name cooperative…………………………
Province..................................................
District.................................Area....................Phone number................................
1. What is your gender?
Female Male
Section B: Milk production and Marketing
2. How many animals do you milk per day (last year Sept 2013 - August 2014)?
3-5 6-9 10-13 14-17 ≥18
3. What is the lactation length of your milking cows?
≤150days 151-200days 201-250days 251-300days ≥301days
4. How many litres do your animals give per day per animal in rainy
season?
6-10L 11-15L 16L-20L ≥21L
5. How many litres do your animals give per day per animal in dry season?
4-7L 8-11L 11-14L ≥15L
6. How many litres do you sell per year?
≤15000L 15001-30000L 30001-45000L ≥ 45001L
7. What is the selling price per litre?
1.50-2.00ZMW 2.01-2.50ZMW 2.51-3.00ZMW ≥3.01ZMW
8. Where do you sell your milk?
Parmalat Varun Dairy Kings Zam-milk Cooperatives
9. How is the demand for milk?
Very good good bad very bad
10. How long does it take to be paid?
≤One week 2weeks 3weeks ≥ 4weeks
11. Does your cooperative get involved in the determination of the milk price?
Yes No I do not know
12. If the answer is no who determines the price? (Skip if the answer is yes)
Government Processors Farmers
13. Does your cooperative have a contract with the milk buyer?
Yes No I do not know the contract.

Business Viability assessment study of small holder dairy farming in Zambia | 43
14. How many litres do you take for home consumption per day?
≤ 2l 3-5l 6-8l 10L
Section C: Costs of Animal Concentrates, forage production and Animal Feeding
15. What is the source of your concentrates?
Homemade Buy from agro dealers do not use concentrates
16. What is the cost of making the concentrates (Homemade) per month?
≤ 2000ZMW 2001-4000ZMW 4001-6000ZMW 6001-8000ZMW
≥8001ZMW
17. What is the cost of purchasing concentrate per month (already made from agro
dealers) ?
≤ 5000ZMW 5001-1000ZMW 10001-15000ZMW ≥15000ZMW
18. How much of the concentrate do you give a lactating cow per day?
≤2kg 3-4kg 5-6kg ≥7 kg
19. How much concentrates do you give per cow per day during the dry period?
1-2kg 3-4kg ≥5 kg
20. What is the amount of concentrates you give per calf per day?
≤1kg 1.5kg 2kg ≥2.5kg I do not give concentrates to calves
21. Do you grow any pastures for dairy animals? (if the answer is no skip to next section)
Yes No
22. What type of pastures do you grow?
Hay Silage Hay + Silage Others
23. What are the cost of seeds used in pasture production?
≤1000ZMW 1001-2000 ZMW 2001-3000ZMW ≥3001ZMW
24. What are the cost of fertilizers used in pastures production?
200ZMW 201-400ZMW 400-600ZMW ≥800ZMW
25. What is the cost of weeding the pastures?
≤150ZMW 151-200ZMW ≥201ZMW
26. When do you harvest your pasture (forage)?
March-April April-May May –July
27. How much pasture do you harvest from the area cultivated?
≤2 tone 2.1-4 tonnes 4.1-6 tonnes ≥6.1tonnes
28. When do you use your pastures harvested to feed the animals?
April- July August- Sept October – Mid November May-November
29. What is the size of the land grown for pastures?
1ha 2ha 3ha ≥4 ha
30. How much hay do you give to a milk producing animal /day?

≤ 5kg 6-10kg 11-15kg ≥16
31. How much silage do you give to a milk producing animal /day?
≤ 5kg 6-10kg 11-15kg ≥16
Section D:Breeding, Replacement stock and cull
32. How much do you buy a replacement cow?
≤5000ZMW 6000-8000ZMW 9000-11000ZMW ≥12000ZMW
Did not buy
33. How much do you sell a culled cow?
≤1000ZMW 1001-2000ZMW 2001-3000ZMW ≥3001ZMW
34. How many replacement heifers did you buy during the year?
0 heifers 1heifer 2heifers 3heifers 4 heifers
35. How many replacement bulls did you buy in the year?
0 bulls 1 bull 2 bulls 3 bulls
36. What is the average age at first calving for your cows?
2years 2.5years 3years ≥3.5 years
37. What is the life span of your producing cow in the herd?
≤3 years 4-5 years 6-8 year 9-10year ≥11years
38. What is the calving interval of your cows on the farm?
Zero per year one in a year one in two years one in three years
39. How many bull calves did you sale during the year? (skip 40 if answer is 0)
0 calves 1calf 2 calves 3calves 4calves
40. What is the selling price of the bull calves?
≤1000ZMW 1100-1500ZMW 1600-2000ZMW ≥2100ZMW
41. Do you use a bull for breeding (skip 42 if answer is no)?
Yes No
42. How much does it costs to buy a bull?
≤5000ZMW 5100-8000ZMW 8100-11000ZMW ≥11100ZMW
43. Do you use artificial insemination (if answer is no skip to next section)?
Yes No
44. What is the total cost of insemination?
≤50ZMW 51-100ZMW 101-150ZMW ≥151 ZMW
45. How many insemination do you do before the cow conceives?
One two three four
Section E: Transport of Milk
46. What type of transport do you use to deliver the milk to Milk collection centre?

Business Viability assessment study of small holder dairy farming in Zambia | 45
Walk Bicycle Vehicle Scotch cart Public transport
47. What is the cost of transport per month?
20-50ZMW 51-100ZMW 101-150ZMW ≥151ZMW
Section F: Animal health
48. What type of disease prevention do you give to the animals?
Vaccinations, Deworming &Dipping Dipping only Dipping and Deworming
49. How much do you spend per animal for disease control per month?
≤100ZMW 101-150ZMW 151-200ZMW ≥201ZMW
Section G: Building, Equipment and Maintenance costs
50. How much did it cost to build your dairy building? .….. /25 years (to determine
depreciation)
What is the cost of depreciation of the dairy building?
≤ 10000ZMW 10001-15000ZMW 15001-20000ZMW
≥ 20001ZMW
51. What are the costs of the maintenance (ZMW) for all dairy building per year?
≤1000 1001-1500 1501-2000 ≥2001 no maintainance
52. What equipment have you got for dairy? (Skip question if no machinery)
Milking machine Tractor+ equipment Milking machine + Tractor
+equipment Cooling tank + Milking machine + Tractor+ equipment Nothing
53. How much did it cost to buy your dairy machinery? ……/10 years (to determine
depreciation)
What is cost of depreciation of your machines?
Tractor+ equipment…… Milking machine…………cooling tanks……
54. What is the cost of maintenance of the machines?
Tractor+ equipment………. Cooling tanks............ Milk machine............
Section H: Water
55. Where do you get your water for irrigation of pastures?
Borehole River Well Do not irrigate Water Company
56. Where do you get the cow drinking water?
Borehole River Well Water Company
57. What is the costs of water bill per month used in dairy?
≤100 ZMW 101-150 ZMW 151-200 ZMW ≥201 ZMW
58. What is cost of water used in pasture irrigation per month? (skip if pasture is not grown)
≤150ZMW 151-200ZMW 201-250ZMW 251-300ZMW
≥301ZMW
59. How many times do you give the animals water?

One time /day two times /day three times/day water is always
available
Section I: Labour
60. Do you use your family labour in the farm?
Yes No
61. How many hours do you spend working on dairy each day?
2 hrs. 4 hrs. 6 hrs. 8 hrs. 10hrs
62. What family members are involved in your dairy enterprise?
Male Number Female Number
18-25 ....................... ........................
26-35 ....................... ........................
36-46 ....................... ........................
47-55 ....................... ........................
≥ 56 ....................... ........................
63. What are the ages of the workers employed at your dairy farm?
Male Number Female Number
≤15 ...................... ........................
16-25 ...................... ........................
26-35 ...................... ........................
≥36 ...................... ........................
64. How much do you pay your male workers per month?
≤500 ZMW 501-600 ZMW 601-800 ZMW ≥801 ZMW
65. How much do you pay your female workers?
≤500 ZMW 501-600 ZMW 601-800 ZMW ≥801 ZMW
Section J: Miscellaneous costs
66. What is the total cost for the bill of electricity per month?
≤200 ZMW 201-250 ZMW 251-300 ZMW ≥301 ZMW
67. What is the cost of fuel used on dairy activities?
≤250 ZMW 251-300 ZMW 301-350 ZMW ≥351 ZMW
68. What are the cost paid for Land Ownership per year?
≤1000ZMW 1001-1500ZMW 1501-2000ZMW ≥2001ZMW
Checklist for Processors
Name of officer …………………Position………………….
Name of company.......................................
1) What volumes of milk do you collect from the cooperative per month?
2) How much do you pay for a litre of milk?
3) Who are other processors collecting milk from the same point?
4) Do you differ in purchasing prices?
5) What is the cost of transporting raw milk per month?
6) What is the cost of labour per month?

Business Viability assessment study of small holder dairy farming in Zambia | 47
7) What is the cost of packaging?
8) What are the other variable costs in processing milk?
9) How much milk is wasted from collection to final processing?
10) What is the cost of electricity per month?
11) How much is the selling price of processed litre of milk.
12) Where do you sell your milk and other dairy products (customers)?
13) How is the demand for milk?
14) Do you export some milk to neighbouring countries?
15) How much milk do you export?
16) How much do you sell per litre of the export milk and other products?
17) What are the fixed costs related to milk processing.
18) What are some of the market challenges you face?
19) What is the cost of maintenance of the equipment?
20) Does milk quality affect pricing?
21) Who determines the milk price?
Checklist for Dairy Association of Zambia
Name……………………………….. Title……………………………………….
1 What is the nature of your membership?
2 What activities do you undertake as association to improve the enabling environment
in the dairy sector?
3 What challenges do you face as you support the activities of small holder dairy
farmers?
4 Give us your view of the market power dynamics between small holder cooperatives
and processors.
5 How milk prices are usually set and agreed?
Checklist for Cooperatives
Name……………………………….. Title………………………………………
Membership Male…… Female………
1. What is the role of cooperative in determining the price?
2. What are the sources of income for the cooperative?
3. Do you own or rent the buildings?
4. What assets do you own (chilling tanks, processing equipment, transport etc?)
5. How much do you spend on bills for electricity and water per month?
6. How much is the total maintenance costs for your equipment?
7. What is the depreciation cost for the building?
8. Do you buy milk from Members and sell to Processor?
9. Do you have contracts with the buyers of the milk?
10. What are your markets for milk?
11. What market information do you get for the members?
12. What are your market channels for milk?
13. What are the market challenges you are facing?
14. How many people do you employ?
15. How much do you pay for labour per month?
16. How much do you sell the milk per litre to the processor?
17. How much do you pay the milk per litre to the farmers?
18. Is there any competitor in purchasing of milk?
Check list for Supermarket/Groceries/Vendors
1. What is your selling price of milk per litre?
2. What is your purchasing price per litre of milk?
3. What are the variable cost involved in the purchasing and selling of milk?
4. What are the fixed cost related to selling of milk?

Annex 2. Calculations Value Share
CALCULATIONS:
Farmers
Variable Costs = 67/100 x K2.70
= K1.80
Gross Income = K2.70 – K1.80
= K0.90
Added Value = K2.70 – K0
= K2.70
Value Share = K2.70 x 100/ K9.79
= 27.6%
Gross Margin = K0.90 x 100/ K2.70
= 33 %
Cooperatives:
Variable Costs = (9/ 100 x K2.70) + K2.70
= K2.94
Gross Income = K3.40 – K2.94
= K0.46
Added Value = K3.40 – K2.70
= K0.70
Value Share = K0.70 x 100/ K9.79
= 7.2%
Gross Margin = K0.46 x 100/ K3.40
= 14%
Processor
Variable Costs = (40/ 100 x K3.40) + K3.40
= K4.76
Gross Income = K8.60 – K4.76
= K3.84
Added Value = K8.60 – K3.40
= K5.20
Value Share = K5.20 x 100/ K9.79
= 53.1%
Gross Margin = K3.84 x 100/ K8.60
= 44.7%
Supermarket
Variable Costs = (10/ 100 x K8.60) + K8.60
= K9.76
Gross Income = K9.76 – K9.46
= K0.33
Added Value = K9.79 – K8.60
= K1.19
Value Share = K1.19 x 100/ K9.79
= 12.2%
Gross Margin = K0.33 x 100/ K9.79
=3.4%

Business Viability assessment study of small holder dairy farming in Zambia | 49
Vendors:
Variable Costs = (10/ 100 x K8.60) + K8.60
= K9.46
Gross Income = K12.00 – K9.46
= K2.54
Added Value = K12.00 – K8.60
= K3.40
Value Share = K3.40 x 100/ K12.00
= 28.3%
Gross Margin = K2.54 x 100/ K12.00
= 21.2%
Groceries:
Variable Costs = (7/ 100 x K8.60) + K8.60
= K9.20
Gross Income = K10.50 – K9.20
= K1.30
Added Value = K10.50 – K8.60
= K1.90
Value Share = K1.9 x 100/ K10.50
= 18%
Gross Margin = K1.3 x 100/ K10.50
= 12.4%


Alterra report nuffic/niche/zmb/021 | 51

Alterra Wageningen UR
P.O. Box 47
6700 AA Wageningen
The Netherlands
T +31 (0)317 48 07 00
www.wageningenUR.nl/en/alterra
Alterra report nuffic/niche/zmb/021
ISSN 1566-7197
Alterra Wageningen UR is the research institute for our green living
environment. We offer a combination of practical and scientific research in
a multitude of disciplines related to the green world around us and the
sustainable use of our living environment, such as flora and fauna, soil,
water, the environment, geo-information and remote sensing, landscape and
spatial planning, man and society.
The mission of Wageningen UR (University & Research centre) is ‘To explore
the potential of nature to improve the quality of life’. Within Wageningen UR,
nine specialised research institutes of the DLO Foundation have joined forces
with Wageningen University to help answer the most important questions in
the domain of healthy food and living environment. With approximately 30
locations, 6,000 members of staff and 9,000 students, Wageningen UR is one
of the leading organisations in its domain worldwide. The integral approach
to problems and the cooperation between the various disciplines are at the
heart of the unique Wageningen Approach.