Business Statistic...Simple Index Number Let’s see this problem: According to Statistics Canada,...
51
Business Statistic Week 3.1 - Index Number 1
Transcript of Business Statistic...Simple Index Number Let’s see this problem: According to Statistics Canada,...
Business Statistic
Week 3.1 - Index Number
1
Agenda
Time Activity
60 minutes Index Number
30 minutes Exercise
Objectives
At the end of this session the students will be able to
• Explain what an index number is
• Compile a simple index number
• Identify different types of index numbers
• Explain how index numbers can be used in practice
3
Introduction
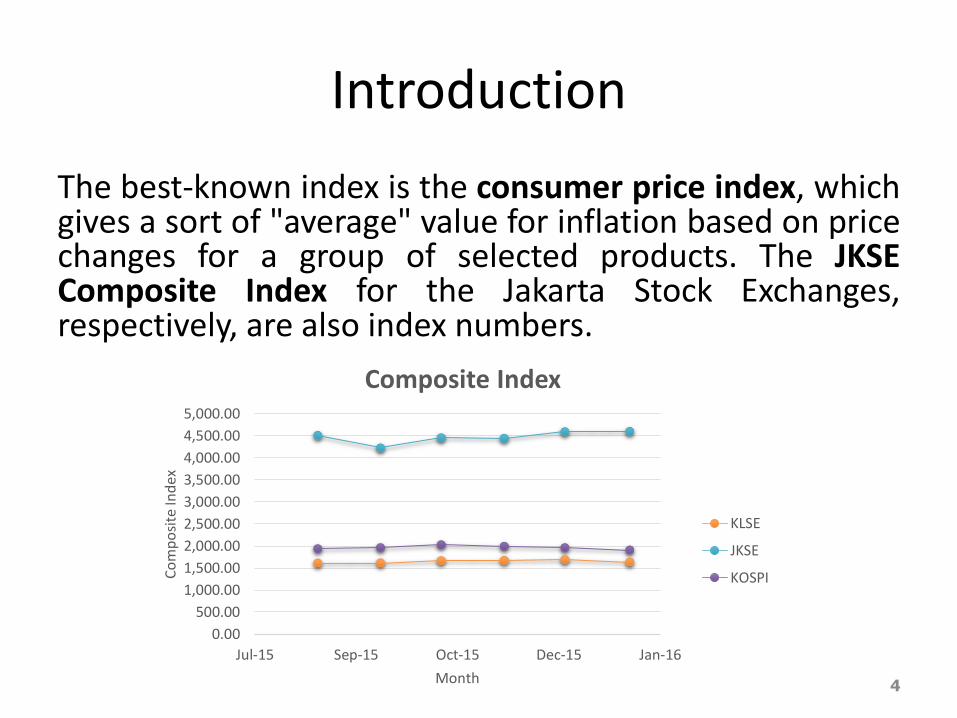
The best-known index is the consumer price index, which gives a sort of "average" value for inflation based on price changes for a group of selected products. The JKSE Composite Index for the Jakarta Stock Exchanges, respectively, are also index numbers.
4
0.00
500.00
1,000.00
1,500.00
2,000.00
2,500.00
3,000.00
3,500.00
4,000.00
4,500.00
5,000.00
Jul-15 Sep-15 Oct-15 Dec-15 Jan-16
Co
mp
osi
te In
dex
Month
Composite Index
KLSE
JKSE
KOSPI
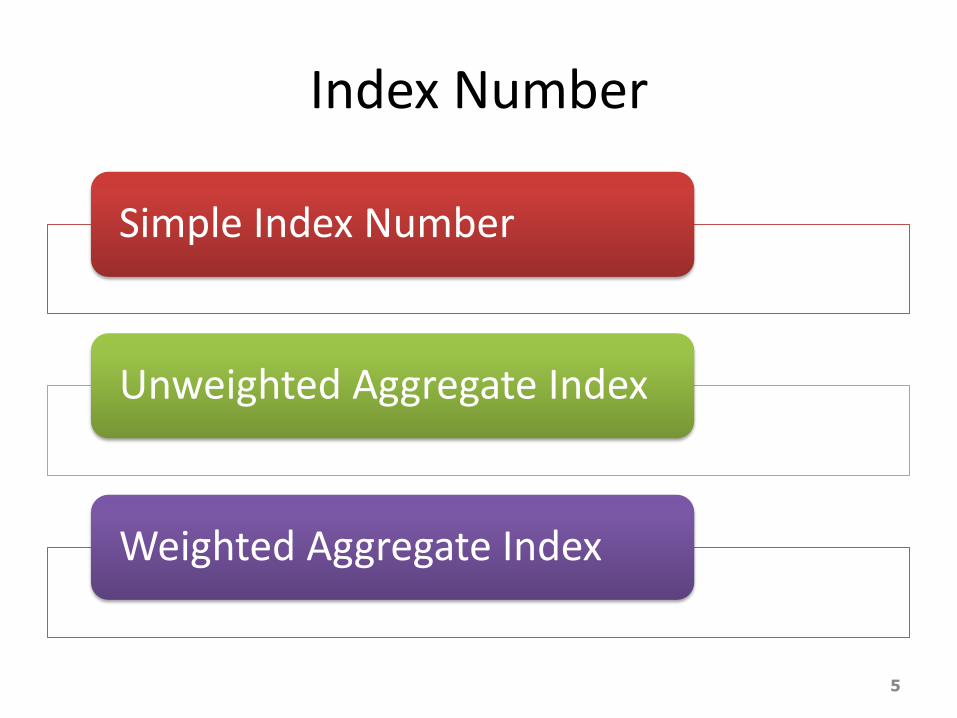
Index Number
Simple Index Number
Unweighted Aggregate Index
Weighted Aggregate Index
5
SIMPLE INDEX NUMBER
6

Simple Index Number
Let’s see this problem: According to Statistics Canada, in 1995 the average salary of wage earners 15 years and older in Newfoundland and Labrador was $20,828 per year. In 2001, it was $24,165 per year. What is the index of yearly earnings of workers over age 15 in Newfoundland and Labrador for 2001 based on 1995?
7
INDEX NUMBER A number that expresses the relative change in price, quantity, or value compared to a base period.

Simple Index Number
8
INDEX NUMBER A number that expresses the relative change in price, quantity, or value compared to a base period.
𝑰 =𝑨𝒗𝒆𝒓𝒂𝒈𝒆 𝒚𝒆𝒂𝒓𝒍𝒚 𝒊𝒏𝒄𝒐𝒎𝒆 𝒐𝒇 𝒘𝒂𝒈𝒆 𝒆𝒂𝒓𝒏𝒆𝒓𝒔 𝒐𝒗𝒆𝒓 𝟏𝟓 𝒊𝒏 𝟐𝟎𝟎𝟏
𝑨𝒗𝒆𝒓𝒂𝒈𝒆 𝒚𝒆𝒂𝒓𝒍𝒚 𝒊𝒏𝒄𝒐𝒎𝒆 𝒐𝒇 𝒘𝒂𝒈𝒆 𝒆𝒂𝒓𝒏𝒆𝒓𝒔 𝒐𝒗𝒆𝒓 𝟏𝟓 𝒊𝒏 𝟏𝟗𝟗𝟓 (𝟏𝟎𝟎)
𝑰 =𝟐𝟒, 𝟏𝟔𝟓
𝟐𝟎, 𝟖𝟐𝟖 𝟏𝟎𝟎 = 𝟏𝟏𝟔. 𝟎
Solution:
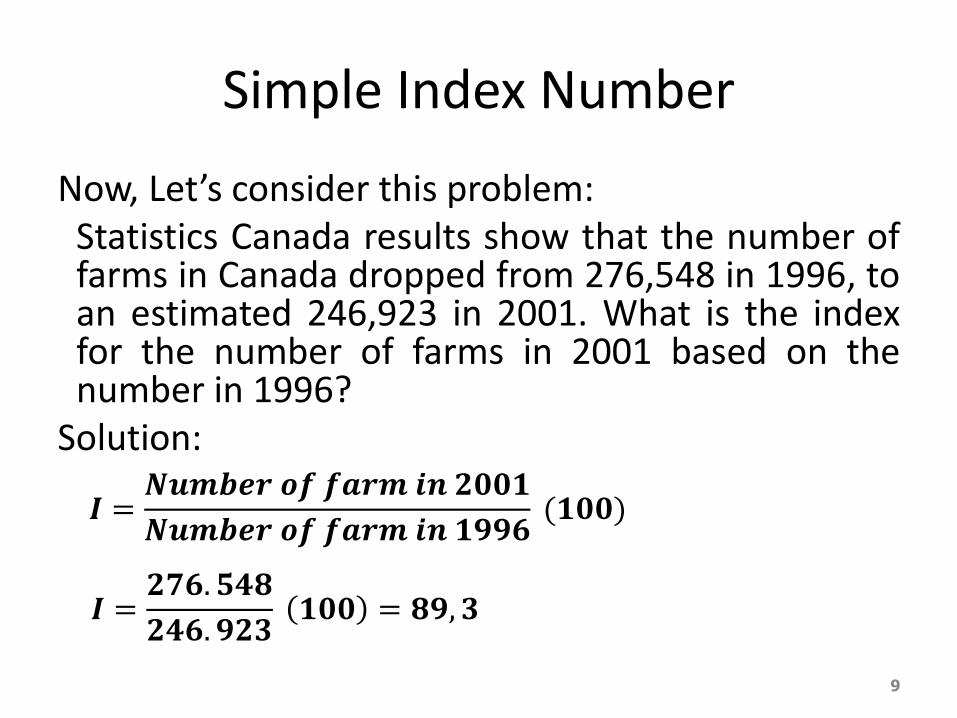
Simple Index Number
Now, Let’s consider this problem: Statistics Canada results show that the number of farms in Canada dropped from 276,548 in 1996, to an estimated 246,923 in 2001. What is the index for the number of farms in 2001 based on the number in 1996?
Solution:
9
𝑰 =𝑵𝒖𝒎𝒃𝒆𝒓 𝒐𝒇 𝒇𝒂𝒓𝒎 𝒊𝒏 𝟐𝟎𝟎𝟏
𝑵𝒖𝒎𝒃𝒆𝒓 𝒐𝒇 𝒇𝒂𝒓𝒎 𝒊𝒏 𝟏𝟗𝟗𝟔 (𝟏𝟎𝟎)
𝑰 =𝟐𝟕𝟔. 𝟓𝟒𝟖
𝟐𝟒𝟔. 𝟗𝟐𝟑 𝟏𝟎𝟎 = 𝟖𝟗, 𝟑
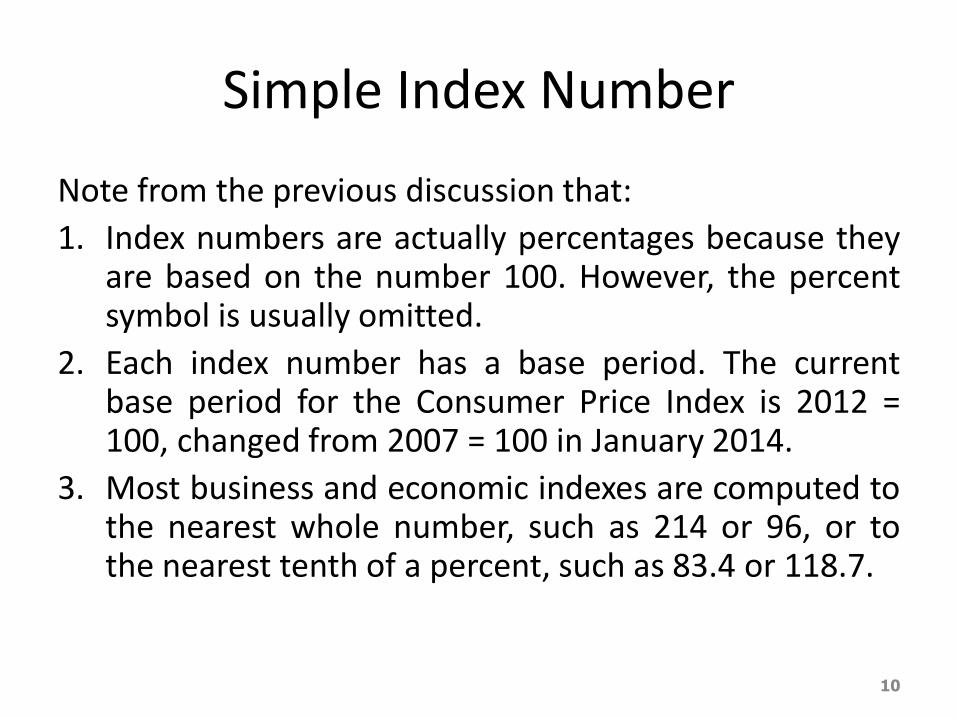
Simple Index Number
Note from the previous discussion that:
1. Index numbers are actually percentages because they are based on the number 100. However, the percent symbol is usually omitted.
2. Each index number has a base period. The current base period for the Consumer Price Index is 2012 = 100, changed from 2007 = 100 in January 2014.
3. Most business and economic indexes are computed to the nearest whole number, such as 214 or 96, or to the nearest tenth of a percent, such as 83.4 or 118.7.
10
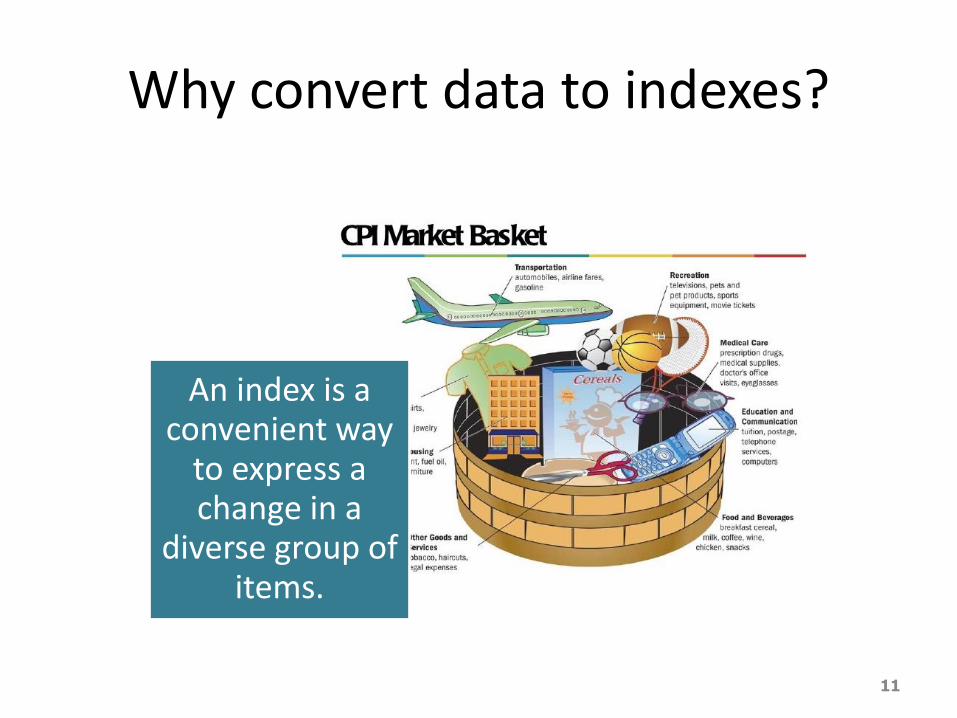
Why convert data to indexes?
An index is a convenient way
to express a change in a
diverse group of items.
11
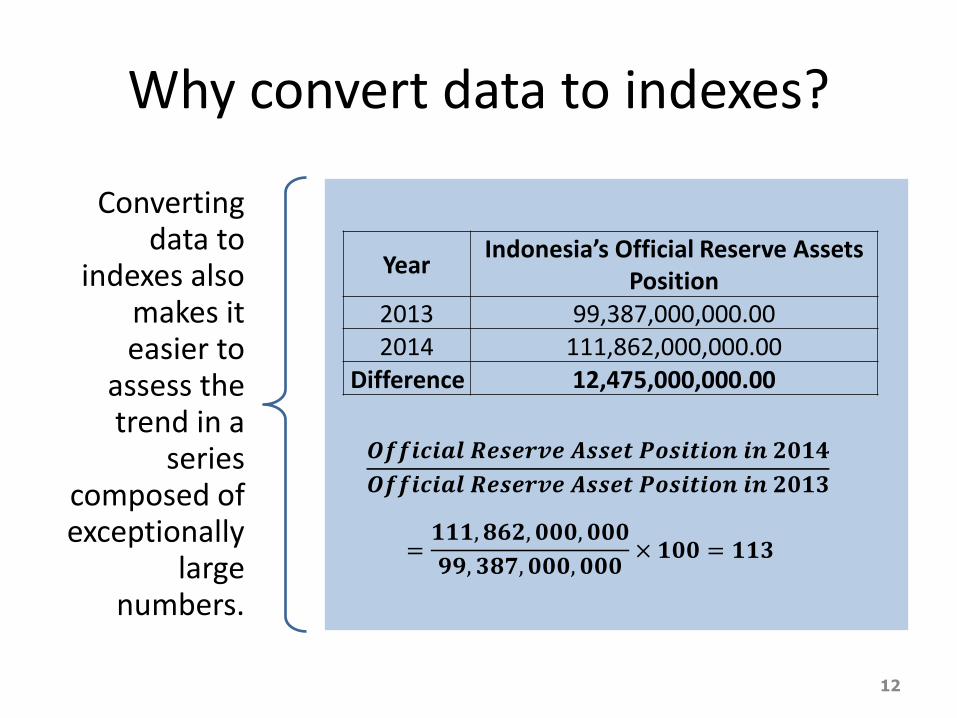
Why convert data to indexes?
Converting data to
indexes also makes it easier to
assess the trend in a
series composed of exceptionally
large numbers.
12
Year Indonesia’s Official Reserve Assets
Position 2013 99,387,000,000.00 2014 111,862,000,000.00
Difference 12,475,000,000.00
𝑶𝒇𝒇𝒊𝒄𝒊𝒂𝒍 𝑹𝒆𝒔𝒆𝒓𝒗𝒆 𝑨𝒔𝒔𝒆𝒕 𝑷𝒐𝒔𝒊𝒕𝒊𝒐𝒏 𝒊𝒏 𝟐𝟎𝟏𝟒
𝑶𝒇𝒇𝒊𝒄𝒊𝒂𝒍 𝑹𝒆𝒔𝒆𝒓𝒗𝒆 𝑨𝒔𝒔𝒆𝒕 𝑷𝒐𝒔𝒊𝒕𝒊𝒐𝒏 𝒊𝒏 𝟐𝟎𝟏𝟑
=𝟏𝟏𝟏, 𝟖𝟔𝟐, 𝟎𝟎𝟎, 𝟎𝟎𝟎
𝟗𝟗, 𝟑𝟖𝟕, 𝟎𝟎𝟎, 𝟎𝟎𝟎× 𝟏𝟎𝟎 = 𝟏𝟏𝟑
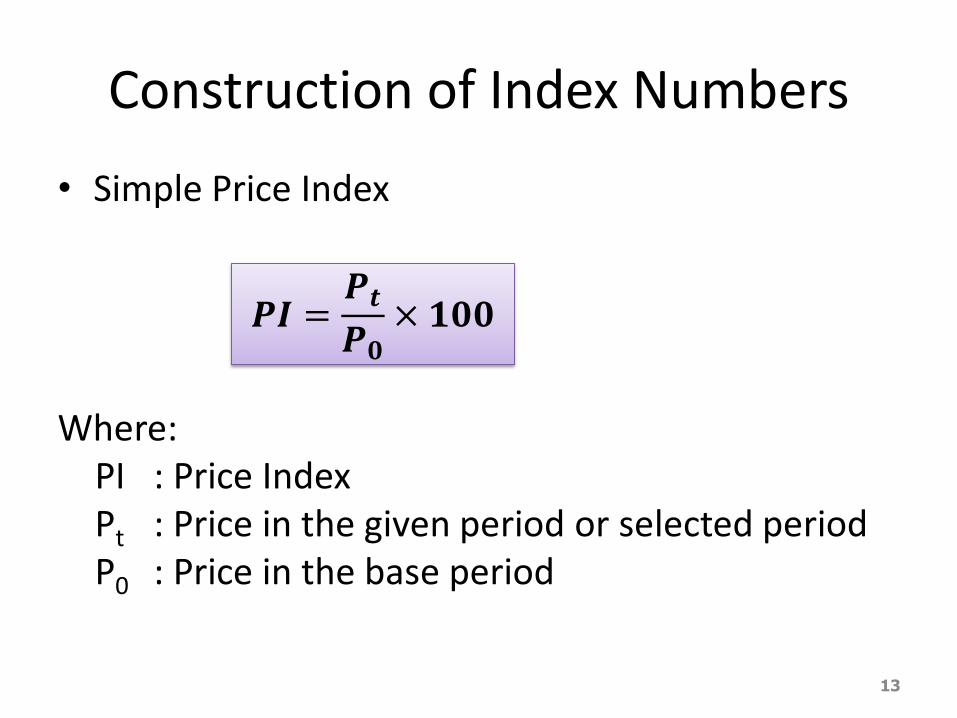
Construction of Index Numbers
• Simple Price Index
Where: PI : Price Index Pt : Price in the given period or selected period P0 : Price in the base period
13
𝑷𝑰 =𝑷𝒕𝑷𝟎× 𝟏𝟎𝟎
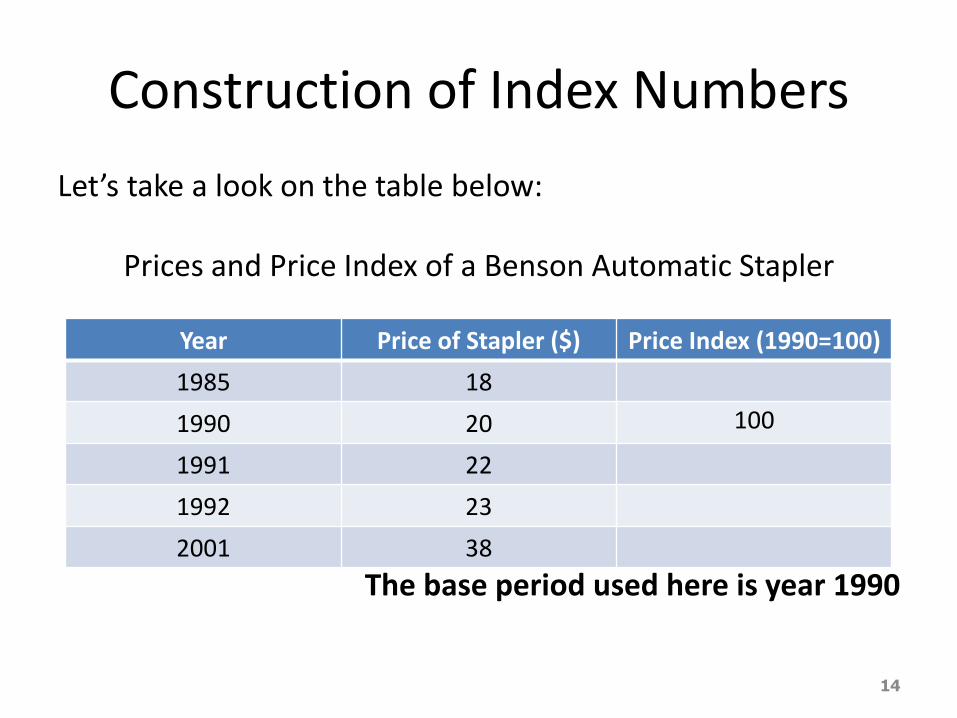
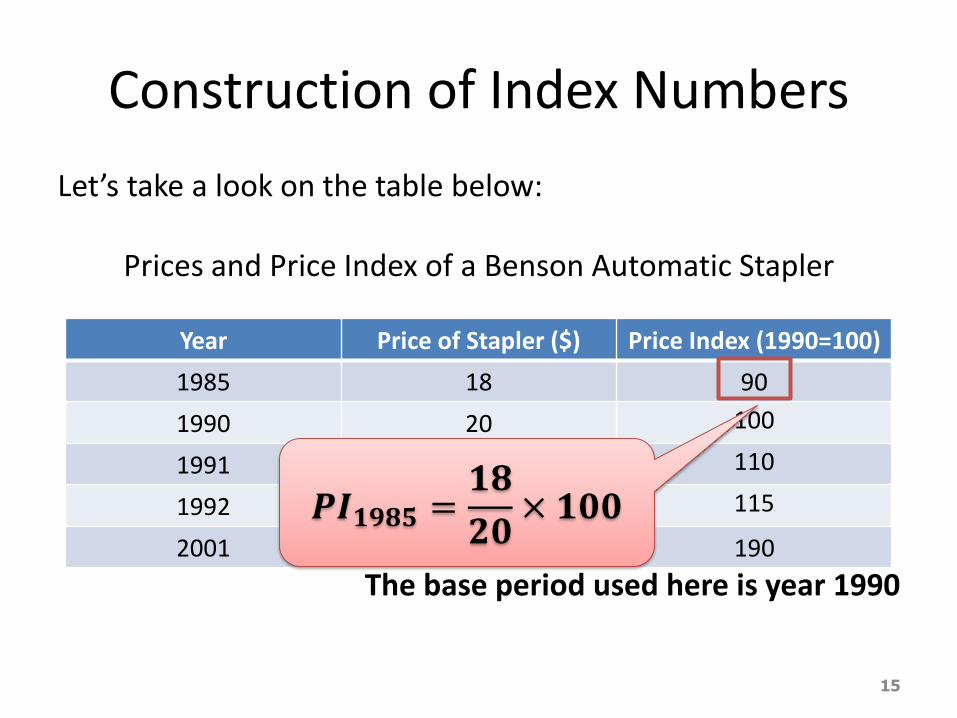
Construction of Index Numbers
Let’s take a look on the table below:
Prices and Price Index of a Benson Automatic Stapler
The base period used here is year 1990
14
Year Price of Stapler ($) Price Index (1990=100)
1985 18
1990 20 100
1991 22
1992 23
2001 38
Construction of Index Numbers
Let’s take a look on the table below:
Prices and Price Index of a Benson Automatic Stapler
The base period used here is year 1990
15
Year Price of Stapler ($) Price Index (1990=100)
1985 18 90
1990 20 100
1991 22 110
1992 23 115
2001 38 190
𝑷𝑰𝟏𝟗𝟖𝟓 =𝟏𝟖
𝟐𝟎× 𝟏𝟎𝟎
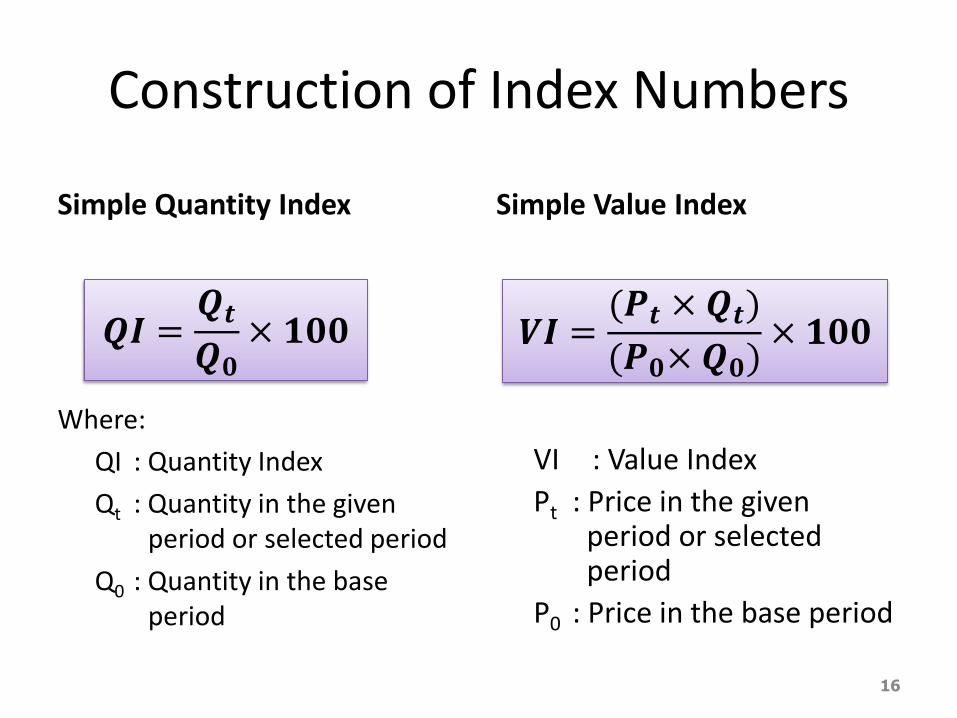
Construction of Index Numbers
Simple Quantity Index
Where:
QI : Quantity Index
Qt : Quantity in the given period or selected period
Q0 : Quantity in the base period
Simple Value Index
VI : Value Index
Pt : Price in the given period or selected period
P0 : Price in the base period
16
𝑸𝑰 =𝑸𝒕𝑸𝟎
× 𝟏𝟎𝟎 𝑽𝑰 =(𝑷𝒕 × 𝑸𝒕)
(𝑷𝟎× 𝑸𝟎)× 𝟏𝟎𝟎
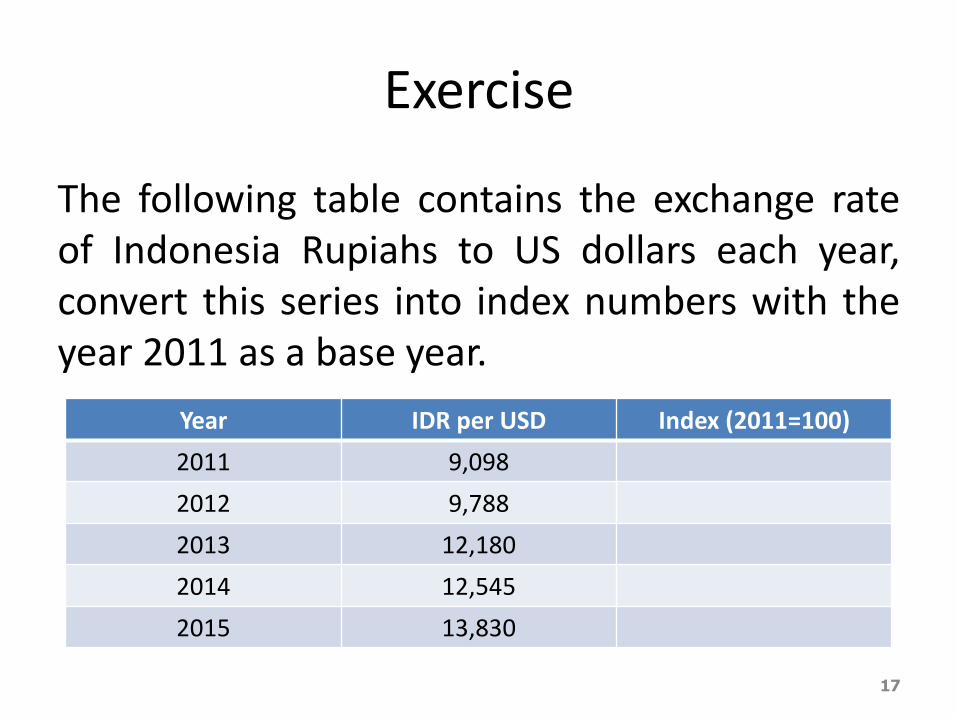
Exercise
The following table contains the exchange rate of Indonesia Rupiahs to US dollars each year, convert this series into index numbers with the year 2011 as a base year.
17
Year IDR per USD Index (2011=100)
2011 9,098
2012 9,788
2013 12,180
2014 12,545
2015 13,830
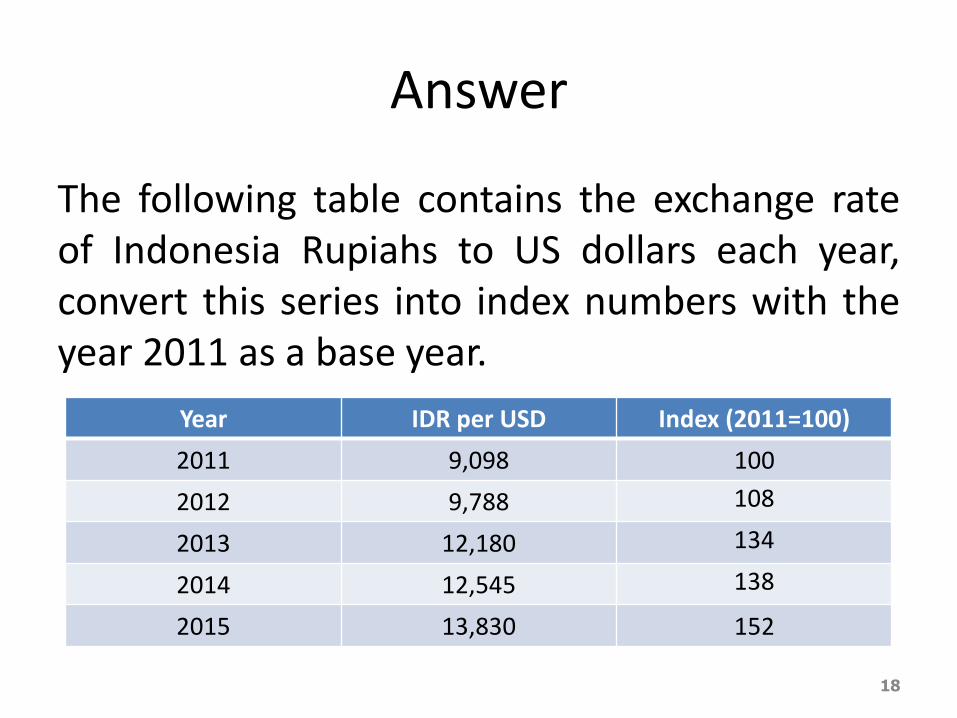
Answer
The following table contains the exchange rate of Indonesia Rupiahs to US dollars each year, convert this series into index numbers with the year 2011 as a base year.
18
Year IDR per USD Index (2011=100)
2011 9,098 100
2012 9,788 108
2013 12,180 134
2014 12,545 138
2015 13,830 152

UNWEIGHTED AGGREGATE INDEXES
19
Unweighted Indexes
Simple Average of the Price Indexes
Simple Aggregate Index
20

Simple Average of the Price Indexes
Table below reports the prices for several food items for the years 1995 and 2005. We would like to develop an index for this group of food items for 2005, using 1995 as the base.
Computation of Index for Food Price 2005, 1995=100
21
Item 1995
Price ($) 2005
Price ($) Simple Index
Bread white (loaf) 0.77 1.98 Eggs (dozen) 1.85 1.84 Milk (litre) white 0.88 1.98 Apples, red delicious (500 g) 1.46 1.75 Orange juice (355 ml concentrate) 1.58 1.70 Coffee, 100% ground roast (400 g) 4.40 3.99
Total 10.94 13.24
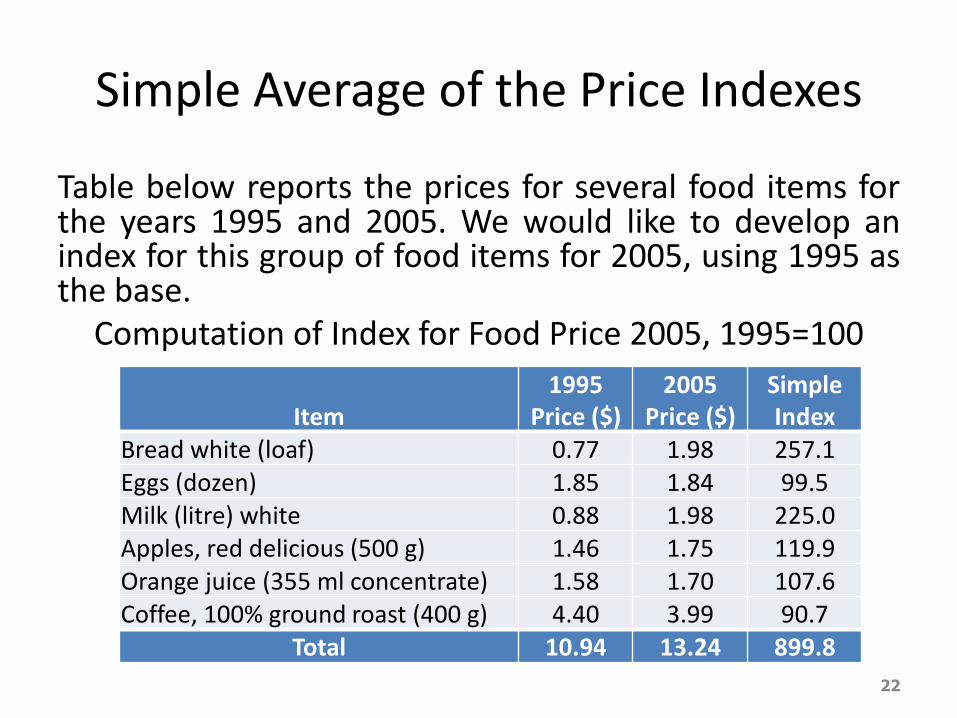
Simple Average of the Price Indexes
Table below reports the prices for several food items for the years 1995 and 2005. We would like to develop an index for this group of food items for 2005, using 1995 as the base.
Computation of Index for Food Price 2005, 1995=100
22
Item 1995
Price ($) 2005
Price ($) Simple Index
Bread white (loaf) 0.77 1.98 257.1 Eggs (dozen) 1.85 1.84 99.5 Milk (litre) white 0.88 1.98 225.0 Apples, red delicious (500 g) 1.46 1.75 119.9 Orange juice (355 ml concentrate) 1.58 1.70 107.6 Coffee, 100% ground roast (400 g) 4.40 3.99 90.7
Total 10.94 13.24 899.8
Simple Average of the Price Indexes
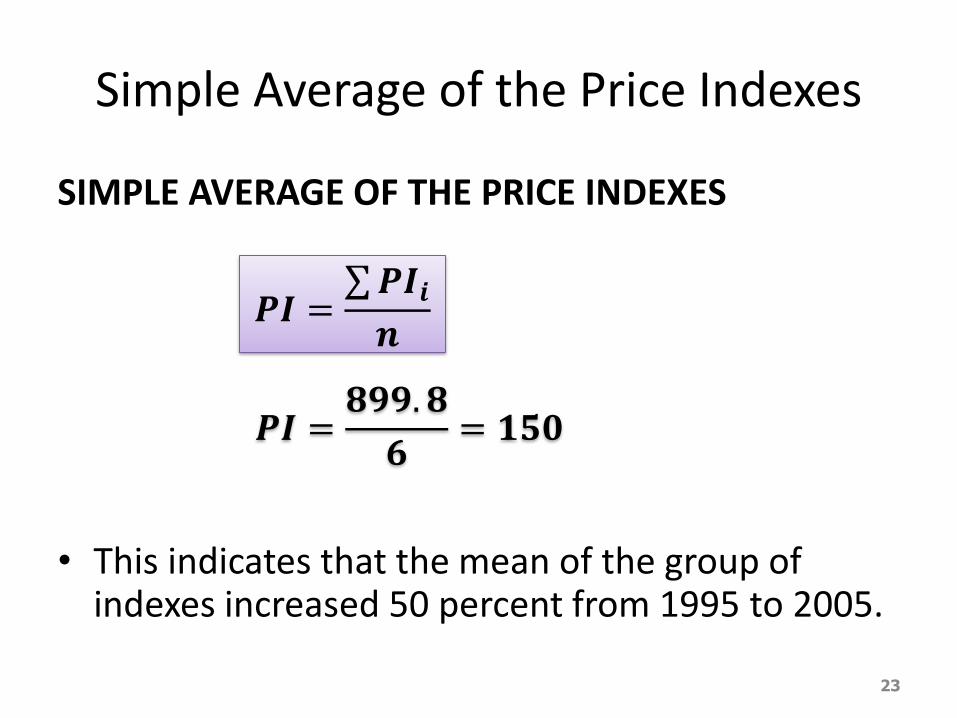
SIMPLE AVERAGE OF THE PRICE INDEXES
• This indicates that the mean of the group of indexes increased 50 percent from 1995 to 2005.
23
𝑷𝑰 = 𝑷𝑰𝒊𝒏
𝑷𝑰 =𝟖𝟗𝟗. 𝟖
𝟔= 𝟏𝟓𝟎
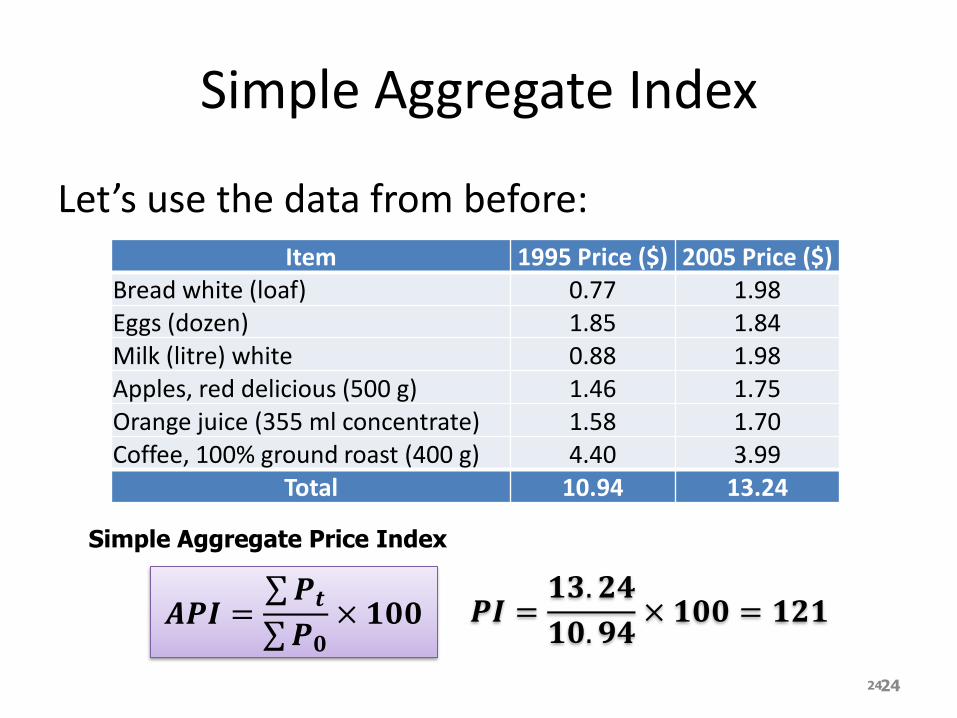
Simple Aggregate Index
Let’s use the data from before:
24 24
Item 1995 Price ($) 2005 Price ($) Bread white (loaf) 0.77 1.98 Eggs (dozen) 1.85 1.84 Milk (litre) white 0.88 1.98 Apples, red delicious (500 g) 1.46 1.75 Orange juice (355 ml concentrate) 1.58 1.70 Coffee, 100% ground roast (400 g) 4.40 3.99
Total 10.94 13.24
𝑨𝑷𝑰 = 𝑷𝒕 𝑷𝟎
× 𝟏𝟎𝟎 𝑷𝑰 =𝟏𝟑. 𝟐𝟒
𝟏𝟎. 𝟗𝟒× 𝟏𝟎𝟎 = 𝟏𝟐𝟏
Simple Aggregate Price Index
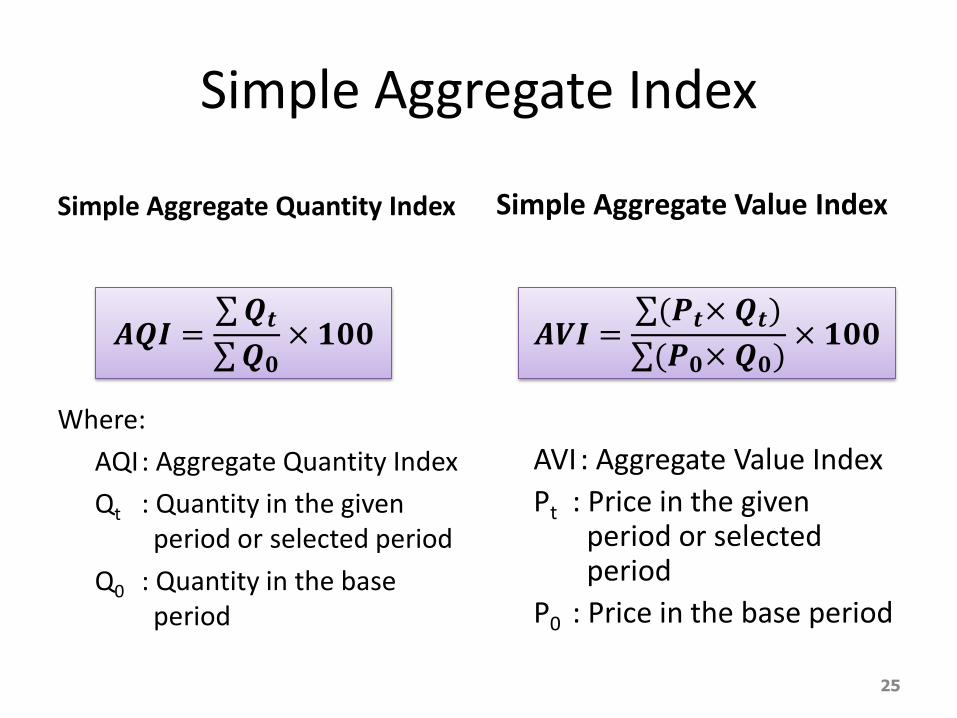
Simple Aggregate Index
Simple Aggregate Quantity Index
Where:
AQI : Aggregate Quantity Index
Qt : Quantity in the given period or selected period
Q0 : Quantity in the base period
Simple Aggregate Value Index
AVI : Aggregate Value Index
Pt : Price in the given period or selected period
P0 : Price in the base period
25
𝑨𝑸𝑰 = 𝑸𝒕 𝑸𝟎
× 𝟏𝟎𝟎 𝑨𝑽𝑰 = (𝑷𝒕× 𝑸𝒕)
(𝑷𝟎× 𝑸𝟎)× 𝟏𝟎𝟎
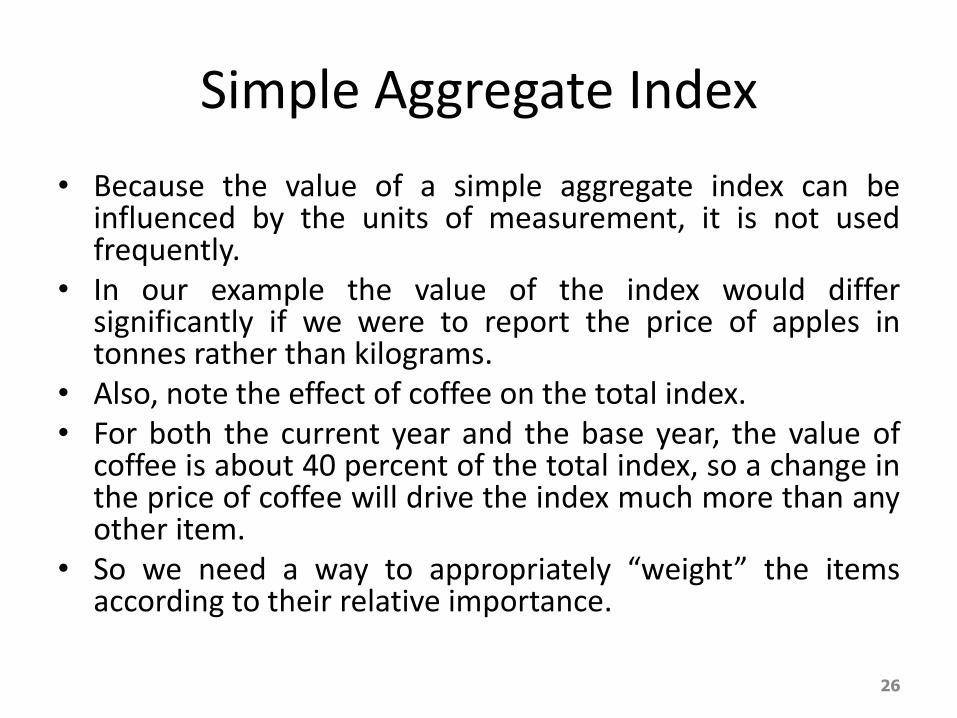
Simple Aggregate Index
• Because the value of a simple aggregate index can be influenced by the units of measurement, it is not used frequently.
• In our example the value of the index would differ significantly if we were to report the price of apples in tonnes rather than kilograms.
• Also, note the effect of coffee on the total index. • For both the current year and the base year, the value of
coffee is about 40 percent of the total index, so a change in the price of coffee will drive the index much more than any other item.
• So we need a way to appropriately “weight” the items according to their relative importance.
26

WEIGHTED AGGREGATE INDEXES
27
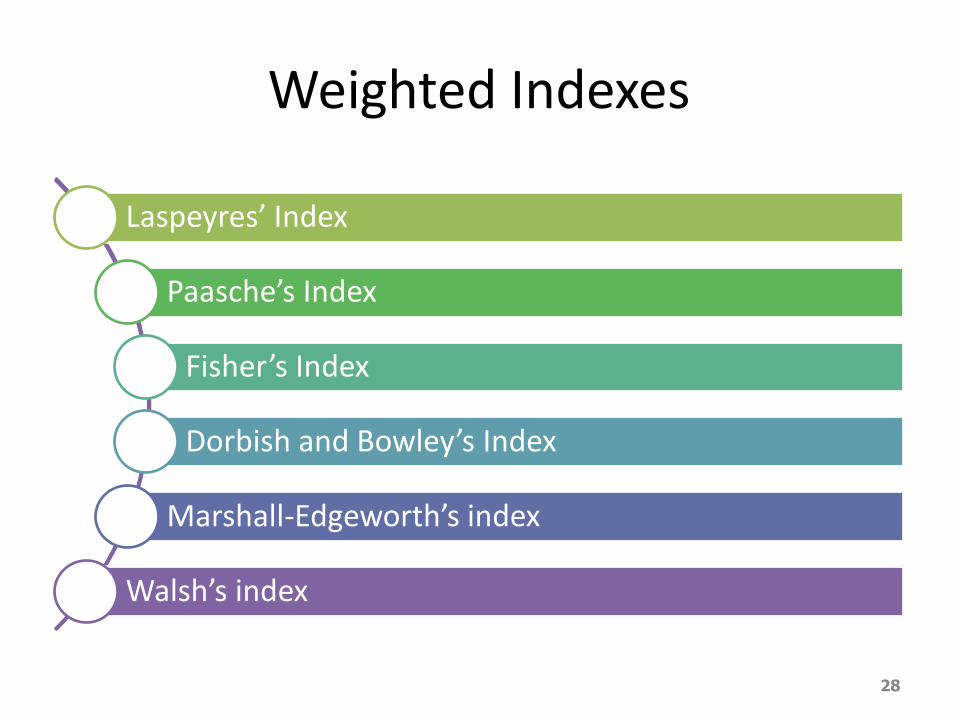
Weighted Indexes
Laspeyres’ Index
Paasche’s Index
Fisher’s Index
Dorbish and Bowley’s Index
Marshall-Edgeworth’s index
Walsh’s index
28
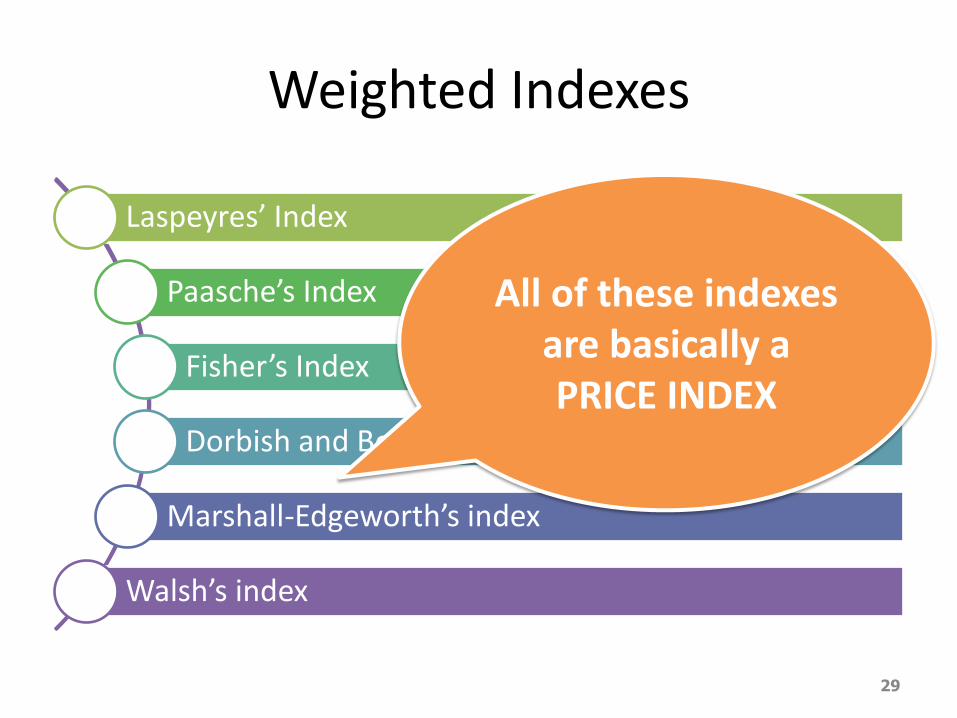
Weighted Indexes
Laspeyres’ Index
Paasche’s Index
Fisher’s Index
Dorbish and Bowley’s Index
Marshall-Edgeworth’s index
Walsh’s index
29
All of these indexes are basically a PRICE INDEX
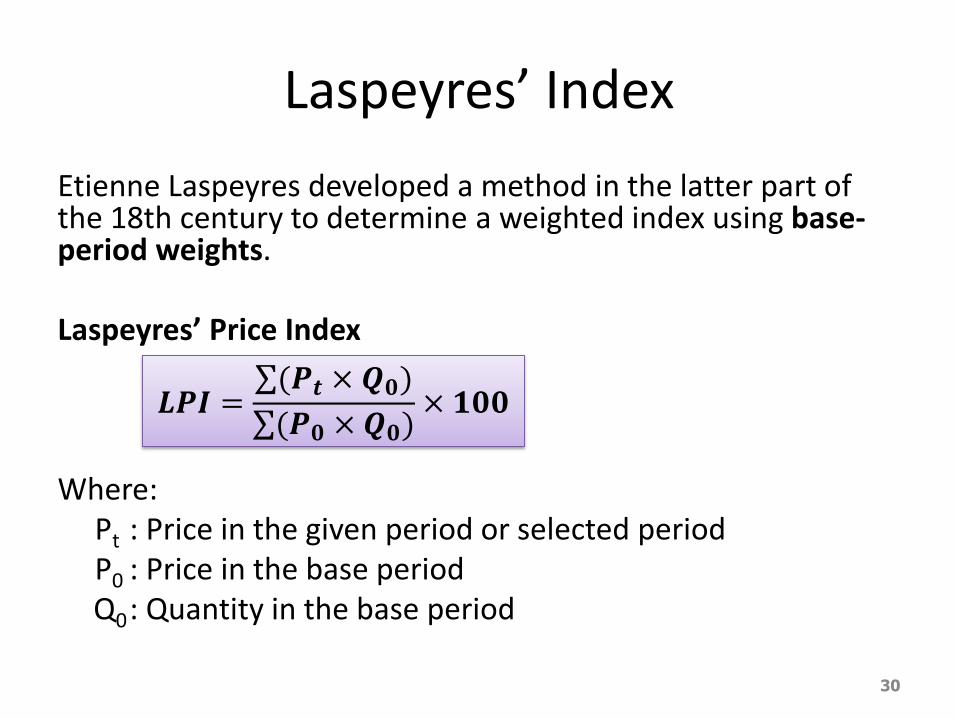
Laspeyres’ Index
Etienne Laspeyres developed a method in the latter part of the 18th century to determine a weighted index using base-period weights.
Laspeyres’ Price Index
Where: Pt : Price in the given period or selected period P0 : Price in the base period
Q0 : Quantity in the base period
30
𝑳𝑷𝑰 = (𝑷𝒕 × 𝑸𝟎)
(𝑷𝟎 × 𝑸𝟎)× 𝟏𝟎𝟎
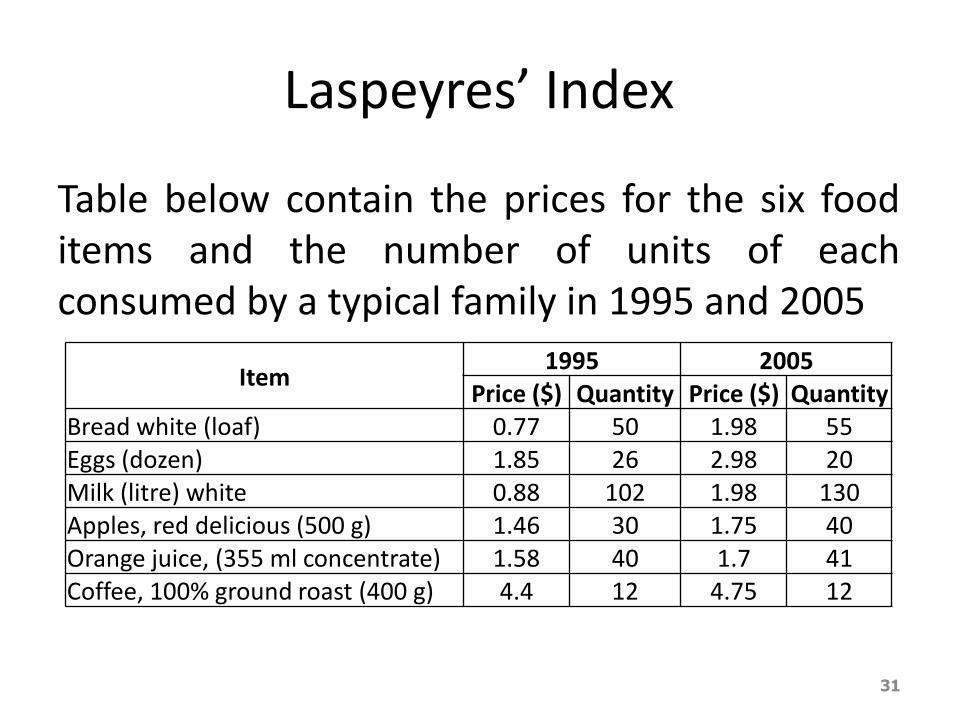
Laspeyres’ Index
Table below contain the prices for the six food items and the number of units of each consumed by a typical family in 1995 and 2005
31
Item 1995 2005
Price ($) Quantity Price ($) Quantity Bread white (loaf) 0.77 50 1.98 55 Eggs (dozen) 1.85 26 2.98 20 Milk (litre) white 0.88 102 1.98 130 Apples, red delicious (500 g) 1.46 30 1.75 40 Orange juice, (355 ml concentrate) 1.58 40 1.7 41 Coffee, 100% ground roast (400 g) 4.4 12 4.75 12
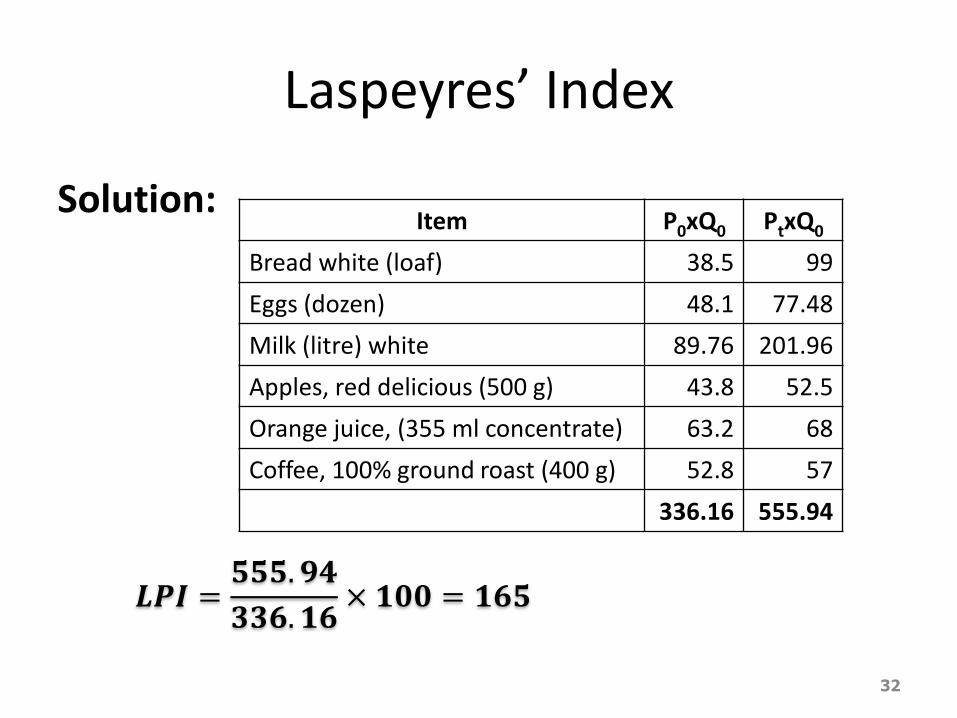
Laspeyres’ Index
Solution:
32
Item P0xQ0 PtxQ0
Bread white (loaf) 38.5 99
Eggs (dozen) 48.1 77.48
Milk (litre) white 89.76 201.96
Apples, red delicious (500 g) 43.8 52.5
Orange juice, (355 ml concentrate) 63.2 68
Coffee, 100% ground roast (400 g) 52.8 57
336.16 555.94
𝑳𝑷𝑰 =𝟓𝟓𝟓. 𝟗𝟒
𝟑𝟑𝟔. 𝟏𝟔× 𝟏𝟎𝟎 = 𝟏𝟔𝟓

Paasche’s Index
The Paasche index is an alternative. The procedure is similar, but instead of using base period weights, we use current period weights. Paasche’s Price Index
Where: Pt : Price in the given period or selected period P0 : Price in the base period
Qt : Quantity in the given period or selected period
33
𝑷𝑷𝑰 = (𝑷𝒕 × 𝑸𝒕)
(𝑷𝟎 × 𝑸𝒕)× 𝟏𝟎𝟎

Paasche’s Index
Table below contain the prices for the six food items and the number of units of each consumed by a typical family in 1995 and 2005
34
Item 1995 2005
Price ($) Quantity Price ($) Quantity Bread white (loaf) 0.77 50 1.98 55 Eggs (dozen) 1.85 26 2.98 20 Milk (litre) white 0.88 102 1.98 130 Apples, red delicious (500 g) 1.46 30 1.75 40 Orange juice, (355 ml concentrate) 1.58 40 1.7 41 Coffee, 100% ground roast (400 g) 4.4 12 4.75 12
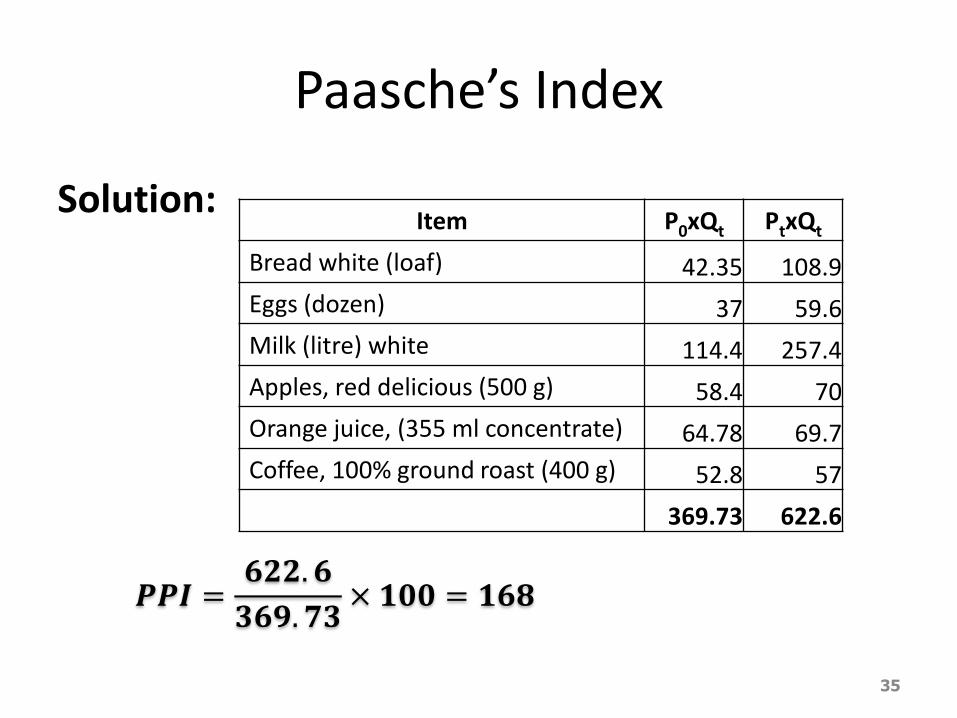
Paasche’s Index
Solution:
35
Item P0xQt PtxQt
Bread white (loaf) 42.35 108.9
Eggs (dozen) 37 59.6
Milk (litre) white 114.4 257.4
Apples, red delicious (500 g) 58.4 70
Orange juice, (355 ml concentrate) 64.78 69.7
Coffee, 100% ground roast (400 g) 52.8 57
369.73 622.6
𝑷𝑷𝑰 =𝟔𝟐𝟐. 𝟔
𝟑𝟔𝟗. 𝟕𝟑× 𝟏𝟎𝟎 = 𝟏𝟔𝟖
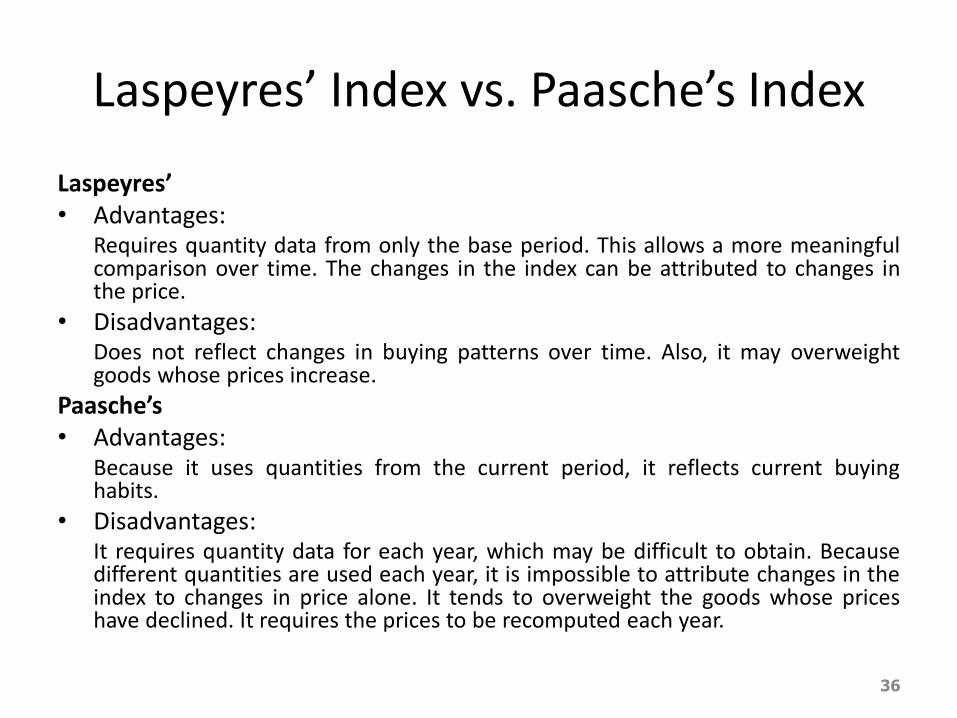
Laspeyres’ Index vs. Paasche’s Index
Laspeyres’ • Advantages:
Requires quantity data from only the base period. This allows a more meaningful comparison over time. The changes in the index can be attributed to changes in the price.
• Disadvantages: Does not reflect changes in buying patterns over time. Also, it may overweight goods whose prices increase.
Paasche’s • Advantages:
Because it uses quantities from the current period, it reflects current buying habits.
• Disadvantages: It requires quantity data for each year, which may be difficult to obtain. Because different quantities are used each year, it is impossible to attribute changes in the index to changes in price alone. It tends to overweight the goods whose prices have declined. It requires the prices to be recomputed each year.
36
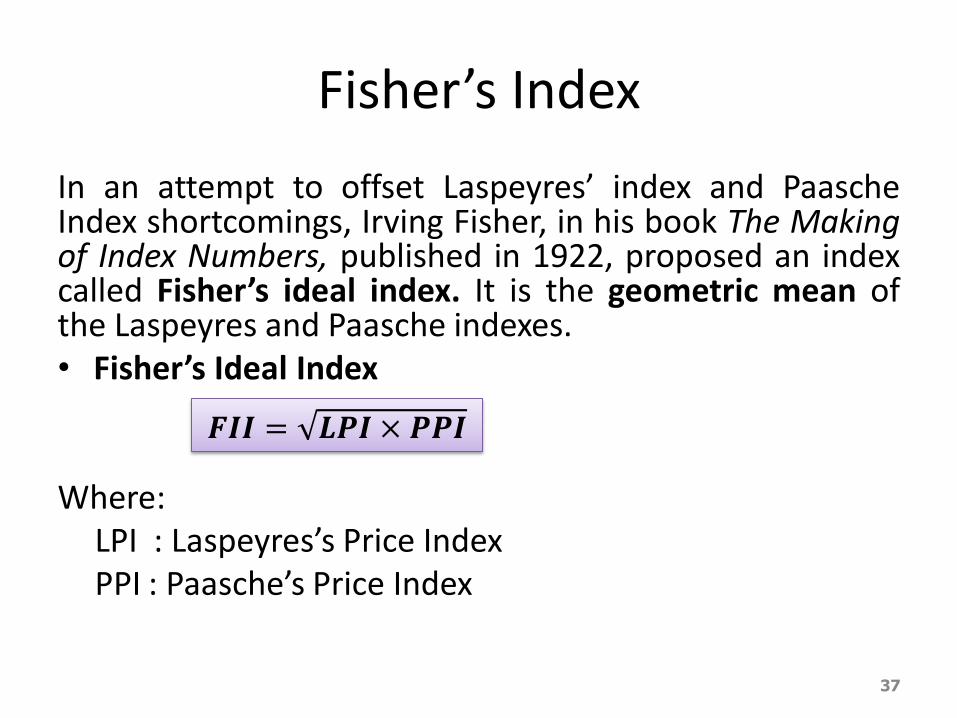
Fisher’s Index
In an attempt to offset Laspeyres’ index and Paasche Index shortcomings, Irving Fisher, in his book The Making of Index Numbers, published in 1922, proposed an index called Fisher’s ideal index. It is the geometric mean of the Laspeyres and Paasche indexes. • Fisher’s Ideal Index
Where: LPI : Laspeyres’s Price Index PPI : Paasche’s Price Index
37
𝑭𝑰𝑰 = 𝑳𝑷𝑰 × 𝑷𝑷𝑰

Fisher’s Index
From the problem before, we got: • LPI = 165
• PPI = 168
Therefore,
38
𝑭𝑰𝑰 = 𝟏𝟔𝟓 × 𝟏𝟔𝟖 = 𝟏𝟔𝟔
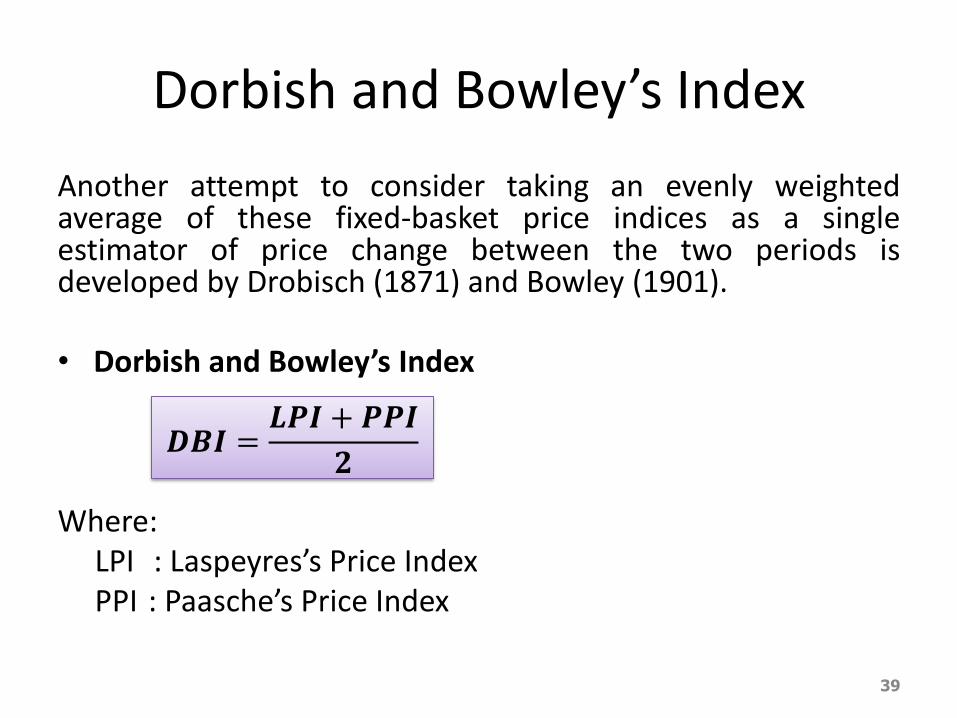
Dorbish and Bowley’s Index
Another attempt to consider taking an evenly weighted average of these fixed-basket price indices as a single estimator of price change between the two periods is developed by Drobisch (1871) and Bowley (1901). • Dorbish and Bowley’s Index
Where: LPI : Laspeyres’s Price Index PPI : Paasche’s Price Index
39
𝑫𝑩𝑰 =𝑳𝑷𝑰 + 𝑷𝑷𝑰
𝟐

Dorbish and Bowley’s Index
From the problem before, we got: • LPI = 165
• PPI = 168
Therefore,
40
𝑫𝑩𝑰 =𝟏𝟔𝟓 + 𝟏𝟔𝟖
𝟐= 𝟏𝟔𝟔. 𝟓
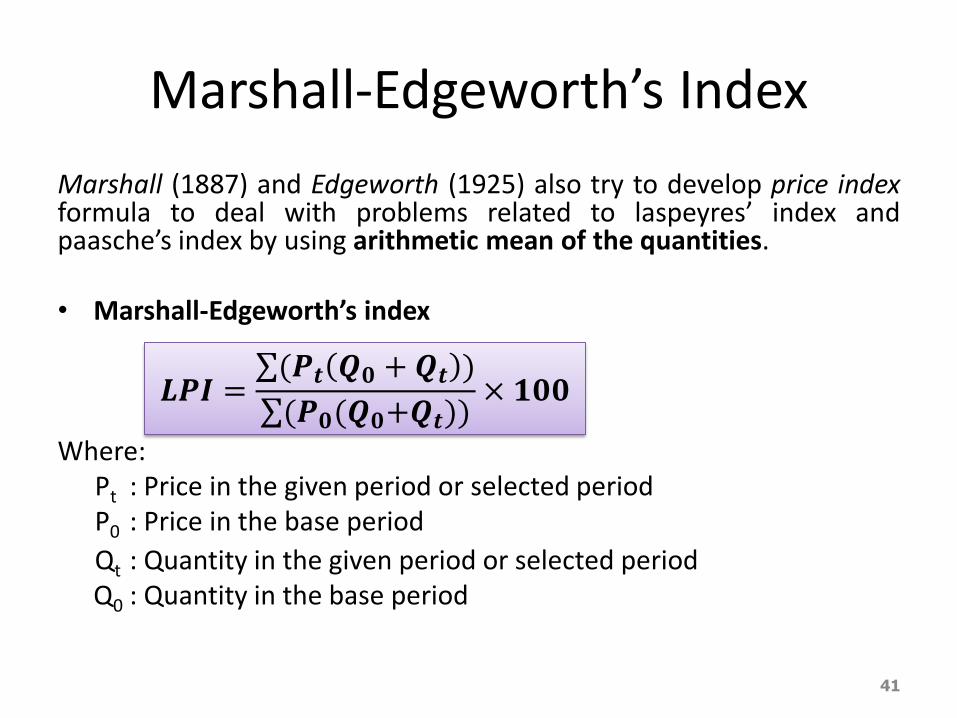
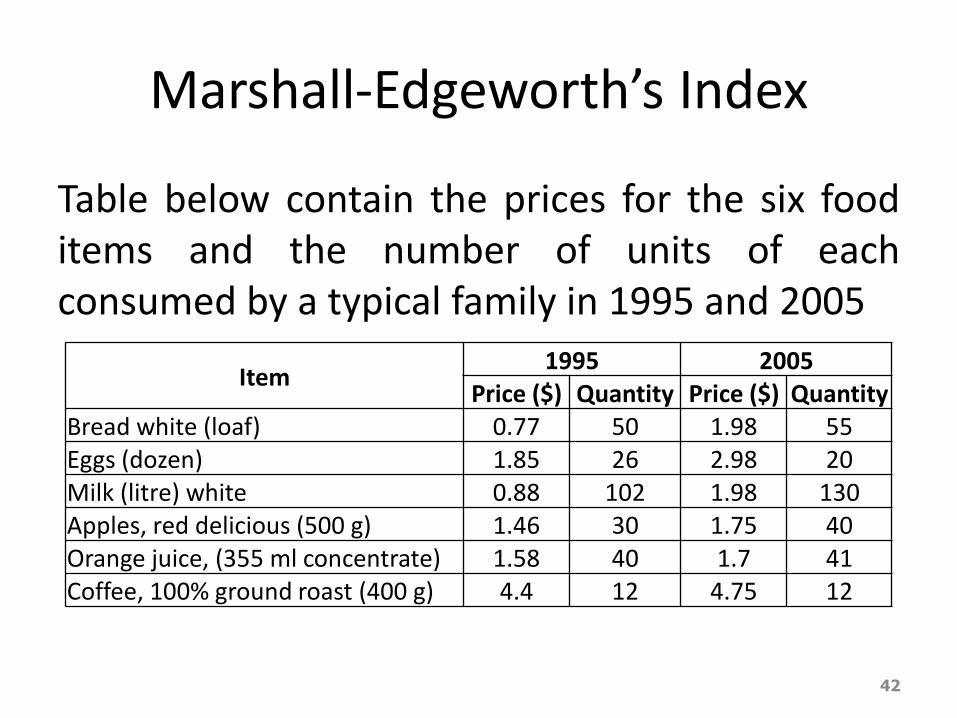
Marshall-Edgeworth’s Index
Marshall (1887) and Edgeworth (1925) also try to develop price index formula to deal with problems related to laspeyres’ index and paasche’s index by using arithmetic mean of the quantities. • Marshall-Edgeworth’s index
Where: Pt : Price in the given period or selected period P0 : Price in the base period
Qt : Quantity in the given period or selected period
Q0 : Quantity in the base period
41
𝑳𝑷𝑰 = (𝑷𝒕 𝑸𝟎 +𝑸𝒕 )
(𝑷𝟎(𝑸𝟎+𝑸𝒕))× 𝟏𝟎𝟎
Marshall-Edgeworth’s Index
Table below contain the prices for the six food items and the number of units of each consumed by a typical family in 1995 and 2005
42
Item 1995 2005
Price ($) Quantity Price ($) Quantity Bread white (loaf) 0.77 50 1.98 55 Eggs (dozen) 1.85 26 2.98 20 Milk (litre) white 0.88 102 1.98 130 Apples, red delicious (500 g) 1.46 30 1.75 40 Orange juice, (355 ml concentrate) 1.58 40 1.7 41 Coffee, 100% ground roast (400 g) 4.4 12 4.75 12

Marshall-Edgeworth’s Index
Solution:
43
Item Q0+Qt P0(Q0+Qt) Pt(Q0+Qt)
Bread white (loaf) 105 80.85 207.9
Eggs (dozen) 46 85.1 137.08
Milk (litre) white 232 204.16 459.36
Apples, red delicious (500 g) 70 102.2 122.5
Orange juice, (355 ml concentrate) 81 127.98 137.7
Coffee, 100% ground roast (400 g) 24 105.6 114
705.89 1178.54
𝑴𝑬𝑰 =𝟏𝟏𝟕𝟖. 𝟓𝟒
𝟕𝟎𝟓. 𝟖𝟗× 𝟏𝟎𝟎 = 𝟏𝟔𝟕
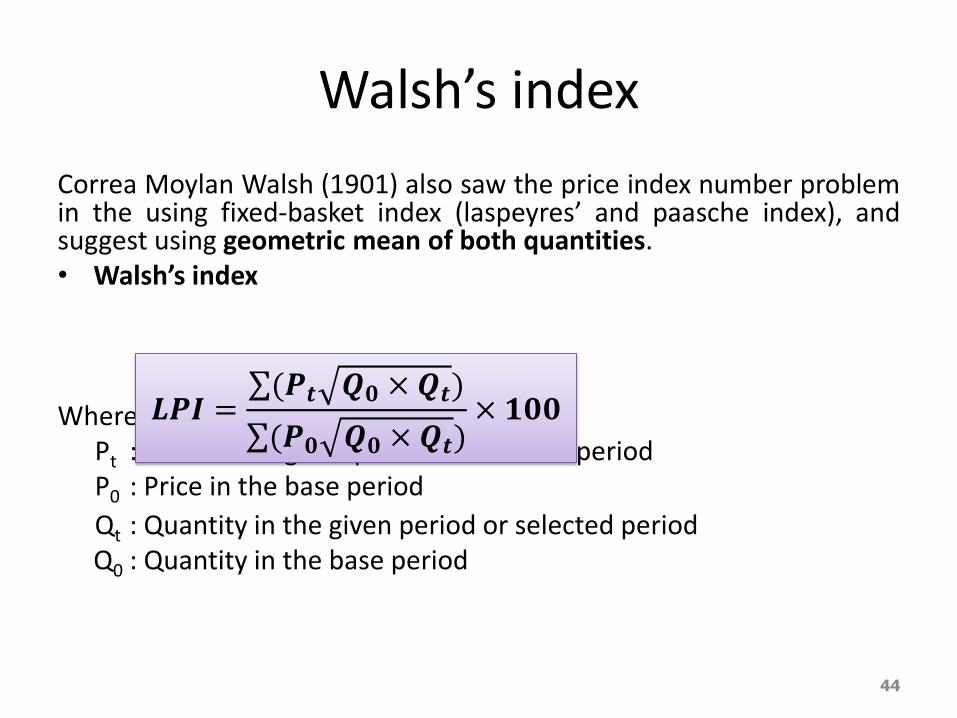
Walsh’s index
Correa Moylan Walsh (1901) also saw the price index number problem in the using fixed-basket index (laspeyres’ and paasche index), and suggest using geometric mean of both quantities. • Walsh’s index
Where: Pt : Price in the given period or selected period P0 : Price in the base period
Qt : Quantity in the given period or selected period
Q0 : Quantity in the base period
44
𝑳𝑷𝑰 = (𝑷𝒕 𝑸𝟎 × 𝑸𝒕)
(𝑷𝟎 𝑸𝟎 × 𝑸𝒕)× 𝟏𝟎𝟎
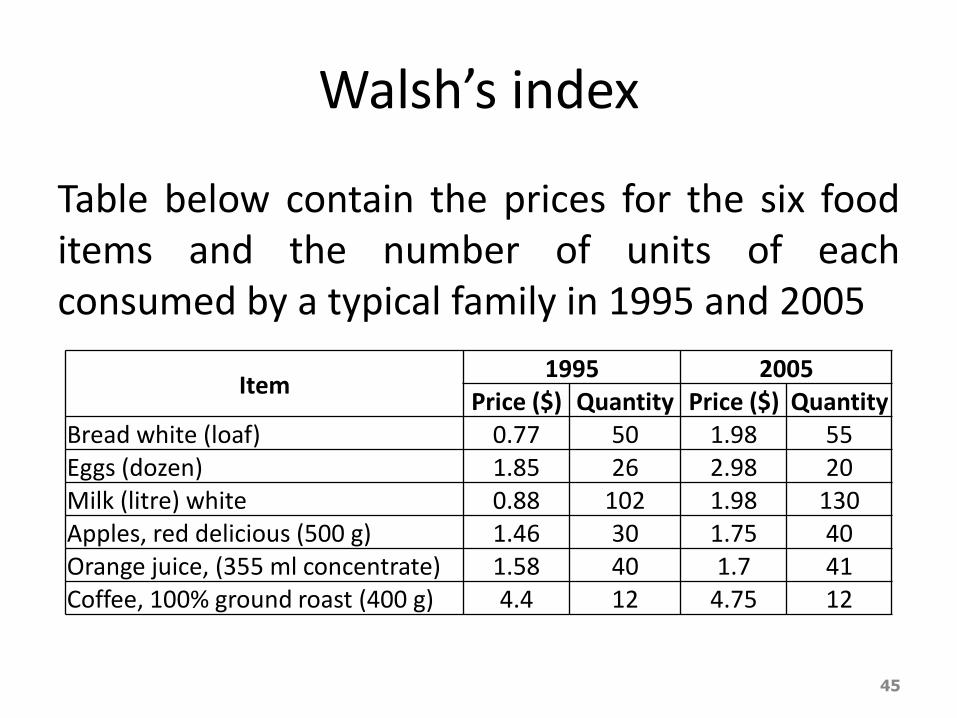
Walsh’s index
Table below contain the prices for the six food items and the number of units of each consumed by a typical family in 1995 and 2005
45
Item 1995 2005
Price ($) Quantity Price ($) Quantity Bread white (loaf) 0.77 50 1.98 55 Eggs (dozen) 1.85 26 2.98 20 Milk (litre) white 0.88 102 1.98 130 Apples, red delicious (500 g) 1.46 30 1.75 40 Orange juice, (355 ml concentrate) 1.58 40 1.7 41 Coffee, 100% ground roast (400 g) 4.4 12 4.75 12

Walsh’s index
Solution:
46
Item √Q0xQt P0(√Q0xQt) Pt(√Q0xQt)
Bread white (loaf) 52.44 40.38 103.83
Eggs (dozen) 22.80 42.19 67.95
Milk (litre) white 115.15 101.33 228.00
Apples, red delicious (500 g) 34.64 50.58 60.62
Orange juice, (355 ml concentrate) 40.50 63.99 68.84
Coffee, 100% ground roast (400 g) 12.00 52.8 57
351.26 586.25
𝑾𝑰 =𝟓𝟖𝟔. 𝟐𝟓
𝟑𝟓𝟏. 𝟐𝟔× 𝟏𝟎𝟎 = 𝟏𝟔𝟕
Special-Purpose Indexes
• The Consumer Price Index (CPI)
• JKSE Composite Index
• NASDAQ Composite Index
• Wholesale Price Index
• Human Development Index
47

EXERCISE
48
Betts Electronics
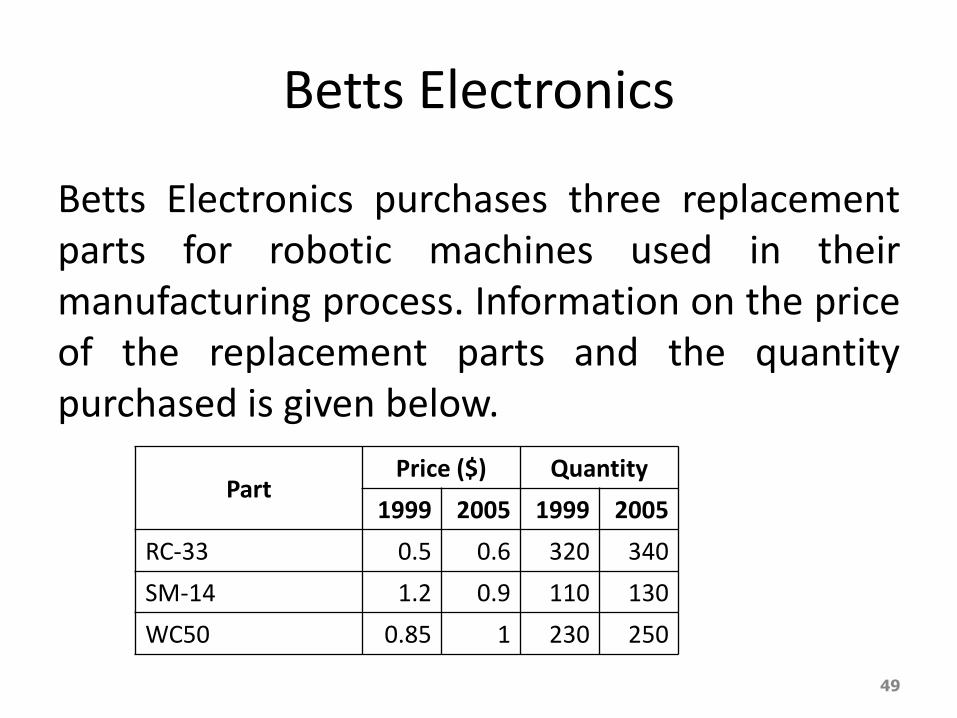
Betts Electronics purchases three replacement parts for robotic machines used in their manufacturing process. Information on the price of the replacement parts and the quantity purchased is given below.
49
Part Price ($) Quantity
1999 2005 1999 2005
RC-33 0.5 0.6 320 340
SM-14 1.2 0.9 110 130
WC50 0.85 1 230 250
Betts Electronics
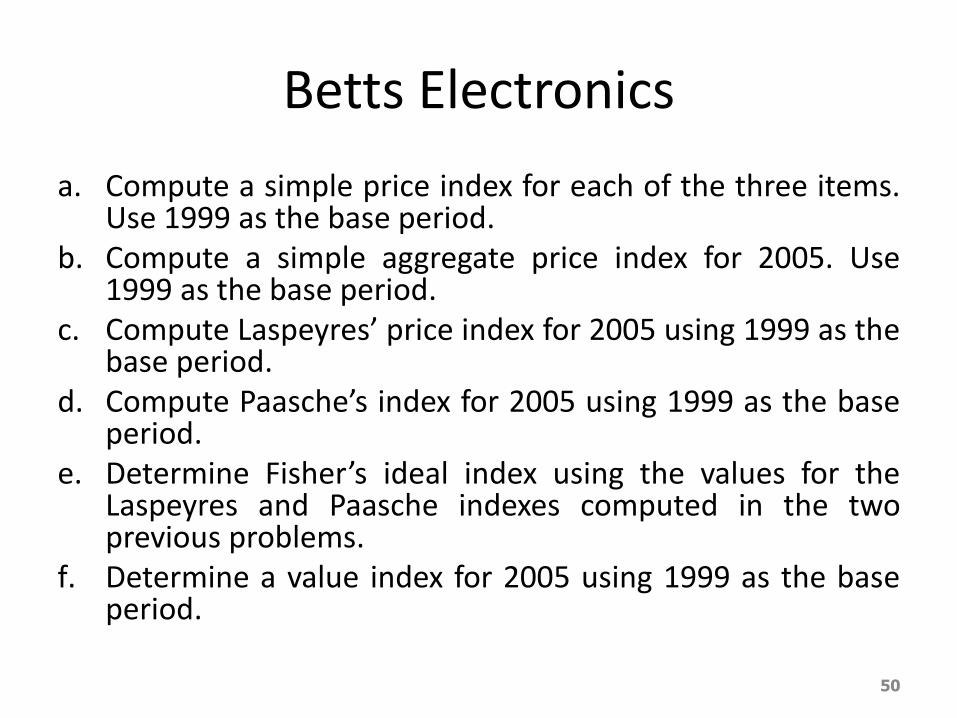
a. Compute a simple price index for each of the three items. Use 1999 as the base period.
b. Compute a simple aggregate price index for 2005. Use 1999 as the base period.
c. Compute Laspeyres’ price index for 2005 using 1999 as the base period.
d. Compute Paasche’s index for 2005 using 1999 as the base period.
e. Determine Fisher’s ideal index using the values for the Laspeyres and Paasche indexes computed in the two previous problems.
f. Determine a value index for 2005 using 1999 as the base period.
50

THANK YOU
51