Equity Exercise Management & Taxing Compliance Project Process Flows
Upload
marlon-dumasCategory
view
454download
0
Business Process Performance Mining
with Staged Process Flows
Hoang Nguyen, Marlon Dumas, Arthur H.M. ter Hofstede,
Marcello La Rosa, and Fabrizio Maria Maggi
CAISE’2016

2
Process Performance Mining (PPM)
/
event log
live event stream
database
process model
conformanceanalysis
processperformance…
if A then B
extract process
knowledge

3
Model-Based PPM Techniques
Performance
Analysis with
Petri net
Disco

4
Issues with Model-Based PPM Techniques
Based on process maps that are sometimes too complex.
Only show a snapshot of process performance aggregated over a period of
time, not how the performance evolves over time.
Animation does not provide a precise measurement, often requires close
human inspection.
Q1: How does the overall process performance evolve over time?
Q2: How formation and dissolution of bottlenecks affects overall
performance?
Q3: How do changes in demand and capacity affect overall process
performance?
The following questions have not been well addressed:

5
“Business Process Performance Analysis with Staged Process Flows”
Process flows are key to:
- Managing customer satisfaction
- Managing service quality
- Managing work load
Companies wish to make their process flows: smooth, predictable and efficient
How to measure the performance of process flows?

6
Approach - Staged Process Flows
Kanban BoardWaiting PatientsSecurity check
Arrival
Departure
(Knock-out)

7
Flow Performance Measurement
t t +
Case 1
Case 2
Case 3

8
Measurement Tools
Cumulative Flow DiagramTime Series Chart
Summary Table

9
Evaluation
Q1: How does the overall process performance evolve over time?
Q2: How formation and dissolution of bottlenecks affect overall performance?
Q3: How do changes in demand and capacity affect overall process performance?
• Process stages are based on the
helpdesk lines
• Size: ~ 8,000 IT requests
• Period: 2 years
BPIC 2012: Loan Origination Process BPIC 2013: IT Incident Handling Process
• Process stages are based on
processing stages of loan applications
• Size: ~ 13,000 applications
• Period: 6 months

10
BPIC 2012: Loan Origination Process
Q1: How does the overall process performance evolve over time?

11
BPIC 2012: Loan Origination Process
Q2: How formation and dissolution of bottlenecks affect overall performance?

12
BPIC 2012: Loan Origination Process
Q3: How do changes in demand and capacity affect overall process performance?

13
Process Performance Analysis with Petrinet Plugin
Spaghetti Model Filtered Model

14
Disco
Spaghetti Model Filtered Model
15
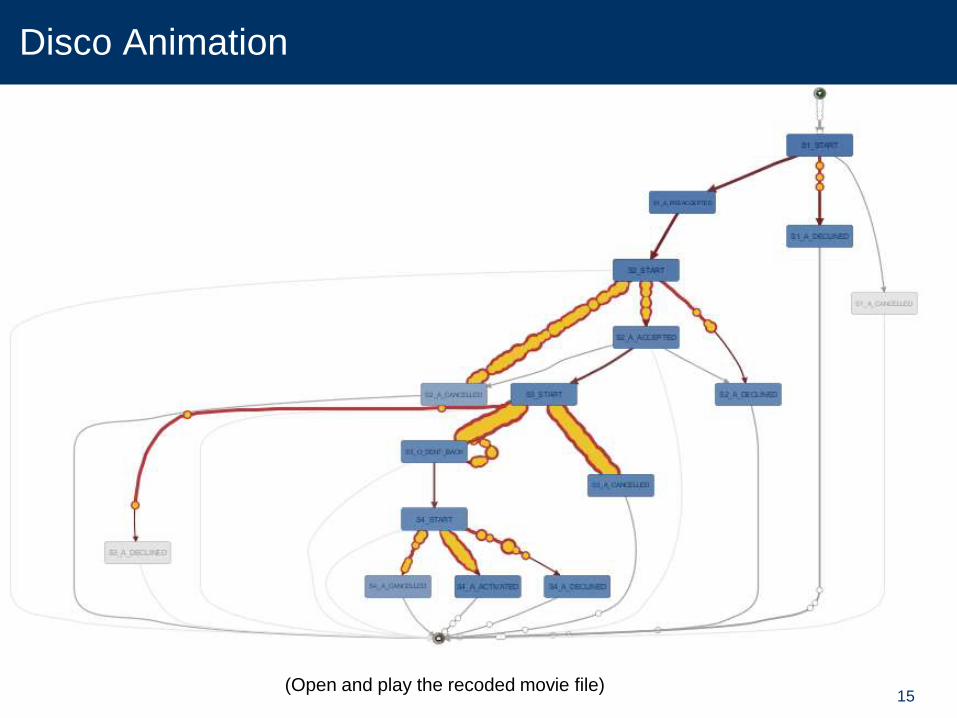
Disco Animation
(Open and play the recoded movie file)

16
Conclusion
Strengths
– Novel performance measures precisely capture process evolution
– Visual analytics showing time-oriented patterns, to support performance
investigation, e.g. bottleneck detection through formation, evolution and
dissolution
Limitations and Future work
– Only applicable to processes where key stages can be detected
– Linear stage model
– Manual identification of stages
– Manual detection of process patterns
– Linear stage model
– Manual identification of stages
– Manual detection of process patterns

17
Thank you!
Q&A