
Finding Your Family in the Second Hand Store - 2015 Conference
Upload
surya-singhCategory
view
1.312download
12
1. Executive Summary
1.1 Introduction
KampQuest.com is an innovative way to help customers lower their education and entertainment
costs by buying and selling used books. Customers can buy or sell books through the website's
combination of e-commerce platform as well as an e-classified system. The service aims to offer
used books to students at the least possible price.
1.2 Product/Services
KampQuest.com is an interface between small scale (second hand) booksellers and customers.
Instead of keeping our own inventory we would keep a live database of the inventory held by our
second hand sellers. Initially we would create a database of all quality-checked books in stock
with the seller and give him a basic android phone with a pre-installed app. The app has two big
buttons to add and remove books. If a customer buys a book through our store, we notify the
seller and he keeps the book aside. On the other hand if the seller sells a marked book to a walk-
in customer he can scan the bar code and it automatically updates our website database. If a
student wants to sell a book he can do so by listing it on our website, but since students are not
authorized sellers, we would provide a “Contact Seller” option instead of a “Buy Now” option if
the seller is a student.
1.2 Market Analysis
According to a study done by us, as on October 2014 the amount a Computer Science
Engineering student would spend if he/she chooses to buy new textbooks would at least be
20,000 INRi. This study does not consider the inflation in 4 years and reference / extra books
which the student would buy. As students/professionals are faced with increasing financial
constraints they try to purchase, and later sell, old text books from small scale book sellers
dealing in used books - this is accompanied by availability issues, price haggling and over
pricing by sellers. College libraries allow students to rent books but that too for a very short
period of time. Furthermore, not all the students and professionals have access to libraries.
According to United States-India Education Foundation there were 16.97 Millionii undergraduate
and graduate enrollments in 2011-12 and a separate survey revealed 26.5 millioniii students took

admission for the same in 2014-15. According to "The National" in 2011iv, India was the world’s
third-largest English book market and “The German Book office’s 2013” report states that
organized retail counts for only 7% of book sales in Indiav. Our core customer segment
(students) are mostly tech-savvy, the Internet penetration among them is pretty high and
increasing. The graphs below show the Growth of Technical Institutions in India and student
intake according to the AICTEvi.
1.3 Financial Consideration
Fig 1.3
1.4 Mission
To be a leader in Online Reused Book Service, to provide students across India, books at
affordable prices with easy delivery and returns. We will realize this by bridging the gap across
the wide second hand books market place by partnering with them with the use of technology
thus offering our customers a massive collection of books across the nation.
1.5 Vision
To be the only name, which people think of when they want to buy used book.
0
1
2
3
4
5
6
7
8
9
Year 1 Year 2 Year 3
x 10
0000
00
2. Product/Service Description
KampQuest.com will provide a first of its kind service for buying and selling second hand books
online. Our services will include doorstep delivery for the books ordered online and a feature to
contact fellow-customers who are selling the books. We are an interface between small-scale
second hand booksellers and customers and would aim to earn a 5% commission in selling books
as well as through advertisement on book covers.
2.1 Sourcing without Inventory
Instead of holding inventory, we would list the books held by various small-scale sellers who
decide to partner with us by keeping a live database of the inventory held by our used book
sellers. Initially we would create a database of all quality-checked books in stock with the seller
and give him a basic android phone with a pre-installed app. This app would have a very simple
user interface - two big buttons to add and remove books. If a customer buys a book through our
store, we notify the seller and he keeps the book aside. On the other hand if the seller sells a
marked book to a walk-in customer he can scan the bar code and it automatically updates our
website database. Only trusted sellers can add new books through the application directly.
2.2 Marketplace
Since the transportation of books would increase the price, internally we function as a
marketplace model. We are developing a graph-like logical structure to connect sellers and pin-
codes as nodes and delivery charges on connections. To deliver a book to a pin code we would
fetch the nearest (in terms of delivery charges) seller to the pin code and deliver the book
accordingly. Sellers are hidden externally from the customers to simplify the purpose of placing
the order, delivery and returns.
2.3 An e-classified
Apart from selling old books through second hand book sellers, we also provide an e-classified
service where students can upload the books they want to sell along with their location, price. If
the seller is a student/customer (not an authorized seller) we would show a “Contact Seller”
option – just like an e-classified service and would link the buyer and the seller without any
profit. This generates traffic on our website and even if the student is unable to find another
student who is selling that book, we would be selling it as well.
2.2 Delivery
Initially we would be using third party delivery services, and then slowly move towards
integrating our own delivery in specific cities. Since most of the deliveries will be local, delivery
charges would be less & they would be partly borne by us and partly by our customers.
2.3 Advertisements
KampQuest.com would offer targeted advertising to specific demographics (different streams of
study, locations or colleges) through stickers on the back of the books, bookmark inserts and
book covers at nominal rates to clients.
2.4 Technology
We will have a website for customers and an android application with a phone for sellers. All our
software would be developed in-house by our experienced developers.
2.5 Product Development
The software development is almost complete and we have contacted two booksellers to start
listing their inventory - we would be running a pilot program in Pilani from January, 2015 and
then launching the service in 6 months.
3. Market/Customer Analysis
3.1 The Problem
According to a study done by us, as on October 2014 the amount a Computer Science
Engineering student would spend if he/she chooses to buy new textbooks would at least be
20,000 INRvii. This study does not consider the inflation in 4 years and reference / extra books
which the student would buy. As students/professionals are faced with increasing financial
constraints they try to purchase, and later sell, old text books from small scale book sellers
dealing in used books - this is accompanied by availability issues, price haggling and over
pricing by sellers. College libraries allow students to rent books but that too for a very short
period of time. Furthermore, not all the students and professionals have access to libraries.
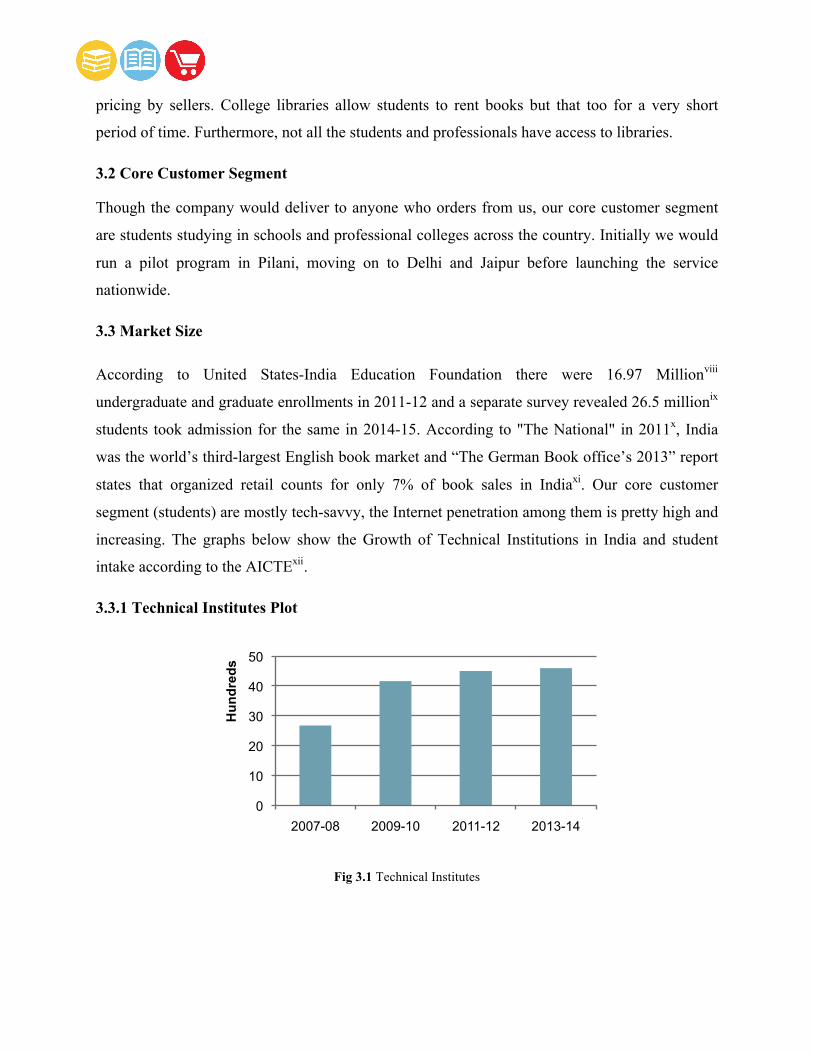
3.2 Core Customer Segment
Though the company would deliver to anyone who orders from us, our core customer segment
are students studying in schools and professional colleges across the country. Initially we would
run a pilot program in Pilani, moving on to Delhi and Jaipur before launching the service
nationwide.
3.3 Market Size
According to United States-India Education Foundation there were 16.97 Millionviii
undergraduate and graduate enrollments in 2011-12 and a separate survey revealed 26.5 millionix
students took admission for the same in 2014-15. According to "The National" in 2011x, India
was the world’s third-largest English book market and “The German Book office’s 2013” report
states that organized retail counts for only 7% of book sales in Indiaxi. Our core customer
segment (students) are mostly tech-savvy, the Internet penetration among them is pretty high and
increasing. The graphs below show the Growth of Technical Institutions in India and student
intake according to the AICTExii.
3.3.1 Technical Institutes Plot
Fig 3.1 Technical Institutes
0
10
20
30
40
50
2007-08 2009-10 2011-12 2013-14
Hun
dred
s
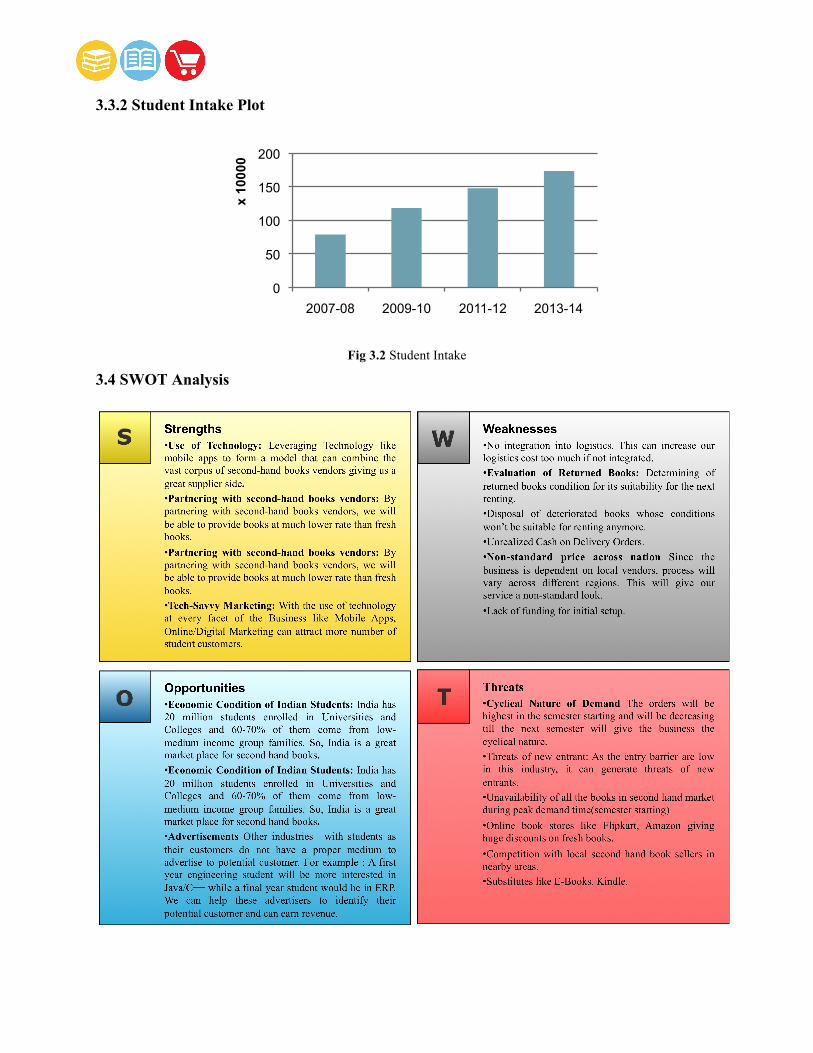
3.3.2 Student Intake Plot
Fig 3.2 Student Intake
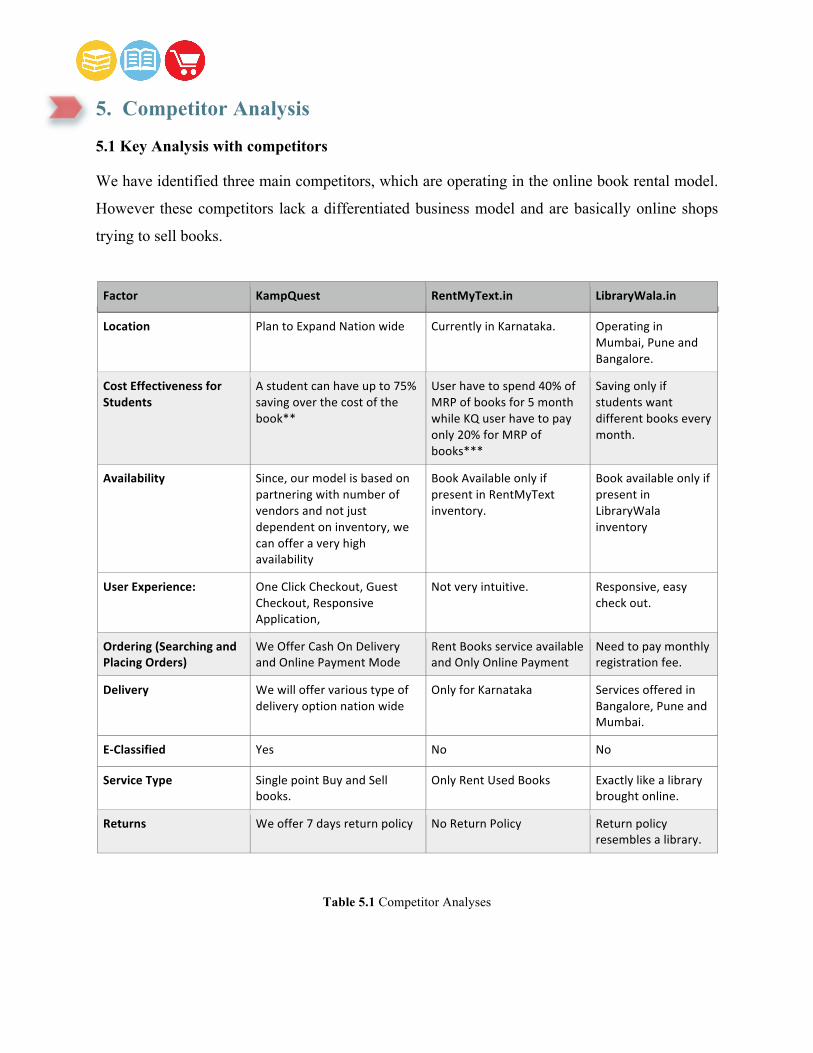
3.4 SWOT Analysis
0
50
100
150
200
2007-08 2009-10 2011-12 2013-14
x 10
000

4. Sales and Marketing Plan
KampQuest.com major market segment would be the all undergraduate and graduate students in
India. We aim to simplify the buying/selling of textbooks during each semester, develop a trust
based relationship with students and to create a trend of re-using old books & selling them back
rather than buying new books only to throw them away at the end of the course.
4.1 Alliances with Colleges
We aim to form alliances with colleges and create college specific websites that would list books
by streams, subjects and courses. Apart from our main website, we would create a white-label
website which can be modified according to the requirements of the college.
4.2 Building trusted customer relations
As mentioned earlier, we attempt to appeal to all students in the need of textbooks for
coursework or leisure reading. Once drawing the costumers in we would keep customers coming
back since apart from solving a major problem with in obtaining old textbooks we would also be
providing a platform for the students to sell the books.
4.3 Online Marketing
Social platforms and our SEO – optimized website would be a key component in drawing as well
as retaining customers.
4.4 Print Media & Branding
We would use tradition print media like flyers, billboards, posters during semester cycles. The
books we sell would have branded packaging and free goodies like motivational stickers and
bookmarks with our branding.
4.5 Physical Presence
KampQuest.com also aims to create a temporary physical presence in colleges by maintaining
temporary kiosks during the start / end of a semester and college fests.
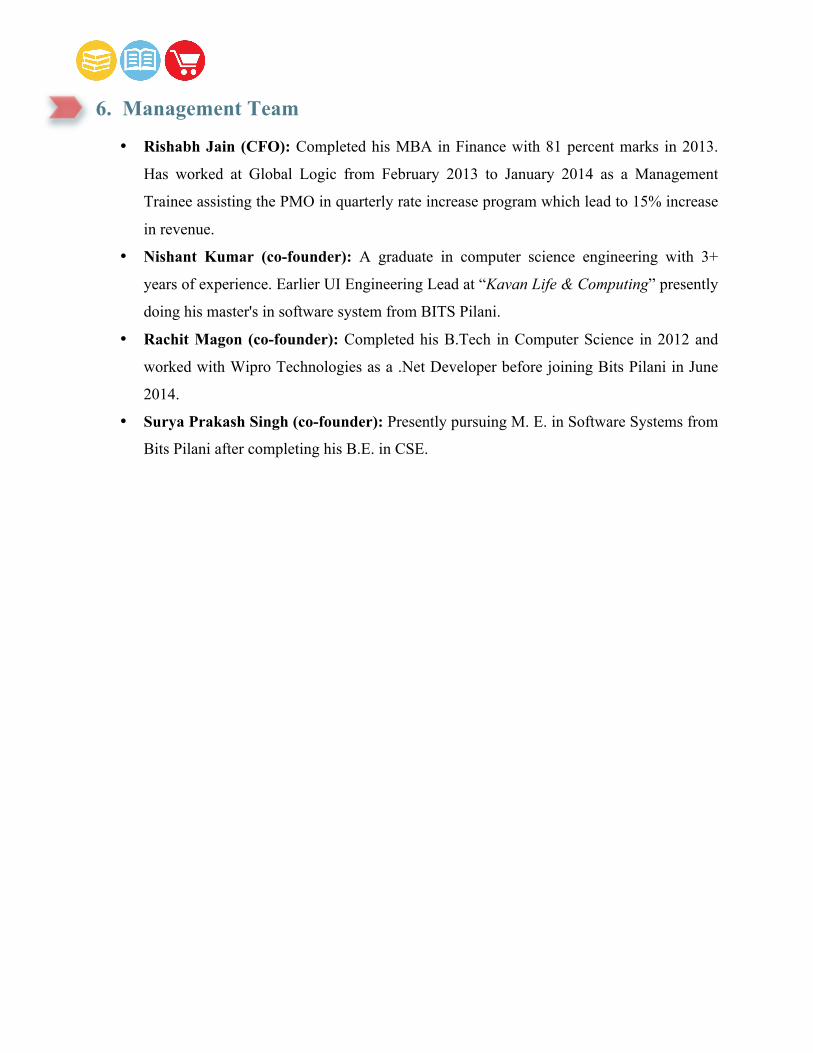
5. Competitor Analysis
5.1 Key Analysis with competitors
We have identified three main competitors, which are operating in the online book rental model.
However these competitors lack a differentiated business model and are basically online shops
trying to sell books.
Factor KampQuest RentMyText.in LibraryWala.in
Location Plan to Expand Nation wide Currently in Karnataka. Operating in Mumbai, Pune and Bangalore.
Cost Effectiveness for Students
A student can have up to 75% saving over the cost of the book**
User have to spend 40% of MRP of books for 5 month while KQ user have to pay only 20% for MRP of books***
Saving only if students want different books every month.
Availability Since, our model is based on partnering with number of vendors and not just dependent on inventory, we can offer a very high availability
Book Available only if present in RentMyText inventory.
Book available only if present in LibraryWala inventory
User Experience: One Click Checkout, Guest Checkout, Responsive Application,
Not very intuitive. Responsive, easy check out.
Ordering (Searching and Placing Orders)
We Offer Cash On Delivery and Online Payment Mode
Rent Books service available and Only Online Payment
Need to pay monthly registration fee.
Delivery We will offer various type of delivery option nation wide
Only for Karnataka Services offered in Bangalore, Pune and Mumbai.
E-‐Classified Yes No No
Service Type Single point Buy and Sell books.
Only Rent Used Books Exactly like a library brought online.
Returns We offer 7 days return policy No Return Policy Return policy resembles a library.
Table 5.1 Competitor Analyses
6. Management Team
• Rishabh Jain (CFO): Completed his MBA in Finance with 81 percent marks in 2013.
Has worked at Global Logic from February 2013 to January 2014 as a Management
Trainee assisting the PMO in quarterly rate increase program which lead to 15% increase
in revenue.
• Nishant Kumar (co-founder): A graduate in computer science engineering with 3+
years of experience. Earlier UI Engineering Lead at “Kavan Life & Computing” presently
doing his master's in software system from BITS Pilani.
• Rachit Magon (co-founder): Completed his B.Tech in Computer Science in 2012 and
worked with Wipro Technologies as a .Net Developer before joining Bits Pilani in June
2014.
• Surya Prakash Singh (co-founder): Presently pursuing M. E. in Software Systems from
Bits Pilani after completing his B.E. in CSE.
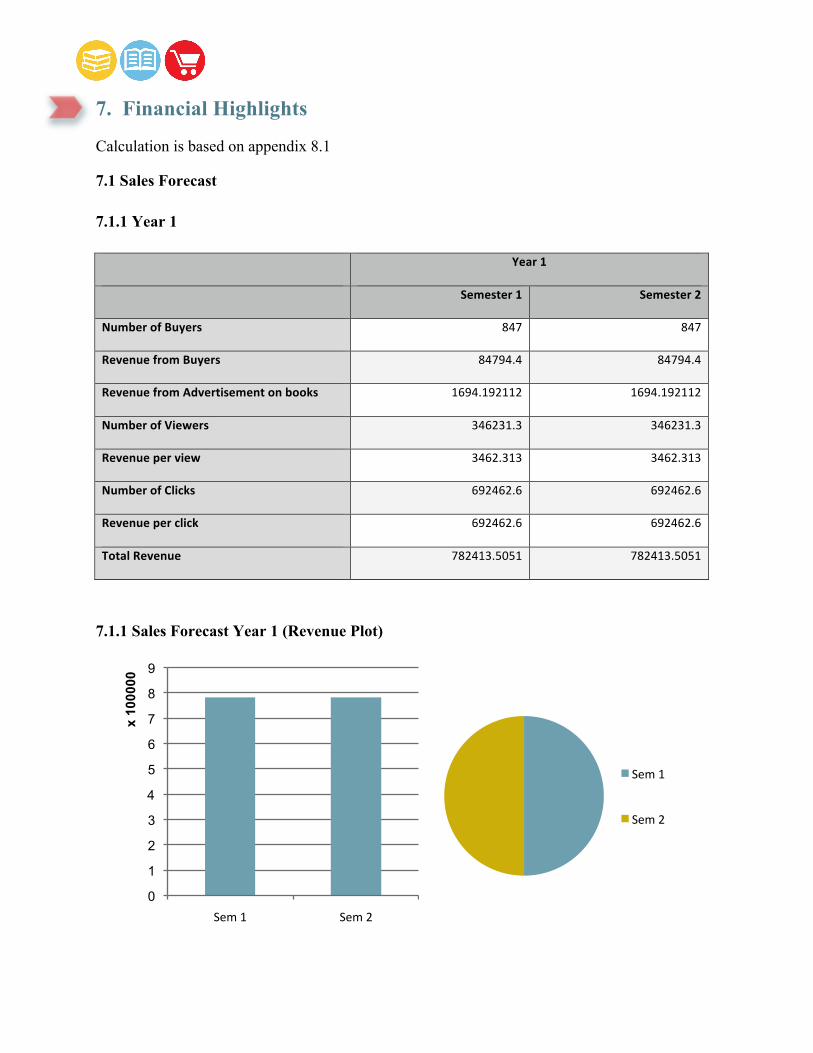
7. Financial Highlights
Calculation is based on appendix 8.1
7.1 Sales Forecast
7.1.1 Year 1
Year 1
Semester 1 Semester 2
Number of Buyers 847 847
Revenue from Buyers 84794.4 84794.4
Revenue from Advertisement on books 1694.192112 1694.192112
Number of Viewers 346231.3 346231.3
Revenue per view 3462.313 3462.313
Number of Clicks 692462.6 692462.6
Revenue per click 692462.6 692462.6
Total Revenue 782413.5051 782413.5051
7.1.1 Sales Forecast Year 1 (Revenue Plot)
0
1
2
3
4
5
6
7
8
9
Sem 1 Sem 2
x 10
0000
Sem 1
Sem 2
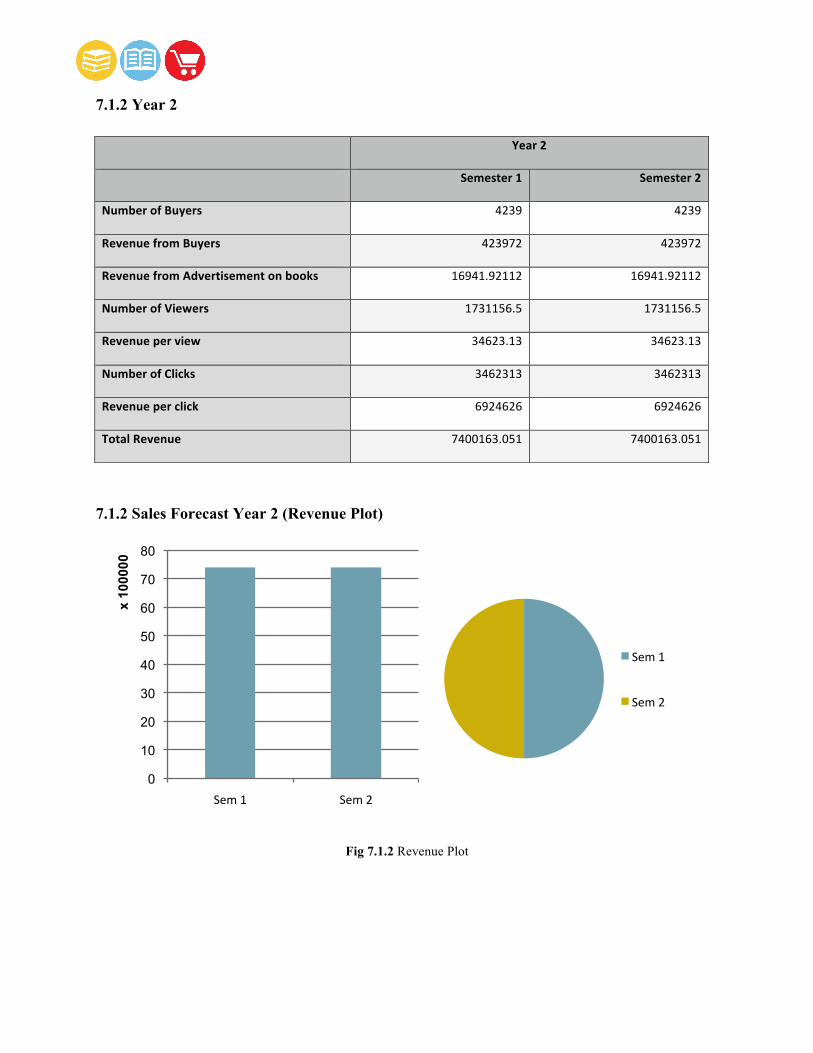
7.1.2 Year 2
Year 2
Semester 1 Semester 2
Number of Buyers 4239 4239
Revenue from Buyers 423972 423972
Revenue from Advertisement on books 16941.92112 16941.92112
Number of Viewers 1731156.5 1731156.5
Revenue per view 34623.13 34623.13
Number of Clicks 3462313 3462313
Revenue per click 6924626 6924626
Total Revenue 7400163.051 7400163.051
7.1.2 Sales Forecast Year 2 (Revenue Plot)
Fig 7.1.2 Revenue Plot
0
10
20
30
40
50
60
70
80
Sem 1 Sem 2
x 10
0000
Sem 1
Sem 2

7.1.3 Year 3
Year 3
Semester 1 Semester 2
Number of Buyers 8479 8479
Revenue from Buyers 847944 847944
Revenue from Advertisement on books 8470960.56 8470960.56
Number of Viewers 5539700.8 5539700.8
Revenue per view 166191.024 166191.024
Number of Clicks 11079401.6 11079401.6
Revenue per click 33238204.8 33238204.8
Total Revenue 42723300.38 42723300.38
7.1.2 Sales Forecast Year 3 (Revenue Plot)
Fig 7.1.2 Revenue Plot
0
50
100
150
200
250
300
350
400
450
Sem 1 Sem 2
x 10
0000
Sem 1
Sem 2
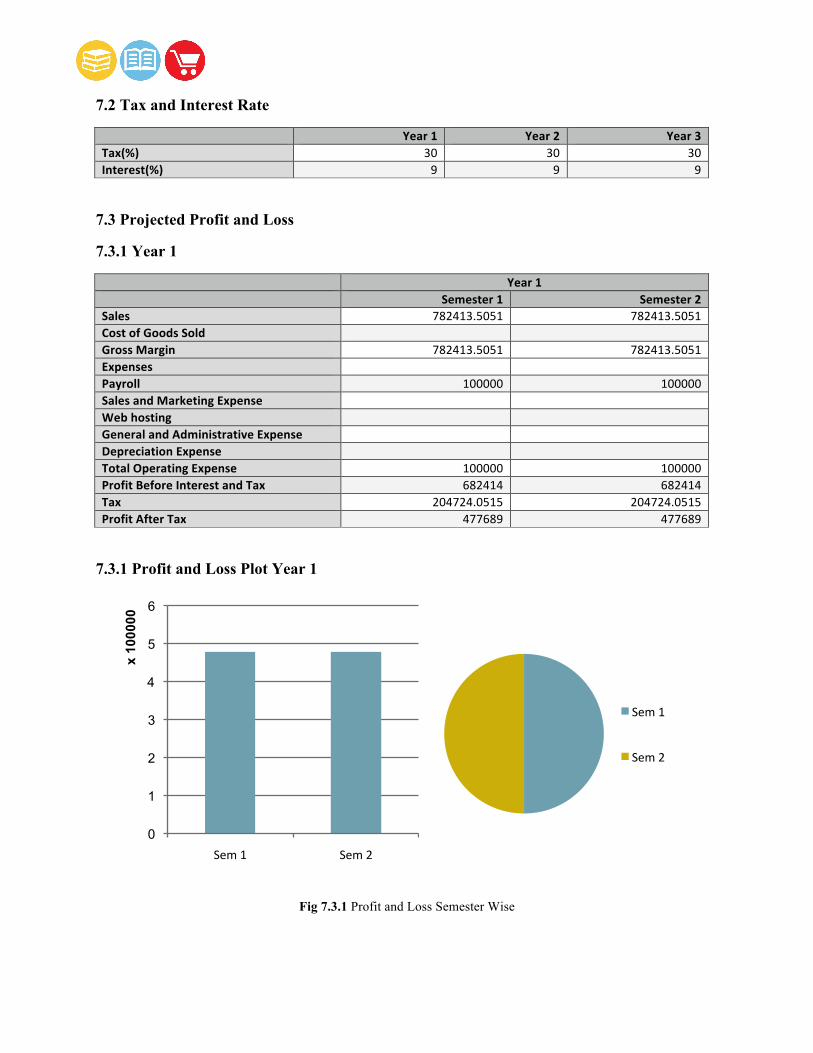
7.2 Tax and Interest Rate
Year 1 Year 2 Year 3 Tax(%) 30 30 30 Interest(%) 9 9 9
7.3 Projected Profit and Loss
7.3.1 Year 1
Year 1 Semester 1 Semester 2 Sales 782413.5051 782413.5051 Cost of Goods Sold Gross Margin 782413.5051 782413.5051 Expenses Payroll 100000 100000 Sales and Marketing Expense Web hosting General and Administrative Expense Depreciation Expense Total Operating Expense 100000 100000 Profit Before Interest and Tax 682414 682414 Tax 204724.0515 204724.0515 Profit After Tax 477689 477689
7.3.1 Profit and Loss Plot Year 1
Fig 7.3.1 Profit and Loss Semester Wise
0
1
2
3
4
5
6
Sem 1 Sem 2
x 10
0000
Sem 1
Sem 2
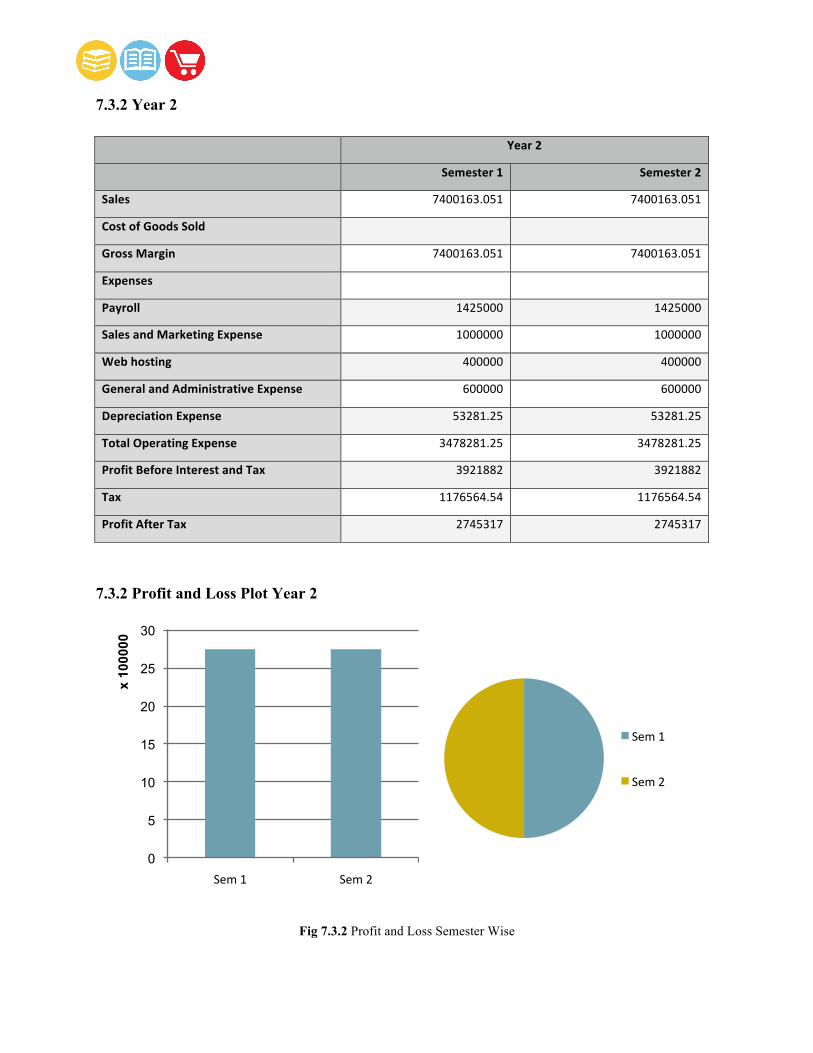
7.3.2 Year 2
Year 2
Semester 1 Semester 2
Sales 7400163.051 7400163.051
Cost of Goods Sold
Gross Margin 7400163.051 7400163.051
Expenses
Payroll 1425000 1425000
Sales and Marketing Expense 1000000 1000000
Web hosting 400000 400000
General and Administrative Expense 600000 600000
Depreciation Expense 53281.25 53281.25
Total Operating Expense 3478281.25 3478281.25
Profit Before Interest and Tax 3921882 3921882
Tax 1176564.54 1176564.54
Profit After Tax 2745317 2745317
7.3.2 Profit and Loss Plot Year 2
Fig 7.3.2 Profit and Loss Semester Wise
0
5
10
15
20
25
30
Sem 1 Sem 2
x 10
0000
Sem 1
Sem 2
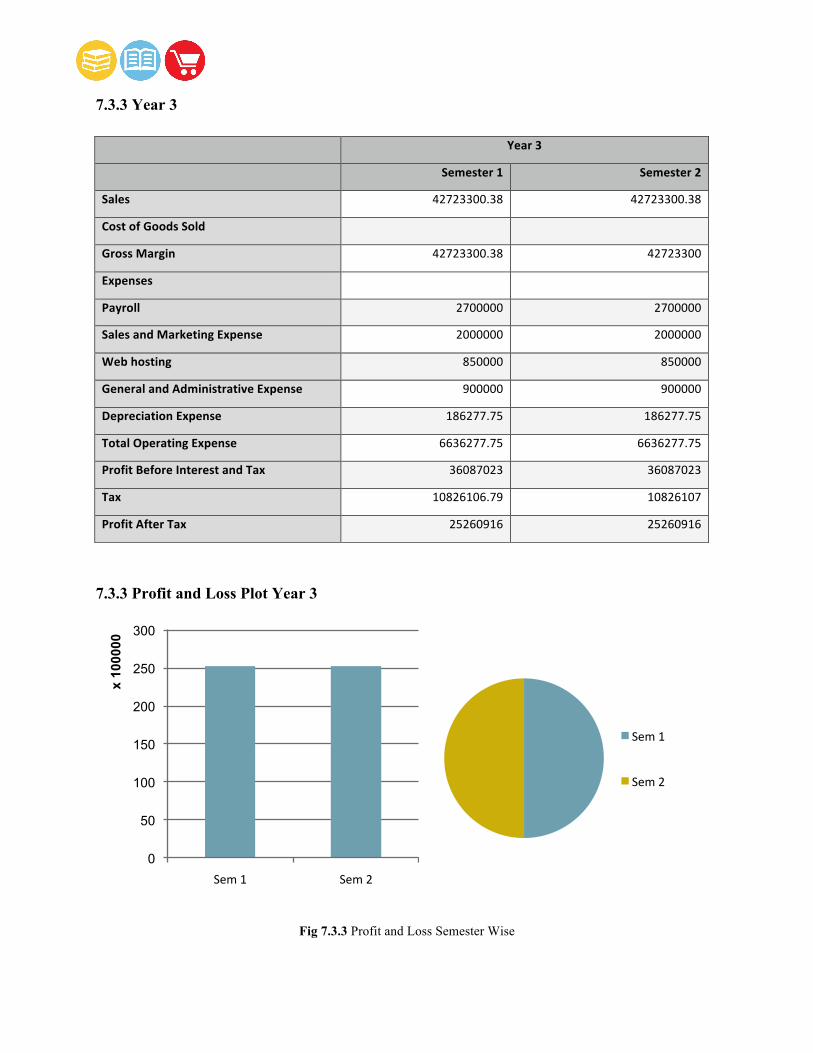
7.3.3 Year 3
Year 3
Semester 1 Semester 2
Sales 42723300.38 42723300.38
Cost of Goods Sold
Gross Margin 42723300.38 42723300
Expenses
Payroll 2700000 2700000
Sales and Marketing Expense 2000000 2000000
Web hosting 850000 850000
General and Administrative Expense 900000 900000
Depreciation Expense 186277.75 186277.75
Total Operating Expense 6636277.75 6636277.75
Profit Before Interest and Tax 36087023 36087023
Tax 10826106.79 10826107
Profit After Tax 25260916 25260916
7.3.3 Profit and Loss Plot Year 3
Fig 7.3.3 Profit and Loss Semester Wise
0
50
100
150
200
250
300
Sem 1 Sem 2
x 10
0000
Sem 1
Sem 2
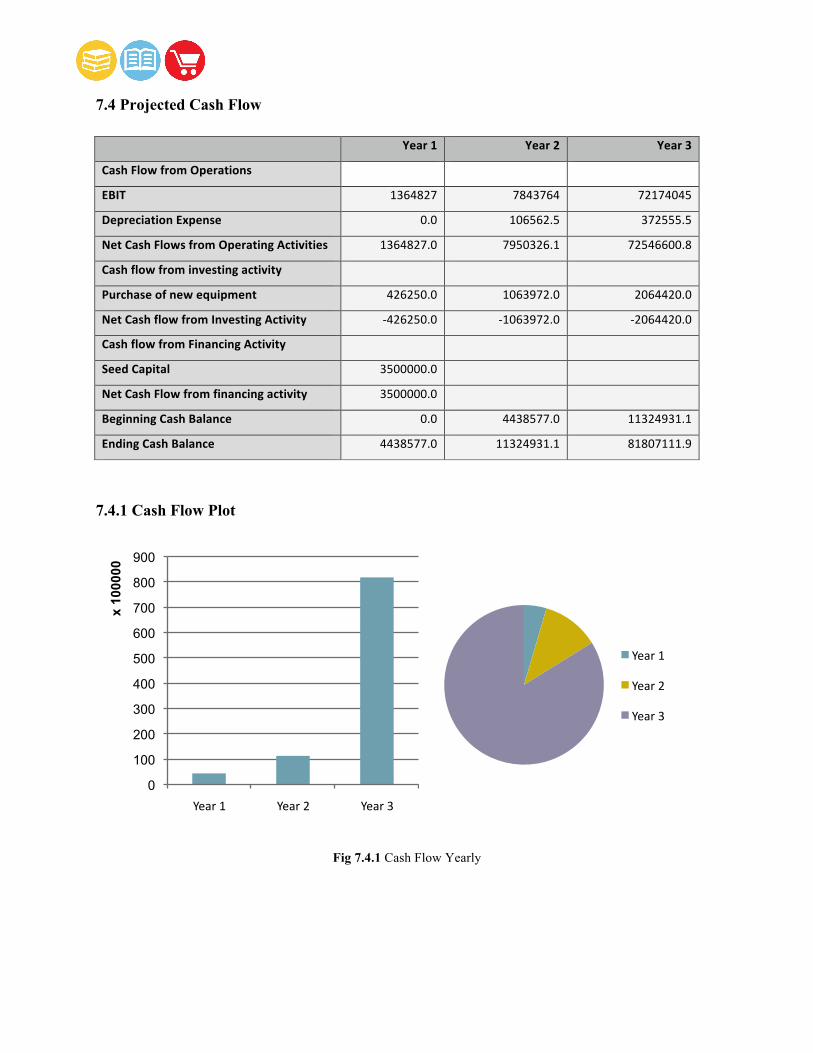
7.4 Projected Cash Flow
Year 1 Year 2 Year 3
Cash Flow from Operations
EBIT 1364827 7843764 72174045
Depreciation Expense 0.0 106562.5 372555.5
Net Cash Flows from Operating Activities 1364827.0 7950326.1 72546600.8
Cash flow from investing activity
Purchase of new equipment 426250.0 1063972.0 2064420.0
Net Cash flow from Investing Activity -‐426250.0 -‐1063972.0 -‐2064420.0
Cash flow from Financing Activity
Seed Capital 3500000.0
Net Cash Flow from financing activity 3500000.0
Beginning Cash Balance 0.0 4438577.0 11324931.1
Ending Cash Balance 4438577.0 11324931.1 81807111.9
7.4.1 Cash Flow Plot
Fig 7.4.1 Cash Flow Yearly
0
100
200
300
400
500
600
700
800
900
Year 1 Year 2 Year 3
x 10
0000
Year 1
Year 2
Year 3
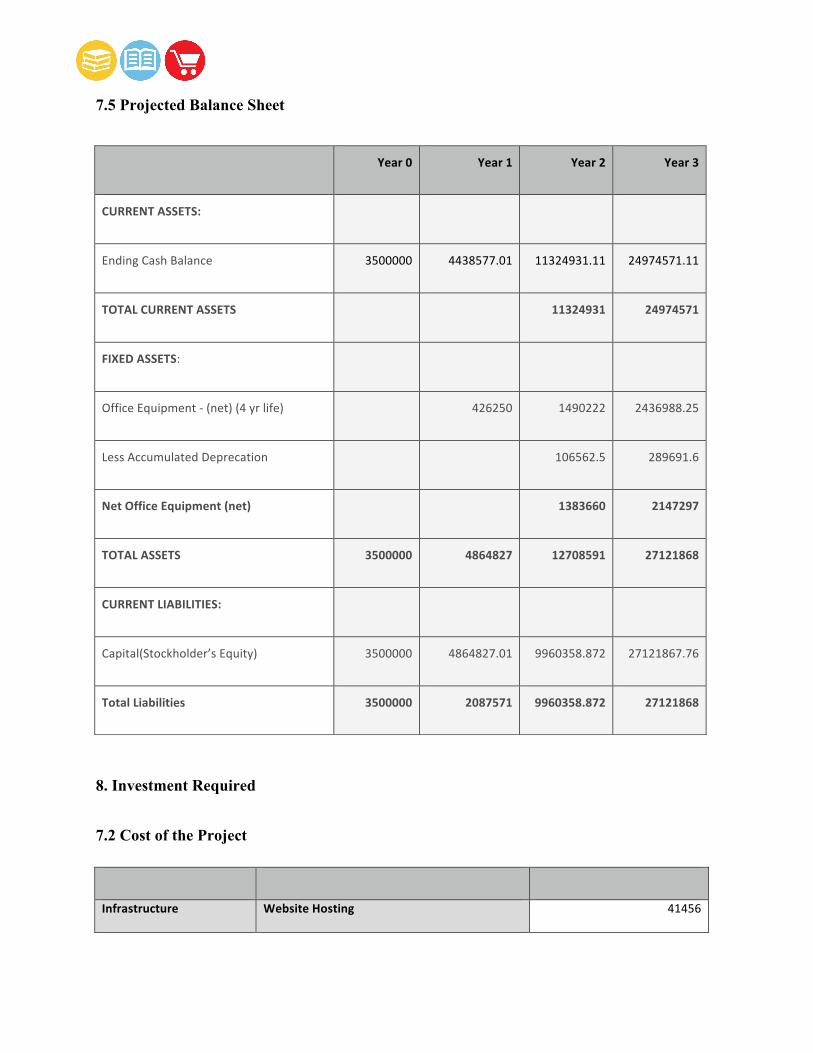
7.5 Projected Balance Sheet
Year 0 Year 1 Year 2 Year 3
CURRENT ASSETS:
Ending Cash Balance 3500000 4438577.01 11324931.11 24974571.11
TOTAL CURRENT ASSETS 11324931 24974571
FIXED ASSETS:
Office Equipment -‐ (net) (4 yr life) 426250 1490222 2436988.25
Less Accumulated Deprecation 106562.5 289691.6
Net Office Equipment (net) 1383660 2147297
TOTAL ASSETS 3500000 4864827 12708591 27121868
CURRENT LIABILITIES:
Capital(Stockholder’s Equity) 3500000 4864827.01 9960358.872 27121867.76
Total Liabilities 3500000 2087571 9960358.872 27121868
8. Investment Required
7.2 Cost of the Project
Infrastructure Website Hosting 41456
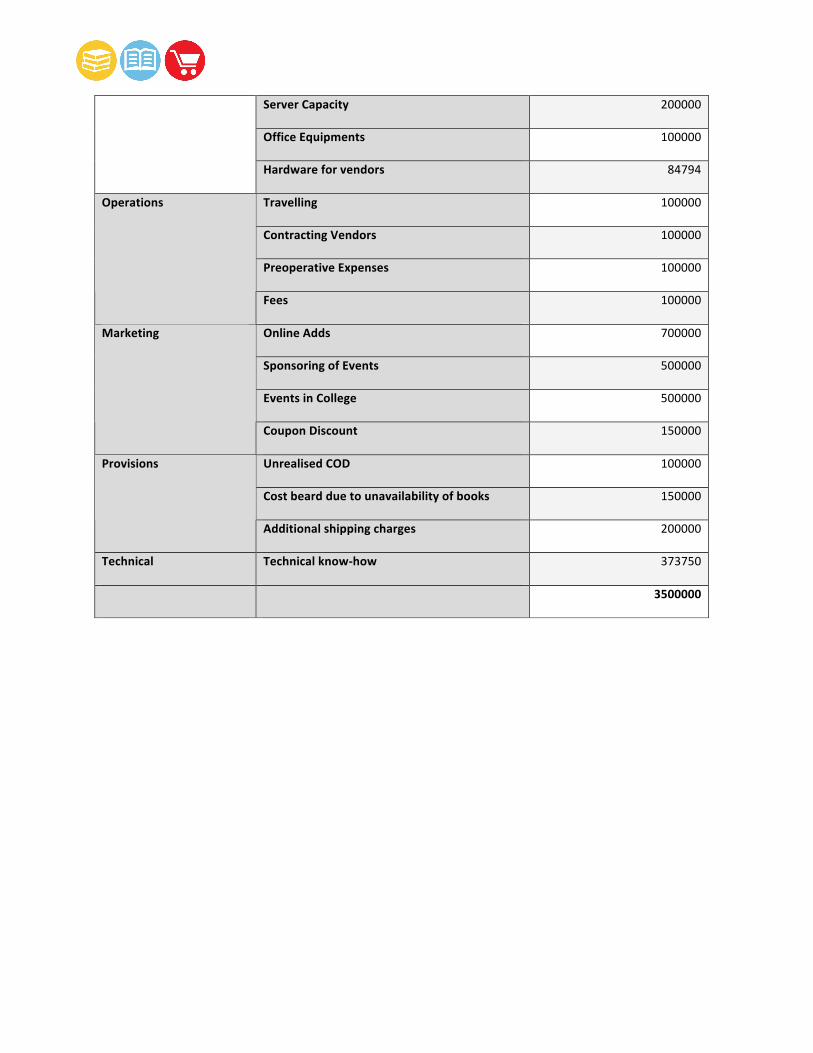
Server Capacity 200000
Office Equipments 100000
Hardware for vendors 84794
Travelling 100000
Contracting Vendors 100000
Preoperative Expenses 100000
Operations
Fees 100000
Online Adds 700000
Sponsoring of Events 500000
Events in College 500000
Marketing
Coupon Discount 150000
Unrealised COD 100000
Cost beard due to unavailability of books 150000
Provisions
Additional shipping charges 200000
Technical Technical know-‐how 373750
3500000
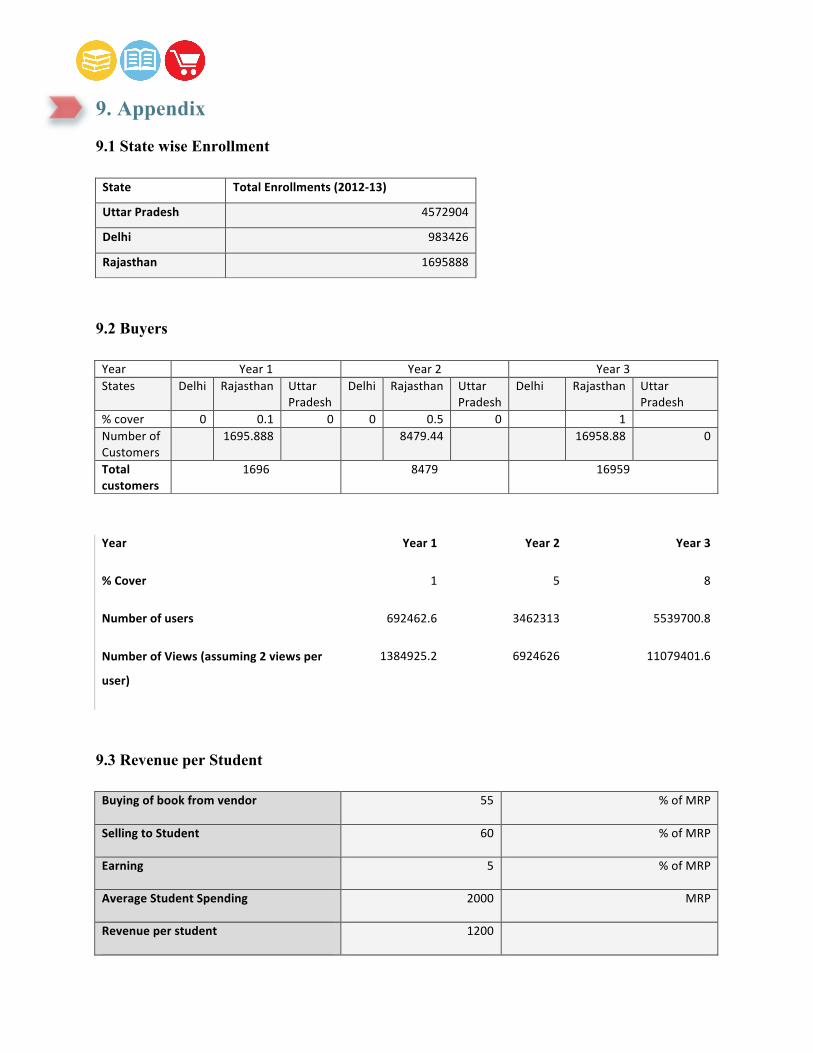
9. Appendix
9.1 State wise Enrollment
State Total Enrollments (2012-‐13)
Uttar Pradesh 4572904
Delhi 983426
Rajasthan 1695888
9.2 Buyers
Year Year 1 Year 2 Year 3 States Delhi Rajasthan Uttar
Pradesh Delhi Rajasthan Uttar
Pradesh Delhi Rajasthan Uttar
Pradesh % cover 0 0.1 0 0 0.5 0 1 Number of Customers
1695.888 8479.44 16958.88 0
Total customers
1696 8479 16959
Year Year 1 Year 2 Year 3
% Cover 1 5 8
Number of users 692462.6 3462313 5539700.8
Number of Views (assuming 2 views per
user)
1384925.2 6924626 11079401.6
9.3 Revenue per Student
Buying of book from vendor 55 % of MRP
Selling to Student 60 % of MRP
Earning 5 % of MRP
Average Student Spending 2000 MRP
Revenue per student 1200
Earning per Student 100 Rs
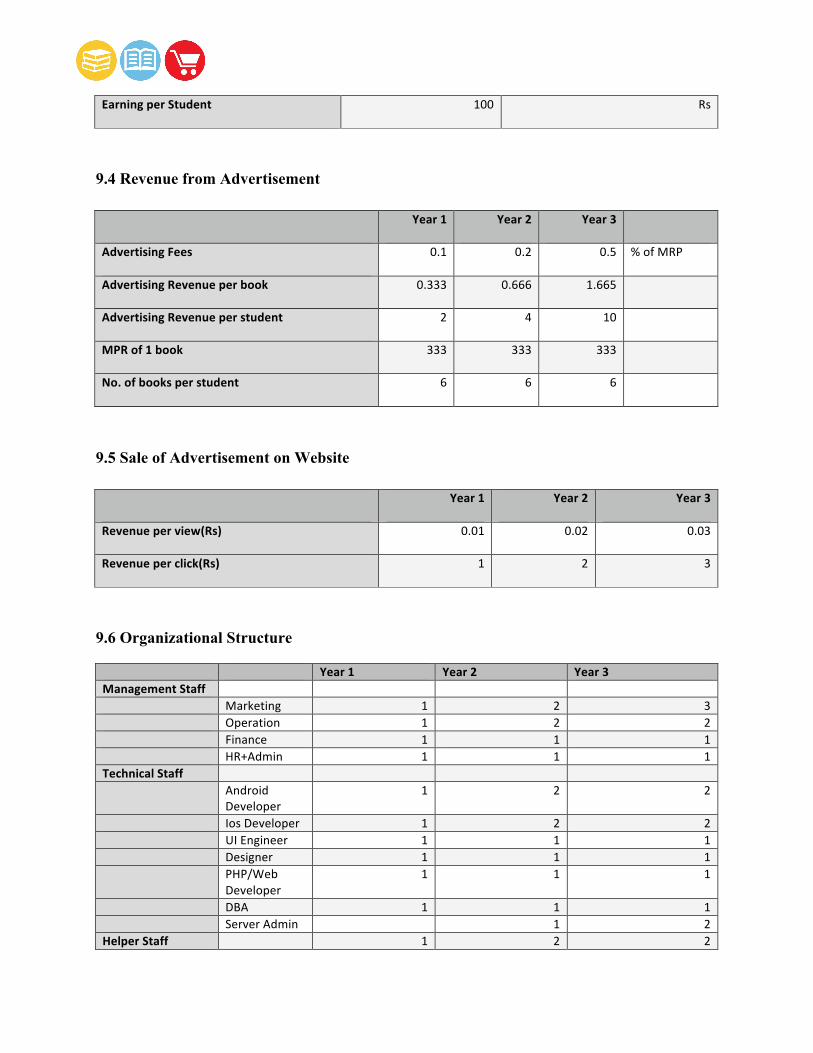
9.4 Revenue from Advertisement
Year 1 Year 2 Year 3
Advertising Fees 0.1 0.2 0.5 % of MRP
Advertising Revenue per book 0.333 0.666 1.665
Advertising Revenue per student 2 4 10
MPR of 1 book 333 333 333
No. of books per student 6 6 6
9.5 Sale of Advertisement on Website
Year 1 Year 2 Year 3
Revenue per view(Rs) 0.01 0.02 0.03
Revenue per click(Rs) 1 2 3
9.6 Organizational Structure
Year 1 Year 2 Year 3 Management Staff Marketing 1 2 3 Operation 1 2 2 Finance 1 1 1 HR+Admin 1 1 1 Technical Staff Android
Developer 1 2 2
Ios Developer 1 2 2 UI Engineer 1 1 1 Designer 1 1 1 PHP/Web
Developer 1 1 1
DBA 1 1 1 Server Admin 1 2 Helper Staff 1 2 2

Total 11 17 19
9.7 Organizational Structure - Payroll cost
Monthly Payout
Year 1 Monthly Payout
Year 2 Monthly Payout
Year 3
Management Staff Marketing 60000 60000 100000 200000 150000 450000 Operation 50000 50000 100000 200000 150000 300000 Finance 50000 50000 100000 100000 150000 150000 HR+Admin 50000 50000 100000 100000 150000 150000 Technical Staff Android
Developer 30000 360000 530000 1060000 700000 1400000
Ios Developer 30000 360000 530000 1060000 700000 1400000 UI Engineer 30000 360000 530000 530000 700000 700000 Designer 30000 360000 530000 530000 700000 700000 PHP/Web
Developer 30000 360000 530000 530000 700000 700000
DBA 30000 360000 530000 530000 700000 700000 Server Admin 30000 360000 530000 530000 700000 1400000 Helper Staff 10000 120000 18000 36000 20000 40000 Total 2850000 5406000 8090000
9.8 References
I. http://blog.kampquest.com
II. http://www.usief.org.in/India-Factsheet.aspx
III. http://www.dreducation.com/2014/06/graduate-data-india-student.html
IV. http://bit.ly/1xo9gAd
V. http://bit.ly/1rgkeoV
VI. http://www.aicte-
india.org/downloads/Growth_Technical_Institutions_310514.pdf#toolbar=0