Business models, strategyegy and internationalisation around the Telecom Crash What is the influence...
23
Business models, strategyegy and internationalisation around the Telecom Crash What is the influence of these strategic choices on the performance of telecom operator companies in the years 1998-2001 H.Ebbers, Nyenrode University and CEIBS Shanghai
-
date post
21-Dec-2015 -
Category
Documents
-
view
214 -
download
0
Transcript of Business models, strategyegy and internationalisation around the Telecom Crash What is the influence...
Business models, strategyegy and internationalisation around
the Telecom CrashWhat is the influence of these strategic choices on the
performance of telecom operator companies in the years 1998-2001
H.Ebbers, Nyenrode University and CEIBS Shanghai

Agenda• Introduction
• Earlier work about KPN
• Theory/ choices
• Research methods
• Results
• Conclusions

Introduction
• Work in progress
• Three students between May 2002 and February 2003
• Guidance of the Center for International Business, Nyenrode University

•Mobile telecommunication
•IP and data services
•Internet, call centre and media- services
•Fixed network
Emphasis is on the first three activities
Core Activities for KPN
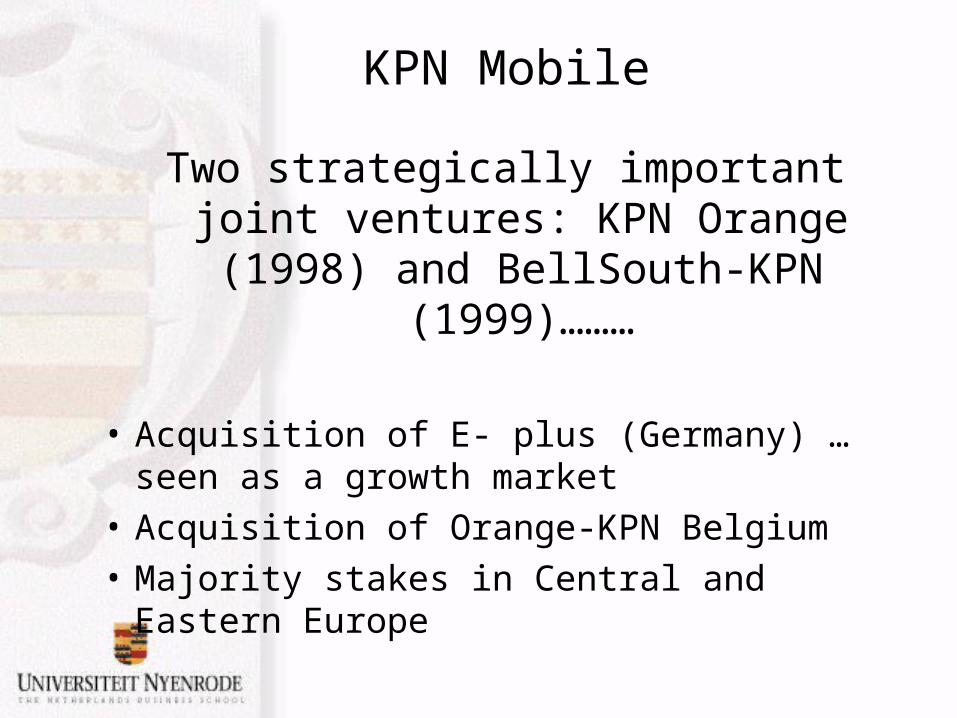
Two strategically important joint ventures: KPN Orange (1998) and
BellSouth-KPN (1999)………
• Acquisition of E- plus (Germany) …seen as a growth market
• Acquisition of Orange-KPN Belgium
• Majority stakes in Central and Eastern Europe
KPN Mobile

• Arrangements with NTT- DoCoMo
– Technology sharing
– Minority holding: NTT- DoCoMo aquired a 15% stake in KPN
– UMTS biddings

International expansion
• Regional focus (CEE)
• Control over management
• Divestments driven by debt problems and the 2001 telecomcrash

KPN
Bell South
Orange (UK)
France Telecom
Pannon
UMC
Telkomsel
OTE/ BTC
Euroweb Corp
Telia
E-plus
Comsource
Slovak Telecom
Eirocom
Orange -KPN Belgium
Swisscom
SPT/ Cesky Telecom
Telsource
NTT Docomo
Hutchison #G
Tele Danmark
Join
t ve
ntur
e(50
%)
minority (17%)
majority
(51%)
minority (21%)
=Alliance at the endof 2002
=alliance which KPN is considering to end.
= sold non -core asset or ended alliance
KPN’s alliance network within mobile telecommunications

KPN
KPN-Qwest
Wipro/wipronet
DisneyBlast
KPN Belgium
InfonetServices Corporation
Lambda net
EurowebCorp
SchipholTelematics
CESECBEC
Jasz-Tel
AT &T-unisourceservices
Unisource
Telsource
Planet Internet
Telstra Satellite
Utel
=Alliance at the endof 2002
=alliance which KPN is considering to end.
= sold non-core asset or ended alliance
Nokia
Joint Venture
Fixed
IP/data/ICM

Introduction
• Companies: Telecom Operators– SBC - KPN - France Telecom– Deutsche Telekom - Telia - Sonera– Vodafone - BT - AT&T – Colt - Cable & Wireless - Infonet– Sprint - MCI Worldcom - QWest
Telecom Content & Valueequipment Carriers/ Service Added Customersindustry Operators Providers Services

Theory• Business Models
– Mintzberg– Cushway & Lodge– Viscio & Pasternack
• Internationalisation• Strategies
– Boston Consulting Group matrix– Porter’s generic strategies– Ansoff’s product/market matrix– Equity and non equity based cooperative agreements

Business Models
V o ice D ata IP
C ab le & W ire less G lob a l
C arib b ean M id d le E as t M acau
C ab le & W ire less R eg ion a l
C ab le & W ire less G rou p
Traditional Model = 0 Emerging Model = 1 Score‘managing assets’ ‘managing resources’ 1998 1999 2000 2001
Businesses built around assets
Businesses built to leverage and develop resources (people, capabilities, knowledge) 0 0 0 0
Portfolio of businesses related in product-market terms
Portfolio of strategic capabilities based on knowledge created 0 0 0 0
Financial investment assigned business unit by business unit
Resource allocation (talent and capital) on a corporate-wide bases 0 0 0 0
Performance measured around assets (utilisation rates, profitability of single business units)
Performance measured on a corporate-wide level driven by knowledge creation and sharing 0 0 0 0
Accountability focussed on business unit financials often impeding and discouraging business interaction
accountability includes growth and best practices sharing 0 0 0 0
Total 0 0 0 0

InternationalisationC&W geographical revenue
US16%
UK41%Europe
6%
Japan9%
Caribbean22%
Asia3%
Rest 3%
more than 90% of revenue local: level 1 less than 90% but more than 50% of revenue local: level 2 less than 50% of revenue local but less than 25% of revenue outside its own continent: level 3 more than 25% but less than 50% of revenue outside its own continent: level 4 more than 50% of revenue outside its own continent: level 5

Strategieshigh
Question Mark Star
Market Growth Rate
Dog Cash Cow
lowlow Relative Market high
Share
Existing product New product
Existing Penetration Product develop-Market Strategies (90%) ment strategies (30%)
New Market development DiversificationMarket Strategies (30%) Strategies (10%)
Broad
1. Cost Leadership 2. Differentiation
Strategic targetMarket
3A. Cost Focus 3B. Differentiation Focus
Narrow/NicheLow-cost Strategic Advantage Uniqueness/
Differentiation
BCG
Porter
Ansoff

Research methods• detailed company analyses
– performance– business models– internationalisation– strategies

Results: Telecom Crash
Return On Equity
-25%
0%
25%
50%
2001200019991998
ROE market
• Market performanceDebt/Equity ratios
50%
100%
150%
2001200019991998
debt equity market
Net profit margin
-25%
0%
25%
2001200019991998
net profit Market
Stock price evolution compared to previous Year
0%
50%
100%
150%
200%
2001200019991998
Market
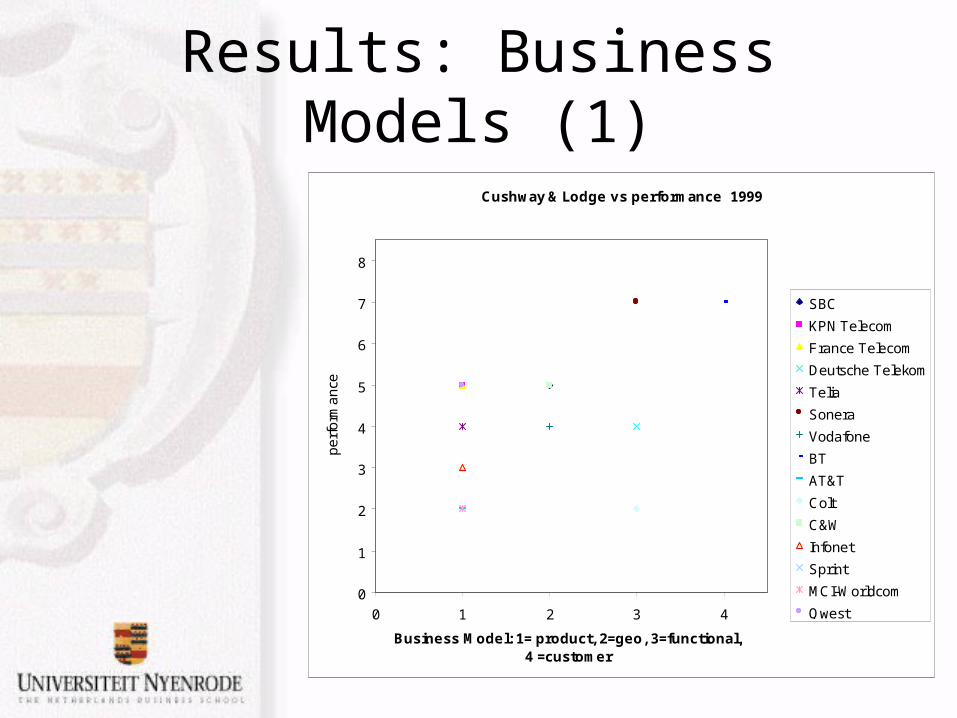
Results: Business Models (1)
Cushway & Lodge vs performance 1999
0
1
2
3
4
5
6
7
8
0 1 2 3 4
Business Model: 1= product, 2=geo, 3=functional,4 =customer
pe
rfo
rma
nce
SBC
KPN Telecom
France Telecom
Deutsche Telekom
Telia
Sonera
Vodafone
BT
AT&T
Colt
C&W
Infonet
Sprint
MCI-Worldcom
Qwest

Results: Business Models (2)
Viscio and Pasternack score vs performance 2000
0
1
2
3
4
5
6
7
8
0 1 2 3 4 5
Viscio and Pasternack score
pe
rfo
rma
nce
SBC
KPN Telecom
France Telecom
Deutsche Telekom
Telia
Sonera
Vodafone
BT
AT&T
Colt
C&W
Infonet
Sprint
MCI-Worldcom
Qwest

Results: Internationalisation
Internationalisation vs performance 1998
0
1
2
3
4
5
6
7
8
0 1 2 3 4 5
Internationalisation level
pe
rfo
rma
nce
SBC 1998
KPN Telecom 1998
France Telecom 1998
Deutsche Telekom 1998
Telia 1998
Sonera 1998
Vodafone 1998
BT 1998
AT&T 1998
Colt 1998
C&W 1998
Infonet 1998
Sprint 1998
MCI-Worldcom 1998

Results: Strategies
Porter vs performance 2000
0
1
2
3
4
5
6
7
8
0 1 2 3
Porter: 1= Cost Leader, 2=Differentiation, 3= Focus
perf
orm
ance
SBC
KPN Telecom
France Telecom
Deutsche Telekom
Telia
Sonera
Vodafone
BT
AT&T
Colt
C&W
Infonet
Sprint
MCI-Worldcom
Qwest

Results: Performance
Debt/Equity ratio vs performance 1998
0
1
2
3
4
5
6
7
8
0% 100% 200% 300% 400%
Debt/Equity ratio in %
pe
rfo
rma
nce
SBC
KPN Telecom
France Telecom
Deutsche Telekom
Telia
Sonera
Vodafone
BT
AT&T
Colt
C&W
Infonet
Sprint
MCI-Worldcom
Qwest

Conclusions (1)
• Generally a limited correlation between company performance and business models, internationalisation and strategy
• Telecom Crash has little impact on business models, internationalisation and strategy
• Low debt/equity ratio has positive impact on performance both before and after the Telecom Crash

Conclusions (2)• Business Models
• Lack of significant correlation– Customer oriented (Cushway & Lodge) – High Viscio & Pasternack Score
• Internationalisation• Little correlation in 1998, no correlation in other
years
• Strategy• Porter: correlation changes before & after crash• BCG: stars are performing well• Ansoff: move towards penetration after crash