

Business Intelligence for Transit Executives
19
Business Intelligence for Transit Executives
-
Upload
power-trade-media -
Category
Documents
-
view
223 -
download
2
description
TransTrack Systems presents "Business Intelligence for Transit Executives," a compendium of BUSRide's TransIT column.
Transcript of Business Intelligence for Transit Executives
BUSRIDE | TRANSTRACK SYSTEMS2 busride.com
TRANSTRACK SYSTEMS® CORPORATE OVERVIEW 3
THE SEARCH FOR BUSINESS INTELLIGENCE IS OVER 4By Mary Sue O’Melia
KEY PERFORMANCE INDICATORS – WHAT TO MEASURE AND WHY 5By Mary Sue O’Melia
WHEN IS A PASSENGER A PASSENGER? – IT DEPENDS 6By Mary Sue O’Melia and David Brandauer
I HAVE MY ITS GRANT, NOW WHAT? 7By David Brandauer and Mary Sue O’Melia
ARE WE PLANNING FOR POOR PERFORMANCE? 8By Mary Sue O’Melia
HOW EFFECTIVE IS MY VEHICLE MAINTENANCE PROGRAM? 9By Mary Sue O’Melia
ARE CUSTOMER COMMENTS BEING USED TO IMPROVE SERVICE QUALITY? 10By Mary Sue O’Melia
HOW RELIABLE IS YOUR SERVICE? 11By Mary Sue O’Melia
“SAFETY FIRST” IS MORE THAN JUST A SLOGAN 12By Mary Sue O’Melia
SETTING PERFORMANCE TARGETS FOR KEY INDICATORS 13By Mary Sue O’Melia
THE SOUTHWEST OF PUBLIC TRANSIT COMPANIES 14By Mary Sue O’Melia
TRANSIT INFORMATION TECHNOLOGY - BUILD VERSUS BUY 15By Mary Sue O’Melia
WHAT NEXT – PREDICTIVE ANALYTICS 16By Mary Sue O’Melia
SUCCESSFUL ITS PROJECT IMPLEMENTATION – NOW WHAT? 17By Mary Sue O’Melia
FROM THE OFFICE OF PERFORMANCE ANALYSIS – TRANSIT PERFORMANCE MEASUREMENT (TPM) 18By Mary Sue O’Melia
3busride.com | BUSRIDE
TransTrack Systems® was formed in January 2002 by transit management professionals who understand the need for streamlined processes and improved management reporting. The sole purpose of establishing TransTrack Systems was to help transit agencies maximize their business Intelligence and streamline processes associated with collecting, reporting, and analyzing real-time operations and performance data. TransTrack Systems specializes in transit industry management information, process reengineering, and change management.
TransTrack Manager™ is helping managers across the nation make better decisions through more effective management of agency resources. Transit industry professionals designed TransTrack Manager™; transit agencies developed and tested it; and it is available for immediate use by transit agencies, with minimal set-up requirements.
The unique combination of our industry expertise, knowledgeable management, technical skills and hands-on experience are the key differentiators we provide to each of our clients.
TransTrack Systems delivers a comprehensive business intelligence solution that satisfies the diverse reporting requirements for all users from senior management to operational resources. The TransTrack solution consists of dashboards, standard and ad-hoc reports, data exports, and alerts.
TransTrack Systems®, Inc. is certified as a Minority Business Enterprise/Women’s Business Enterprise (DBE/WBE).
Corporate Overview
BUSRIDE | TRANSTRACK SYSTEMS4 busride.com
The search for business intelligence is overBy Mary Sue O’Melia
Transit agencies are overwhelmed with data but have very little business intelligence. This is the first in a series of articles exploring business intelligence for the transit industry.
Data overload
Collecting and maintaining data is expensive and time-consuming. Each department typically maintains a separate data system and these systems may not be integrated. Basic data, such as number of passengers, may have three separate and disparate numbers – one passenger number from the automated fare system (AFS), another number from automated passenger counters (APC), and a third number based on manual counts used to validate APC data. Data may reside in separate systems and no two numbers ever agree. In this case, the basis for performance data is inaccessible or fragmented and thus credibility and reliability are often impacted by data inconsistencies.
Consolidating data in an easy-to-use reporting system is a starting point for addressing data overload and fragmentation. In discussions about the numbers, there should never be any confusion about the accuracy of the data. The goal is to have data immediately available for tactical decision-making.
Business intelligence defined
Wikipedia defines business intelligence as the “transformation of raw data into meaningful and useful information for business analysis purposes.” Business intelligence is characterized by: • A set of clear performance indicators that concisely convey the financial, service and safety performance of the agency• The tools, processes and personnel to continually evaluate and improve agency performance• The capability to identify challenges and opportunities, as well as the knowledge to take appropriate action
Next stop – BI for the transit industry
What this means in practical terms is that management wants a system of Key Performance Indicators (KPI) and dashboards that provide accurate and timely information for strategic decision-
making. Supervisors and mid-level management want information for tactical decision-making to improve performance. Managers require information in sufficient detail to make daily decisions with confidence and assurance that the data is correct and accurate. This implies more detailed reporting and dashboard drilldowns. Data managers require an effective process to collect and report information that does not involve re-keying data from multiple databases and sources. IT Managers require systems, tools and services to support the BI program.
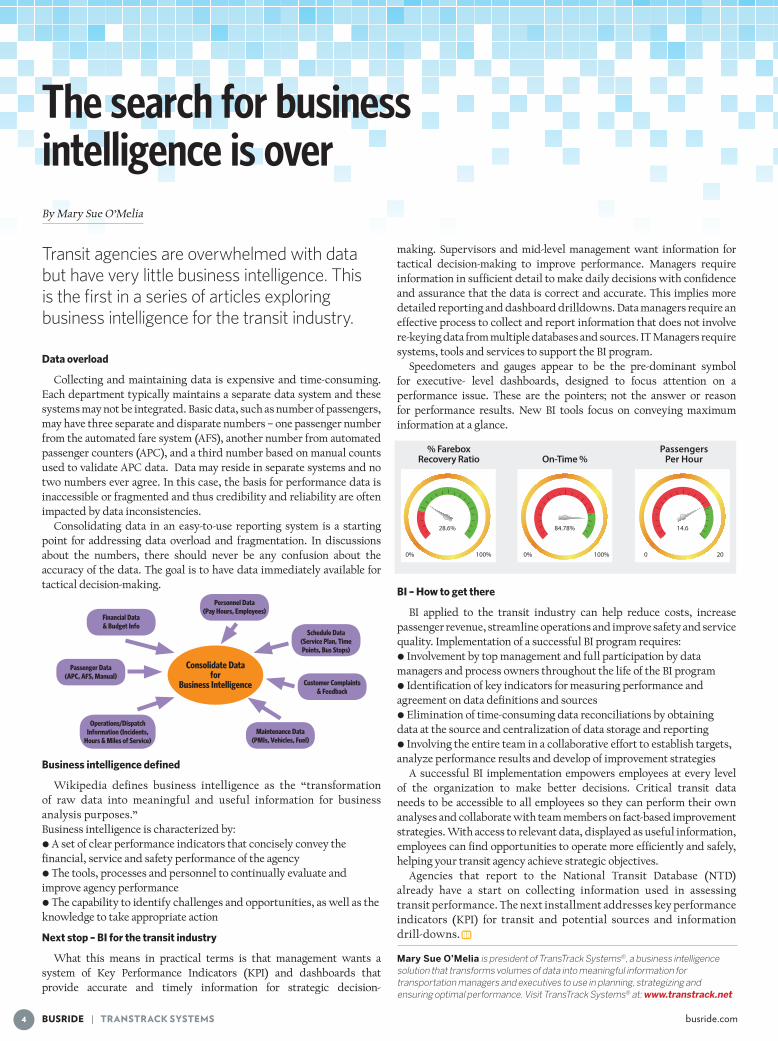
Speedometers and gauges appear to be the pre-dominant symbol for executive- level dashboards, designed to focus attention on a performance issue. These are the pointers; not the answer or reason for performance results. New BI tools focus on conveying maximum information at a glance.
BI – How to get there
BI applied to the transit industry can help reduce costs, increase passenger revenue, streamline operations and improve safety and service quality. Implementation of a successful BI program requires:• Involvement by top management and full participation by data managers and process owners throughout the life of the BI program• Identification of key indicators for measuring performance and agreement on data definitions and sources• Elimination of time-consuming data reconciliations by obtaining data at the source and centralization of data storage and reporting• Involving the entire team in a collaborative effort to establish targets, analyze performance results and develop of improvement strategies
A successful BI implementation empowers employees at every level of the organization to make better decisions. Critical transit data needs to be accessible to all employees so they can perform their own analyses and collaborate with team members on fact-based improvement strategies. With access to relevant data, displayed as useful information, employees can find opportunities to operate more efficiently and safely, helping your transit agency achieve strategic objectives.
Agencies that report to the National Transit Database (NTD) already have a start on collecting information used in assessing transit performance. The next installment addresses key performance indicators (KPI) for transit and potential sources and information drill-downs.
Mary Sue O’Melia is president of TransTrack Systems®, a business intelligence solution that transforms volumes of data into meaningful information for transportation managers and executives to use in planning, strategizing and ensuring optimal performance. Visit TransTrack Systems® at: www.transtrack.net
5busride.com | BUSRIDE
Key performance indicators – what to measure and whyBy Mary Sue O’Melia
The challenge for transit agencies is to determine key performance indicators (KPI) that help measure mission achievement. The second challenge is to establish a process involving the entire team in keeping score and improving performance.
Key performance indicators (KPI)
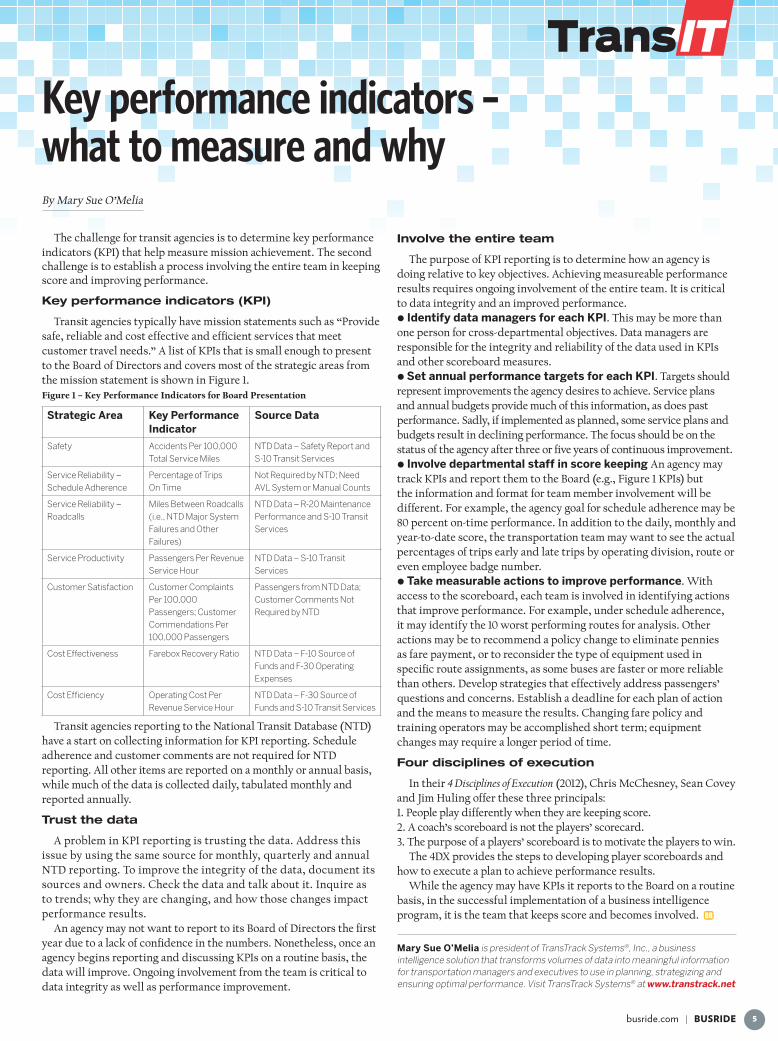
Transit agencies typically have mission statements such as “Provide safe, reliable and cost effective and efficient services that meet customer travel needs.” A list of KPIs that is small enough to present to the Board of Directors and covers most of the strategic areas from the mission statement is shown in Figure 1. Figure 1 – Key Performance Indicators for Board Presentation
Strategic Area Key Performance Indicator
Source Data
Safety Accidents Per 100,000 Total Service Miles
NTD Data – Safety Report and S-10 Transit Services
Service Reliability – Schedule Adherence
Percentage of Trips On Time
Not Required by NTD; Need AVL System or Manual Counts
Service Reliability – Roadcalls
Miles Between Roadcalls (i.e., NTD Major System Failures and Other Failures)
NTD Data – R-20 Maintenance Performance and S-10 Transit Services
Service Productivity Passengers Per Revenue Service Hour
NTD Data – S-10 Transit Services
Customer Satisfaction Customer Complaints Per 100,000 Passengers; Customer Commendations Per 100,000 Passengers
Passengers from NTD Data; Customer Comments Not Required by NTD
Cost Effectiveness Farebox Recovery Ratio NTD Data – F-10 Source of Funds and F-30 Operating Expenses
Cost Efficiency Operating Cost Per Revenue Service Hour
NTD Data – F-30 Source of Funds and S-10 Transit Services
Transit agencies reporting to the National Transit Database (NTD) have a start on collecting information for KPI reporting. Schedule adherence and customer comments are not required for NTD reporting. All other items are reported on a monthly or annual basis, while much of the data is collected daily, tabulated monthly and reported annually.
Trust the data
A problem in KPI reporting is trusting the data. Address this issue by using the same source for monthly, quarterly and annual NTD reporting. To improve the integrity of the data, document its sources and owners. Check the data and talk about it. Inquire as to trends; why they are changing, and how those changes impact performance results.
An agency may not want to report to its Board of Directors the first year due to a lack of confidence in the numbers. Nonetheless, once an agency begins reporting and discussing KPIs on a routine basis, the data will improve. Ongoing involvement from the team is critical to data integrity as well as performance improvement.
Involve the entire team
The purpose of KPI reporting is to determine how an agency is doing relative to key objectives. Achieving measureable performance results requires ongoing involvement of the entire team. It is critical to data integrity and an improved performance.• Identify data managers for each KPI. This may be more than one person for cross-departmental objectives. Data managers are responsible for the integrity and reliability of the data used in KPIs and other scoreboard measures.• Set annual performance targets for each KPI. Targets should represent improvements the agency desires to achieve. Service plans and annual budgets provide much of this information, as does past performance. Sadly, if implemented as planned, some service plans and budgets result in declining performance. The focus should be on the status of the agency after three or five years of continuous improvement. • Involve departmental staff in score keeping An agency may track KPIs and report them to the Board (e.g., Figure 1 KPIs) but the information and format for team member involvement will be different. For example, the agency goal for schedule adherence may be 80 percent on-time performance. In addition to the daily, monthly and year-to-date score, the transportation team may want to see the actual percentages of trips early and late trips by operating division, route or even employee badge number. • Take measurable actions to improve performance. With access to the scoreboard, each team is involved in identifying actions that improve performance. For example, under schedule adherence, it may identify the 10 worst performing routes for analysis. Other actions may be to recommend a policy change to eliminate pennies as fare payment, or to reconsider the type of equipment used in specific route assignments, as some buses are faster or more reliable than others. Develop strategies that effectively address passengers’ questions and concerns. Establish a deadline for each plan of action and the means to measure the results. Changing fare policy and training operators may be accomplished short term; equipment changes may require a longer period of time.
Four disciplines of execution
In their 4 Disciplines of Execution (2012), Chris McChesney, Sean Covey and Jim Huling offer these three principals:1. People play differently when they are keeping score.2. A coach’s scoreboard is not the players’ scorecard. 3. The purpose of a players’ scoreboard is to motivate the players to win.
The 4DX provides the steps to developing player scoreboards and how to execute a plan to achieve performance results.
While the agency may have KPIs it reports to the Board on a routine basis, in the successful implementation of a business intelligence program, it is the team that keeps score and becomes involved.
Mary Sue O’Melia is president of TransTrack Systems®, Inc., a business intelligence solution that transforms volumes of data into meaningful information for transportation managers and executives to use in planning, strategizing and ensuring optimal performance. Visit TransTrack Systems® at www.transtrack.net
TransIT

BUSRIDE | TRANSTRACK SYSTEMS6 busride.com
When is a passenger a passenger? – It dependsBy Mary Sue O’Melia and David Brandauer
Why is it so difficult to get an accurate number of passengers in a given transit system? Have you ever sought the total number of passengers and received more than one answer? Such responses do not instill confidence. This month, we delve into passenger statistics – sources and uses of data from manual counts, automated fare collection systems (AFC) and automated passenger counters (APC).
Random sampling and manual counts
A number of transit agencies continue to use a random sampling process whereby data on passenger boardings by trip are manually collected, tabulated and statistically weighted to report monthly and annual passengers. The total number of one-way trips or farebox revenues may be used to expand passenger sample data to an annual total.
Manual counts are generally most accurate on a trip-level and may in fact be used to validate information from driver manifests as well as AFC and APC systems.
The downsides of this method of collecting data are that it is labor intensive, accuracy decreases with the length of shift and, depending on the random sample size, may only be valid at the mode/service type level on an annual basis. While this level of reporting is good for NTD reporting, it is not much use to transit planners and managers who are responsible for agency performance.
Automated fare collection system passenger data
AFC provides detailed information about fare payment and passengers. Information is available by date, time, route/trip, fare type and transaction type. Transactions may include items other than passenger boardings (e.g., wheelchairs, bicycles).
Fare systems typically require driver interaction to correctly record non-cash transactions (e.g., student passes). Consistent driver participation and passenger fare evasion are two of the challenges in getting accurate passenger boarding information from fare systems. Monitoring of “Unclassified Revenues” is useful in identifying driver training and implementation issues.
AFC pre-sets and the use of smart cards have helped to reduce the need for driver interaction. This in turn increases reliability of passenger data, assuming that automated equipment is maintained. Transit agencies typically place fare collection equipment in locations that are clearly visible to drivers. In a well-maintained AFC system, missing data due to equipment failure is not really an issue and most data sets from AFC and smart cards are complete. AFC equipment, however, does not help with the passenger mile reporting required for NTD annual reporting.
Automated passenger counter (APC)
Automated passenger counters provide the basis for collecting not only passenger boardings, but passenger mile data as well. APCs can work on service where the driver is not responsible for fare collection
(e.g., free shuttles and trolleys, articulated buses with rear-door entry, rail) and where the passenger loads are such that the driver cannot accurately interact with fare collection equipment on all transactions.
APC data is highly valued by planners as it provides detailed data on boardings and alightings. APC data may be the official agency source for reporting passengers, especially if the entire fleet is equipped and the agency has received FTA approval for the initial benchmarking and long-term maintenance processes. Information by route, stop and time are all available if the equipment is calibrated, maintained, and fully functional. In-service equipment failure is not readily apparent so a method for identifying faulty equipment and of estimating missing passenger data due to equipment failure is required.
If APCs are only available on a portion of the fleet, then the agency must implement a sampling plan that collects information to meet NTD reporting requirements as well as agency internal reporting needs. The potential for bias in the plan, plan implementation by operations, and weighting of sample can impact reported passenger counts.
One thing is clear: manual counts and APC data should be different at the trip level because of end-of-line activity (e.g., drivers getting on and off at layover locations). This causes APC passenger counts to be higher than manual counts. If passenger loads are high, APC passenger counts may be understated. This is why the benchmarking and annual maintenance sample calibration factors are so important.
Conclusion
Agencies may compare the annual or monthly passenger figures from random sampling to AFC and/or APC data. These figures are never the same. The variances may be inconsistent and quite large. While passenger data from individual trips may be compared, monthly and annual comparison of passenger data from manual counts to AFC and APC data will always be different because of expansion factors in random sampling and APC data sets. Driver error, fare evasion and equipment failure may impact manual passenger counts compared to AFC passenger counts.
The FTA recommends that data from a minimum of 100 trips collected with manual counts be compared to APC data on an annual basis as part of the ongoing process to ensure accurate data and equipment calibration. We believe that using a limited sample manual process to validate automated systems is a good practice. Simple manual count random sampling, however, does not provide the level of information needed for service planning and revenue control. What is important is to select one source to be the official passenger figure for the agency and set up a process to use other measures as a check and balance.
Mary Sue O’Melia is president of TransTrack Systems®, Inc., a business intelligence solution that transforms volumes of data into meaningful information. David Brandauer is the chief operating officer for BLIC North America, a transportation technology consulting firm. Visit our authors at www.transtrack.net and www.blic.us

BUSRIDE | TRANSTRACK SYSTEMS8 busride.com
Are we planning for poor performance?Mary Sue O’Melia
With the technology available today, the transit industry has more data than ever to help plan productive and efficient service. But more data does not necessarily translate into good planning decisions and improved performance.
Drilldown not upAgencies should start at the Route level by Day Type (i.e.,
Weekday, Saturday, and Sunday). Drilldowns to the trip and stop levels are done on an as-needed basis and require APC and AVL system data. Picking a year or even a month’s worth of detailed data without having a framework for evaluation is a waste of time.
Evaluating productivity and effectivenessAgencies will need four data items that are required for National
Transit Database (NTD) reporting and are generally available to all transit agencies, both large and small. The four data items include: • Passengers• Revenue Service Hours (or Revenue Service Miles)• Passenger Revenues• Operating Costs
Calculate system average and individual route performance statistics for key indicators: passengers per revenue hour and farebox recovery ratio (i.e., passenger revenue divided by operating costs) or subsidy per passenger (in lieu of farebox recovery). Use these two indicators to assess areas of strong, moderate and poor performance. Display information in a diagram or table format. In the example that follows, Quadrant A shows strong performance while quadrants B and C (shown in gray) show moderate performance. Quadrant D is shown in red and indicates poor performance.
In the example above, Route B has the lowest performance in the group. The next drill down would be to examine performance by day type, followed by performance by time of day (e.g., early morning, AM peak, mid-day, PM peak, evening) and then by route segment. Examining route performance by day type may be accomplished with standard data by route used for NTD reporting. Identifying performance issues by time of day and route segment requires a ride check or APC data.
Route performance standardsMany agencies go through an elaborate process to define route
performance standards, but using your own transit system average
for general public service is fairly easy to calculate and levels the playing field. This allows for a few basic service planning guidelines. If an agency wants to improve system performance, the first rule is this: Do not implement service changes that are going to result in performance below the system average.
The second rule: People will walk to frequency. Invest in improving the frequency of the best routes.
Evaluating service change requestsAttend almost any public hearing for transit services and there will
be requests for:• New routes in new areas• Expanded service hours• Weekend service• Additional stops• More frequent service• More reliable service• Faster service.
Evaluating options does not require complex formulas. How do existing services in similar areas and during the same hours and days of operation perform? If service changes perform in the same way as existing services, will the route be above or below the system average after these changes?
For additional stops and off-route stops, a different type of analysis is required. How much running time will be added with additional and/or off route stops? Is there enough slack in the schedule to accommodate a few additional stops? Are additional vehicles required to accomplish the requested change?
Answering these questions can go a long way to presenting the facts for performance-based decision-making. Transit managers should not be recommending routes expected to have poor performance based on comments received during a public hearing or because it would be nice to expand service.
If an agency is venturing into expanded hours and days, and there are no similar routes, then implement the service on a demonstration basis with clearly communicated performance standards.
Summarize up before making a final decisionOnce a set of service changes have been identified and vetted, the
cumulative impact of these changes should be evaluated. What is the current system average for key performance statistics and will these improve, decline or stay the same with implementation of recommended changes? If an agency does not know the answer to this question, then it is not ready to make the change. Don’t guess; know before you recommend and approve.
Mary Sue O’Melia is president of TransTrack Systems®, Inc., a business intelligence solution that transforms volumes of data into meaningful information for transportation managers and executives to use in planning, strategizing and ensuring optimal performance. Visit TransTrack Systems® at: www.transtrack.net

7busride.com | BUSRIDE
I have my ITS grant, now what?By David Brandauer and Mary Sue O’Melia
There are several steps to take early in the life of an ITS project. Some of these should have been done prior to applying for the ITS grant. Nonetheless, if they have not been done, do them now. The first thing to look at is how the ITS project will support an agency’s overall business goals and objectives. Secondly, an agency must identify key stakeholders for the ITS project and ensure that they are involved in every step of the project. Finally, take notes from those that have gone before. The lessons they learned in their projects can be crucial to ensuring success in your new ITS project.
Supporting business goals and objectivesAn agency should never do a project just because it has the
funding. It takes significant effort to implement new technology in any organization. An agency should always know what business goals and objectives this new technology will help support. Maybe a new CAD/AVL system can help an agency meet its 85 percent on-time performance goal. Maybe it will generate bus arrival predictions to improve customer experience. Whatever the case, identify service levels and performance indicators that will be vital to knowing whether the results of this project can be considered successful. A lot of things need to be right for the system to know where a bus is and where it is going. If 75 percent of an agency’s buses track effectively in real-time, is that good enough to meet the expectations of its customers? Can it improve its service schedules using only 75 percent of the data? As much as peer reviews and consultants can be a guide, only you can set performance measures that will work for your agency. Do not be afraid to plan to change them over time as service improves.
Requirements should be set in the procurement process. But, once an agency is working with its selected partners, use the system design phase to clearly identify what is to be measured, how it will be measured and, most importantly, how it will be tested to know it is working properly.
Business objectives may change over time and as they are refined during the project implementation phase. Document these changes as they are agreed upon by the ITS project stakeholders. No matter how well written, unchanged original requirements rarely produce truly successful projects. What is critical is that the changes are well-documented. Things tend to be good in the beginning of a project. Verbal agreements are certainly easier to make then written ones. But, in multi-year projects, a lot can change including project dynamics and teams. At that point, all verbal agreements can be off.
Documenting changing project goals, objectives, and stakeholder assignments for use and maintenance of data can help an organization keep the ITS project on track long after initial implementation.
Stakeholder involvementStakeholder involvement throughout the life of a project is critical.
Far too often an IT Department is charged with delivering an ITS project. They work diligently through all of the stages of the V-model
of the system engineering project only to end up with a ‘successful’ project that misses the needs of operations. Early on, look with a broad view at whom will be impacted. Who will need to work with the system? Who will support it? How will the riding public be impacted? Generally speaking, ITS projects have a direct impact on staff (IT, Operations, Admin) and passengers. An agency may also want to include representatives of the organization that funded the project and other regional third parties with a vested interest. Maintain an organized process but allow voices to be heard. Nothing can guarantee success, but by actively involving stakeholders, obstacles that arise can be managed in a productive environment.
Stakeholder involvement does not end with project acceptance. Periodic meetings to review post-implementation challenges, training and re-training needs, equipment maintenance, and set-up and use issues are all important to ongoing project success. Proactively addressing these challenges will help an agency to take full responsibility and ownership of the ITS project long after the vendor has completed project implementation and acceptance tasks.
Lessons learnedUnless this new technology is on the bleeding edge, someone
else has previously implemented a project similar to yours. Some of them, after their project was completed, actually reflected on what worked well with the project and what could be improved upon. Take the time to take notes from their experiences. No matter how effective the project planning, practical experience is difficult to replace.
Mistakes result in lost time, money, and confidence in a project and the technology involved. An agency must do what it can to mitigate these risks. If there’s not someone on staff with direct experience, bring someone in from the outside. At a minimum, use someone for setting requirements, a schedule and a testing process. If possible, include them in the system design and testing phases.
One valuable lesson to be shared is to make sure that training is done when both the system and people are ready. Far too often, training is done prematurely (leaving staff unprepared when the system goes live). Retraining is required in almost all cases. Staffs change. Those who partake in initial vendor training may also benefit from retraining. Even the most tech-savvy learn with use and have questions about advanced functionality that may not have been presented during the initial training, or may not have been understood at the time.
Mary Sue O’Melia is president of TransTrack Systems®, Inc., a business intelligence solution that transforms volumes of data into meaningful information. David Brandauer is the chief operating officer for BLIC North America, a transportation technology consulting firm. Visit our authors at www.transtrack.net and www.blic.us.
TransIT

9busride.com | BUSRIDE
TransIT
How effective is my vehicle maintenance program?By Mary Sue O’Melia
Fleet maintenance systems provide significant information to help manage preventive maintenance programs and the management of parts, labor, costs and work orders associated with fleet repair. Determining and improving the effectiveness of a fleet however requires that maintenance data be analyzed by that fleet’s maintenance team. This column provides some suggestions about where to start.
What to measureWe all know that a good preventive maintenance program is
required for service reliability. Each day, managers look at PMs that are due, DVRs, vehicle availability, roadcalls and accidents during the day, and perhaps consumables (e.g., fuel, or oil use) from the day before. The immediate focus is having vehicles fueled and available for pull-out. The daily key performance indicator is the “number of vehicles available for pull-out” or “late pull-outs – vehicle not available”.
The measure of fleet maintenance effectiveness is “Miles Between Roadcalls” and this is a measure seen on most monthly Key Performance Indicator (KPI) Reports for executive management and/or policy boards. In discussions about the numbers, there should never be any confusion about the accuracy of the data. When measuring ’Miles Between Roadcalls,’ questions about accuracy are most often related to definitions of an agency’s data (i.e., what are you measuring, what is the source). Let’s look at the definitions for roadcalls and for miles.
Data definition - RoadcallsRoadcall is defined in many ways depending on who is doing the
measuring and for what purpose (e.g., Maintenance Department, Purchased Transportation Contract Compliance, and annual National Transit Database [NTD] reporting). Agencies may measure roadcalls in more than one way, but using the NTD definition allows for peer comparisons and a consistent and documented method of reporting. The definition won’t change with a change in management. Consistency over time in reporting is important if trend analyses or peer comparisons will be used. It is hard to tell if an agency is getting better or worse if the definitions keep changing.
The National Transit Database renamed roadcalls to be “Revenue Vehicle System Failures,” which are reported annually by mode/service type on the R-20 Preventive Maintenance Form. The definition of a revenue vehicle system failure applies to any vehicle that fails to complete a scheduled revenue service trip or start its next scheduled revenue service trip even when another vehicle is substituted. The failure may occur in revenue service (which includes layover and recovery time) or during deadhead travel. So a bus exchange for mechanical reasons at a layover counts as a “Revenue Vehicle System Failure.” Accidents and passenger bio-hazard (i.e., body fluids for the less technical) are non-mechanical and therefore are not included.
The NTD further classifies mechanical system failures as major (e.g., flat tires, brakes, doors, engine cooling systems, steering) because a vehicle cannot complete a trip or start the next trip. Other mechanical system failures are those items which as a matter of local policy require a vehicle to be removed from service (e.g., fareboxes, wheelchair lifts, heating, ventilation and air conditioning [HVAC]). If in doubt about
what is considered a system failure, then go to the NTD Annual Reporting Manual section for the R-20 Form found online at www.ntdprogram.gov under Reporting Manuals – Urban Reporting.
Data definition – MilesWhich mileage figure to use? Service Miles (i.e., pull-out for revenue
service to pull-in) or Vehicle Miles (hubometer or odometer)? Both, depending on the audience. KPI reporting to the policy board is easier if there’s only one mileage figure used for all KPIs. Agencies should know the scheduled service miles when budgeting for the upcoming year so this figure is available for use in estimating total vehicle miles and for setting performance targets. Service miles are also useful for peer reviews. NTD vehicle mile data is only available for vehicles in service at the end of the fiscal year. Mileage for vehicles taken out of service will not be available and will inflate performance figures. Use service miles for policy board and peer reviews.
For discussions with your team and for looking at mechanical failures in detail, use Vehicle Miles. These are readily available for each vehicle and may be summarized by fuel type, subfleet and mode/service type. Mileage data from the fuel island (where many agencies collect vehicle mileage data) should however be reviewed for accuracy as the opportunity for data input error is significant.
AnalysesFor agency-wide KPI reporting, operators will most likely be
reporting at the system, mode, or program level. At this level, maintenance managers can still review causes of roadcalls by type (e.g., Farebox, Engine, Brakes, and Wheelchair Lift), but will also want to review roadcalls by subfleet.
Other mechanical system failures tend to be items that may be the same across all subfleets, so improving the reliability of these items may have a significant impact on overall reliability. Major mechanical system failures tend to be related to the vehicle model and the way the equipment is maintained.
Once a contributor to mechanical failures has been identified, agencies need to find a solution. Industry research on the component or subsystem found online, contact with the manufacturer/other transit agencies, or discussing potential solutions with the maintenance team can all provide information leading to an appropriate strategy.
Improving fleet maintenance effectiveness requires involvement by the full team (e.g., supervisors, mechanics and materials management). Involvement starts with posting KPIs and performance results. An agency cannot win if the team does not know the score. Data definitions, collection of information, measurement, and analyses are all just background for the team to come up with strategies and actions to improve maintenance effectiveness and service reliability.
Mary Sue O’Melia is president of TransTrack Systems®, Inc., a business intelligence solution that transforms volumes of data into meaningful information. David Brandauer is the chief operating officer for BLIC North America, a transportation technology consulting firm. Visit our authors at www.transtrack.net and www.blic.us

BUSRIDE | TRANSTRACK SYSTEMS1 0 busride.com
Are customer comments being used to improve service quality?
By Mary Sue O’Melia
What to measureFor agency-wide KPI reporting, complaints per 100,000
passengers is the most commonly used indicator. Commendations per 100,000 passengers is the other part of the story that needs to be told as well. Declining customer complaints is not enough for agencies that want to provide the best possible service. The best agencies want their customers to have an outstanding public transportation experience. If the agencies are achieving this goal, then commendations will increase. The team needs to have its eye on both sets of statistics.
Data definitions
Many transit agencies distinguish between “valid” and “invalid” complaints. It’s funny how there is never a distinction between valid and invalid commendations – they are all just valid. Some agencies consider a complaint valid only if the customer provides contact information. Others investigate the complaint and if it can be verified as true, then it is valid. Complaints and commendations are not required data items for the National Transit Database (NTD) report so there is no industry definition.
Applying common sense says that if customers are upset enough about service to complain, or so impressed with service that they provide a commendation, then it is probably worth agency attention. There are no valid and invalid complaints or commendations, just customer comments.
We all know that perceptions are not necessarily reality and when they do not match up, that is part of the story too. For example, schedule adherence complaints may increase after a major schedule shake-up. Upon investigation it is shown that the buses were running on time according to the new schedules. Customers simply did not know the new schedules. This is an opportunity for improved communication with customers for future schedule changes. The issue is communications rather than schedules.
AnalysesA sample system analysis is shown to the right. The top three
complaints are: Rude Driver, Schedule Adherence, and Pass-Ups. Valid and Invalid complaints were reviewed but these add very little to the usefulness of information – Rude Driver, Schedules, and Pass Ups are still the top three types of complaint.
Suburban Bus and Commuter Services have the most complaints
per 100,000 passengers. Drilling down by program shows the following: Pass-Ups are the number one complaint for Suburban Bus; Schedule Adherence is the number one complaint for Commuter Services and Route Deviation; and Rude Driver for Metro City Bus.
Improving our customers’ experience with public transportation requires involvement by the full team in multiple departments (e.g., drivers, supervisors, vehicle maintenance, facilities maintenance, equipment maintenance, public relations and marketing, planning, service development and scheduling, customer service, and finance). Every department and function should be asking: “How can I help make public transit the mode of choice? What actions can I take to help improve the safety and quality of the public transit service that we provide? What are our customers telling us about their experience? Can I use this information to help focus improvement strategies?”
Involvement starts with posting KPIs and performance results. An agency cannot win if the team does not know the score. Collection of information, investigation, and getting back to customers is all just background for the team to come up with strategies and actions to improve the customer experience.
Mary Sue O’Melia is president of TransTrack Systems®, Inc., a business intelligence solution that transforms volumes of data into meaningful information for transportation managers and executives to use in planning, strategizing and ensuring optimal performance. Visit TransTrack Systems® at: www.transtrack.net
Many transit agencies have Customer Service Departments responsible for the public website, telephone information, transit centers and customer comments and complaints. Customer comments provide significant information about customer perceptions of their public transit experience. This information can be a valuable tool to help direct training, public information and messaging, and service quality and safety improvements.
1 1busride.com | BUSRIDE
How reliable is your service? By Mary Sue O’Melia
There is no industry standard for measuring service reliability, so each agency defines its own standard. Customers, however, know whether buses run on time or not, including the drivers that leave stops early and the routes that always run late.
When a customer waits at a bus stop, what is their expectation of when the bus will arrive? Did the agency post notices in advance regarding re-routes and detours for special events? Is there a “Bad Weather” schedule (e.g., operate lifeline service at lower frequencies)? Without communicating delays and changes, the customer feels everything should be as scheduled and the agency is either early, late or missing a trip.
Take the customers’ perspective when defining service reliability measures and standards.
DATA DEFINITIONSchedule adherence is often measured as a percentage on-time – it
could be the number of trips arriving on time or departing a time-point as scheduled. If a customer is at a bus stop looking at a stopwatch, what would they see as the bus arrives or departs the stop? On-time would be 00:00:00 to 00:05:59 – that is zero minutes early to five minutes late.
Agencies must also determine if they will measure departures, arrivals, or some combination of the two. Departure times are most common. Some agencies also include end of line arrival times and then exclude early arrivals. If agencies exclude early arrivals at the end of the line, are they perhaps allowing for early departures at stops between the last time point and the end of the line?
One way in which schedule adherence statistics may be manipulated is with “waivers.” This practice allows selected time-points for a specified period to be excluded from performance statistics.
Confused? Schedule adherence is a figure that seems fairly straightforward but is not.
VALIDATING AVL EQUIPMENTIf an agency is moving from manual checks for schedule adherence
to a new AVL system, it should expect to see a dramatic decline in reported performance with AVL implementation. Manual data collection results typically result in reported on-time performance of 90 percent or better.
Some agencies blame it on the AVL system and never report AVL statistics to policy boards. A simple comparison of schedule adherence for manual versus ALV data by date, time, route, direction and time-point will quickly indicate if there is a problem with AVL equipment. Many times the difference in reported numbers results from a skewed sample for manual counts. If there is a system for randomly selecting time points for manual checks, then the AVL and manual count may be close. AVL systems provide significantly more data with which to make an assessment of performance.
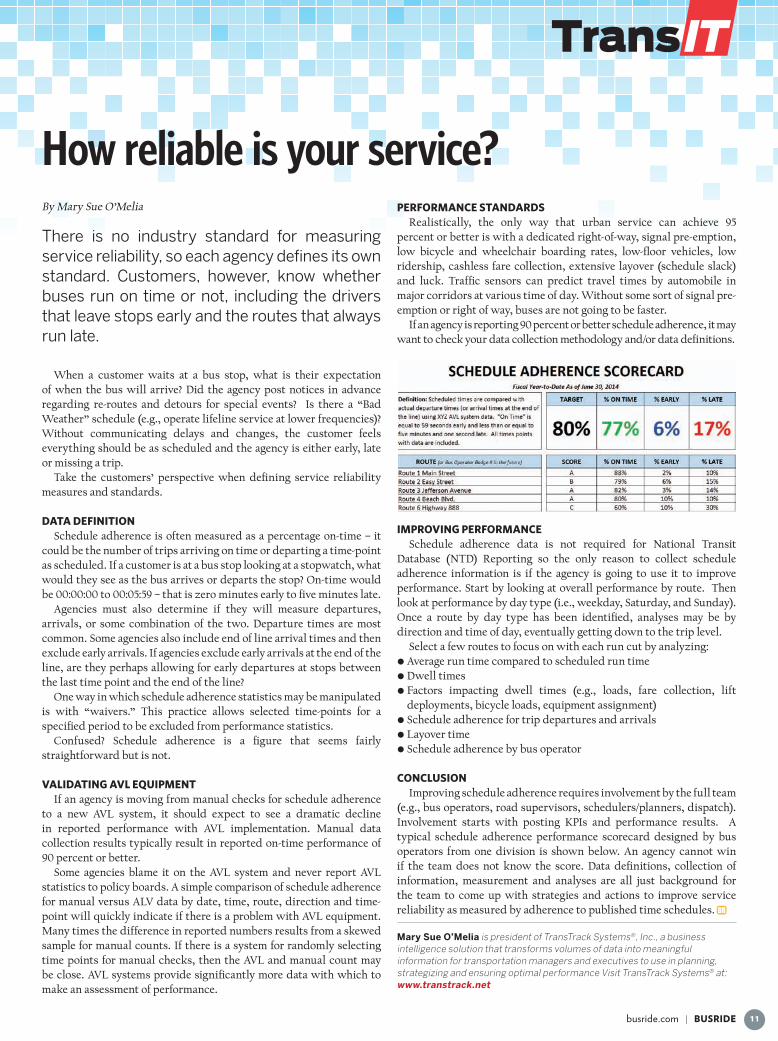
PERFORMANCE STANDARDSRealistically, the only way that urban service can achieve 95
percent or better is with a dedicated right-of-way, signal pre-emption, low bicycle and wheelchair boarding rates, low-floor vehicles, low ridership, cashless fare collection, extensive layover (schedule slack) and luck. Traffic sensors can predict travel times by automobile in major corridors at various time of day. Without some sort of signal pre-emption or right of way, buses are not going to be faster.
If an agency is reporting 90 percent or better schedule adherence, it may want to check your data collection methodology and/or data definitions.
IMPROVING PERFORMANCESchedule adherence data is not required for National Transit
Database (NTD) Reporting so the only reason to collect schedule adherence information is if the agency is going to use it to improve performance. Start by looking at overall performance by route. Then look at performance by day type (i.e., weekday, Saturday, and Sunday). Once a route by day type has been identified, analyses may be by direction and time of day, eventually getting down to the trip level.
Select a few routes to focus on with each run cut by analyzing:• Average run time compared to scheduled run time• Dwell times• Factors impacting dwell times (e.g., loads, fare collection, lift
deployments, bicycle loads, equipment assignment)• Schedule adherence for trip departures and arrivals• Layover time• Schedule adherence by bus operator
CONCLUSIONImproving schedule adherence requires involvement by the full team
(e.g., bus operators, road supervisors, schedulers/planners, dispatch). Involvement starts with posting KPIs and performance results. A typical schedule adherence performance scorecard designed by bus operators from one division is shown below. An agency cannot win if the team does not know the score. Data definitions, collection of information, measurement and analyses are all just background for the team to come up with strategies and actions to improve service reliability as measured by adherence to published time schedules.
Mary Sue O’Melia is president of TransTrack Systems®, Inc., a business intelligence solution that transforms volumes of data into meaningful information for transportation managers and executives to use in planning, strategizing and ensuring optimal performance Visit TransTrack Systems® at: www.transtrack.net
TransIT
BUSRIDE | TRANSTRACK SYSTEMS1 2 busride.com
TransIT
“Safety First” is more than just a slogan By Mary Sue O’Melia
The emphasis on safety has re-emerged as a federal priority with new MAP-21 reporting requirements. In January 2015, the Federal Transit Administration (FTA) revised safety and security reporting requirements to align National Transit Database (NTD) data with State Safety Oversight Program and Map-21 data sources. In May 2011, the FTA Office of Safety and Security sponsored release of the “Transit Safety Management and Performance Measure Guidebook.” As an industry, we know that safety is important and that we need to measure performance so that we can figure out how to improve. But where to start?
What to measureA typical goal is to provide a safe and secure environment for
passengers and employees. Objectives related to this goal may be to reduce the number of fatalities and injuries for passengers and employees. Typical measures are:
• Total Number of Fatalities• Total Number of Passenger Injuries• Total Number of Employee InjuriesTo achieve these objectives, agencies need to reduce the number
and severity of accidents, hazards, near-misses and security “events.” When it comes to accidents, some are unavoidable and therefore are classified as non-preventable. Number of employees, passengers served, passenger and vehicle miles travelled, and hours operated are all factors that influence exposure to risk. Typical measures include:
• Passenger Injuries Per 100,000 Passenger• Accidents Per 100,000 Total Service Miles• Preventable Accidents Per 100,000 Total Service Miles• Incidents Per 100,000 Total Service Miles• Employee Injuries Per Employee
Data definitionsNTD defines reportable safety and security events to include: (1)
Acts of God/Natural Disasters; (2) Collisions; (3) Fires; (4) Hazardous Materials Spill; (5) Derailments; (6) Personal Security (e.g., assault); (7) System Security (e.g., bomb threat); and (8) Other Safety Occurrences Not Otherwise Classified (e.g., passenger slips and falls). Events are reported based on Major Thresholds and Non-Major Thresholds. Major Thresholds for non-rail modes were recently revised but in general include any event involving a fatality, injury involving medical transportation from the scene of the event, property damage equal to or exceeding $25,000, evacuations, and collision accidents where a vehicle is towed. NTD statistics do not include occupational safety events occurring in administrative buildings. Injuries and incidents that do not involve medical transport are not reported.
The National Safety Council provides definitions and standards for most safety related indicators. A preventable accident is one in which the driver failed to do everything that reasonably could have been done to avoid a collision. Transit agencies may define an accident as any physical contact with the interior or exterior of transit agency equipment and facilities. An incident is any unusual event that occurs. These are much broader than NTD definitions.
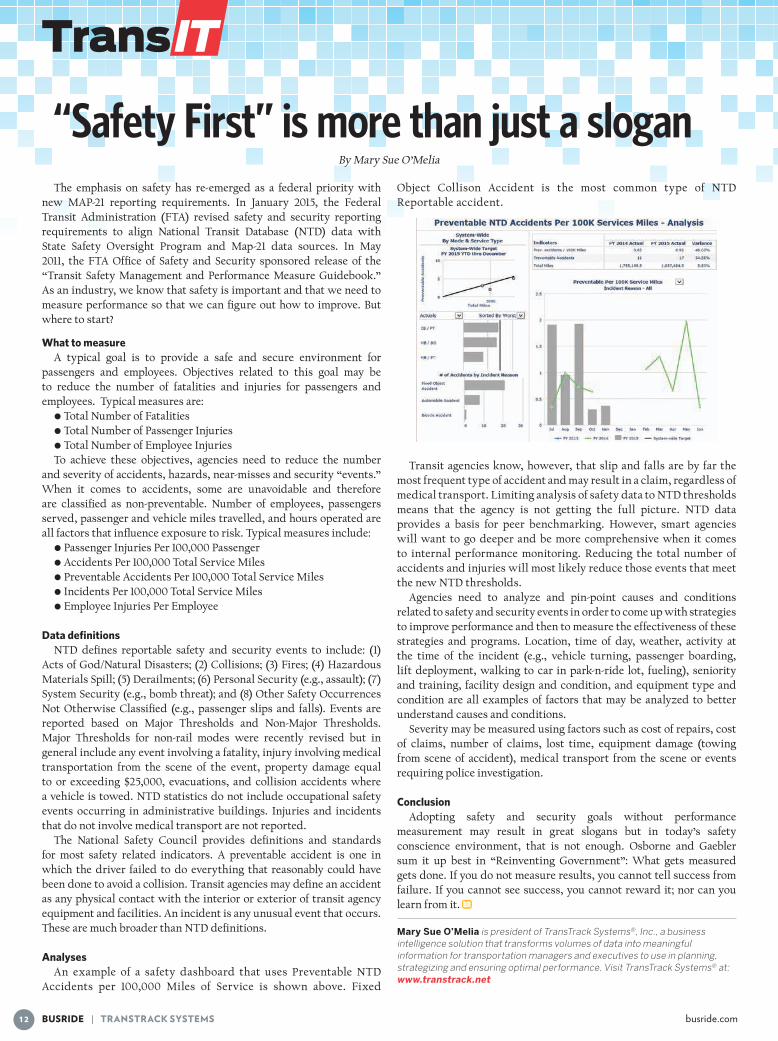
AnalysesAn example of a safety dashboard that uses Preventable NTD
Accidents per 100,000 Miles of Service is shown above. Fixed
Object Collison Accident is the most common type of NTD Reportable accident.
Transit agencies know, however, that slip and falls are by far the most frequent type of accident and may result in a claim, regardless of medical transport. Limiting analysis of safety data to NTD thresholds means that the agency is not getting the full picture. NTD data provides a basis for peer benchmarking. However, smart agencies will want to go deeper and be more comprehensive when it comes to internal performance monitoring. Reducing the total number of accidents and injuries will most likely reduce those events that meet the new NTD thresholds.
Agencies need to analyze and pin-point causes and conditions related to safety and security events in order to come up with strategies to improve performance and then to measure the effectiveness of these strategies and programs. Location, time of day, weather, activity at the time of the incident (e.g., vehicle turning, passenger boarding, lift deployment, walking to car in park-n-ride lot, fueling), seniority and training, facility design and condition, and equipment type and condition are all examples of factors that may be analyzed to better understand causes and conditions.
Severity may be measured using factors such as cost of repairs, cost of claims, number of claims, lost time, equipment damage (towing from scene of accident), medical transport from the scene or events requiring police investigation.
ConclusionAdopting safety and security goals without performance
measurement may result in great slogans but in today’s safety conscience environment, that is not enough. Osborne and Gaebler sum it up best in “Reinventing Government”: What gets measured gets done. If you do not measure results, you cannot tell success from failure. If you cannot see success, you cannot reward it; nor can you learn from it.
Mary Sue O’Melia is president of TransTrack Systems®, Inc., a business intelligence solution that transforms volumes of data into meaningful information for transportation managers and executives to use in planning, strategizing and ensuring optimal performance. Visit TransTrack Systems® at: www.transtrack.net

1 3busride.com | BUSRIDE
Setting performance targets for key indicators
By Mary Sue O’Melia
You have decided on key performance indicators (KPI), identified data sources and started collecting data. You can now monitor if you are getting better or worse relative to prior periods. But how do you know if you are good and getting better or are just awful despite improvements?
Key performance indicators (KPI)A suggested list of key performance indicators was provided in the
November 2014 issue of BUSRide Magazine, as shown below. Definitions and the reliability of alternative data sources have been discussed in this column since that time. At this point in time, agencies should be able to calculate most of these indicators using their FY 2014 NTD Report. Preliminary figures for the first quarter of FY 2015 should also be available.
What is good performance? Targets should represent improvements the agency desires to achieve.
Service plans and annual budgets provide much of this information, as does past performance. Sadly, if implemented as planned, some service plans and budgets result in declining performance. The focus should be on the status of the agency after three or five years of continuous improvement. Below is a sample of some performance targets that represent reasonable levels of overall performance.
Peer reviews to put performance in perspectiveRequirements that transit agencies meet specific performance
criteria vary from state to state and may differ based on the type of service and area of operations (urban versus rural).
A number of agencies conduct peer reviews using data available from the NTD website www.ntdprogram.gov. This helps with understanding your own agency’s performance relative to others of a similar size and operating environment.
The American Bus Benchmarking Group (ABBG) is another forum for determining performance relative to peers. While the forum is limited to mid-size transit operators, those that participate are able to determine agencies with the best performance or those agencies able to make the most improvement. How did my peers achieve these results? What programs did they implement and would these same actions work in my environment?
Take measurable actions to improve performanceThe purpose of setting targets and monitoring performance is to
help the team improve performance. This requires that the team be involved in identifying performance targets and the development of actions to improve performance.
For example, the Scheduling Team may decide to work on the 10 routes with the lowest on-time performance. Or, select the top five routes based on ridership and work on improving schedule adherence to provide the biggest benefit to the most riders.
All transit agencies are interested in improving safety. What is the most frequent type of accident at your agency? Passenger slip and falls due to sudden stops? Or falls when the bus leaves the stop? Analyzing causes and conditions can point the way to actions. Actions can be measured in terms of effectiveness. Did we accomplish what we set out to do?
Conclusion Information and technology are tools that have value only if an
agency uses them to improve safety and performance or to provide an outstanding travel experience for customers. What is your agency doing with the data and technology in which you have invested?
Mary Sue O’Melia is president of TransTrack Systems®, Inc., a business intelligence solution that transforms volumes of data into meaningful information for transportation managers and executives to use in planning, strategizing and ensuring optimal performance. Visit TransTrack Systems® at: www.transtrack.net
BUSRIDE | TRANSTRACK SYSTEMS1 4 busride.com
TransITThe Southwest of public transit bus companies By Mary Sue O’Melia
If there is an incident that causes a significant delay in service or inconvenience for your customers, what are your policies and practices for dealing with the customer? How does your agency define good customer service?
Poor customer service examplesIn the past month, I have twice experienced delays on the first
leg of air travel resulting in a missed connection and an unplanned mid-trip overnight stay. Two separate airlines – United Bad and American Worse.
In both cases, weather at the destination terminal was the reason for the initial delay. Equipment issues and a flight attendant decision to have an irate customer removed from the plane further contributed to late departures. In one case, lack of employee empowerment to hold the door on the last flight of the day resulted in 30 customers missing their connection. Neither company paid for hotel accommodations; weather is not the airlines’ fault and the other company admitted fault but ran out of vouchers – there may be some cots set out in Terminal K.
I could not help thinking, “What would Southwest do in the same situation?” I am fairly certain that whatever they did I would have been less annoyed – Southwest employees are just so polite and upbeat.
Good customer service starts at the top As I sit in Chicago O’Hare at 2 a.m. pondering the meaning of
customer service, I started thinking about public transit and how important the employees are in ensuring customer satisfaction. The attitude of customer service and doing what it takes to do right by the customers is a philosophy and core value. Some companies have it and some do not. Southwest and Nordstroms get it. Which transit agencies fall into the same class?
It is a corporate philosophy that must be constantly rewarded, reinforced and encouraged. When it is working, the customer definitely has a better experience and the employees seem happier too. When was the last time your agency or department rewarded outstanding customer service? Does your agency recognize real-time operational decisions that avert or at least alleviate a customer service nightmare?
This is a column on transit information technology, so what does this tirade have to do with technology?
Using technology to improve the customer experienceTransit technology provides a set of tools that, if utilized correctly
and maintained, can enhance the customer experience. For example, Automatic Vehicle Location (AVL) technology can provide real-time information to dispatch for corrective action, real-time information to customers about schedule adherence, and information that can be reviewed after the fact to improve schedules and identify drivers who require coaching (or drivers to reward for good schedule adherence).
Other examples include Automated Passenger Counting (APC) and Automated Fare Systems (AFS) technologies that can reduce the amount of time to board passengers, allowing drivers to pay attention to safe driving and taking the time to smile or at least nod as customers board the bus. Smart cards can provide a significant improvement in payment options and ease of payment, assuming the technology works. In-vehicle diagnostic equipment to reduce roadcalls, apps to tell customers when the next bus is arriving, online information for trip-planning, and Wi-Fi on commuter buses are technologies that can help improve the customer experience.
Technology and information systems can also tell us when things are not working so well or are outstanding. Customer comments, route ridership and farebox revenues all provide information about what customers think of transit service.
As companies, do we invest in technology to improve the customer experience? Do we include safety as well as comfort and convenience in our definition of what we are trying to provide? Do we collect data and spend public funds on systems so that we have information to make better decisions regarding resource allocation and to develop strategies to improve customer service?
Conclusion All this new technology is wonderful. We have the tools to help
monitor and improve customer service. However, if the organization and its people are not polite and helpful, then the technology will not matter. You cannot paint a smiley face on the farebox and call it customer service.
Mary Sue O’Melia is president of TransTrack Systems®, Inc., a business intelligence solution that transforms volumes of data into meaningful information for transportation managers and executives to use in planning, strategizing and ensuring optimal performance. Visit TransTrack Systems® at: www.transtrack.net.
1 5busride.com | BUSRIDE
Transit information technology – build versus buy
By Mary Sue O’Melia
An agency’s Information Technology Department is tasked with finding a better way to report information. Did the agency decide to build or buy? Does the agency now get timely information, or is it still waiting?
You can get better, but you can’t pay moreIt’s the summer of 2007 and I am at a transit agency board meeting.
Sitting next to me in the audience waiting to speak is a project manager of an ambitious ITS project. He is presenting an overview of the recently completed “middleware” project and proceeded to explain that middleware was a data warehouse for farebox, customer service, AVL and onboard vehicle diagnostic equipment. I asked how much this project costs – $100 million he said. I asked what kind of reports they were getting – he said none; that is the second phase of the project. I asked about maintenance and return on investment – he said that other agencies in the region were going to participate by adding their data to the project. I asked what this would cost – he said $15,000 per vehicle and then $1,500 per vehicle annual maintenance. The ITS project manager gave an example to the policy board of how this data could be used to improve service – data from the new AVL system was being used to investigate and validate customer comments.
In the fall, I was once again sitting in the audience of the same policy board. The ITS project manager was there to give an update. It seems that the union had protested the use of AVL data to validate customer complaints. Two years later, the executive director of this same agency stopped by our booth at a trade show and picked up a sample report noting, “I would have to wait a million years to get a report with basic route-level performance information.”
The Dashboard craze – build or buyIn 2008, interactive Dashboards with drilldowns became the
rage. Speedometer-type gauges become the standard in data visualization. Our company started looking for someone to build a set of Dashboards. We were about a month and $20,000 into a proof of concept project with a consultant specializing in dashboard development. It became very clear that at this pace, it would be years to develop a full suite of transit functional area dashboards.
In 2008, we got smart and searched out and procured a Business Intelligence solution. This was better than custom programming, but still required significant development time (two to four weeks once the design had been agreed upon). By 2012, it was clear that the world of Business Analytics had moved on – it was time to update.
Once again, we had the “build or buy” decision. Operations investigated the options and came to the conclusion that many IT Departments reach – it is more cost effective to build our own. Twelve months, and one Key Performance Indicator (KPI) Dashboard later, it was clear that we were not accomplishing what needed to be done – the goal was one functional area dashboard per month; not one per year. Operations decided they needed help and outsourced four of the 12 planned dashboards. After six months,
one of four projects was completed, but the visualization was too ugly to put into production.
Anything is possible with enough time and moneyThe build-your-own approach is really NOT less expensive. The
costs are just better hidden and often times not understood at the project start. For the past month, we have been researching and doing proof of concept visualizations working with a number of Business Analytics companies. Clearly Operations was biased when the decision to build our own BI tool was made.
If you are developing your own data warehouse and reporting tools – that is, develop versus buy – then here are a few things to consider:
• The IT Department will estimate the time to program new reports and Dashboards. The management team will need to factor in the time to design and specify reports, communicate these needs to the development team and then test and validate reports once completed. IT will then need to document business rules and algorithms. Be optimistic and assume that this cycle is required only twice per report. My rule of thumb is to triple the estimated time for development in order to be in the realm of reality.
• Then there are the hidden costs: hardware, software and the staff
to specify, configure, and maintain all of this equipment. When figuring out costs, remember that hardware has a useful life of about three years.
• Who will provide support to the internal end users? Who will be responsible for maintaining the database? Who will be responsible for on-going enhancements?
The argument that is often presented is that it is more cost effective to develop in-house – but time is also important. Remember the rule of thumb – triple all time estimates. This increases the cost. Do you know what the fully-loaded hourly cost is for your development team? What about your business analysts? Are you prepared to wait three years for that new Dashboard?
Conclusion
Remember the rule of three – three times the cost, three times the original schedule, and three times the frustration.
Mary Sue O’Melia is president of TransTrack Systems®, Inc., a business intelligence solution that transforms volumes of data into meaningful information for transportation managers and executives to use in planning, strategizing and ensuring optimal performance. Visit TransTrack Systems® at: www.transtrack.net
BUSRIDE | TRANSTRACK SYSTEMS1 6 busride.com
TransIT
– Predictive AnalyticsWHAT NEXT
You have Key Performance Indicators (KPI) Dashboard up and running. It provides timely, accurate information about past performance and is being used by managers within your organization to identify areas for performance improvement. Congratulations! You have made an impressive start. But there is always more if you are ready to take the next step.
Business intelligence is the past – predictive analytics are the future
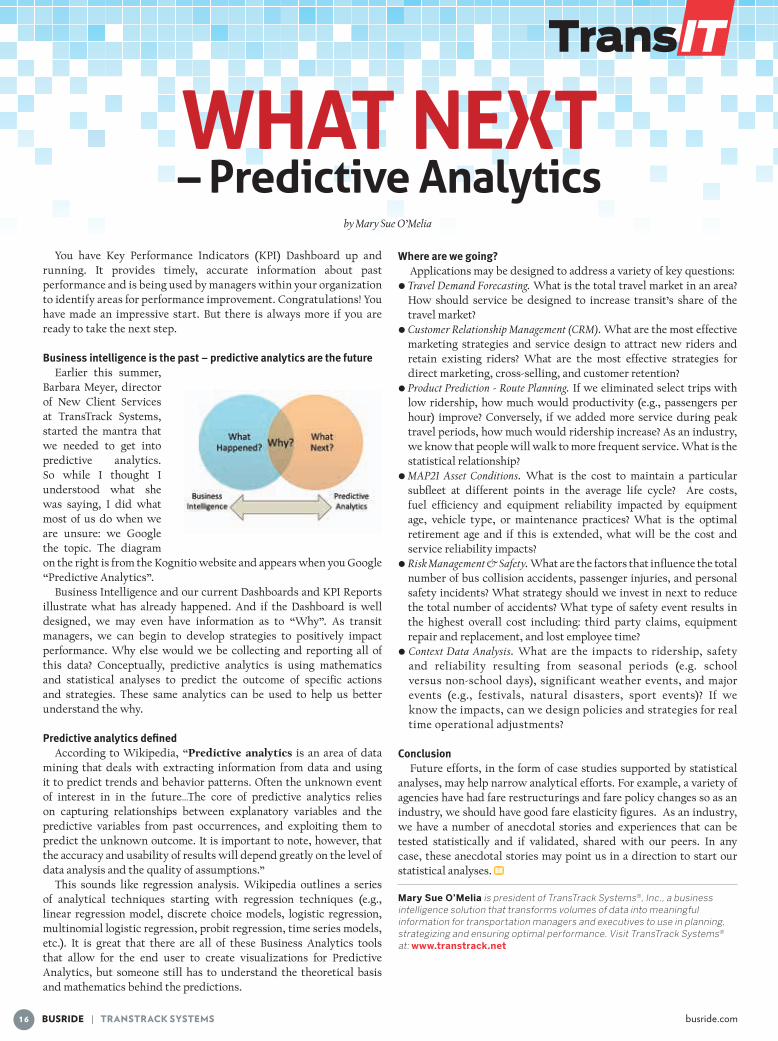
Earlier this summer, Barbara Meyer, director of New Client Services at TransTrack Systems, started the mantra that we needed to get into predictive analytics. So while I thought I understood what she was saying, I did what most of us do when we are unsure: we Google the topic. The diagram on the right is from the Kognitio website and appears when you Google “Predictive Analytics”.
Business Intelligence and our current Dashboards and KPI Reports illustrate what has already happened. And if the Dashboard is well designed, we may even have information as to “Why”. As transit managers, we can begin to develop strategies to positively impact performance. Why else would we be collecting and reporting all of this data? Conceptually, predictive analytics is using mathematics and statistical analyses to predict the outcome of specific actions and strategies. These same analytics can be used to help us better understand the why.
Predictive analytics definedAccording to Wikipedia, “Predictive analytics is an area of data
mining that deals with extracting information from data and using it to predict trends and behavior patterns. Often the unknown event of interest in in the future…The core of predictive analytics relies on capturing relationships between explanatory variables and the predictive variables from past occurrences, and exploiting them to predict the unknown outcome. It is important to note, however, that the accuracy and usability of results will depend greatly on the level of data analysis and the quality of assumptions.”
This sounds like regression analysis. Wikipedia outlines a series of analytical techniques starting with regression techniques (e.g., linear regression model, discrete choice models, logistic regression, multinomial logistic regression, probit regression, time series models, etc.). It is great that there are all of these Business Analytics tools that allow for the end user to create visualizations for Predictive Analytics, but someone still has to understand the theoretical basis and mathematics behind the predictions.
Where are we going?Applications may be designed to address a variety of key questions:
• Travel Demand Forecasting. What is the total travel market in an area? How should service be designed to increase transit’s share of the travel market?
• Customer Relationship Management (CRM). What are the most effective marketing strategies and service design to attract new riders and retain existing riders? What are the most effective strategies for direct marketing, cross-selling, and customer retention?
• Product Prediction - Route Planning. If we eliminated select trips with low ridership, how much would productivity (e.g., passengers per hour) improve? Conversely, if we added more service during peak travel periods, how much would ridership increase? As an industry, we know that people will walk to more frequent service. What is the statistical relationship?
• MAP21 Asset Conditions. What is the cost to maintain a particular subfleet at different points in the average life cycle? Are costs, fuel efficiency and equipment reliability impacted by equipment age, vehicle type, or maintenance practices? What is the optimal retirement age and if this is extended, what will be the cost and service reliability impacts?
• Risk Management & Safety. What are the factors that influence the total number of bus collision accidents, passenger injuries, and personal safety incidents? What strategy should we invest in next to reduce the total number of accidents? What type of safety event results in the highest overall cost including: third party claims, equipment repair and replacement, and lost employee time?
• Context Data Analysis. What are the impacts to ridership, safety and reliability resulting from seasonal periods (e.g. school versus non-school days), significant weather events, and major events (e.g., festivals, natural disasters, sport events)? If we know the impacts, can we design policies and strategies for real time operational adjustments?
ConclusionFuture efforts, in the form of case studies supported by statistical
analyses, may help narrow analytical efforts. For example, a variety of agencies have had fare restructurings and fare policy changes so as an industry, we should have good fare elasticity figures. As an industry, we have a number of anecdotal stories and experiences that can be tested statistically and if validated, shared with our peers. In any case, these anecdotal stories may point us in a direction to start our statistical analyses.
Mary Sue O’Melia is president of TransTrack Systems®, Inc., a business intelligence solution that transforms volumes of data into meaningful information for transportation managers and executives to use in planning, strategizing and ensuring optimal performance. Visit TransTrack Systems® at: www.transtrack.net
by Mary Sue O’Melia
1 7busride.com | BUSRIDE
Successful ITS project implementation – NOW WHAT?
You have successfully implemented your new ITS project, completing installation, set up, testing and validation processes. Employees at all levels of the organization are trained. Your new ITS project is up and running. You’re collecting and reporting data. Now what?
Plan for customer benefitsWhen the decision to purchase ITS (e.g., automated fare equipment,
automated vehicle location, automatic passenger counting) was made, what were the objectives of the project? What benefits did you forecast for your customers? These might include provision of real-time bus arrivals, mobile applications of service availability, easier fare payment, and information to better plan service routes and improve schedule adherence. Benefits accrue to your customers only if public information provided is accurate, equipment functions properly, and employees know how the system works in case there are issues or requests for assistance from customers.
Plan for maintenanceOngoing equipment maintenance is required for equipment on
vehicles, equipment to store data, and equipment to provide real-time information to customers. This mix of equipment requires a plan for preventive maintenance as well as capital replacement. You do not want to be the transit agency with a new ITS system that has 40 percent of the equipment down at the end of five years with no plan for how to rectify the issue. Whether your agency conducts the maintenance in-house or outsources, this is a critical aspect to long-term project success and needs to be operationalized in terms of processes, resources and budgets.
Plan for data upkeep and useThere are three types of data: (1) Data provided by the system for use
by customers; (2) Real-time data from the system used by operations; and (3) Historical data from the system used by planners.
Data used to feed systems that provide information to your customers need to be updated every time there is a change in fare policy, route alignment, route schedules and bus stop locations. And this information has to be correct. Most transit agencies change schedules at least once per year and some agencies much more frequently.
Much of the information received is real-time and requires immediate action from operations. For example: accidents, in-service incidents, vehicle bunching, late pull-outs and vehicle condition. Are processes and responsibilities clearly defined to empower employees to act in real time to address issues and correct problems? For example, how late does a vehicle need to be before a second bus is cut-in? How do you communicate with passengers real-time? Who is empowered to act and when?
Data after the fact is used to determine areas of good performance as well as those requiring attention. Analytics regarding future performance and primary factors contributing to past performance (e.g., impact of individual driver on schedule adherence performance) are also items to investigate. What did your organization plan on doing with all the historical data and information being generated by the new ITS? Do you have the staff resources to perform these analyses? How will you incorporate the results of these analyses into service plans, annual budgets, operating procedures and strategic plans?
Plan for ongoing trainingEmployees are trained on the new systems. Once they use the
system for a while, they may require additional training for “experts” or the next level. Very few of us can grasp all the aspects of a new system the first time through training. Experience in system use and then some level of additional training seems to work best. This applies to those responsible for system administration, data analysis after the fact, and data preparation and load for systems that provide information to your customers.
At the other end of the spectrum is the bus operator who is required to sign on to the system(s). While the single sign-on has helped immensely, who is responsible for monitoring this process and coaching should there be training issues?
Finally, there is staff turnover and promotions. Is training available on key systems? Many times complaints that a system is not working can be traced back to the system working but the person responsible for upkeep and maintenance does not know how or may even be unaware of the need for action. Ongoing training and re-training is a management issue rather than a systems issue.
ConclusionCapital ITS projects have an end date – when the new systems are
accepted and final payment rendered. The bigger challenge is ongoing maintenance of ITS equipment and systems, ongoing technical support, and ongoing training and retraining. These are management issues and require ongoing commitment, a plan and an operating budget.
Mary Sue O’Melia is president of TransTrack Systems®, Inc., a business intelligence solution that transforms volumes of data into meaningful information for transportation managers and executives to use in planning, strategizing and ensuring optimal performance. Visit TransTrack Systems® at: www.transtrack.net
by Mary Sue O’Melia
“Very few of us can grasp all the aspects of a new system the first
time through training.”

BUSRIDE | TRANSTRACK SYSTEMS1 8 busride.com
TransITFrom the Office of Performance Analysis – Transit Performance Measurement (TPM)
Judging from activity by the Federal Transit Administration (FTA), various State Departments of Transportation and Regional/Metropolitan Transportation Planning Organizations, as well as individual transit agencies, the focus of the transportation industry is narrowing in on performance measurement. Following the American Public Transportation Association (APTA) Annual Conference, the buzz on Transit Performance Measurement (TPM) continues.
APTA Performance SubcommitteeIn October during APTA’s Annual Conference in San Francisco,
CA, a new subcommittee met for the first time to address this topic specifically. Co-chairs Andrea Burnside, chief performance officer, WMATA, and Trish Hendren, principal, Spy Pond Partners, lead discussions on what issues and work this new subcommittee should undertake.
The subcommittee members offered comments on issues involved in key performance measurement that included:• Integrating key performance indicators (KPI), targets, business
plans and quarterly board reporting • Peer comparisons and establishing reasonable performance targets• Data quality and ease of use – why incidents are happening; causes
and conditions• Scalability – use of KPIs for large, medium and small operators• Data definitions and standardization of measures (e.g., on time
schedule adherence)• Integration of technology and data from multiple vendors and/or
agencies within an area• Use of KPIs and performance measurement to be a voice for transit• Defining performance measures at different levels within
an organization• Coaching, training, and skill development for a performance-
based organizationFollowing introductions, members broke into small groups to
develop a short list of priority topics for the subcommittee to address. With their suggestions posted on the wall, all who attended this subcommittee meeting were given yellow stickers to mark the issues they deemed to be of greatest concern; ones the subcommittee should address. While there was some mention of MAP21, it was not the primary focus of those attending the subcommittee meeting.
How to use performance measurement dataIn light of the discussion and reporting structure surrounding
MAP21, new reporting requirements have been proposed that place keener focus on the impact the general condition of assets has on safety. The focus now is on how organizations such transit agencies, MPOs, State DOTs, the FTA and FHWA will interpret and apply this asset information to make more informed decisions on the allocation of grant funds.
Knowing the costs involved with keeping public transit systems safe and in a state of good repair is of tremendous value in the lobbying
effort for public funding. For funding agencies to be capable of more precisely documenting measurable impacts of funds spent is an appropriate oversight function. Perhaps MAP21 is as simple as these two objectives.
With that said, it seems most of the focus is on new forms and reporting requirements. Complex methods are being devised to help make decisions on the allocation of funds in order to meet MAP21 objectives.
It is possible to make the program overly complex in an attempt to entice transportation management and decision-makers to invest in safety and keep their assets in a state of good repair. The APTA subcommittee is not jumping on this bandwagon. Besides, another APTA committee is tasked with all things MAP21.
The emphasis from this subcommittee is on Performance Measurement to support operational decisions and service planning — according to most of the comments during the discussion and the yellow stickers on the wall.
Within an organization, attention is being given to “actionable” performance measurement – what should the organizational unit be concentrating on for improvement; what it must know to determine if a particular area needs improving. Oversight and funding agencies were particularly interested in determining which agencies require help in defining, collecting and reporting performance statistics before they can begin addressing the key performance issues.
The optimum process would be to first identify what comprises good performance and then provide enough information to develop a more sound strategy for improvement. Once an agency or company has taken the proper action the next step is to collect timely information to determine if the actions taken were indeed effective.
The transit industry is certainly not interested in achieving measureable performance improvements that result in cost savings only to have their share of grant funds reduced as a result. The agency that capable of producing such cost savings should at least be permitted to share in the results.
Office of Performance Analysis – or something like thatThe concept of an organizational unit that targets performance
appears to be gaining popularity (e.g., WMATA, UTA, and NYTA). This makes perfect sense for larger agencies, particularly when the line-departments do not necessarily have staff with data analysis duties.
The idea also appeals to mid-size transit agencies grappling with the issue of data integrity and timeliness for monthly and quarterly reporting of key performance indicators (KPIs). Receiving timely KPI information is only the start.
The real challenge is to come up with and then implement and sustain viable action plans that clearly improve performance. Who in any organization has enough extra time, large enough staff, experience and resources for this? Yet, trying to measure performance with the intent to actually influence the outcome is all but impossible without these requisite conditions and resources.
An alternative approach is to designate staff within each organizational unit (e.g., department, division, office) to work together as a team to assemble and review monthly KPIs and then work within their assigned group to identify improvement strategies.
Performance is reported up the ladder to the executive and board levels), across departments and down to enlist support of line managers. In sports, the team cannot win the game if it doesn’t don’t know the score. This same principal applies to agencies attempting to improve performance.
Mary Sue O’Melia is president of TransTrack Systems®, Inc., a business intelligence solution that transforms volumes of data into meaningful information for transportation managers and executives to use in planning, strategizing and ensuring optimal performance. Visit TransTrack Systems® at: www.transtrack.net
by Mary Sue O’Melia