Fordham Intellectual Property, Media ... - Fordham University

Business Intelligence 101
Business Intelligence Team SSIA, Fordham IT 3/20/13

1 What is Business Intelligence?
2 Business Intelligence @ Fordham
3 Quiz
4 Demonstrations
5 Wrap up

What is BI?
• “Business Intelligence is a set of methodologies, processes, architectures, and technologies that transform raw data into meaningful and useful information used to enable more effective strategic, tactical, and operational insights and decision-making.” (Forrester Research)
• In a 1958 article, IBM researcher Hans Peter Luhn used the
term business intelligence
• In 1989, Howard Dresner proposed "business intelligence" as an umbrella term •Assumption, Guesswork, Gut Instinct, Intuition •Reliable facts, based on measurable evidence

What is BI?
Aces
Appworx
Banner Blackboard (Meal Plan)
Blackboard (Classroom Management)
Degree Works
Digital Measures
FSAAtlas
Grants
Hobsons
MonaLisa
OnBase
OneCard
Optika
Overture
PowerFAIDS
Pyramed
R25
RPlus
Titanium (Clinical data)
TK20
TM1 …

What is BI?
Data to Information to Insight

Data Warehouse
• “A data warehouse is a subject-oriented, integrated, time-varying, non-volatile collection of data in support of the management's decision-making process.” Bill Inmon
• “A data warehouse is simply a single, complete, and consistent store of data obtained from a variety of sources and made available to end users in a way they can understand and use it in a business context.” Barry Devlin, IBM Consultant

OLTP vs. OLAP
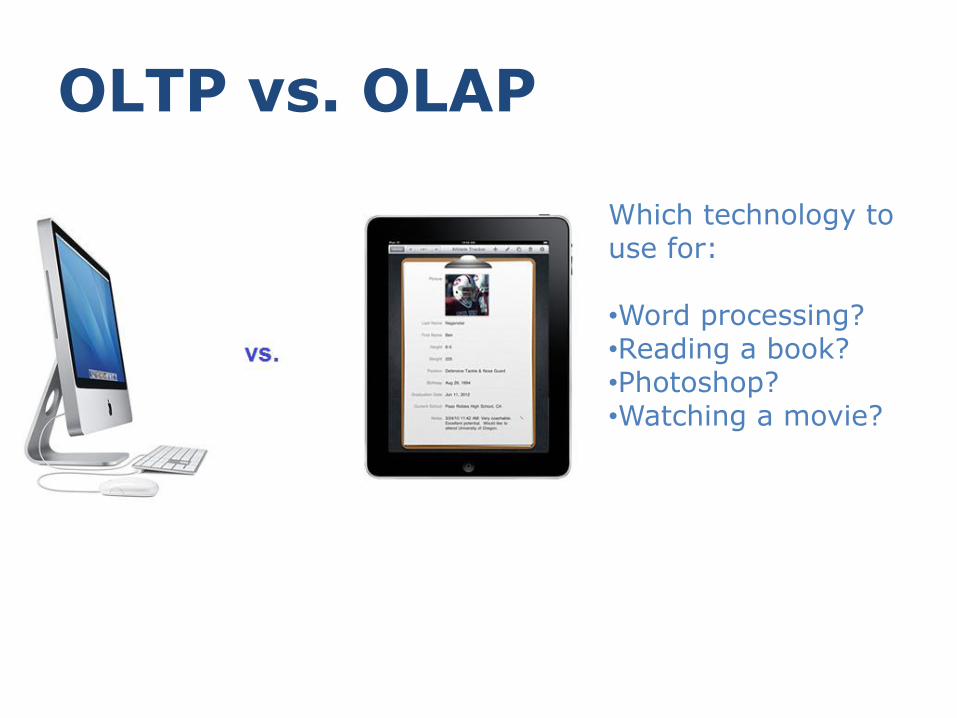
OLTP vs. OLAP
Which technology to use for: •Word processing? •Reading a book? •Photoshop? •Watching a movie?

Benefits of a DW
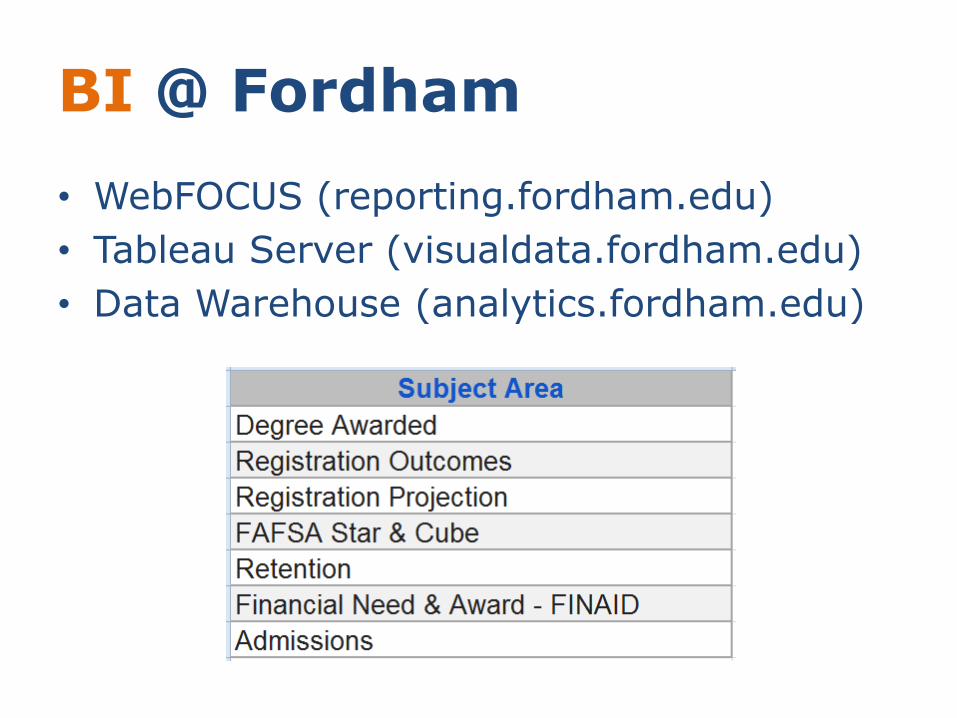
BI @ Fordham
• WebFOCUS (reporting.fordham.edu)
• Tableau Server (visualdata.fordham.edu)
• Data Warehouse (analytics.fordham.edu)

How many 9s in the grid below?

Is it easier to count now?

Demonstrations
• WebFocus
• Tableau Server
• Talend Data Integration
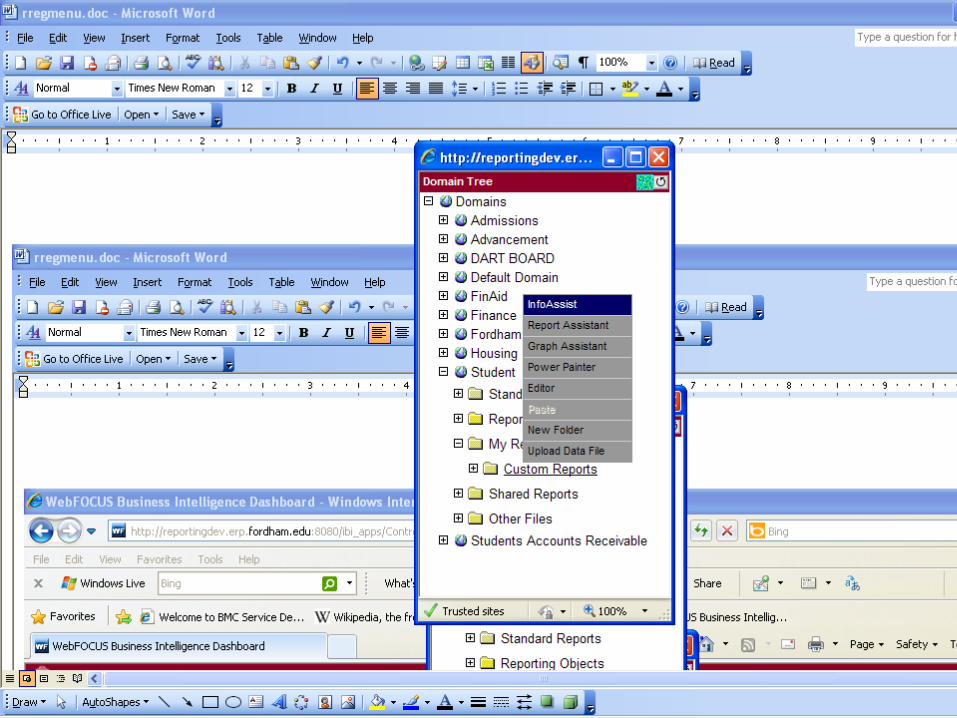
Reporting Tools
• Custom Reports Menu
• Self Service Reporting (SSR)
• InfoAssist

RRegmenu2

Menu2

Menu6

SSR1

SSR2

SSR4

SSR12
InfoAssist3

InfoAssist4

InfoAssist7
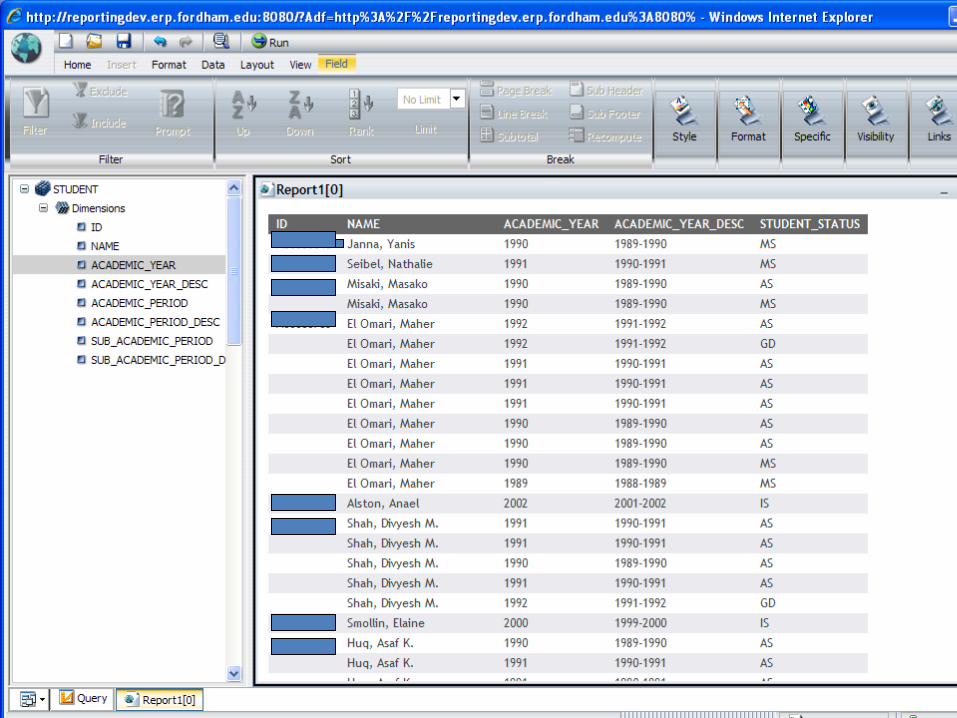
InfoAssist8

Demonstrations
• WebFocus
• Tableau Server
• Talend Data Integration

Demonstrations
• WebFocus
• Tableau Server
• Talend Data Integration

ETL visual programming with Talend
Giovanni De Marinis – Business Intelligence Analyst
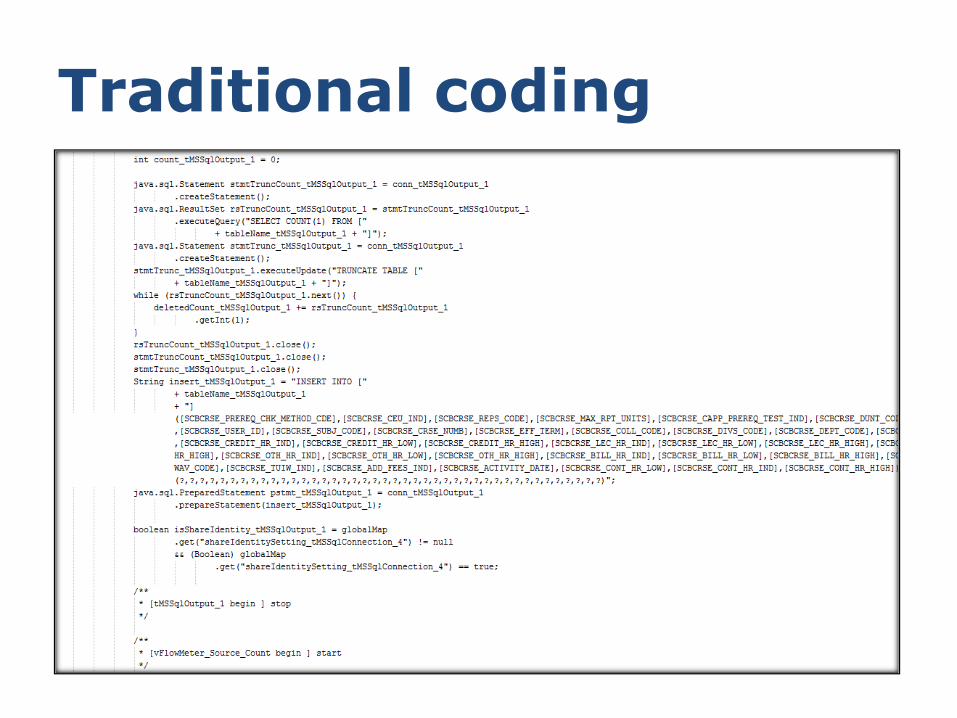
Traditional coding
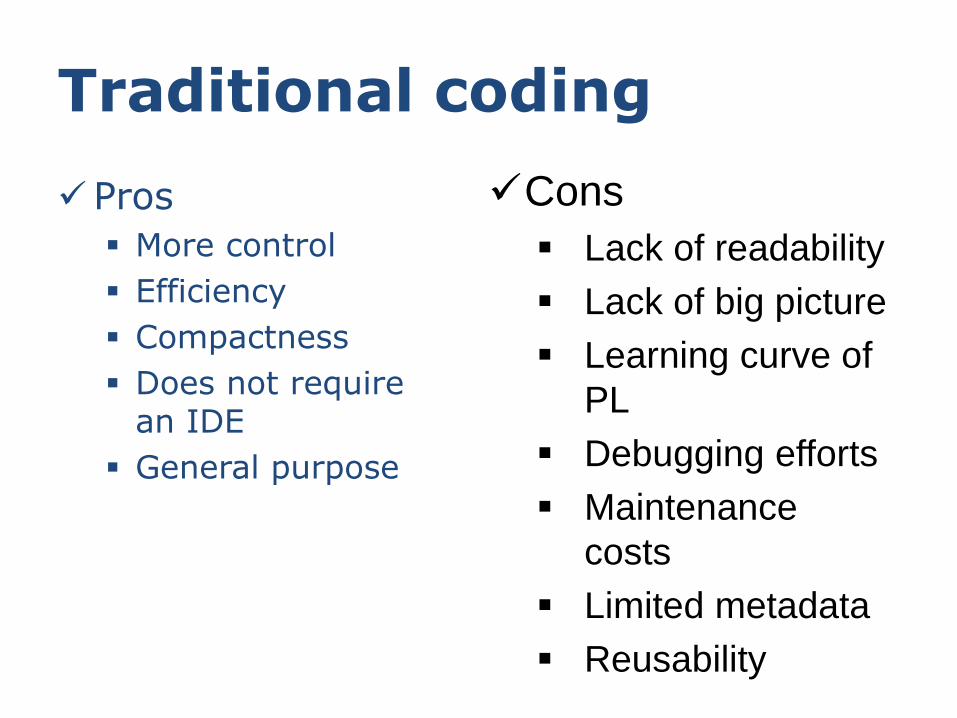
Traditional coding
Pros
More control
Efficiency
Compactness
Does not require an IDE
General purpose
Cons
Lack of readability
Lack of big picture
Learning curve of
PL
Debugging efforts
Maintenance
costs
Limited metadata
Reusability

Visual programming

Visual programming
Pros High readability Helps to enforce
metadata consistency
Fast learning curve Fast development Easy to maintain Visual
documentation Costs are very
much overshadowed by the benefits
Cons
Difficult to finely customize
Intrinsic limitations of the underlying programming language

ETL/ECCD
Extract Creation of a logical data mapping of source
systems
Physical extraction of data
Clean Identify and fix the errors and omissions in the
data
Conform Means resolving the labeling conflicts between
potentially incompatible data sources
Deliver Build, load and maintain fact and dimension tables

Data quality
A discipline ensuring that data is: Accurate
Complete
Consistent
Timely
Auditable
Some typical actions involve: eliminating inconsistent data
enforcing rules over data
creating consistent information through standardization

Data quality: example

Q&A
• Email [email protected]
• WebFOCUS reporting.fordham.edu
• Tableau Software visualdata.fordham.edu