BUREAU OF THE CENSUS STATISTICAL …€˜i BUREAU OF THE CENSUS STATISTICAL RESEARCH DIVISION REPORT...
20
‘i BUREAU OF THE CENSUS STATISTICAL RESEARCH DIVISION REPORT SERIES SRD Research Report Number: Census/SRD/RR-91/01 How Does Smoothing Estimated Monthly Control Totals Affect SIPP Estimation? bY Lynn Weidman and Larry Bobbitt Statistical Research Division Bureau of the Census Washington, D.C. 20233 This series contains research reports, written by or in cooperation with staff members of the Statistical Research Division, whose content may be of interest to the general statistical research community. The views reflected in these reports are not necessarily those of the Census Bureau nor do they necessarily represent Census Bureau statistical policy or practice. Inquiries may be addressed to the author(s) or the SRD Report Series Coordinator, Statistical Research Division, Bureau of the Census, Washington, D.C. 20233. Report completed: Report issued: February 7, 1991 February 7, 1991
Transcript of BUREAU OF THE CENSUS STATISTICAL …€˜i BUREAU OF THE CENSUS STATISTICAL RESEARCH DIVISION REPORT...
‘i
BUREAU OF THE CENSUS STATISTICAL RESEARCH DIVISION REPORT SERIES
SRD Research Report Number: Census/SRD/RR-91/01
How Does Smoothing Estimated Monthly Control Totals Affect SIPP Estimation?
bY
Lynn Weidman and Larry Bobbitt Statistical Research Division
Bureau of the Census Washington, D.C. 20233
This series contains research reports, written by or in cooperation with staff members of the Statistical Research Division, whose content may be of interest to the general statistical research community. The views reflected in these reports are not necessarily those of the Census Bureau nor do they necessarily represent Census Bureau statistical policy or practice. Inquiries may be addressed to the author(s) or the SRD Report Series Coordinator, Statistical Research Division, Bureau of the Census, Washington, D.C. 20233.
Report completed:
Report issued:
February 7, 1991
February 7, 1991
I .’
.
1. Introduction
For each of the Census Bureau’s household surveys, calculating final person weights involves several stages of adjustment to the initial sampling weights. The number of stages and details of the procedures differ somewhat by survey, but they all have two stages in common: adjustment for household nonresponse and adjustment to monthly age x race x sex (demographic) totals. When the latter adjustment is carried out for the Survey of Income and Program Participation (SIPP), it is done simultaneously with adjustment to monthly controls for six household types. These controls are estimated from the Current Population Survey, whereas the demographic totals are projected from the previous decennial census using birth, death and immigration data.
Each survey uses these same demographic totals and they follow smooth long term trends with little month-to-month variability. SIPP is the only survey to use household type controls which, being estimates, show quite a bit of month-to-month variation. It seems reasonable that since these controls are being treated as the “truth” for SIPP, it is desirable to fit to their “true” values rather than the “true” values plus monthly variability due to sampling. This study considers a smoothing of the household type controls by time series methods and compares properties of the original and smoothed controls, as well as properties of estimates derived from the two sets of controls. Section 2 summarizes the adjustment procedure being analyzed and the smoothing methodology used. The estimates are compared in section 3, and the final section discusses the results.
The investigation carried out is in the spirit of exploratory data analysis. No statistical tests have been performed or statistical claims made. We have compared the month-to-month variability for estimates using the original and smoothed weights, and tried to determine if there is a consistent pattern of variability reduction when the smoothed weights are applied. This analysis will help to determine the utility of smoothing household type controls before using them in the final adjustment procedure.
2. Final Adjustment and Smoothing Methodology
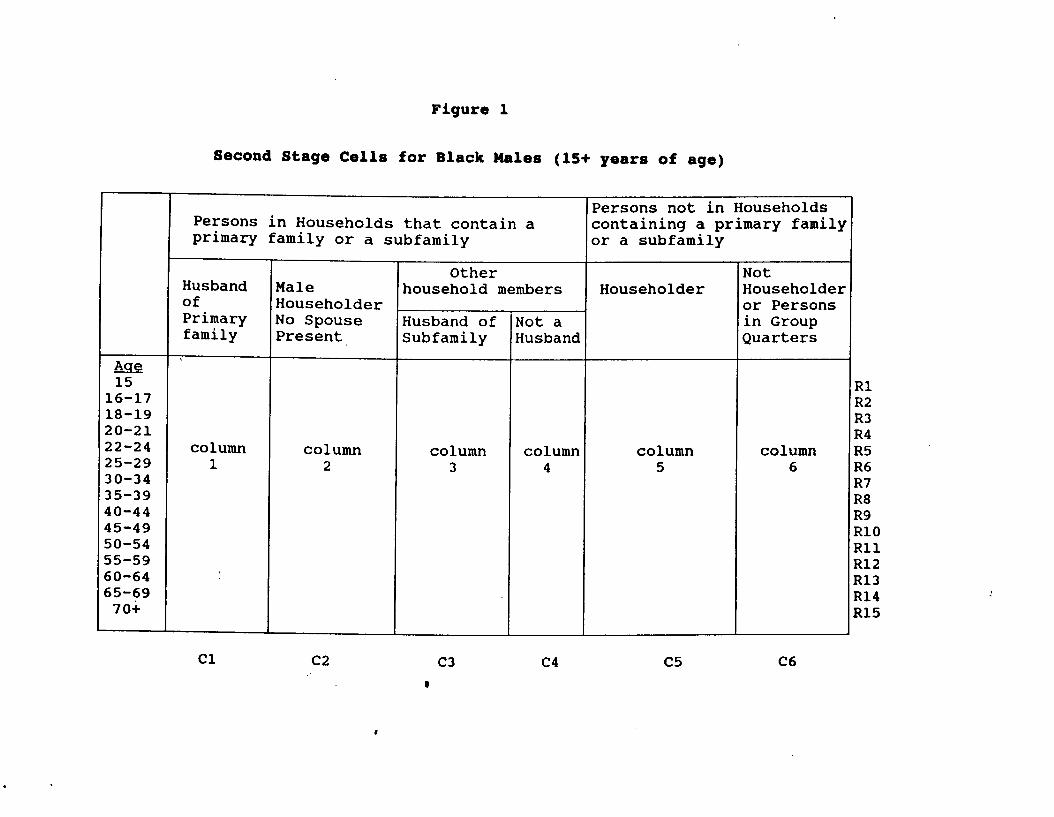
Figure 1 shows the two-way table used in the SIPP final stage adjustment of black males aged 15+. There is a similar table for each of eight age (O-14, 15+) x race (black, nonblack) x sex (male, female) combinations. The weighted cell counts in a table are alternately ratio adjusted to the row and column controls until each marginal weighted total is within a specified closeness to its control. The overall adjustment procedure is quite complicated, including adjustments for Hispanic totals and swapping of husband and wife weights between male and female tables, and will not be further described (See Waite (1988 a,b).) This study includes only persons age 15+ because of the additional work that would be required to write a separate adjustment program for the four age O-14 tables, but any patterns in the results should still hold when these additional persons are included.
For a given combination of race and sex there are six household type control totals that we want to smooth, for a total of twenty-four different control totals. For example, in Figure 1 the control totals correspond to the column totals Cl through C6 of the six columns. Figure 2 demonstrates

.
2
the much larger monthly variability over time of such a control total (in this case for black males age 30-34 in household type 1) as compared to demographic controls. Plots such as this reveal the need to investigate possible adjustment of the household control totals to reduce their variability.
There are several restrictions on the results of any smoothing adjustments which are employed to reduce the variability of the household type controls. First, the sum of the column totals for a given race/sex combination must add up to the sum of the row totals, so any smoothing performed on the column totals must preserve their sum. Second, some of the variability of the household type controls may be due to seasonality. Since seasonal variations may be important for analyses or other uses of the adjusted data, it is undesirable to remove these effects. There is ample reason to believe that the household control totals should be seasonal, since some of the factors (e.g. births, deaths, and marriages) that contribute to change in household type exhibit seasonal patterns of variation. In fact, seasonal variations in household type may explain some of the vast difference between the variability in the two series plotted in Figure 2.
Another restriction on the approach to the smoothing is that only 72 data points, monthly observations for June 1983 through May 1989, were available for each of the household type control totals when this study commenced. In our experience estimation of parameters for seasonal ARIMA models is typically not very good for short time series which exhibit this degree of variability, so we eliminated methods which use such models. For this reason we did not consider using either X-ll-ARIMA (Dagum, 1980) or X-12 (Findley, et al, 1988) seasonal adjustment methodologies.
We used the Census Bureau’s X-11 seasonal adjustment program (Shiskin, 1967) diagnostics, and spectrum plots generated using Splus, to determine which of the series were seasonal. Only two of the twenty-four control total series, household types 5 and 6 for black females, were found to not have a seasonal component. These last two series may also in reality be seasonal, but we were unable to reliably identify and estimate any seasonal@ for the series based on only six years of data. The two nonseasonal series were viewed as the sum of two components, (trend + variability), while the remaining seasonal series were viewed as the sum of three components, (trend + seasonality + variability). Our goal for all the control total series was to remove the variability without disturbing the remaining components.
ARIMA models for the two nonseasonal series were identified. In contrast to seasonal ARIMA models, we believe six years is adequate for estimation of nonseasonal ARIMA models for these series. The series were extended by one year of forecasts and one year of backcasts based on the AFUMA model. The extended series were then smoothed using a locally weighted regression procedure, LOESS, (Cleveland and Devlin, 1988, Cleveland, 1979). The ARJMA modeling and series extension was performed prior to the LOESS smoothing in order to improve the quality of the smoothing at the endpoints of the series. The remaining series were adjusted by removing the variability component estimated by X-11 from the seasonal series. To avoid later confusion, we will refer to the 24 resultant series as “presmoothed”.
3
The presmoothed series were obtained without the requirement that the monthly values of the six series for each race/sex combination sum to the monthly table totals. Fortunately, these two totals were nearly equal. This was probably because when the six estimates were calculated from CPS the two totals were required to be equal, and so the total of the variability components of the series as estimated by X-11 is very close to zero. Because the monthly presmoothed totals are so close to the table totals, a last simple monthly adjustment was made by multiplying each of the six presmoothed controls in a month by the ratio of the original table total to the presmoothed table total. (This does not change the component proportions.) We call the resulting series the smoothed series.
Table 1 lists the proportions of the table total contributed by each household type control each month in the black male series. Pairs of columns labeled 01 and PI compare the proportions for the original and presmoothed controls for household type I. An examination of this table shows that the proportions do not differ much between the two sets. In fact, the mean absolute % changes in proportions between the original and presmoothed controls range from .6% to 5.7%, as shown in the first row of Table 2. There are two means larger than 2.3% and they are for series that combined make up only about .O4 to .05 of ‘the total. Even smaller changes in proportions occur for the other three race x sex groups. The ratios by which each of the six presmoothed controls in a month are multiplied are given in the OT/PT column of Table 2. Note these ratios range only between .987 and 1.012. For the other three race x sex groups these ratios constitute even smaller intervals about 1.0.
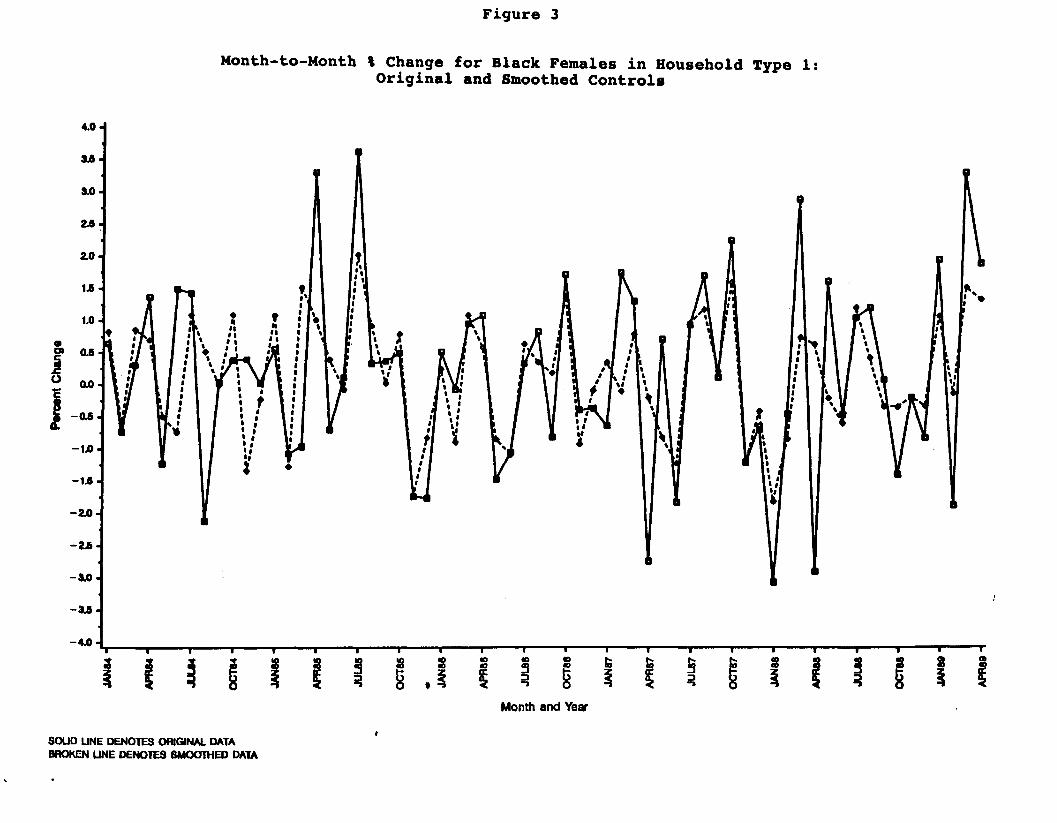
Table 3 summarizes the effect of smoothing on the relative month-to-month changes in the controls, (c,+~ - Ci)/Ci, where Ci is a control for month i, by comparing their mean absolute values for the original and smoothed series. An examination of these statistics shows that the smoothing has satisfied our objective of reducing month-to-month variability in the series. The minimum reduction for a series smoothed by X-11 is 20.2%, and the two series smoothed using LOESS have reductions of 58.8% and 80.8%. The time series plots in Figure 3 compare the original and smoothed controls for black females in household type 1. This is typical of the results of the X- 11 smoothing, with the largest monthly % changes being generally reduced. Figure 4 demonstrates the extreme effect of the LOESS smoothing which does not include monthly seasonal@. For black females in household type 6 the range of variability has been reduced from about (-22%,30%) to about (-3%,5%).
3. Comparison of Estimates
So far we have smoothed the household type controls used in the final stage of adjusting person weights. Because of the iterative procedure used in the final stage, we cannot predict the effect this smoothing will have on final weights or on estimates made using them. What we expect is that the month-to-month variation in many estimates will be reduced, especially for variables closely related to household type. For each variable in our analysis we compute 1988 monthly estimates using the 1987 SIPP panel. The eleven month-to-month differences are then summarized by their mean absolute value. In Tables 4 to 7 this mean absolute deviation (MAD) statistic is compared for final weights calculated using the original and smoothed controls. Recall
4
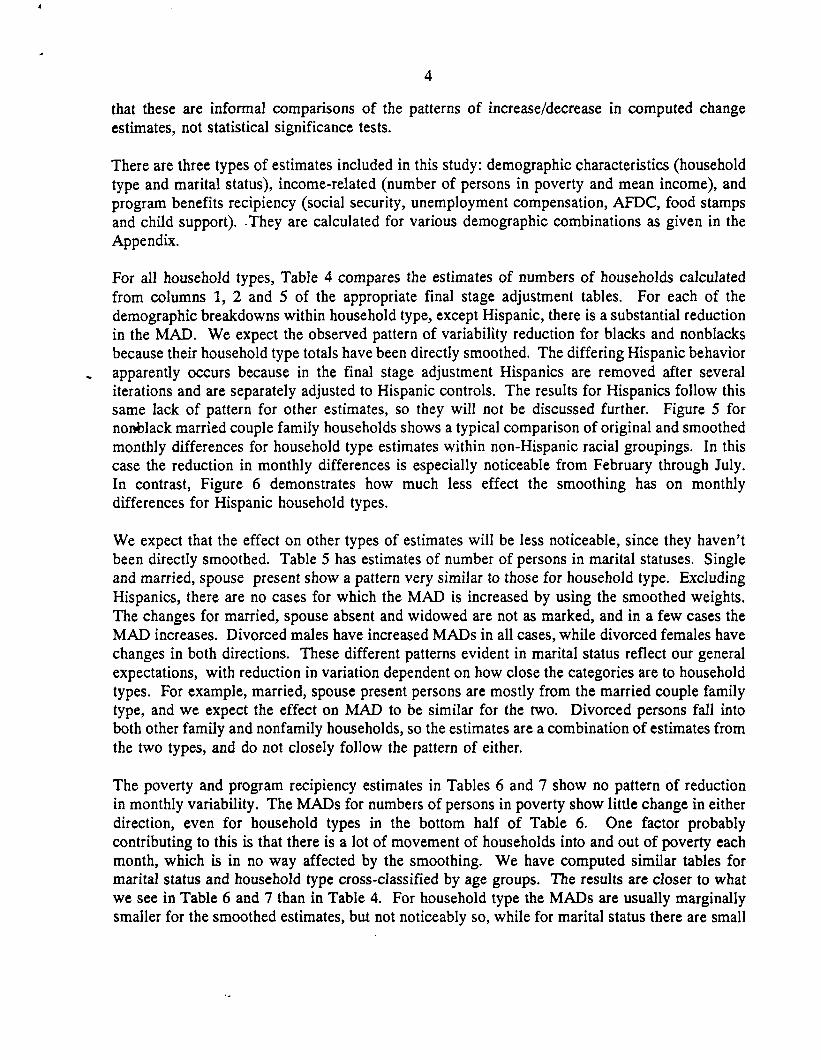
that these are informal comparisons of the patterns of increase/decrease in computed change estimates, not statistical significance tests.
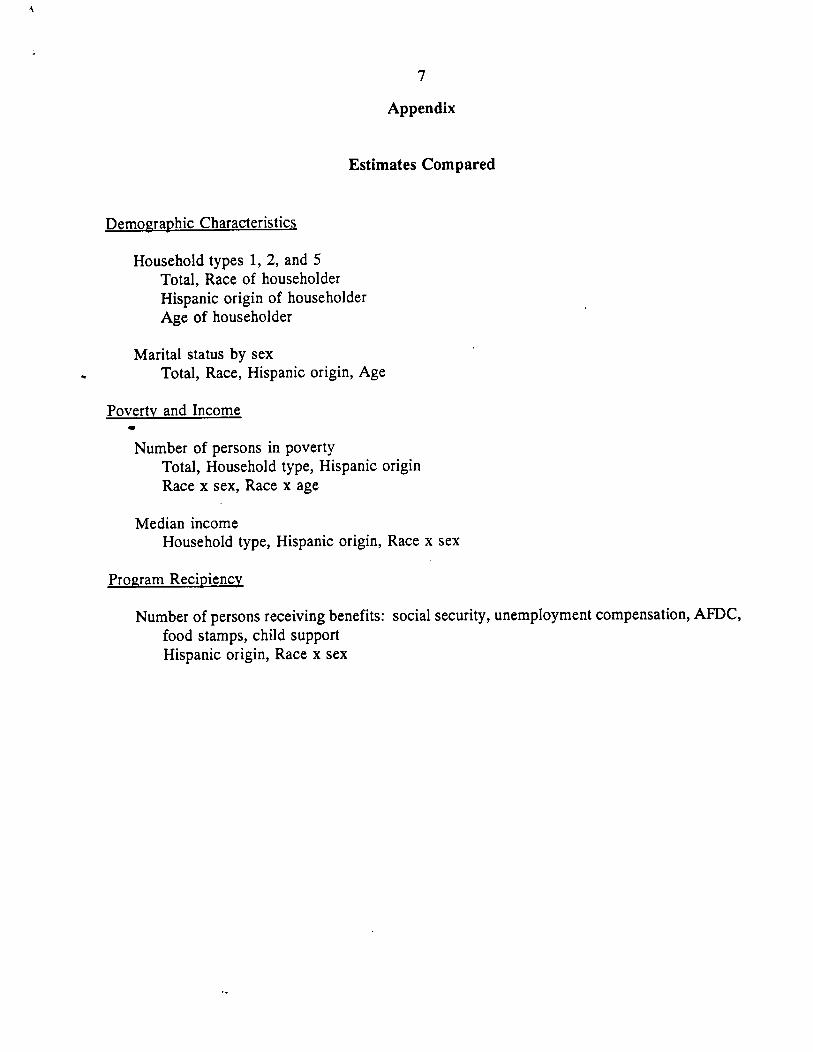
There are three types of estimates included in this study: demographic characteristics (household type and marital status), income-related (number of persons in poverty and mean income), and program benefits recipiency (social security, unemployment compensation, AFDC, food stamps and child support). -They are calculated for various demographic combinations as given in the Appendix.
For all household types, Table 4 compares the estimates of numbers of households calculated from columns 1, 2 and 5 of the appropriate final stage adjustment tables. For each of the demographic breakdowns within household type, except Hispanic, there is a substantial reduction in the MAD. We expect the observed pattern of variability reduction for blacks and nonblacks because their household type totals have been directly smoothed. The differing Hispanic behavior apparently occurs because in the final stage adjustment Hispanics are removed after several iterations and are separately adjusted to Hispanic controls. The results for Hispanics follow this same lack of pattern for other estimates, so they will not be discussed further. Figure 5 for no&lack married couple family households shows a typical comparison of original and smoothed monthly differences for household type estimates within non-Hispanic racial groupings. In this case the reduction in monthly differences is especially noticeable from February through July. In contrast, Figure 6 demonstrates how much less effect the smoothing has on monthly differences for Hispanic household types.
We expect that the effect on other types of estimates will be less noticeable, since they haven’t been directly smoothed. Table 5 has estimates of number of persons in marital statuses. Single and married, spouse present show a pattern very similar to those for household type. Excluding Hispanics, there are no cases for which the MAD is increased by using the smoothed weights. The changes for married, spouse absent and widowed are not as marked, and in a few cases the MAD increases. Divorced males have increased MADs in all cases, while divorced females have changes in both directions. These different patterns evident in marital status reflect our general expectations, with reduction in variation dependent on how close the categories are to household types. For example, married, spouse present persons are mostly from the married couple family type, and we expect the effect on MAD to be similar for the two. Divorced persons fall into both other family and nonfamily households, so the estimates are a combination of estimates from the two types, and do not closely follow the pattern of either.
The poverty and program recipiency estimates in Tables 6 and 7 show no pattern of reduction in monthly variability. The MADs for numbers of persons in poverty show little change in either direction, even for household types in the bottom half of Table 6. One factor probably contributing to this is that there is a lot of movement of households into and out of poverty each month, which is in no way affected by the smoothing. We have computed similar tables for marital status and household type cross-classified by age groups. The results are closer to what we see in Table 6 and 7 than in Table 4. For household type the MADs are usually marginally smaller for the smoothed estimates, but not noticeably so, while for marital status there are small

5
changes in both directions. The sum over age groups was smoothed, not the individual groups themselves, which is the likely reason for this result.
We also compared the quarter-to-quarter MADs and the annual totals for the original and smoothed weights, in order to determine the effects of the smoothing on longer-term estimates. Before doing the study, we thought that the differences between the two weightings would decrease as the time period of an estimate increased. This turned out to be the case for annual estimates, as there is rarely as much as a .l% difference between the original and smoothed. This is due to the trend component of the original series being changed little in the smoothing process. However, no overall pattern emerged for the quarterly estimates. This is because quarterly trends are not fit by the smoothed procedures, and the calendar definition of quarters has no inherent relationship with the monthly seasonality of the series.
f
4. Discussion
Thisstudy was initiated with the idea that smoothing the monthly household type controls would reduce month-to-month variation in person weights, which would lead to a reduction in month-to- month change estimates for many variables. This could be the case for SIPP because of the relative constancy of sample persons constituting a SIPP panel, but not for other Census Bureau household surveys because of their rotating samples.
The results were as expected for household type estimates and some marital statuses that are closely related to individual household types. For the other variables examined there was no general reduction in monthly variability. After rethinking the study, two possible reasons for the latter result were proposed. First, monthly variability for a characteristic will most noticeably be reduced only if the group of people having the characteristic remains largely unchanged from month to month. If the individuals in the group are changing, so are the weights of those who make up the group, and the estimates will also change. Second, the smoothed household type controls still have too much variation to give a general reduction in the month-to-month variability of person weights. The validity of this reasoning could be examined in further studies by, respectively, finding estimates that are derived from an almost unchanging cohort and making the household type series much smoother. The latter could be accomplished by, for example, eliminating all seasonality.
We are left with the question, “Is it worth the effort to incorporate this smoothing procedure into SIPP processing if it reduces the monthly variability of only household type and closely related marital status estimates?” We suggest that the answer is no. Any changes in the estimation process are warranted only if there is a “general benefit” for a wide or very important class of estimates. This study did not show such a benefit. It could be argued that there are estimates related to household type, such as numbers of marriages, births and deaths, which have some problems that might be improved by the smoothing. A separate study would be necessary to determine if this is the case. However, these problems are related to the levels of these
6
estimates, not month-to-month changes.
If the opinion of the SIPP Research and Evaluation Steering Committee was that this work should be pursued further, a necessary next step is the comparison of estimates such as marriages, births and deaths to benchmarks. If these comparisons show that the smoothed estimates are significantly closer to the benchmarks than the original estimates, then the inclusion of the smoothing procedure- would be recommended.
References
Cleveland, W.S. (1979), “Robust Locally Weighted Regression and Smoothing Scatterplots”, JASA, 74, 829-836.
Cleveland, W.S., and Devlin, S.J. (1988), “Locally Weighted Regression: An Approach to Regression Analysis by Local Fitting”, JASA, 83, 596-610.
Dagum, E. B. (1983), “The X-11 ARIMA Seasonal Adjustment Method”, Statistics Canada. Fint#ley, D. F., Monsell, B. C., Otto, M. C., and Pugh, M.G. (1988), “Toward X-12 ARIMA”,
Fourth Annual Research Conference Proceedings, Bureau of the Census, 591-622. Shiskin, J., Young, A.H., and Musgrave, J.C. (1967), “The X-11 Variant of the Census Method
II Seasonal Adjustment Program”, Bureau of the Census Technical Paper No. 15. Waite, P.J. (1988a), “SIPP 85+: Cross-Sectional Weighting Specifications for the Second and
Subsequent Waves -- Revision”, Internal Census Bureau memorandum from Waite to Walsh, August 4, 1988.
Waite, P.J. (1986), “SIPP 85+ : Cross-Sectional Weighting Specifications for Wave l”, Internal Census Bureau memorandum from Waite to Walsh, July 6, 1988.
4
7
Appendix
Estimates Compared
Demographic Characteristics
Household types 1, 2, and 5 Total, Race of householder Hispanic origin of householder Age of householder
Marital status by sex . Total, Race, Hispanic origin, Age
Poverty and Income *
Number of persons in poverty Total, Household type, Hispanic origin Race x sex, Race x age
Median income Household type, Hispanic origin, Race x sex
Program Reciniencv
Number of persons receiving benefits: social security, unemployment compensation, AFDC, food stamps, child support Hispanic origin, Race x sex
h E
it
OD
0 M 3

IN H
OU
SE
HO
LD T
YP
E 1
in
&
0 M
Perant
chulge

Pemmt
Change

Figure 5
100000
. 0
-1-
Em
loo00
0
-t-
--
--
--
Month-to-Xonth Differences for lonblack Married Coup10 Family Houroholds
.
m
, .
1.
. c
CLD KR MAY ☺VN JUL Au0 PEP 0m NOV DC0
Month
?iguro 6
Month-to-Month Differences for Hispanic Marrid Coup10 Family Eouroholds
ID APn MAY JUN dUL AUQ aEP 0- NOV DEC
MOnlh

OOO’f no’ OPO’ stt* fbl’ L9C’ 09E’ 800’ LOO’ bS0’ ZSO’ WE’ 68F’ 666'0 6CO' 8CO' Kt' SCt' LLC' ULC' 900' 000' bS0‘ ESO' LEE' 6eC' 000-t OtO' OWO' 9bt' Lbt' 99F' S9F' 600' 600' 950' 950' FBF' FBF' S66'0 bb0' bb0' Bbt' tS1' 19F' 99C' 600' OtO' LSO' 650' SLF' 1LF' fO0't tb0' ZVO' Sbt' PbI' 69F' 19E' 010' 110' LSO' 850' 8LE' LLfI' 666'0 ZbO' tt0' ))I' 6bT' 9Lt' tLE' 600' OtO' 950' SSO' FLC' OLC‘ ZOO'T PM' ZbO‘ bbt' Zbl' bLC' LLC' 800' 000' 950' eso- SLC' bLE' )66-O tb0' lt0' 6EI' Stt' OBE' Let' 000' LOO' 550' bS0' 91t' 91f' tt0'1 ObO' ZbO' 621' 121' S8F' 06E' LOO' LOO- LSO' 150' Zet' teC' 100-t SFO' SFO' Fbt' ))I' LLF' BLF‘ 600' 600' 950' ZSO' Oat' FBF' 000-t SFO‘ 9F.O' ltl' ZbI' OBF' LLC' 600' 800' 950' LSO' 6LC' 08E' 566'0 SFO' FFO' tbl' Zb1' SBF' b8t' 800' 600' LSO' 850' FLE' bLt' E66'0 LCO’ OEO’ SS1’ 551’ ELC’ OLC' 100' 010' bS0' 850' bl.C' 9LC' 000-l SFO' 9FO' bbl' bbl' FEE' SEC' LOO' 800' tS0' tS0' OeF' SLC’
500-t SFO' 8FO' Sbt' btl' 6LC' LLF' LOO' LOO' 150' TSO' IBE' t8E' S66'0 ObO' ObO' LbI' 6bI' eLt' OeE' 100' BOO' 150' LhO' BLC' LLC' FOO'1 LEO’ LCO’ ))I’ 6bI’ BLC’ e6E’ 800’ LOO’ eb0’ 6bO’ 9eE’ 9LE’
100-T 6FO' 9CO’ Ebt’ bbl’ eLC’ 6LC’ LOO’ 100' LVO' LbO' 98F‘ 8eP' 966-O ZbO’ BFO’ Ztt’ Zbt’ ELE’ SLt’ LOO’ 900’ 9bO’ LbO’ 6et’ Zbt’ 866-O ZVO’ bb0‘ MT’ Ltl’ ZLt’ 99E’ LOO’ LOO’ 6bO’ LtO’ E6t’ L6C’
000-t tb0' tb0' LET' 8FI' fLE’ bLC’ 100' LOO’ 150’ 050’ 06t’ eeE’
000-t 8FO’ 6EO' OVI‘ OCl' 69F' 89E' 010' 110' FSO' FSO' 06E' 06F' 666'0 LEO’ SEO‘ Ccl’ CCT’ Let’ 06C’ 010’ 010’ &SO’ ESO’ 6LE’ 6LE’
bOO'K LFO' SFO' LET' 6FI' ZLt’ 9LE’ 010’ 600’ 850’ 6SO’ SeC’ 1eC’
966'0 LEO' (CO' 9CI' 9CI‘ 9LC' ILt’ 600’ 600’ LSO’ 850’ sec. eec-
266'0 ZFO' SFO' SFt* SFI' CRC' b8E' 800' 600' SSO' 950' LBF' I8F' 500-t ZCO' ZEO' MT' SFI' let‘ 6LF' 800' 800' 00' 6bO' F6f' L6t' 966-O SEO’ FFO’ Ott’ Obt’ IBE’ ZBF’ 800’ LOO’ 6bO’ 9bO’ LEE’ 16C’
666'0 OtO' OtO' Ltt' lbl' SUE' 06E' 800' 800' 8bO' 9tO' Z6E' 9BF' zoo-t zco- tto* LET- en- tet- zeta 800’ LOO- ebo- 6bo- 16~’ 16t’
666.0 sco- CEO* 9ct- LF~- zet- zet- 800' 800' ebo- ebo- 16~' c6F- too-1 9EO' 6FO' EFI' IfT' IBF' IEF‘ 800' 800' 6bO' 6bO' F6F' F6F' 966’0 LEO’ SFO' IFT' ZEI' S8F' 96F' 800' BOO' ISO' ISO' 88F' LBF' 000'1 9CO' LEO' 'XI' FFI' LLF' 8LF' 010' 010' OSO' OSO' 16F' Z6F' tO0't MO' 6tO' Kt' SFl' SLF' 9LF' 010' 110' OSO' TSO' F6F' 68F' 000-t UFO' ObO' SET' BEI' SLF' FLt' 600' 010' OSO' 050' 06F' 06F'
Ad/&O 9d 90 Sd SO bd VO Cd CO Zd ZO td IO
68AW 68WV 68MW 68883 68NVC
88330 eellow eemo eedas eemv ee-fnc eeNnr eeAvl4 eeuv earn 88833 88NVf ie3aa LeAoN
femo
LEdaS Le3nv Lew LeNnr
fem
LBUdy
LBWH Leead 10NYC 98330 98MN 98530 98d3S 963nv 9emr 98Nrw
q-won
866'0 8CO' 6FO' Obt' Ott' SLF' Zlt' LOO- LOO' LPO' 9 10' t6E' b6C' )66-O FFO' IFO' ft1' ZbI' 6Lt’ 69t’ 100' 900' SbO' 0 ;O' 96f' LO)' 666'0 lF0' Oto' tbt' Sbl' LLE' blfi' LOO’ 900’ 9bO’ s ,O' 9dc- 66f' 666'0 bF0' LZO' 9b1' 9tI' LLF' FBF' 800' 600: 9bO' 9 10' 06F' 68F' ZOO'1 OFO' BZO' ZtI' 6F'I' Iet' LIE' 600' 600' SbO' S 10' Z6F' LBF' 500-t FFO' bC0' FbI' lb1' tLF' OBF' 010' 010' SbO' S ~0' b6F' 06E' 100-t LEO' OWO' FbI' CbI' e9F' S9C' 010' 010' SbO' S ~0' 96F' 96F' 966-O LFO' 8FO' OtI' ZCt' 89E' 19E' 010' 110' 9bO' 1 10' 66F' ZOb' 100-t 9FO' SFO' ObT' IbI' 99F' Z9F' 010' 010' eb0' 6 10' tOb' Fob' 166'0 ZFO' ZtO' OkI' 9tI' ZLF' bLF' 010' 600' et0' e IO' 16F' tot- ZOO-t bF0' bF0' Ltt’ LFI' bLF' bLF' 010' 010' LbO' L IO' L6F' 66F‘ L66’0 SCO’ SFO' SCI' SFI' EBF' SBF' 600' 800' 6bO' 1 '0' 06E' 06F' tO0'1: 6FO' LEO' bF1' tE1' 88F' 16C' 800' LOO’ bb0’ S !O' 6eF' 98F' 9OO’t 9FO' 9FO' FFT' LFI' LEE' 96F' 800' 800' EtO' Z 10' b6t' 06F' L86'0 LEO' ZFO' OFI' ZFl' L6F' SO)' BOO' 600‘ CbO' F 10' vet- oat- 966-O FbO' SbO' 'XI' FFI' E6F' IBE' 600' 600' StO' b 10' SBF' 18F' 666'0 6FO' ObO' ZEl' Ztt' 98t' Zet' 010' 010' WbO' b 10' 6eC' 16F' ZOO-t ObO' ObO' ZCt' ZFI' 68C' eeE' 600' 800' bb0' 5 10' get- fee- SOO'1. ObO' SbO' FFI' EEI' S8F' Zet' 800' 900' WO' t 10’ 6ec* eec- 500'1 LFO' 9FO' 6Zt' Ftt' LEE' 06F' 600' 600' SbO' S 10' Z6F' 8eF' 100-t bF0' ZFO' LZI' SZT' E6F' fob' 800' LOO- WO' 1 10' 16E' 98F' 666'0 BZO' BZO' 8Zt' 8Zt' 66F' L6F' 600' 600' LbO' 6 ,O' 6BF' 6BF' COO'1 620' BZO' SZI' bZ1' 86F' b6F' 010' 010' LtO' 9 PO' 16F' L6F' boo-1 OFO' ZFO' 9ZI' SZI" IOt' L6F' 600' 600' UbO' 1 10' LBF' 06C' L66’0 ZFO' IFO' SZI' Ltl' bob' 80)' 600' 600' bb0' 0 r0' 98C' Fet' too-1 OFO' 620' 9Zt' bZ1' tot' 90)' 600' 600' ZbO' Z ,O' 6UF' OFF- 000-t ZFO' IFO' 6ZT' 6ZT' 66t' tot' 010' 010' tb0' 9 10’ LBC’ 18C’ 566'0 6FO' 6FO' SFI' OFI' Z6F' Z6F' 600‘ 110' FtO' b 10’ Z8F' t8F' 110-t LFO' ZbO' SFI' Obt' S8F' BLF' 010' 010' ZbO’ Z 10' 16F' 68F' 866'0 ObO' ObO' 9FI‘ 9FI' 98F' LBF' 600' 600' ZbO' I 10' BBC' 8BE' 1OO't ZbO' bb0' Ltf' OPI' @LE. eLE' 000' 000' IbO' 0 10' t6f' 06F' 166'0 OVO' IFO' ZFt' FFI' t8F' bBt' 800' 800' ZbO’ b IO' b6F' 66C' b66'0 LFO' LFO' OCT. OFT' 98F' 08F' BOO' 600' WO' 9 to' S6F' 96F' tO0't 1FO' OFO' IFI' FFT' LBF' LEE' 600' 600' bb0' t 10' 86F' 16F' 000'1 OFO' OFO' 9ZI' EZI' S6F' 86E' 600' 600' ZbO’ Z 10' 16C' e6E' F66'0 620' 8ZO' btl' 611' bob' 60)' 800' 800' ZbO' t 10' Z6E' S6f'
&d/JO 9d- 90 Sd SO bd t0 Fd FO td !O Id IO
98Avn 9elldv 9euvn 9eead 9eNvr SWd(l S8AON SBA30 SBdaS SBOIN WIN' SBNIW seavn sendv sewn seaad semfr bexia ~BAON b8mo bedas be9nV bemr #BNflf berm C8MdV beuw b8Bad be1(yr Fe380 FeAON F&L30 CBd3S FWllV Femr FeNnr
qauw
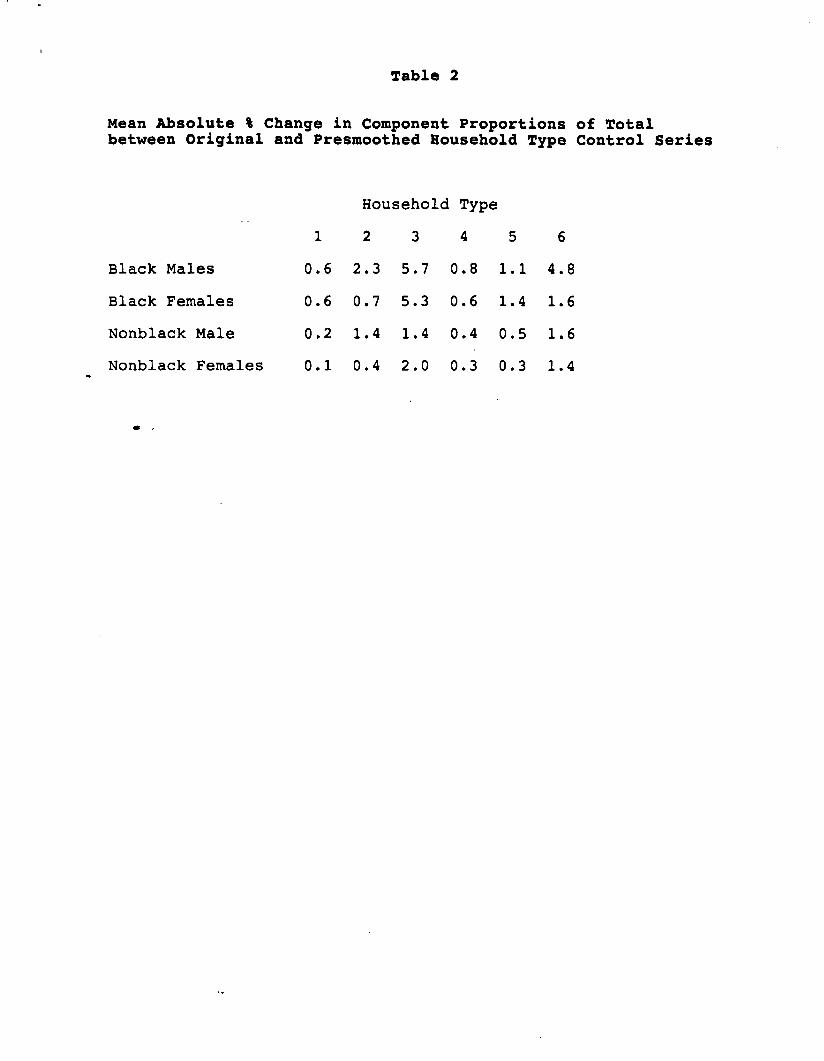
Table 2
Mean Absolute % Change in Component Proportions of Total between Original and Presmoothed Rousehold Type Control Series
Household Type
12 3 4 5 6
Black Males 0.6 2.3 5.7 0.8 1.1 4.8
Black Females 0.6 0.7 5.3 0.6 1.4 1.6
Nonblack Male 0.2 1.4 1.4 0.4 0.5 1.6
Nonblack Females 0.1 0.4 2.0 0.3 0.3 1.4 *
* ,
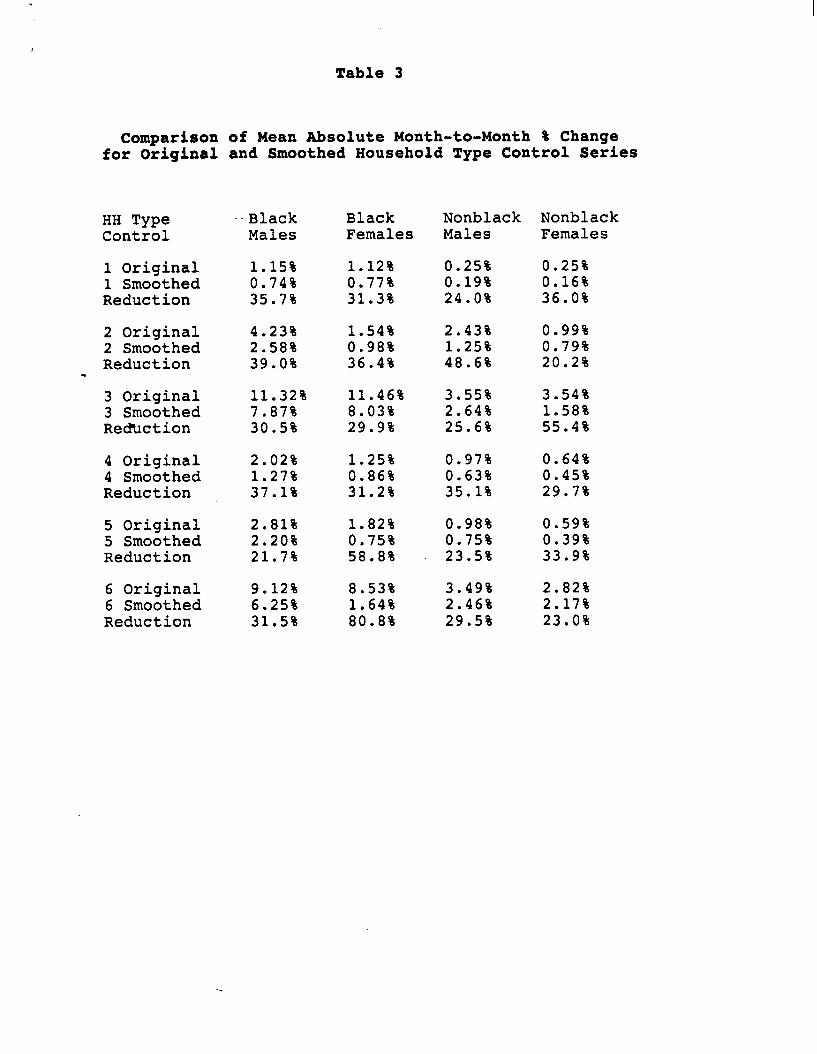
Table 3
Comparison of Mean Absolute Month-to-Month % Change for Original and Smoothed Household Type Control Series
HH Type Control
1 Original 1 Smoothed Reduction
2 Original 2 Smoothed Reduction
3 Original 3 Smoothed RedQction
4 Original 4 Smoothed Reduction
5 Original 5 Smoothed Reduction
6 Original 6 Smoothed Reduction
Black Males
1.15% 0.74% 35.7%
4.23% 2.58% 39.0%
11.32% 7.87% 30.5%
2.02% 1.27% 37.1%
2.81% 2.20% 21.7%
9.12% 6.25% 31.5%
Black Females
1.12% 0.77% 31.3%
1.54% 0.98% 36.4%
11.46% 8.03% 29.9%
1.25% 0.86% 31.2%
1.82% 0.75% 58.8%
8.53% 1.64% 80.8%
Nonblack Males
0.25% 0.19% 24.0%
2.43% 1.25% 48.6%
3.55% 2.64% 25.6%
0.97% 0.63% 35.1%
0.98% 0.75% 23.5%
3.49% 2.46% 29.5%
Nonblack Females
0.25% 0.16% 36.0%
0.99% 0.79% 20.2%
3.54% 1.58% 55.4%
0.64% 0.45% 29.7%
0.59% 0.39% 33.9%
2.82% 2.17% 23.0%

Table 4
Household Type
Mean Absolute Deviation
% Change Original Smoothed in MAD
Married Couple Family HH (Type 1) Total 186659 56655 -69.4 Hispanic Householder 21413 19109 -10.8 Non-Hispanic II 171180 61495 -64.0 Black II 48247 26322 -45.4 Nonblack II 156789 54801 -65.0
Other Family HHs with Male Householder (Type 2) W Total 51002 33149 -35.0
Hispanic Householder 17332 18217 5.1 Non-Hispanic II 49875 32031 -35.8 Bldck II 20870 16445 -21.2 Nonblack II 53530 29690 -44.5
Other Family HHs with Female Householder (Type 2) Total 104048 75633 -27.3 Hispanic Householder 16860 19184 13.8 Non-Hispanic II 101568 75955 -25.2 Black II 54109 41452 -23.4 Nonblack ,I 73647 56192 -23.7
Nonfamily HHs with Male Householder (Type 5) Total 134591 92154 -31.5 Hispanic Householder 28314 30909 9.1 Non-Hispanic II 158516 115530 -27.1 Black II 59019 50505 -14.4 Nonblack II 105901 53272 -49.7
.
Nonfamily HHs with Female Householder Total 82161 -41.6 Hispanic Householder 15109 12753 -15.6 Non-Hispanic II 79642 50718 -36.6 Black II 17596 10687 -39.3 Nonblack II 81238 42805 -47.3
._
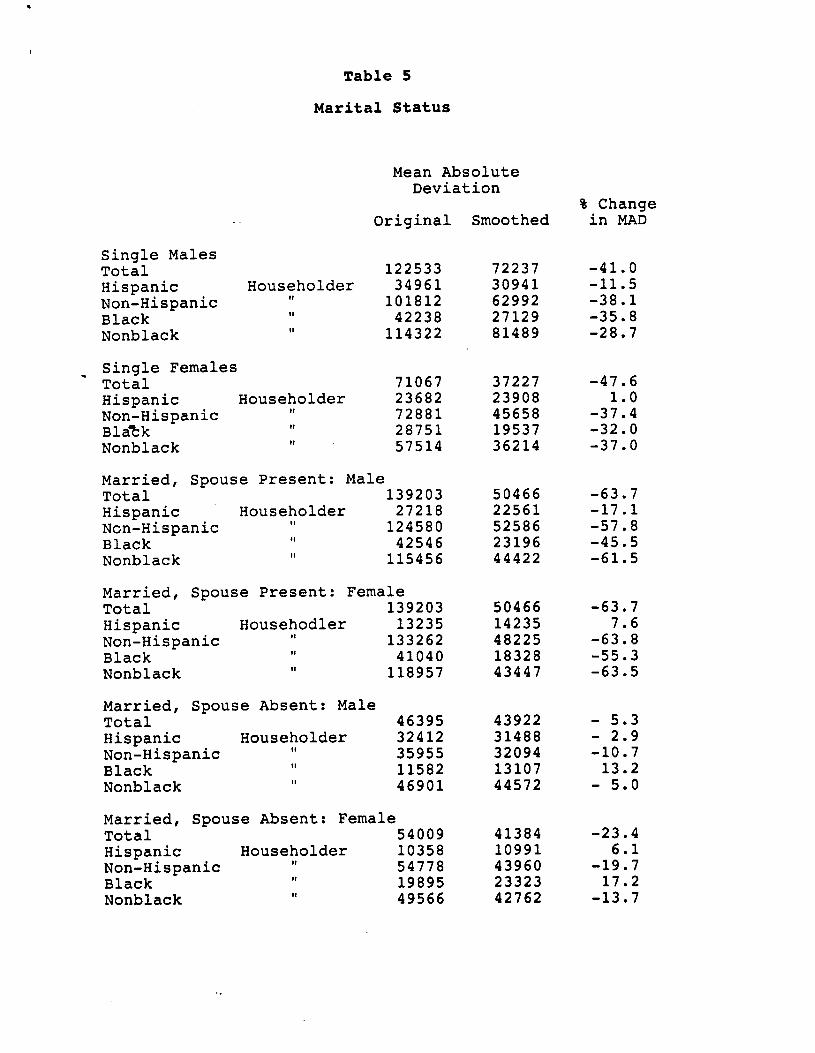
Table 5
Marital Status
Single Males Total Hispanic Householder Non-Hispanic I,
Black ,I
Nonblack II
Single Females * Total
Hispanic Householder Non-Hispanic tt
BlaEk II
Nonblack II
Smoothed
Mean Absolute Deviation
Original
122533 34961
101812 42238 114322
% Change in MAD
72237 30941 62992 27129 81489
-41.0 -11.5 -38.1 -35.8 -28.7
71067 37227 -47.6 23682 23908 1.0 72881 45658 -37.4 28751 19537 -32.0 57514 36214 -37.0
Married, Spouse Present: Male Total 139203 Hispanic Householder 27218 Non-Hispanic II 124580 Black 1, 42546 Nonblack II 115456
Married, Spouse Present: Female Total 139203 Hispanic Househodler 13235 Non-Hispanic II 133262 Black II 41040 Nonblack II 118957
Married, Spouse Absent: Male Total 46395 Hispanic Householder 32412 Non-Hispanic II 35955 Black II 11582 Nonblack ,I 46901
Married, Spouse Absent: Female Total 54009 Hispanic Householder 10358 Non-Hispanic II 54778 Black II 19895 Nonblack ,I 49566
50466 -63.7 22561 -17.1 52586 -57.8 23196 -45.5 44422 -61.5
50466 -63.7 14235 7.6 48225 -63.8 18328 -55.3 43447 -63.5
43922 - 5.3 31488 - 2.9 32094 -10.7 13107 13.2 44572 - 5.0
41384 -23.4 10991 6.1 43960 -19.7 23323 17.2 42762 -13.7

Table 5
(continued)
Mean Absolute Deviation
Widowed Males Total Hispanic Householder Non-Hispanic
II
Black II
Nonblack ,I
_ Widowed Females Total Hispanic Householder Non-Hispanic
II
B&k II
Nonblack' I,
Divorced Males Total Hispanic Householder Non-Hispanic
0
Black II
Nonblack II
Divorced Females Total Hispanic Householder Non-Hispanic
II
Black II
Nonblack ,I
Original Smoothed % Change in MAD
28742 22781 -20.7 4752 4444 - 6.5
30752 24382 -20.7 6586 8738 32.5
28233 19203 -32.0
53642 39383 -26.6 9285 9027 - 2.8
48405 38716 -22.0 11290 8204 -27.3 47372 33637 -29.0
43145 52959 22.7 14426 15318 6.2 44075 50755 15.2 23739 24424 2.9 33370 48069 44.0
38117 38134 0.0 11398 11338 - 0.5 39467 34895 -11.6 22342 15603 -30.0 30275 39763 31.3
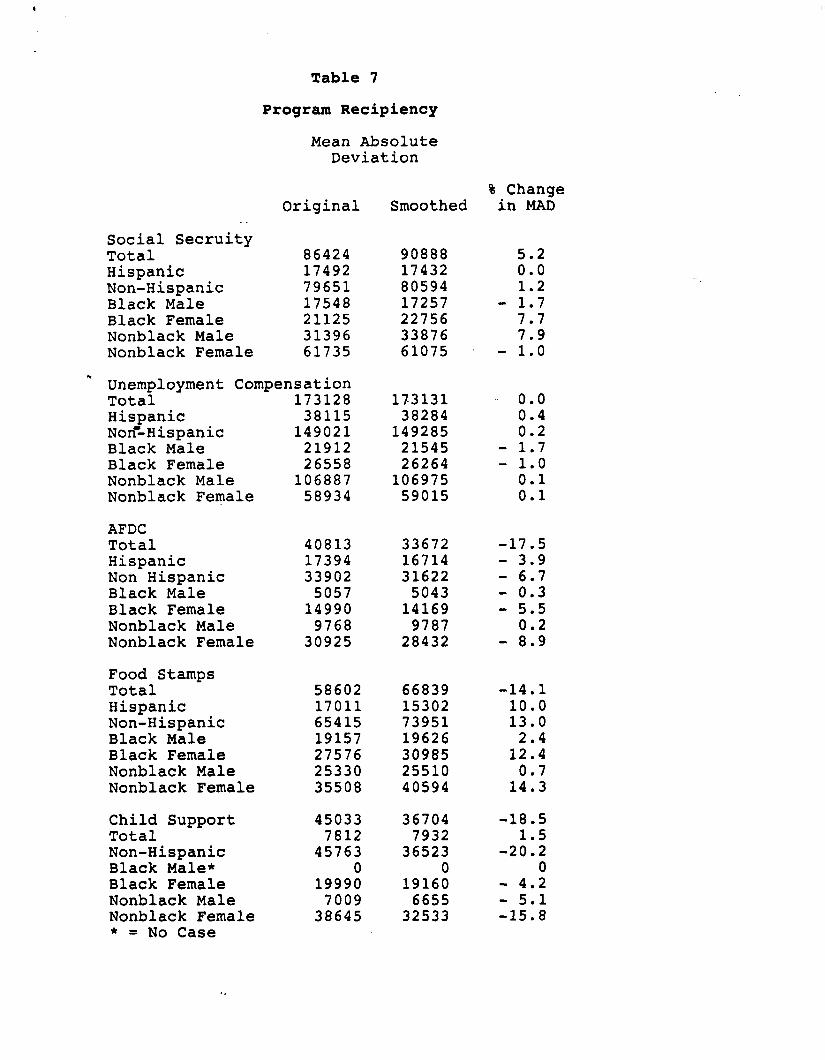
Table 7
Program Recipiency
Mean Absolute Deviation
Original . .
Social Secruity Total 86424 Hispanic 17492 Non-Hispanic 79651 Black Male 17548 Black Female 21125 Nonblack Male 31396 Nonblack Female 61735
* Unemployment Compensation 173128 Total
Hispanic Nori=Hispanic Black Male Black Female Nonblack Male Nonblack Fer(lale
38115 149021 21912 26558 106887 58934
AFDC Total Hispanic Non Hispanic Black Male Black Female Nonblack Male Nonblack Female
40813 33672 -17.5 17394 16714 - 3.9 33902 31622 - 6.7 5057 5043 - 0.3 14990 14169 - 5.5 9768 9787 0.2
30925 28432 - 8.9
Food Stamps Total Hispanic Non-Hispanic Black Male Black Female Nonblack Male Nonblack Female
58602 66839 -14.1 17011 15302 10.0 65415 73951 13.0 19157 19626 2.4 27576 30985 12.4 25330 25510 0.7 35508 40594 14.3
Child Support Total Non-Hispanic Black Male* Black Female Nonblack Male Nonblack Female * = No Case
45033 36704 -18.5 7812 7932 1.5
45763 36523 -20.2 0 0 0
19990 19160 - 4.2 7009 6655 - 5.1
38645 32533 -15.8
.-
Smoothed % Change in MAD
90888 5.2 17432 0.0 80594 1.2 17257 - 1.7 22756 7.7 33876 7.9 61075 - 1.0
173131 '. 0.0 38284 0.4
149285 0.2 21545 - 1.7 26264 - 1.0 106975 0.1 59015 0.1