BUREAU OF AGRICULTURAL STATISTICS Quezon City
15
Republic of the Philippines Department of Agriculture BUREAU OF AGRICULTURAL STATISTICS Quezon City ISSN-2012-0664 September 2012
Transcript of BUREAU OF AGRICULTURAL STATISTICS Quezon City
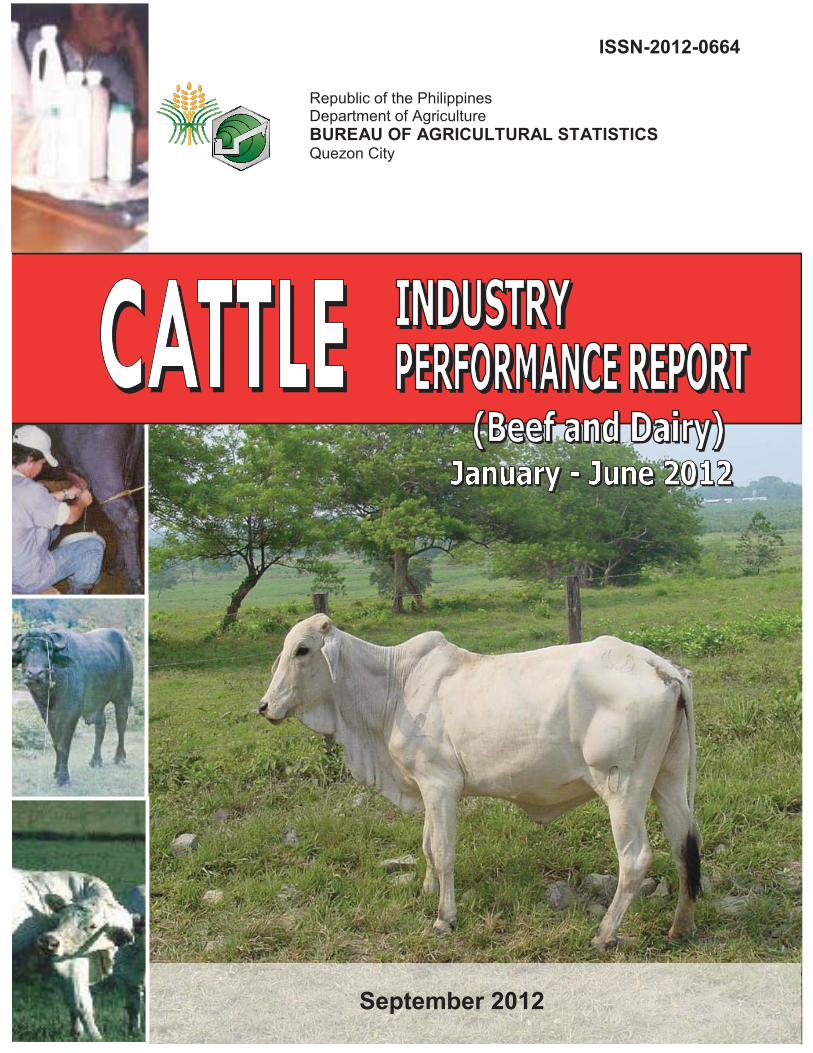
Republic of the Philippines Department of Agriculture BUREAU OF AGRICULTURAL STATISTICS Quezon City
ISSN-2012-0664
September 2012

i
CATTLE INDUSTRY PERFORMANCE REPORT i
CATTLE INDUSTRY PERFORMANCE REPORT
EXPLANATORY NOTES
This semi-annual Industry Performance Report on cattle presents the industry situation in terms of inventory by farm type and age classification; volume of production; supply and disposition; and monthly average prices at farmgate, wholesale and retail levels.
The Bureau of Agricultural Statistics (BAS) releases this report every 15th of September covering January to June data of the current year as reference period.
The Livestock and Poultry data system of the Bureau of Agricultural Statistics (BAS) is supported by two (2) major surveys namely:
1) The Backyard Livestock and Poultry Survey (BLPS) which covers one (1) of
the four (4) replicate samples of the Palay and Corn Production Survey (PCPS) consisting of 9,700 sample households in 673 sample barangays nationwide; and
2) The Commercial Livestock and Poultry Survey (CLPS) which covers around 882 independent farms as of January 2012 updated list. A cattle farm is considered commercial when it has a farm capacity of at least 21 head of adult cattle. Both surveys for cattle are simultaneously conducted January and July in all
provinces. Another survey that supports the statistical requirements of the livestock and
poultry sector is the Survey of Abattoirs and Dressing Plants (SADP). This is also known as Survey of Animals Slaughtered in Abattoirs and Dressing Plants. This covers around 1,120 accredited and non-accredited or Locally Registered Meat Establishments (LRME) abattoirs nationwide. This is undertaken in coordination with the National Meat Inspection Service (NMIS).

Explanatory Notes i Table of Contents ii Highlights iii Inventory By Farm Type and by Age Classification 1 Dairy Cattle by Age 2
Top Producing Regions 2 Production 3
Milk Production 4 Supply and Disposition 5 Prices 7
Figures 1. Cattle Inventory by Farm Type, Philippines, as of July 1, 2012 iii 2. Volume of Production, Philippines, January-June, 2011-2012 iii 3. Average Prices by Market Levels, Philippines and Metro Manila, January-June, 2011-2012 iii 4. Distribution of Cattle Inventory by Age Classification, Philippines, as of July 1, 2012 1 5. Cattle Inventory of Top Producing Regions, as of July 1, 20112 2 6. Monthly Average Farmgate Price, Philippines, January-June, 2010-2012 7 7. Monthly Average Wholesale Price, Metro Manila, January-June, 2010-2012 7 8. Monthly Average Retail Price of Beef Rump, Metro Manila, January-June, 2010-2012 7
Tables
1. Cattle Inventory by Farm Type and by Age Classification, Philippines 1 as of July 1, 2010-2012 2. Cattle Inventory of Top Producing Regions by Farm Type, as of July 1, 2012 2 3. Dairy Cattle: Inventory by Age, Philippines as July 1, 2010-2012 3 4. Volume of Production, by Quarter and by Semester, Philippines, January-June 2010- 2012 4 5. Animals on the Milkline and Milk Production by Source, Philippines, January-June, 2010-2012 5 6. Supply and Disposition, Philippines, January-June, 2010-2012 6 7. Monthly Average Farmgate and Market Prices, Philippines and Metro Manila January-June, 2010-2012 8 8. Cattle Inventory in Backyard and Commercial Farms, by Semester and by Region Philippines, as of January 1 and July 1 2010-2012 9 9. Catttle: Total Production, by Quarter, by Semester and by Region, Philippines January-June, 2010-2012 10
ii
CATTLE INDUSTRY PERFORMANCE REPORT
TABLE OF CONTENTS
iii
CATTLE INDUSTRY PERFORMANCE REPORT
0
35
70
105
140
175
210
245
280
Farmgate* Wholesale** Retail**
84.43
170.00
254.58
83.65
170.00
258.24
Pes
o/K
ilo
gra
m
Market Level
Figure 3. Average Prices by Market Levels, Philippines, and Metro Manila, January-June, 2011-2012
2011 2012
Note: (*)Philippines (**) Metro Manila
0
20
40
60
80
100
120
140
2011 2012
123.34 122.84
In '0
00 M
.T.
Figure 2. Volume of Production, Philippines, January - June, 2011-2012
-
0.50
1.00
1.50
2.00
2.50
2011 2012
2.50 2.49 2.32 2.32
0 .17 0.17
In m
illio
n he
ad
Year
Figure 1. Cattle Inventory by Farm Type, Philippines as of July 1, 2012
Total Backyard Commercial
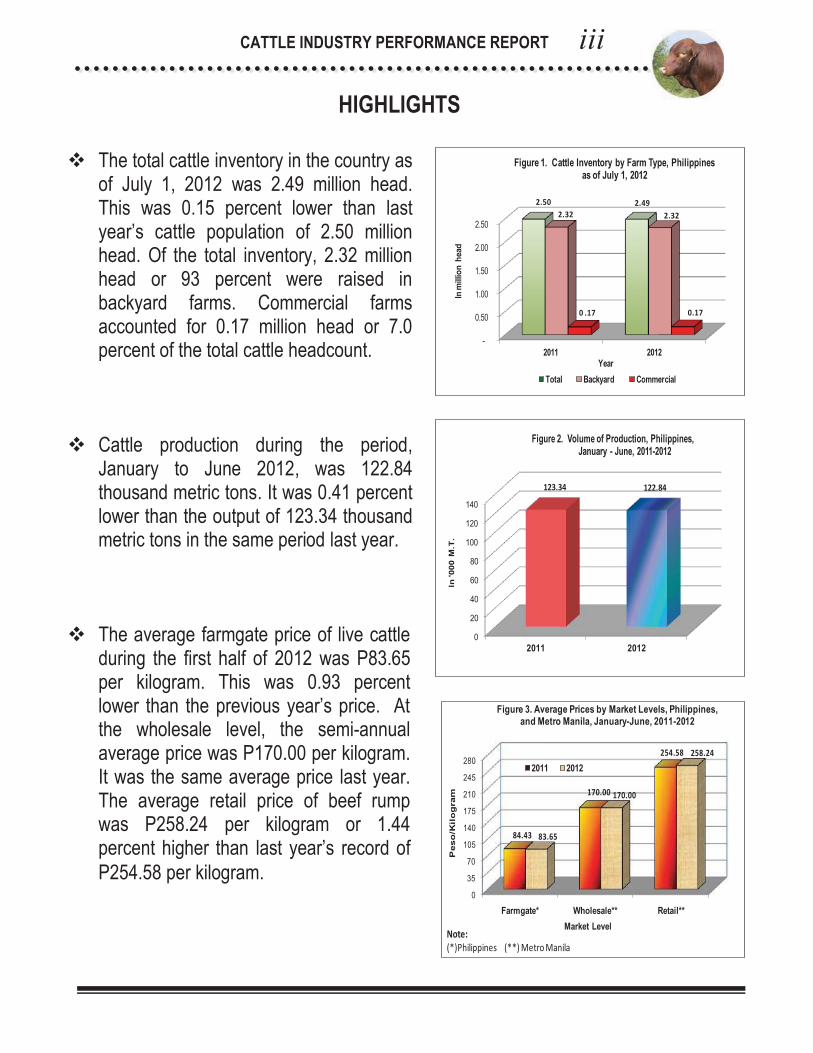
� The total cattle inventory in the country as
of July 1, 2012 was 2.49 million head. This was 0.15 percent lower than last year’s cattle population of 2.50 million head. Of the total inventory, 2.32 million head or 93 percent were raised in backyard farms. Commercial farms accounted for 0.17 million head or 7.0 percent of the total cattle headcount.
� Cattle production during the period, January to June 2012, was 122.84 thousand metric tons. It was 0.41 percent lower than the output of 123.34 thousand metric tons in the same period last year.
� The average farmgate price of live cattle during the first half of 2012 was P83.65 per kilogram. This was 0.93 percent lower than the previous year’s price. At the wholesale level, the semi-annual average price was P170.00 per kilogram. It was the same average price last year. The average retail price of beef rump was P258.24 per kilogram or 1.44 percent higher than last year’s record of P254.58 per kilogram.
HIGHLIGHTS
cow42.17%
heifer18.22%
yearling18.80%
bulls11.48%
others9.33%
Figure 4. Distribution of Inventory by Age Classification, Philippines, as of July 1, 2012
11/10 12/11
TOTAL 2,546,919 2,496,258 2,492,422 (1.99) (0.15) BACKYARD 2,370,903 2,325,567 2,318,191 (1.91) (0.32)
COMMERCIAL 176,016 170,691 174,231 (3.03) 2.07 COW 1,057,353 1,064,362 1,050,930 0.66 (1.26) Backyard 981,940 989,481 975,068 0.77 (1.46) Commercial 75,413 74,881 75,862 (0.71) 1.31 HEIFER 462,866 454,239 454,154 (1.86) (0.02) Backyard 428,819 420,258 419,475 (2.00) (0.19) Commercial 34,047 33,981 34,679 (0.19) 2.05 YEARLING1/ 478,237 468,922 468,538 (1.95) (0.08) Backyard 447,966 439,022 437,981 (2.00) (0.24) Commercial 30,271 29,900 30,557 (1.23) 2.20 BULLS 292,445 286,575 286,186 (2.01) (0.14) Backyard 278,759 273,194 272,435 (2.00) (0.28) Commercial 13,686 13,381 13,751 (2.23) 2.77 OTHERS 2/ 256,018 222,160 232,614 (13.22) 4.71 Backyard 233,419 203,612 213,232 (12.77) 4.72 Commercial 22,599 18,548 19,382 (17.93) 4.50 P-Preliminary 1/ Male and female 1 year old and below including calves2/ Include castrated male and ready to breed bull
Table 1. Cattle Inventory by Farm Type and by Age ClassificationPhilippines, July 1, 2010-2012
(Number of Head)
2010 2011 2012 PPercent Change
ITEM
1
CATTLE INDUSTRY PERFORMANCE REPORT
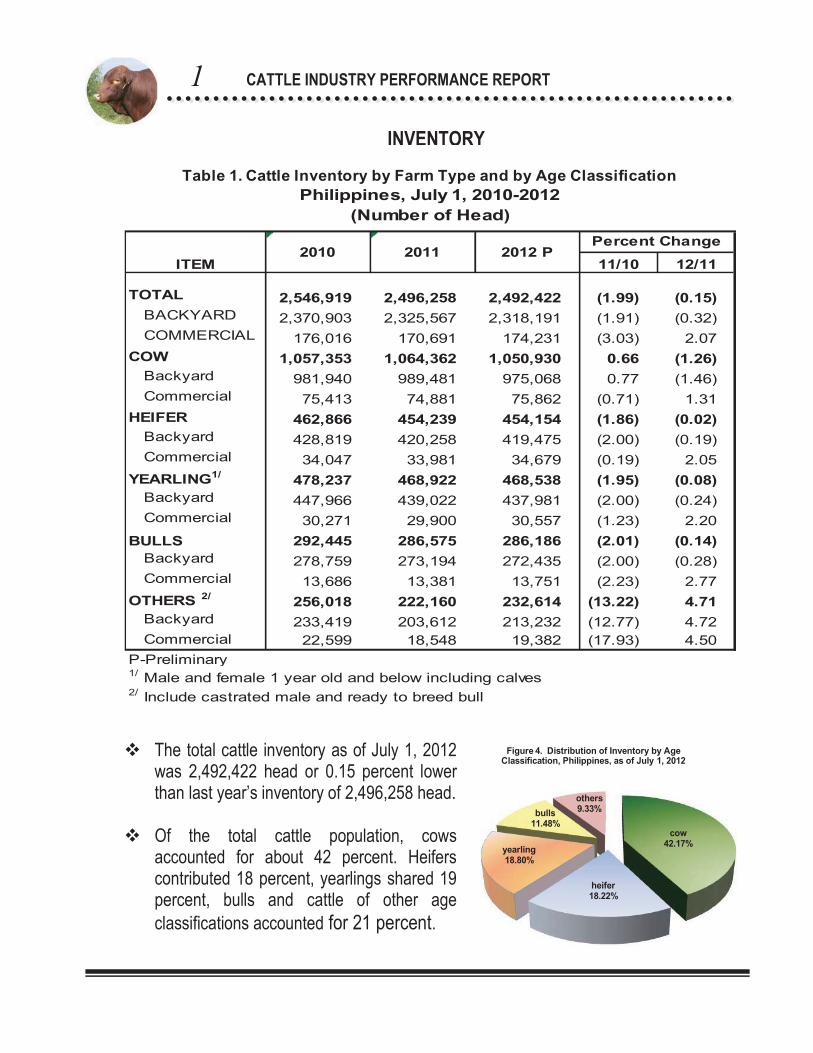
� The total cattle inventory as of July 1, 2012 was 2,492,422 head or 0.15 percent lower than last year’s inventory of 2,496,258 head.
� Of the total cattle population, cows
accounted for about 42 percent. Heifers contributed 18 percent, yearlings shared 19 percent, bulls and cattle of other age classifications accounted for 21 percent.
INVENTORY
Ilocos Region11.69%
Northern Mindanao
10.96%
Central Visayas10.92%
Western Visayas10.28%CALABARZON
10.15%
Others46.01%
Figure 5. Distribution of Inventory by Top Producing Regions, Philippines, as of July 1, 2012
2
CATTLE INDUSTRY PERFORMANCE REPORT
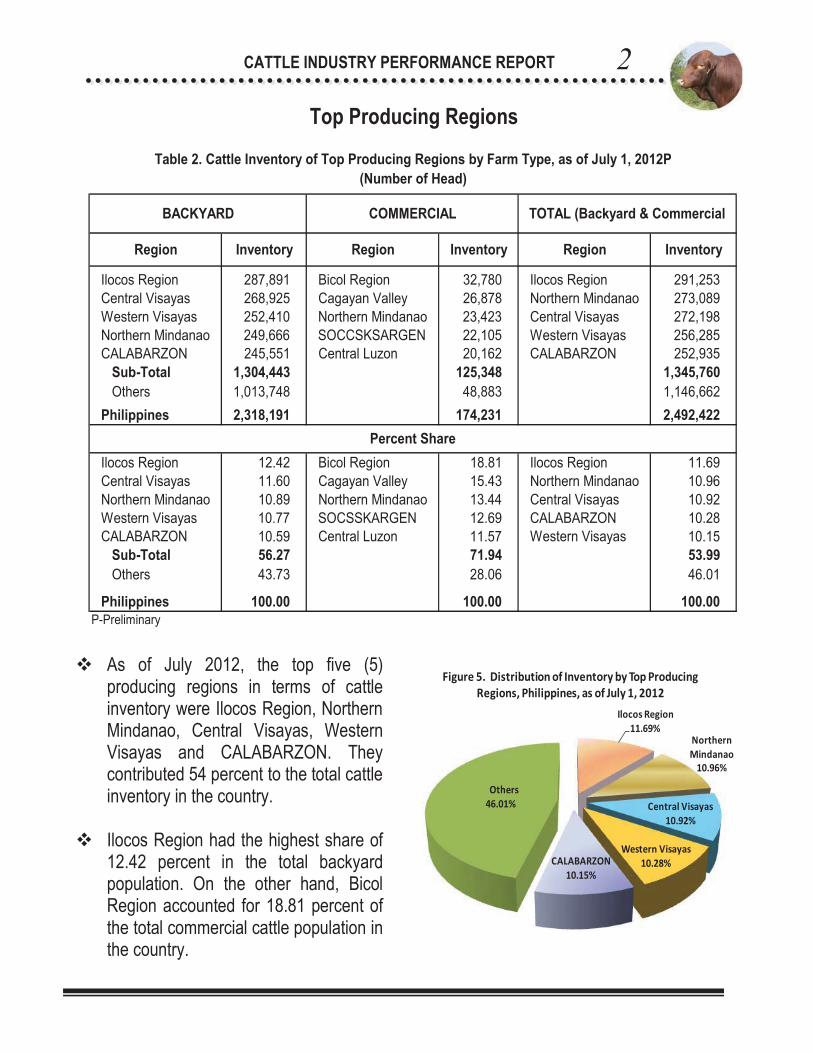
� As of July 2012, the top five (5) producing regions in terms of cattle inventory were Ilocos Region, Northern Mindanao, Central Visayas, Western Visayas and CALABARZON. They contributed 54 percent to the total cattle inventory in the country.
� Ilocos Region had the highest share of 12.42 percent in the total backyard population. On the other hand, Bicol Region accounted for 18.81 percent of the total commercial cattle population in the country.
Ilocos Region 287,891 Bicol Region 32,780 Ilocos Region 291,253Central Visayas 268,925 Cagayan Valley 26,878 Northern Mindanao 273,089Western Visayas 252,410 Northern Mindanao 23,423 Central Visayas 272,198Northern Mindanao 249,666 SOCCSKSARGEN 22,105 Western Visayas 256,285CALABARZON 245,551 Central Luzon 20,162 CALABARZON 252,935 Sub-Total 1,304,443 125,348 1,345,760 Others 1,013,748 48,883 1,146,662Philippines 2,318,191 174,231 2,492,422
Ilocos Region 12.42 Bicol Region 18.81 Ilocos Region 11.69Central Visayas 11.60 Cagayan Valley 15.43 Northern Mindanao 10.96Northern Mindanao 10.89 Northern Mindanao 13.44 Central Visayas 10.92Western Visayas 10.77 SOCSSKARGEN 12.69 CALABARZON 10.28CALABARZON 10.59 Central Luzon 11.57 Western Visayas 10.15 Sub-Total 56.27 71.94 53.99 Others 43.73 28.06 46.01
Philippines 100.00 100.00 100.00P-Preliminary
Percent Share
Table 2. Cattle Inventory of Top Producing Regions by Farm Type, as of July 1, 2012P(Number of Head)
BACKYARD COMMERCIAL TOTAL (Backyard & Commercial
Region Inventory Region Inventory Region Inventory
Top Producing Regions

11/10 12/11CATTLE 17,430 18,095 19,955 3.81 10.28 Bull 649 668 747 3.00 11.74 Dam 7,813 7,996 8,352 2.34 4.45 Heifer 2,282 2,389 2,812 4.68 17.71 Yearling 3,184 3,327 3,731 4.49 12.14 Calf 3,502 3,715 4,313 6.07 16.11 P-Preliminary
(Number of Head)
ANIMAL TYPE/AGE
2010 2011 Percent Change2012P
as of July 1, 2010 – 2012Table 3 : Dairy Cattle: Inventory by Age, Philippines
3
CATTLE INDUSTRY PERFORMANCE REPORT
INVENTORY OF DAIRY CATTLE
� The total inventory of dairy cattle as of July 1, 2012 was 19,955 head, or 10.28 percent higher compared to last year’s record of 18,095 head.
� Of the total dairy cattle inventory, 41.9 percent were dams, 21.6
percent were calves, and 18.7 percent were yearlings. The rest were heifers and bulls which accounted for 14.1 percent and 3.7 percent of the total dairy cattle inventory, respectively.
4
CATTLE INDUSTRY PERFORMANCE REPORT
11/10 12/11
Jan-Mar 57.91 57.75 58.96 (0.28) 2.09
Apr-Jun 64.93 65.59 63.88 1.01 (2.60)
Jan-Jun 122.84 123.34 122.84 0.40 (0.41)
P-Preliminary
Percent ChangeQuarter/ Semester 20112010 2012P
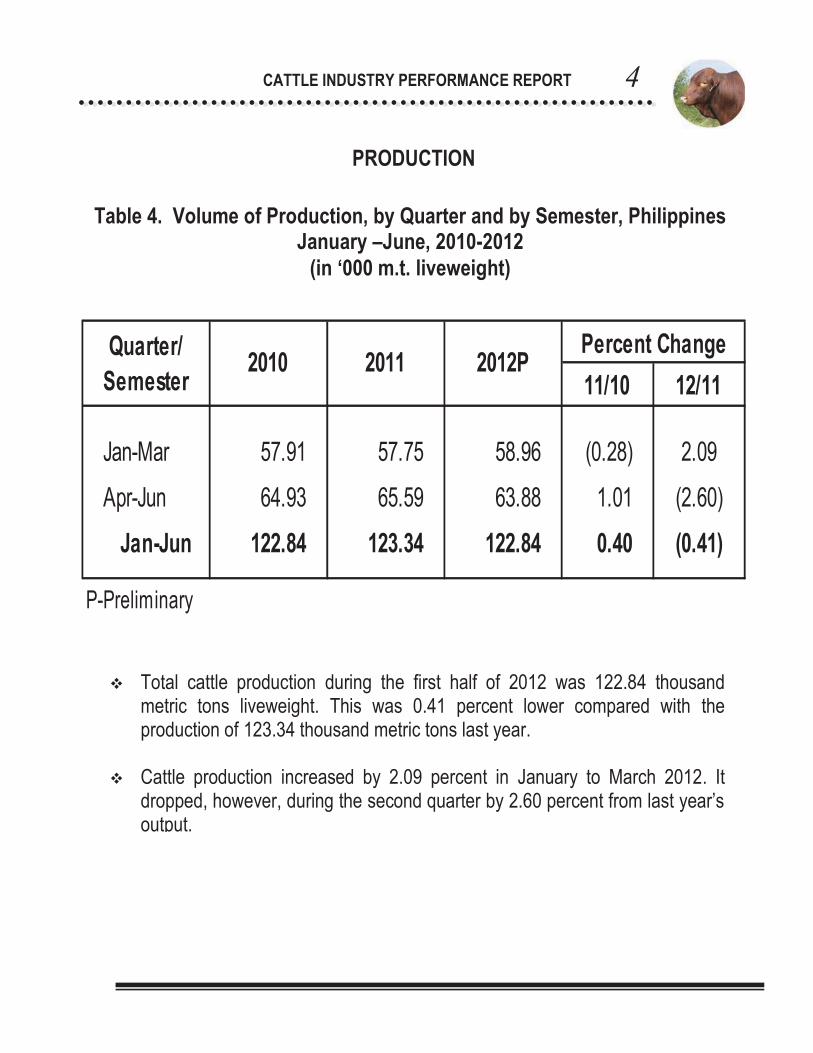
� Total cattle production during the first half of 2012 was 122.84 thousand metric tons liveweight. This was 0.41 percent lower compared with the production of 123.34 thousand metric tons last year.
� Cattle production increased by 2.09 percent in January to March 2012. It
dropped, however, during the second quarter by 2.60 percent from last year’s output.
PRODUCTION
Table 4. Volume of Production, by Quarter and by Semester, Philippines January –June, 2010-2012
(in ‘000 m.t. liveweight)
CATTLE 4,065 5,178.68 3,851 5,027.36 4,412 5,393.17 14.57 7.28 Individual 1,124 971.65 1,167 1,055.75 1,447 1,311.38 23.99 24.21 Cooperative 2,335 3,290.02 2,087 3,072.35 2,328 3,158.46 11.55 2.80 Commercial 331 626.97 314 603.28 339 623.83 7.96 3.41 Institutional 275 290.04 283 295.98 298 299.50 5.30 1.19 Source: National Dairy Authority (NDA)*LME- refers to Liquid Milk Equivalent (for cattle 1 liter of fresh milk= 0.98 liter LME)
Animals on the
milkline
Production (LME* in
'000 liters)
Animals on the
milkline
Production (LME* in
'000 liters)
ANIMAL TYPE/SOURCE
2010 2011 Percent Change
Table 5: Animals on the Milkline and Milk Production by SourcePhilippines, January - June 2010-2012
2012
Animals on the
milkline
Production (LME* in
'000 liters)
2012/2011Animals on the
milkline
Production (LME* in
'000 liters)
5 CATTLE INDUSTRY PERFORMANCE REPORT
MILK PRODUCTION
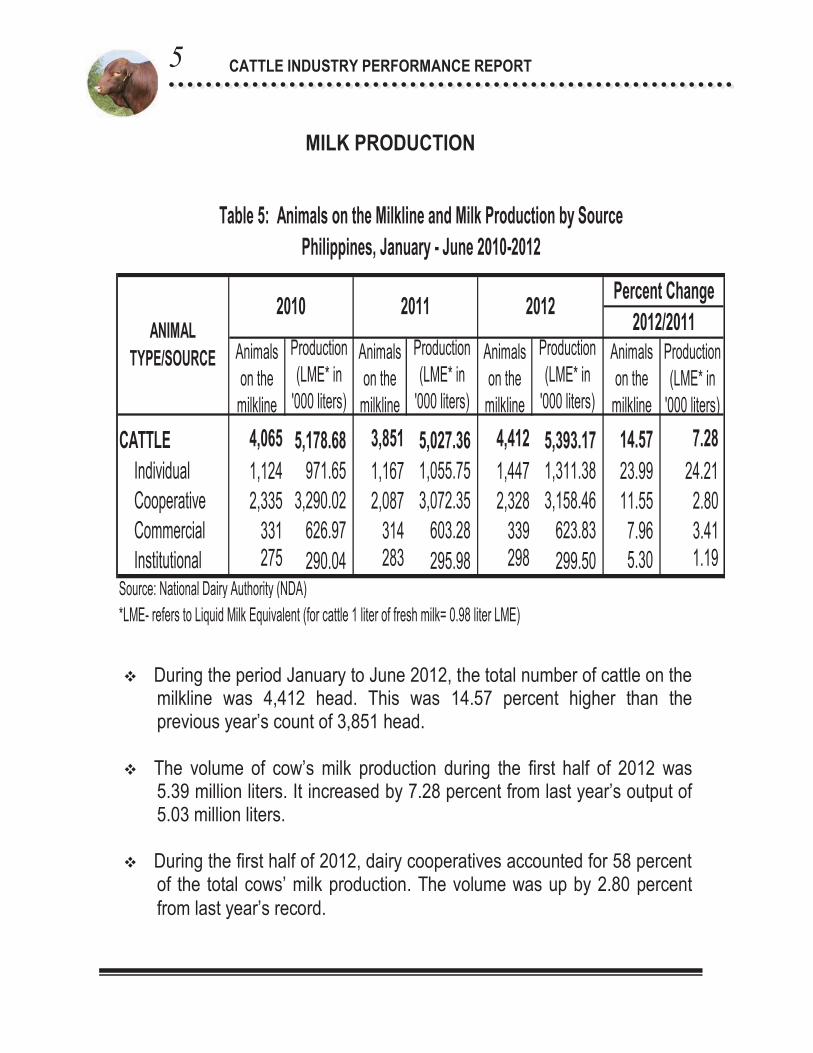
� During the period January to June 2012, the total number of cattle on the
milkline was 4,412 head. This was 14.57 percent higher than the previous year’s count of 3,851 head.
� The volume of cow’s milk production during the first half of 2012 was 5.39 million liters. It increased by 7.28 percent from last year’s output of 5.03 million liters.
� During the first half of 2012, dairy cooperatives accounted for 58 percent of the total cows’ milk production. The volume was up by 2.80 percent from last year’s record.
6
CATTLE INDUSTRY PERFORMANCE REPORT
11/10 12/11TOTAL SUPPLY 3,001,281 2,926,216 2,918,757 (2.50) (0.25) Beginning Inventory 1/ 2,570,879 2,518,407 2,493,157 (2.04) (1.00) Born Alive 430,402 407,809 425,600 (5.25) 4.36 Imports*
DISPOSITION 454,362 429,958 426,335 (5.37) (0.84) Slaughtered 420,876 412,180 410,664 (2.07) (0.37) Death/Losses 33,486 17,778 15,671 (46.91) (11.85)
ENDING INVENTORY 2/ 2,546,919 2,496,258 2,492,422 (1.99) (0.15)P-Preliminary 1/ As of January 12/ As of July 1
Table 6. Supply and Disposition, Philippines, January - June 2010-2012(Number of live animals)
ITEM 2012P2011
* No record of importation of live cattle for the period
2010Percent Change
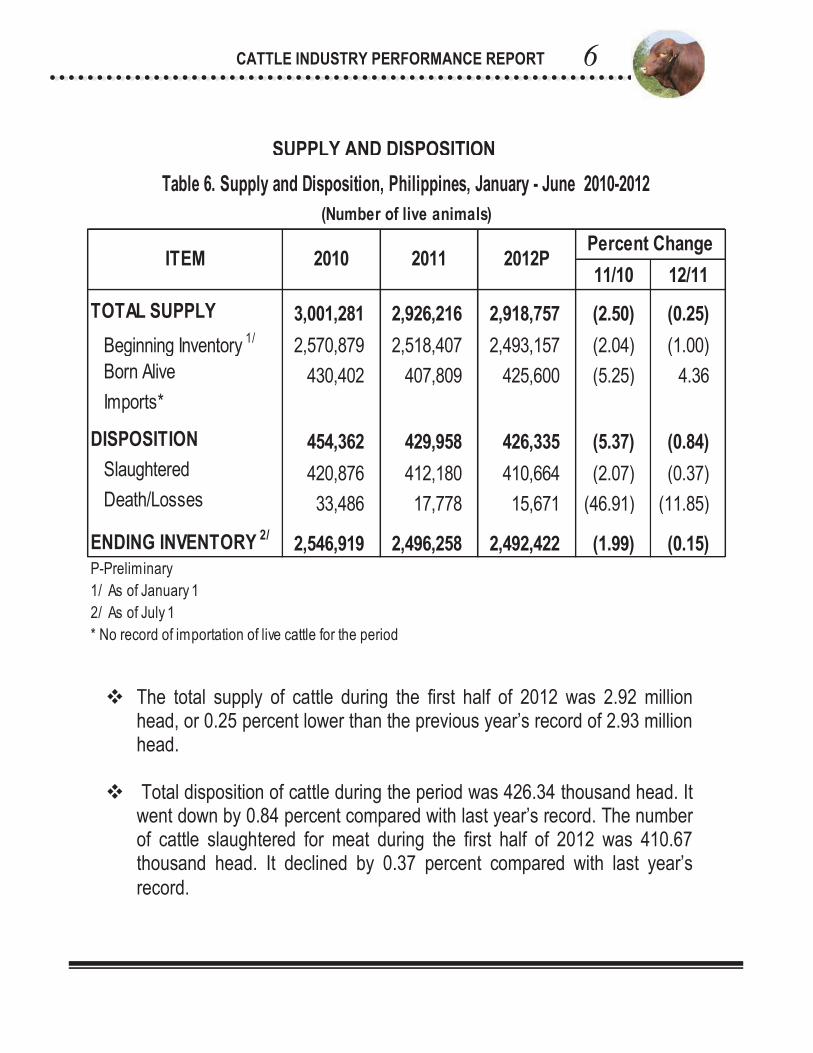
� The total supply of cattle during the first half of 2012 was 2.92 million head, or 0.25 percent lower than the previous year’s record of 2.93 million head.
� Total disposition of cattle during the period was 426.34 thousand head. It went down by 0.84 percent compared with last year’s record. The number of cattle slaughtered for meat during the first half of 2012 was 410.67 thousand head. It declined by 0.37 percent compared with last year’s record.
SUPPLY AND DISPOSITION
70.00
74.00
78.00
82.00
86.00
90.00
Jan Feb Mar Apr May Jun
Peso
/ k
ilo
gra
m
Month
Figure 5. Monthly Average Farmgate Price, Philippines, January -June, 2010-2012
2010 2011 2012
150.00
155.00
160.00
165.00
170.00
175.00
Jan Feb Mar Apr May Jun
Peso
/kil
og
ram
Month
Figure 6. Monthly Average Wholesale Price,Metro Manila, January-June, 2010-2012
2010 2011 2012
240.00
248.00
256.00
264.00
Jan Feb Mar Apr May Jun
Peso
/ k
ilo
gra
m
Month
Figure 7. Monthly Average Retail Price of Beef Rump, Metro Manila, January-June, 2010-2012
2010 2011 2012
7
CATTLE INDUSTRY PERFORMANCE REPORT
PRICES
Farmgate Price
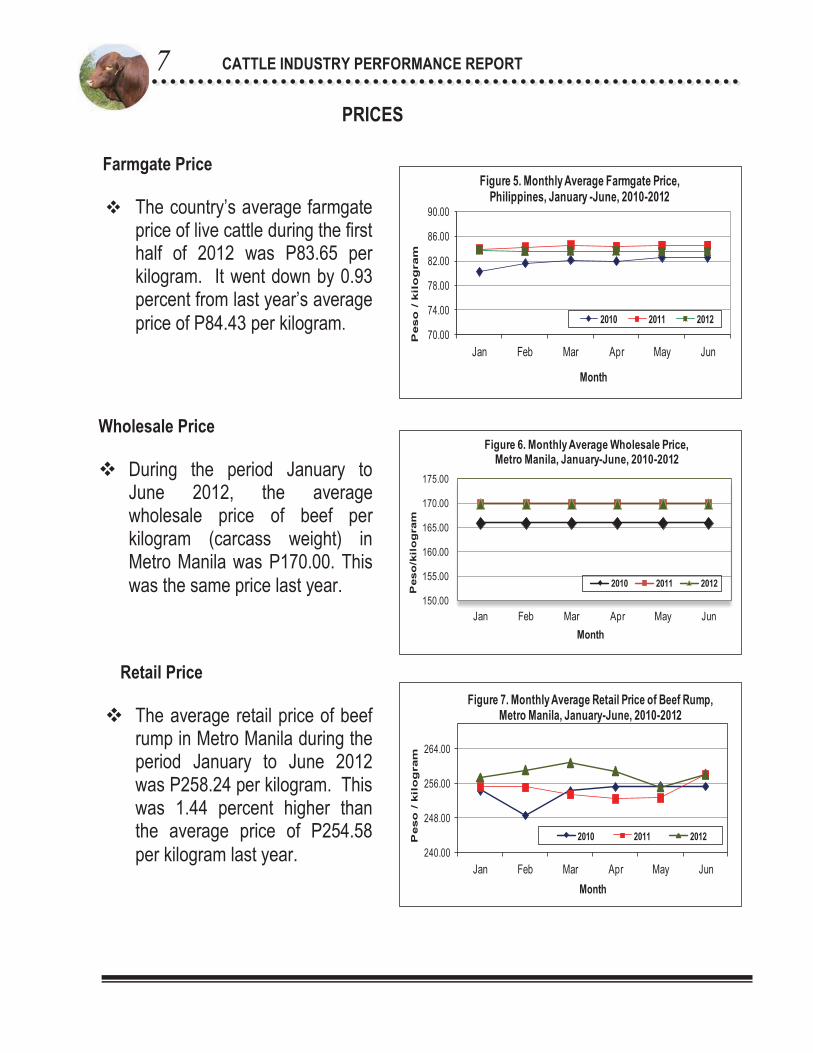
� The country’s average farmgate price of live cattle during the first half of 2012 was P83.65 per kilogram. It went down by 0.93 percent from last year’s average price of P84.43 per kilogram.
Wholesale Price � During the period January to
June 2012, the average wholesale price of beef per kilogram (carcass weight) in Metro Manila was P170.00. This was the same price last year.
Retail Price
� The average retail price of beef rump in Metro Manila during the period January to June 2012 was P258.24 per kilogram. This was 1.44 percent higher than the average price of P254.58 per kilogram last year.

8
CATTLE INDUSTRY PERFORMANCE REPORT
11/10 12/11January 80.35 84.01 83.81 4.56 (0.24)February 81.70 84.30 83.57 3.18 (0.87)March 82.23 84.64 83.60 2.93 (1.23)April 82.03 84.43 83.65 2.93 (0.92)May 82.63 84.62 83.54 2.41 (1.28)June 82.41 84.59 83.73 2.65 (1.02)
January-June 81.89 84.43 83.65 3.10 (0.93)
11/10 12/11January 166.00 170.00 170.00 2.41 0.00February 166.00 170.00 170.00 2.41 0.00March 166.00 170.00 170.00 2.41 0.00April 166.00 170.00 170.00 2.41 0.00May 166.00 170.00 170.00 2.41 0.00June 166.00 170.00 170.00 2.41 0.00
January-June 166.00 170.00 170.00 2.41 0.00
11/10 12/11January 254.40 255.34 257.37 0.37 0.80February 248.70 255.21 259.07 2.62 1.51March 254.33 253.57 260.75 (0.30) 2.83April 255.30 252.56 258.85 (1.07) 2.49May 255.47 252.73 255.24 (1.07) 0.99June 255.43 258.07 258.14 1.03 0.03
January-June 253.94 254.58 258.24 0.25 1.44P- Preliminary* Pesos per kilogram liveweightSource: BAS-AMSAD
Table 7. Monthly Average Farmgate and Market Prices, Philippines and Metro Manila, January - June 2010-2012
2012
Farmgate Price (P/KG) *Philippines
2011
MONTH
MONTH
2010
Percent Change
Wholesale Price (P/KG.) *
Percent Change
2010 R
MONTH
2009
Percent Change
2009
2011
Retail Price (Beef Rump, P/Kg.) *
Metro Manila
2011 P
2010
Metro Manila

Jan 1 July 1 Jan 1 July 1 Jan 1 July 1PTOTAL
PHILIPPINES 2,570,879 2,546,919 2,518,407 2,496,258 2,493,157 2,492,422 CAR 53,483 64,076 57,235 56,968 57,574 58,350 Ilocos Region 317,073 303,757 291,442 286,579 286,449 291,253 Cagayan Valley 197,541 191,211 191,660 186,699 182,196 180,010 Central Luzon 173,144 171,775 171,313 169,902 171,821 171,117 CALABARZON 255,253 251,365 250,927 251,678 251,744 252,935 MIMAROPA 87,144 91,996 90,267 94,331 91,265 95,410 Bicol Region 68,759 73,012 73,779 77,150 81,233 85,725 Western Visayas 225,383 240,490 243,334 250,844 253,458 256,285 Central Visayas 275,207 271,078 273,311 271,183 273,562 272,198 Eastern Visayas 15,349 14,641 14,671 14,596 20,843 21,368 Zamboanga Peninsula 155,994 142,996 140,079 131,967 129,675 120,285 Northern Mindanao 281,442 279,480 278,426 276,339 272,711 273,089 Davao Region 140,144 136,330 138,175 136,326 136,540 136,407 SOCCSKSARGEN 203,105 198,485 195,727 191,446 192,356 191,554 Caraga 18,097 19,113 18,828 18,833 19,034 20,203 ARMM 103,761 97,114 89,233 81,417 72,696 66,233
BACKYARDPHILIPPINES 2,403,296 2,370,903 2,343,975 2,325,567 2,321,655 2,318,191 CAR 45,778 52,275 49,932 49,495 49,056 50,340 Ilocos Region 313,269 299,430 287,559 282,947 282,977 287,891 Cagayan Valley 180,111 171,994 166,343 160,413 155,731 153,132 Central Luzon 153,260 152,111 151,571 150,491 152,336 150,955 CALABARZON 249,864 243,950 243,438 244,424 244,416 245,551 MIMAROPA 77,273 80,549 78,762 82,856 79,779 83,399 Bicol Region 42,110 42,360 42,285 45,365 48,900 52,945 Western Visayas 221,318 236,860 239,730 247,372 249,672 252,410 Central Visayas 273,439 268,492 270,470 268,161 270,175 268,925 Eastern Visayas 11,302 11,453 12,249 12,045 17,929 18,526 Zamboanga Peninsula 155,633 142,245 139,393 131,217 128,853 119,489 Northern Mindanao 252,360 255,575 252,650 252,910 249,745 249,666 Davao Region 134,601 130,455 132,858 131,065 131,558 131,315 SOCCSKSARGEN 172,832 169,321 170,664 169,036 171,085 169,449 Caraga 17,421 17,904 18,020 18,088 18,319 19,491 ARMM 102,725 95,929 88,051 79,682 71,124 64,707
COMMERCIALPHILIPPINES 167,583 176,016 174,432 170,691 171,502 174,231 CAR 7,705 11,801 7,303 7,473 8,518 8,010 Ilocos Region 3,804 4,327 3,883 3,632 3,472 3,362 Cagayan Valley 17,430 19,217 25,317 26,286 26,465 26,878 Central Luzon 19,884 19,664 19,742 19,411 19,485 20,162 CALABARZON 5,389 7,415 7,489 7,254 7,328 7,384 MIMAROPA 9,871 11,447 11,505 11,475 11,486 12,011 Bicol Region 26,649 30,652 31,494 31,785 32,333 32,780 Western Visayas 4,065 3,630 3,604 3,472 3,786 3,875 Central Visayas 1,768 2,586 2,841 3,022 3,387 3,273 Eastern Visayas 4,047 3,188 2,422 2,551 2,914 2,842 Zamboanga Peninsula 361 751 686 750 822 796 Northern Mindanao 29,082 23,905 25,776 23,429 22,966 23,423 Davao Region 5,543 5,875 5,317 5,261 4,982 5,092 SOCCSKSARGEN 30,273 29,164 25,063 22,410 21,271 22,105 Caraga 676 1,209 808 745 715 712 ARMM 1,036 1,185 1,182 1,735 1,572 1,526
2012
Table 8 : Cattle: Inventory in Backyard and Commercial Farms, by Semester and by Region, Philippines, 2010-2012
(Number of Head)
P - Preliminary
Region20112010
9
CATTLE INDUSTRY PERFORMANCE REPORT
10
CATTLE INDUSTRY PERFORMANCE REPORT
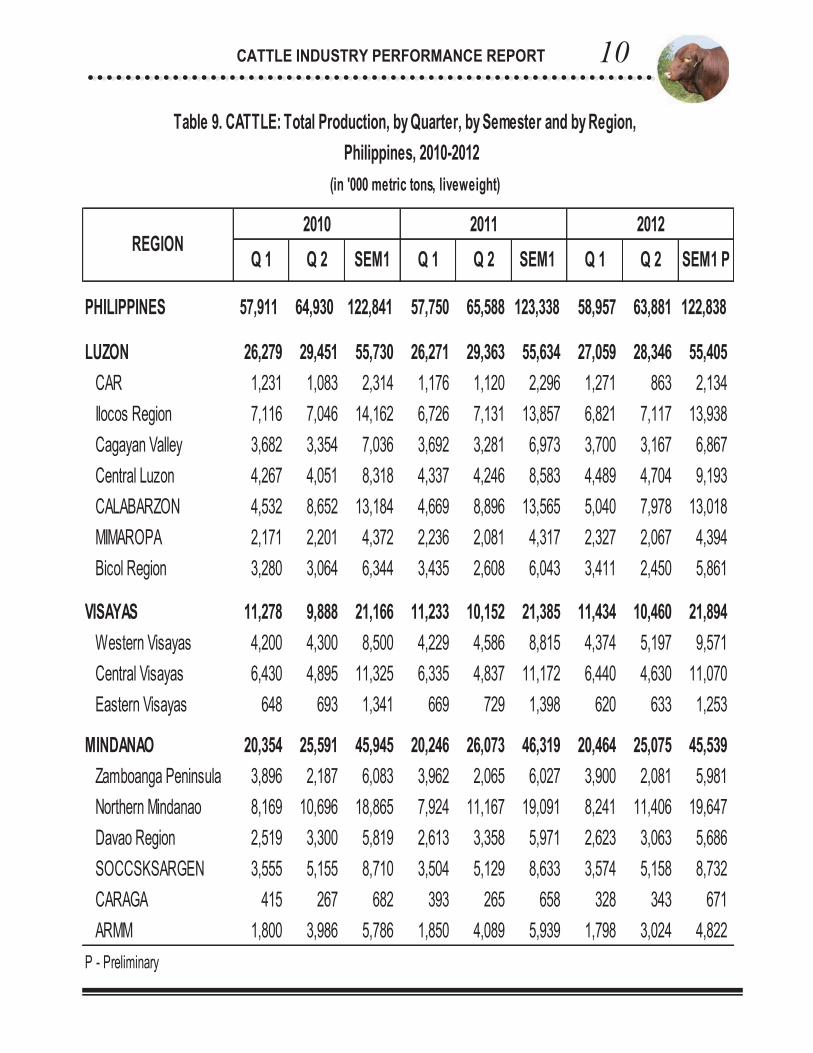
PHILIPPINES 57,911 64,930 122,841 57,750 65,588 123,338 58,957 63,881 122,838
LUZON 26,279 29,451 55,730 26,271 29,363 55,634 27,059 28,346 55,405CAR 1,231 1,083 2,314 1,176 1,120 2,296 1,271 863 2,134Ilocos Region 7,116 7,046 14,162 6,726 7,131 13,857 6,821 7,117 13,938Cagayan Valley 3,682 3,354 7,036 3,692 3,281 6,973 3,700 3,167 6,867Central Luzon 4,267 4,051 8,318 4,337 4,246 8,583 4,489 4,704 9,193CALABARZON 4,532 8,652 13,184 4,669 8,896 13,565 5,040 7,978 13,018MIMAROPA 2,171 2,201 4,372 2,236 2,081 4,317 2,327 2,067 4,394Bicol Region 3,280 3,064 6,344 3,435 2,608 6,043 3,411 2,450 5,861
VISAYAS 11,278 9,888 21,166 11,233 10,152 21,385 11,434 10,460 21,894Western Visayas 4,200 4,300 8,500 4,229 4,586 8,815 4,374 5,197 9,571Central Visayas 6,430 4,895 11,325 6,335 4,837 11,172 6,440 4,630 11,070Eastern Visayas 648 693 1,341 669 729 1,398 620 633 1,253
MINDANAO 20,354 25,591 45,945 20,246 26,073 46,319 20,464 25,075 45,539Zamboanga Peninsula 3,896 2,187 6,083 3,962 2,065 6,027 3,900 2,081 5,981Northern Mindanao 8,169 10,696 18,865 7,924 11,167 19,091 8,241 11,406 19,647Davao Region 2,519 3,300 5,819 2,613 3,358 5,971 2,623 3,063 5,686SOCCSKSARGEN 3,555 5,155 8,710 3,504 5,129 8,633 3,574 5,158 8,732CARAGA 415 267 682 393 265 658 328 343 671ARMM 1,800 3,986 5,786 1,850 4,089 5,939 1,798 3,024 4,822
P - Preliminary
2012Q 1 Q 2 SEM1 P
Table 9. CATTLE: Total Production, by Quarter, by Semester and by Region, Philippines, 2010-2012
(in '000 metric tons, liveweight)
REGION2010 2011
SEM1 Q 1 Q 2Q 1 Q 2 SEM1

Department of Agriculture BUREAU OF AGRICULTURAL STATISTICS 1184 Ben-lor Bldg., Quezon Avenue, Quezon City
LIVESTOCK & POULTRY STATISTICS DIVISION 332-15-43
http://www.bas.gov.ph