Bumrungrad Hospital Public Company Limitedbh.listedcompany.com/misc/PRESN/20160518-bh... ·...
29
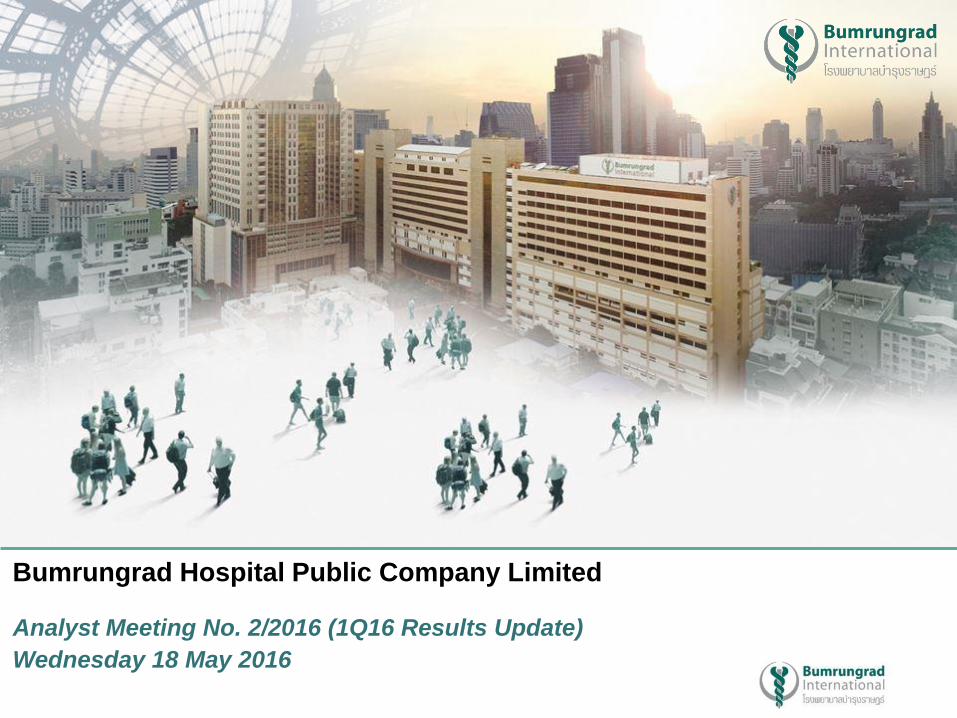
Bumrungrad Hospital Public Company Limited Analyst Meeting No. 2/2016 (1Q16 Results Update) Wednesday 18 May 2016
Transcript of Bumrungrad Hospital Public Company Limitedbh.listedcompany.com/misc/PRESN/20160518-bh... ·...
PG.1
Bumrungrad Hospital Public Company Limited
Analyst Meeting No. 2/2016 (1Q16 Results Update)
Wednesday 18 May 2016
PG.2
Disclaimer • The information contained in this presentation is for information purposes only and does not constitute an offer or invitation to sell or
the solicitation of an offer or invitation to purchase or subscribe for any securities of Bumrungrad Hospital Public Company Limited (the
"Company") in any jurisdiction nor should it or any part of it form the basis of, or be relied upon in connection with, any contract or
commitment whatsoever.
• This presentation is being communicated only to persons who have professional experience in matters relating to investments and/or
to persons to whom it is lawful to communicate it under the laws of applicable jurisdictions. Other persons should not rely or act upon
this presentation or any of its contents.
• Certain information and statements made in this presentation contain the Company's forward-looking statements. All forward-looking
statements are the Company's current expectation of future events and are subject to a number of factors that could cause actual
results to differ materially from those described in the forward-looking statements. Prospective investors should take care with respect
to such statements and should not place undue reliance on any such forward-looking statements.
• This presentation has been prepared by the Company solely for the use at this presentation. The information in this presentation has
not been independently verified. No representation, warranty, express or implied, is made as to, and no reliance should be placed on,
the fairness, accuracy, completeness or correctness of the information and opinions in this presentation. None of the Company, any of
its affiliates or any of their respective agents, advisors or representatives, shall have any liability (in negligence or otherwise) for any
loss or damage howsoever arising from any use of this presentation or its contents or otherwise arising in connection with this
presentation. The information presented or contained in this presentation is current as of the date hereof and is subject to change
without notice and its accuracy is not guaranteed. None of the Company, any of its affiliates or any of their respective agents, advisors
or representatives, makes any undertaking to update any such information subsequent to the date hereof.
• This presentation should not be construed as legal, tax, investment or other advice. No part of this presentation shall be relied upon
directly or indirectly for any investment decision-making or for any other purposes. Prospective investors should undertake their own
assessment with regard to any investment and should obtain independent advice on any such investment’s suitability, inherent risks
and merits and any tax, legal and accounting implications which it may have for them.
• Certain data in this presentation were obtained from various external data sources, and none of the Company, any of its affiliates or
any of their respective agents, advisors or representatives have verified such data with independent sources. Accordingly, the Company
makes no representation as to the accuracy or completeness of those data, and such data involve risks and uncertainties and are
subject to change based on various factors.

PG.3
Corporate CEO Retirement
Dennis Brown, Corporate CEO of Bumrungrad Hospital PCL. will be retired on July 31st, 2016.
PG.4
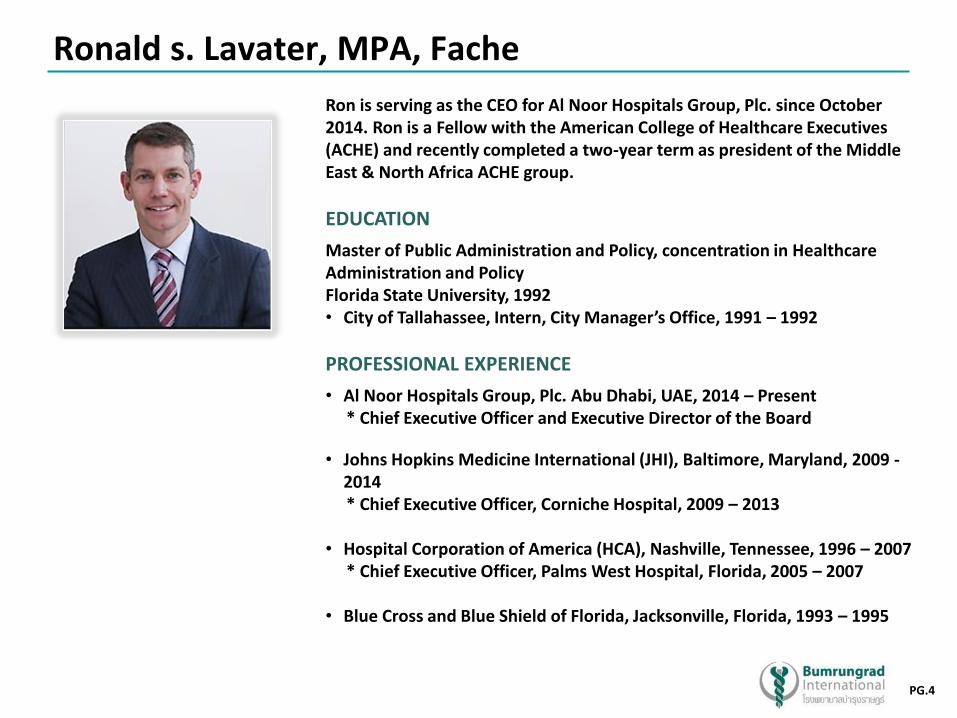
Ronald s. Lavater, MPA, Fache
Ron is serving as the CEO for Al Noor Hospitals Group, Plc. since October 2014. Ron is a Fellow with the American College of Healthcare Executives (ACHE) and recently completed a two-year term as president of the Middle East & North Africa ACHE group.
EDUCATION
Master of Public Administration and Policy, concentration in Healthcare Administration and Policy Florida State University, 1992 • City of Tallahassee, Intern, City Manager’s Office, 1991 – 1992
PROFESSIONAL EXPERIENCE
• Al Noor Hospitals Group, Plc. Abu Dhabi, UAE, 2014 – Present * Chief Executive Officer and Executive Director of the Board
• Johns Hopkins Medicine International (JHI), Baltimore, Maryland, 2009 - 2014
* Chief Executive Officer, Corniche Hospital, 2009 – 2013 • Hospital Corporation of America (HCA), Nashville, Tennessee, 1996 – 2007 * Chief Executive Officer, Palms West Hospital, Florida, 2005 – 2007 • Blue Cross and Blue Shield of Florida, Jacksonville, Florida, 1993 – 1995
PG.5
Overview
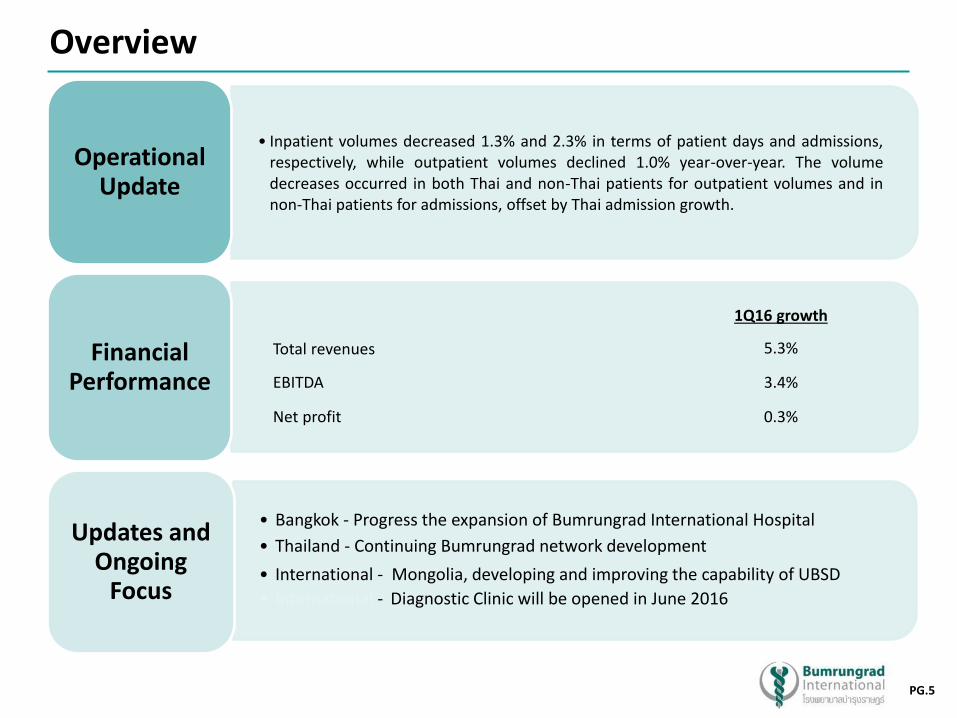
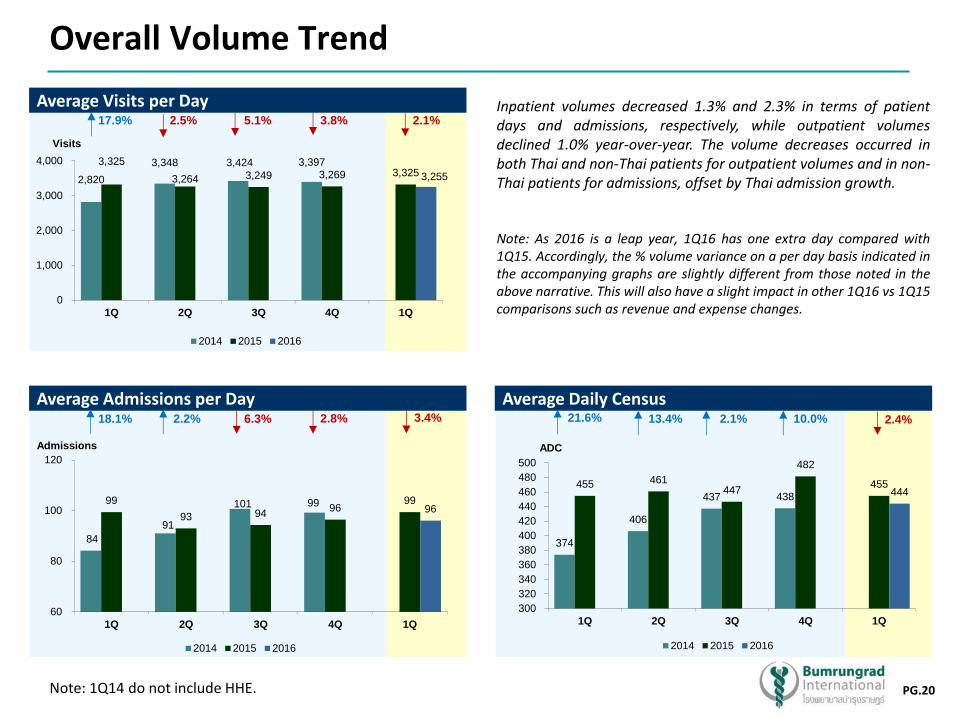
• Inpatient volumes decreased 1.3% and 2.3% in terms of patient days and admissions, respectively, while outpatient volumes declined 1.0% year-over-year. The volume decreases occurred in both Thai and non-Thai patients for outpatient volumes and in non-Thai patients for admissions, offset by Thai admission growth.
Operational Update
Financial Performance
• Bangkok - Progress the expansion of Bumrungrad International Hospital
• Thailand - Continuing Bumrungrad network development
• International - Mongolia, developing and improving the capability of UBSD
• International - Diagnostic Clinic will be opened in June 2016
Updates and Ongoing
Focus
1Q16 growth
Total revenues 5.3%
EBITDA 3.4%
Net profit 0.3%
PG.6
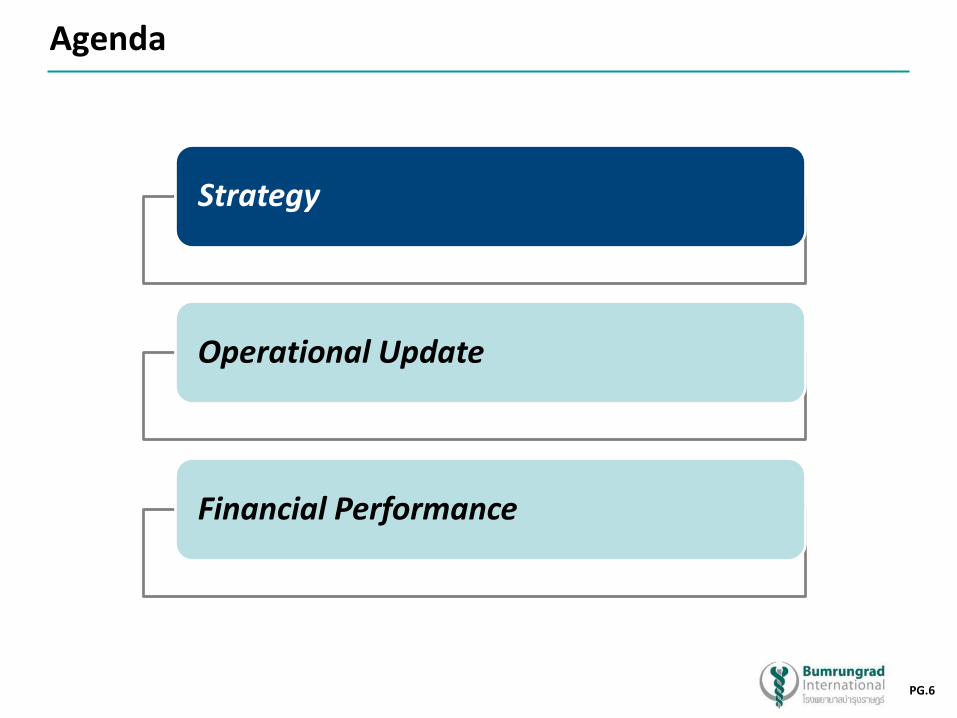
Agenda
Strategy
Operational Update
Financial Performance
PG.7
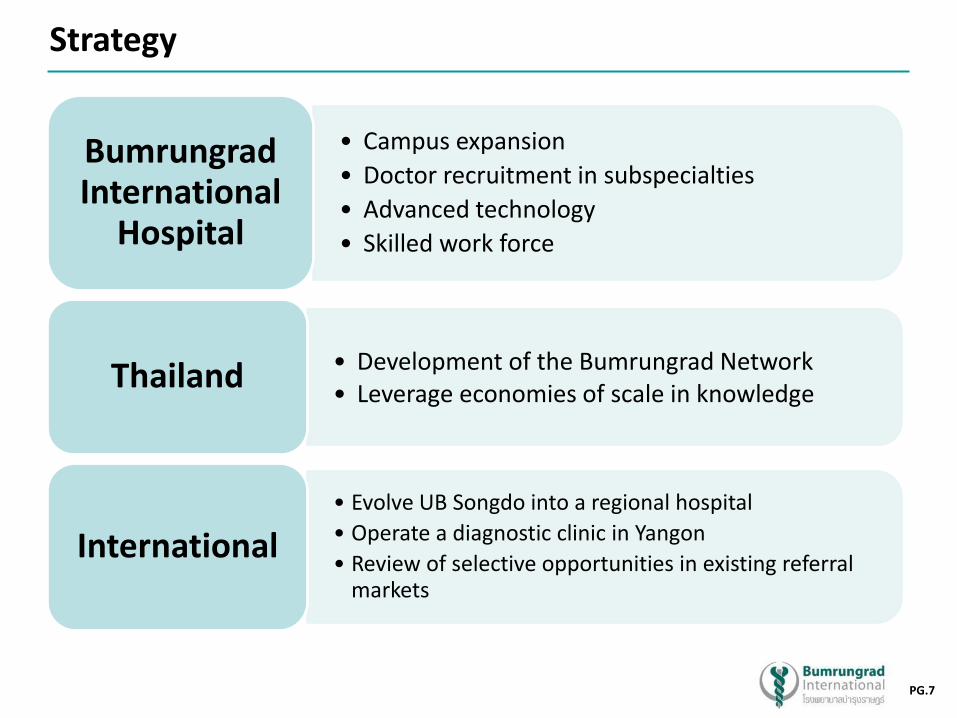
Strategy
• Campus expansion
• Doctor recruitment in subspecialties
• Advanced technology
• Skilled work force
Bumrungrad International
Hospital
• Development of the Bumrungrad Network • Leverage economies of scale in knowledge
Thailand
• Evolve UB Songdo into a regional hospital
• Operate a diagnostic clinic in Yangon
• Review of selective opportunities in existing referral markets
International
PG.8
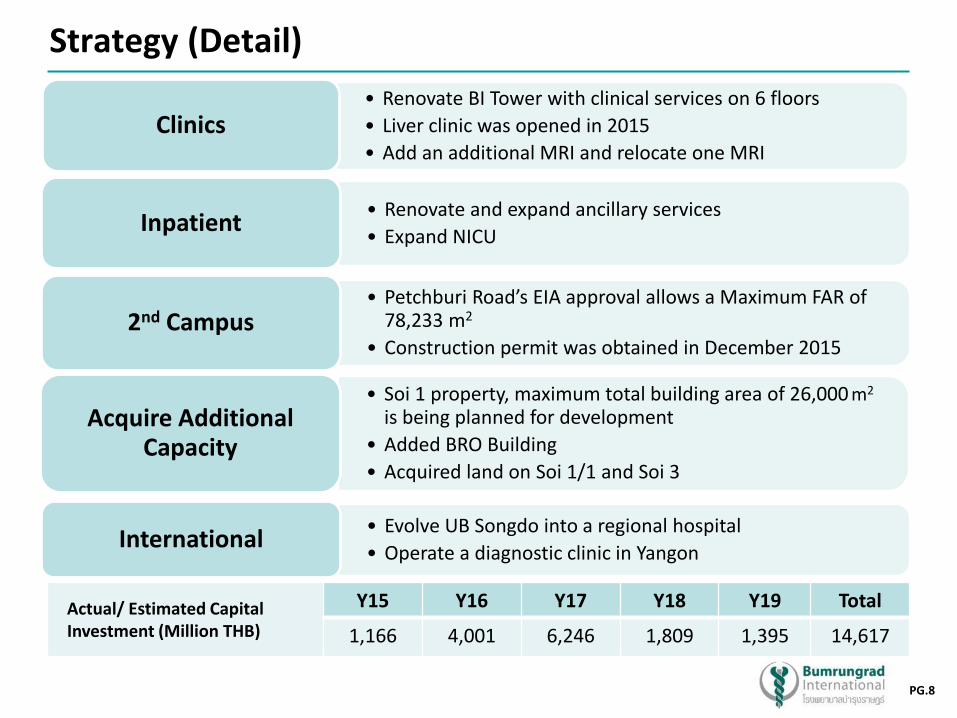
Strategy (Detail)
• Renovate BI Tower with clinical services on 6 floors
• Liver clinic was opened in 2015
• Add an additional MRI and relocate one MRI Clinics
• Renovate and expand ancillary services
• Expand NICU Inpatient
• Petchburi Road’s EIA approval allows a Maximum FAR of 78,233 m2
• Construction permit was obtained in December 2015 2nd Campus
• Soi 1 property, maximum total building area of 26,000 m2 is being planned for development
• Added BRO Building
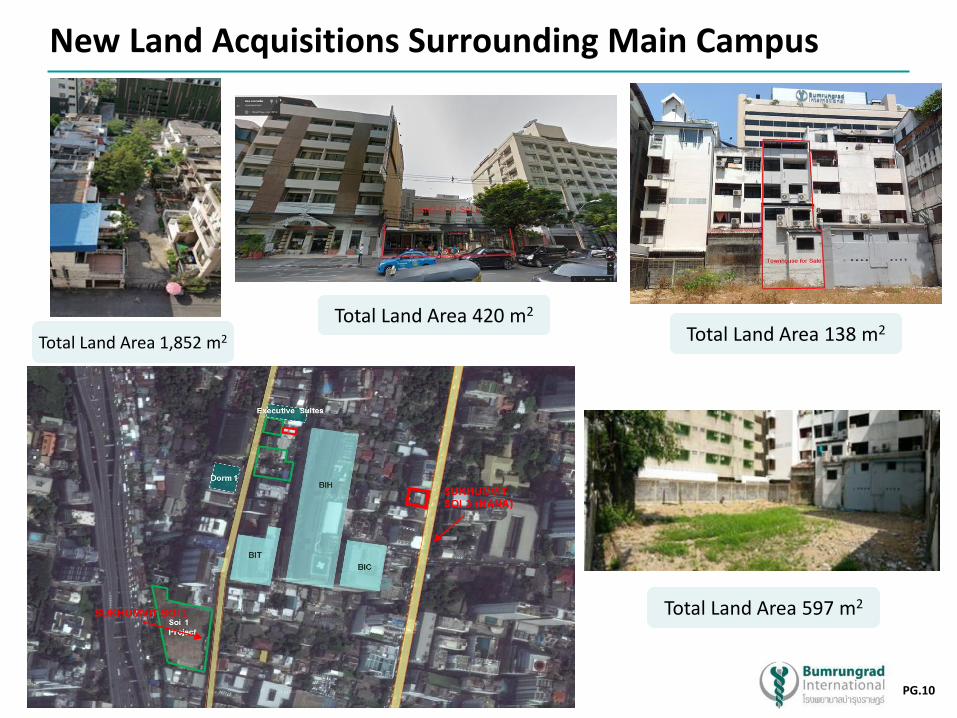
• Acquired land on Soi 1/1 and Soi 3
Acquire Additional Capacity
• Evolve UB Songdo into a regional hospital
• Operate a diagnostic clinic in Yangon International
Actual/ Estimated Capital Investment (Million THB)
Y15 Y16 Y17 Y18 Y19 Total
1,166 4,001 6,246 1,809 1,395 14,617
PG.9
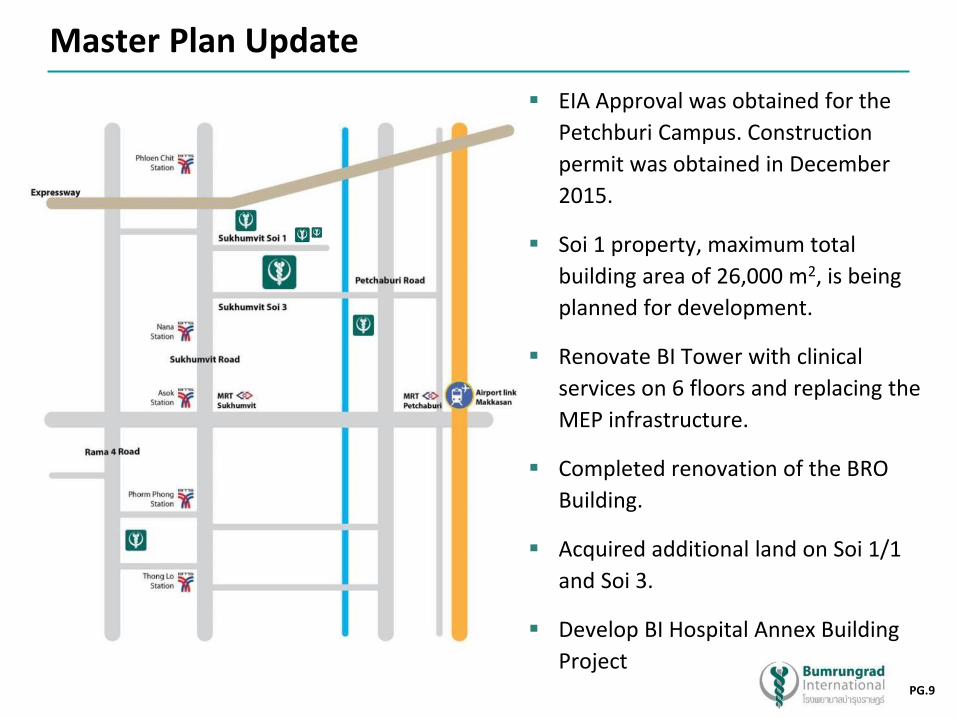
Master Plan Update
EIA Approval was obtained for the
Petchburi Campus. Construction
permit was obtained in December
2015.
Soi 1 property, maximum total
building area of 26,000 m2, is being
planned for development.
Renovate BI Tower with clinical
services on 6 floors and replacing the
MEP infrastructure.
Completed renovation of the BRO
Building.
Acquired additional land on Soi 1/1
and Soi 3.
Develop BI Hospital Annex Building
Project
PG.10
New Land Acquisitions Surrounding Main Campus
Total Land Area 1,852 m2
Total Land Area 597 m2
Total Land Area 420 m2
SUKHUMVIT SOI 1
Total Land Area 138 m2
PG.11
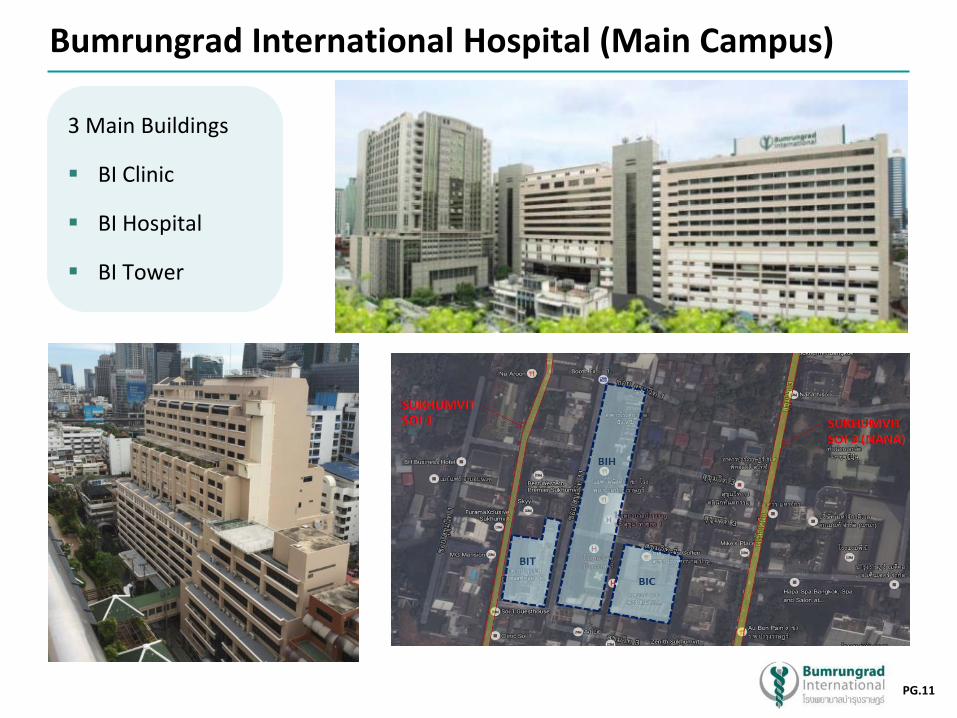
Bumrungrad International Hospital (Main Campus)
3 Main Buildings
BI Clinic
BI Hospital
BI Tower
PG.12
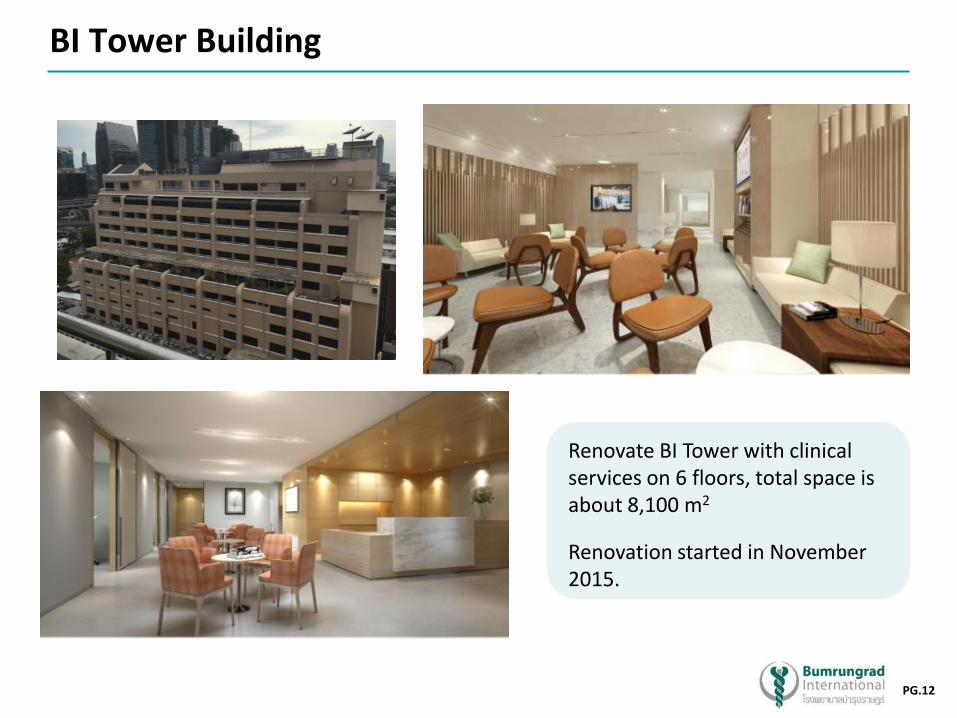
BI Tower Building
Renovate BI Tower with clinical services on 6 floors, total space is about 8,100 m2
Renovation started in November 2015.
PG.13
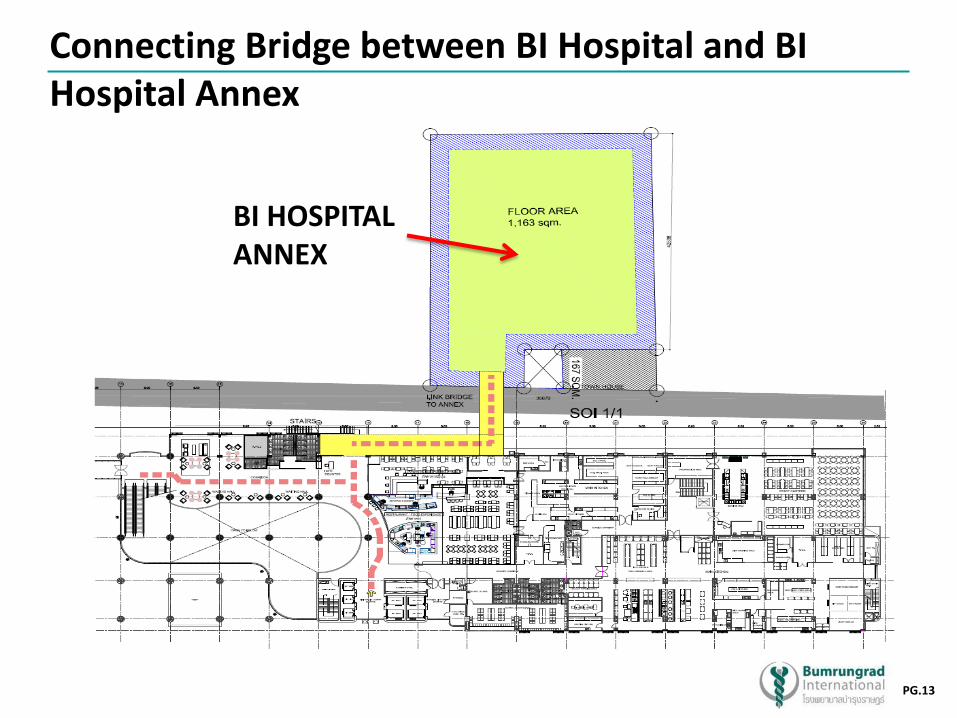
Connecting Bridge between BI Hospital and BI Hospital Annex
BI HOSPITAL ANNEX
PG.14
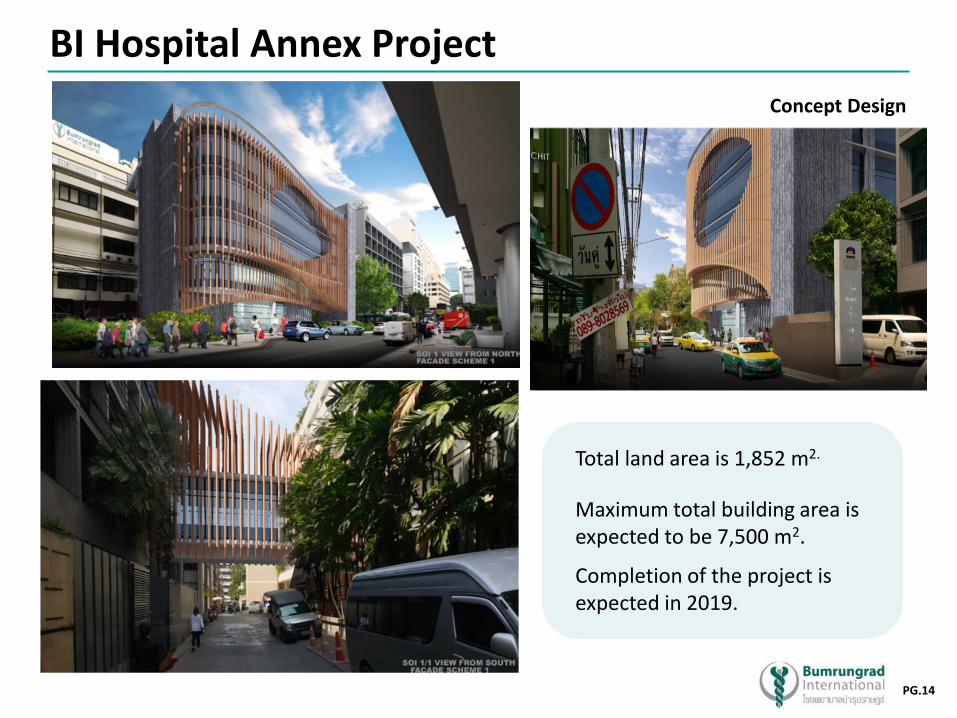
BI Hospital Annex Project
Concept Design
Total land area is 1,852 m2.
Maximum total building area is expected to be 7,500 m2.
Completion of the project is expected in 2019.
PG.15
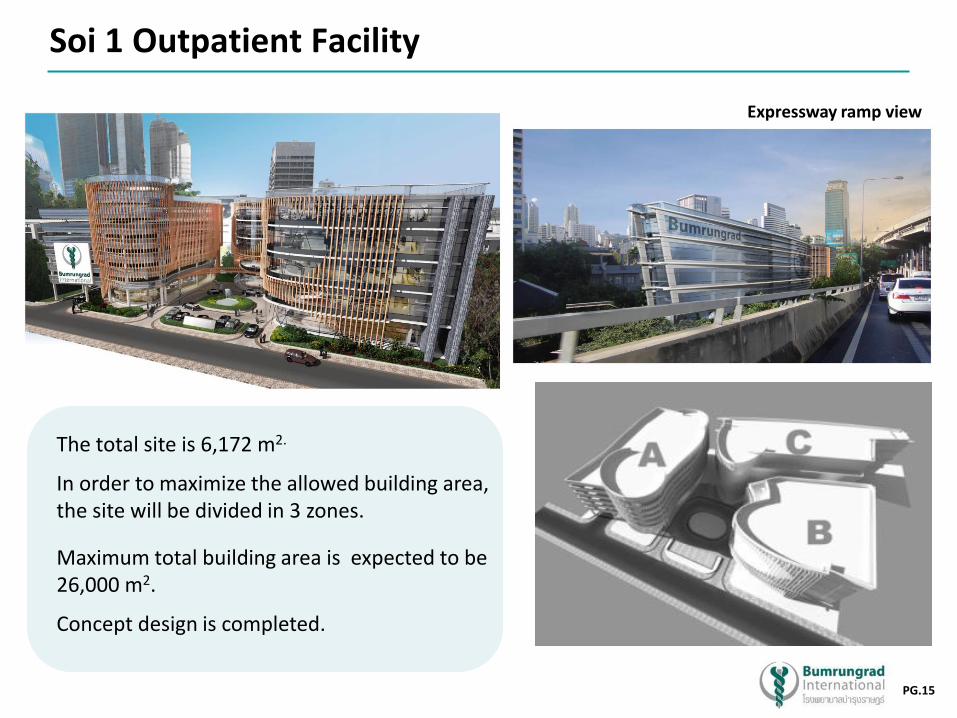
Soi 1 Outpatient Facility
Expressway ramp view
The total site is 6,172 m2.
In order to maximize the allowed building area, the site will be divided in 3 zones.
Maximum total building area is expected to be 26,000 m2.
Concept design is completed.
PG.16
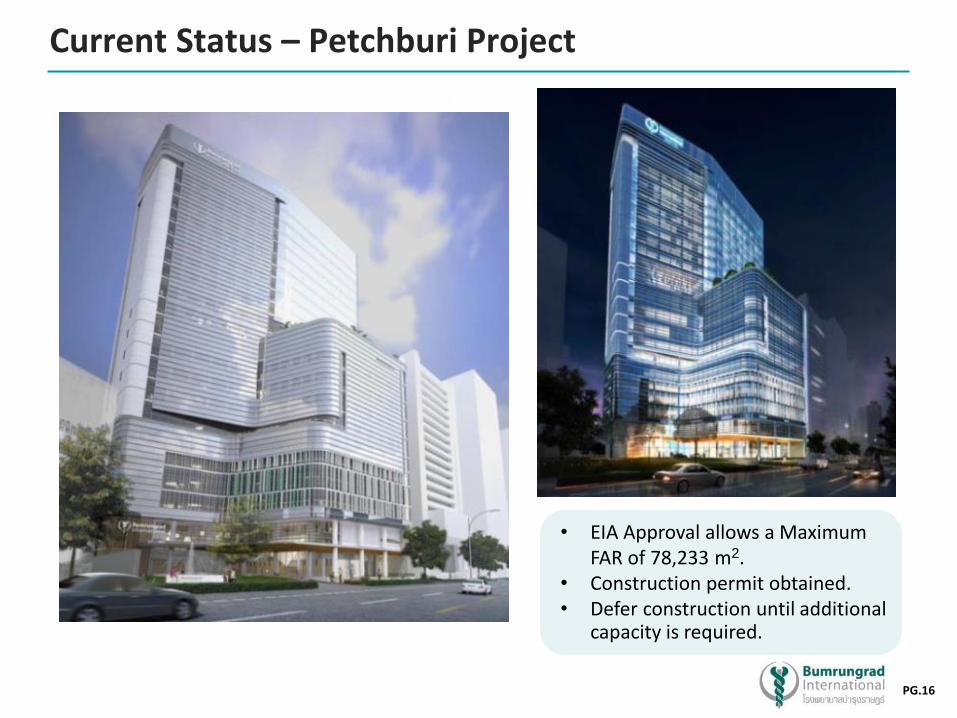
Current Status – Petchburi Project
• EIA Approval allows a Maximum FAR of 78,233 m2.
• Construction permit obtained. • Defer construction until additional
capacity is required.
PG.17
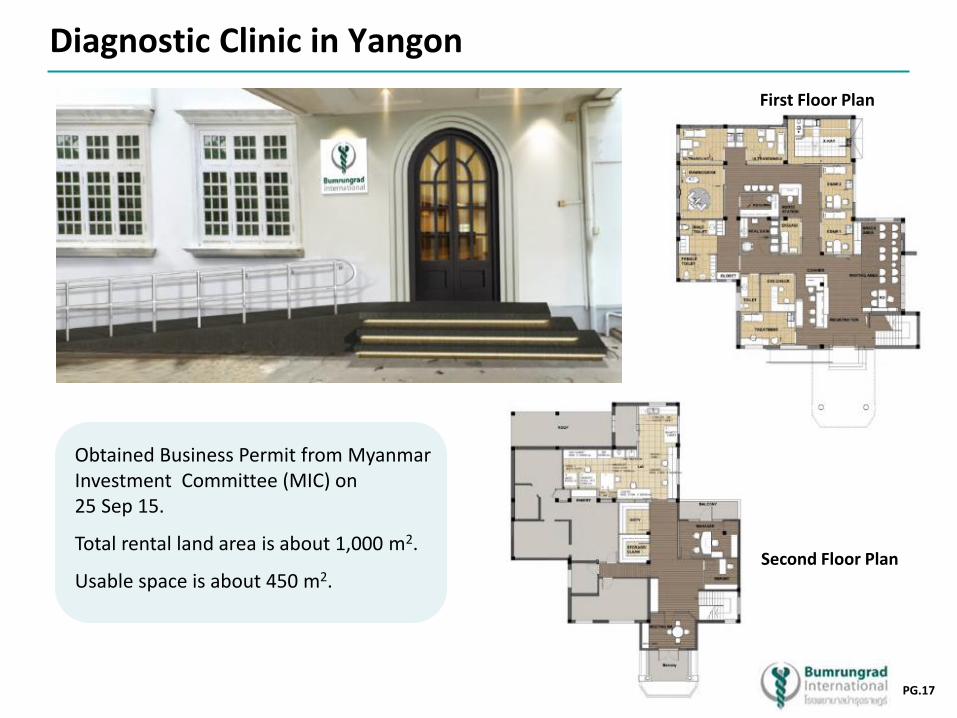
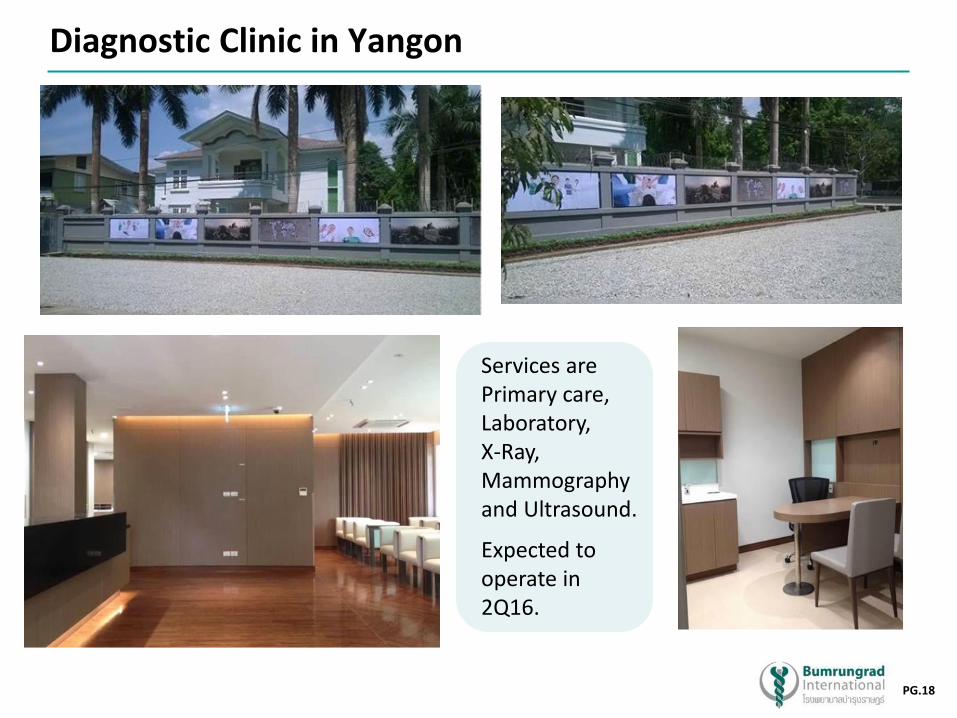
Diagnostic Clinic in Yangon
First Floor Plan
Obtained Business Permit from Myanmar Investment Committee (MIC) on 25 Sep 15.
Total rental land area is about 1,000 m2.
Usable space is about 450 m2. Second Floor Plan
PG.18
Diagnostic Clinic in Yangon
Services are Primary care, Laboratory, X-Ray, Mammography and Ultrasound.
Expected to operate in 2Q16.
PG.19
Strategy
Operational Update
Financial Performance
Agenda
PG.20
17.9%
2,820
3,348 3,424 3,397 3,325
3,264 3,249 3,269 3,325 3,255
0
1,000
2,000
3,000
4,000
1Q 2Q 3Q 4Q 1Q
2014 2015 2016
Overall Volume Trend
Visits
Average Visits per Day 2.5% 5.1% 3.8%
Note: 1Q14 do not include HHE.
Inpatient volumes decreased 1.3% and 2.3% in terms of patient days and admissions, respectively, while outpatient volumes declined 1.0% year-over-year. The volume decreases occurred in both Thai and non-Thai patients for outpatient volumes and in non-Thai patients for admissions, offset by Thai admission growth.
Note: As 2016 is a leap year, 1Q16 has one extra day compared with 1Q15. Accordingly, the % volume variance on a per day basis indicated in the accompanying graphs are slightly different from those noted in the above narrative. This will also have a slight impact in other 1Q16 vs 1Q15 comparisons such as revenue and expense changes.
84
91
101 99 99
93 94 96
99 96
60
80
100
120
1Q 2Q 3Q 4Q 1Q
2014 2015 2016
Admissions
Average Admissions per Day 18.1% 2.2% 6.3% 2.8%
ADC
Average Daily Census
374
406
437 438 455 461
447
482
455 444
300
320
340
360
380
400
420
440
460
480
500
1Q 2Q 3Q 4Q 1Q
2014 2015 2016
21.6%
2.1%
3.4% 13.4% 2.1% 10.0% 2.4%
PG.21
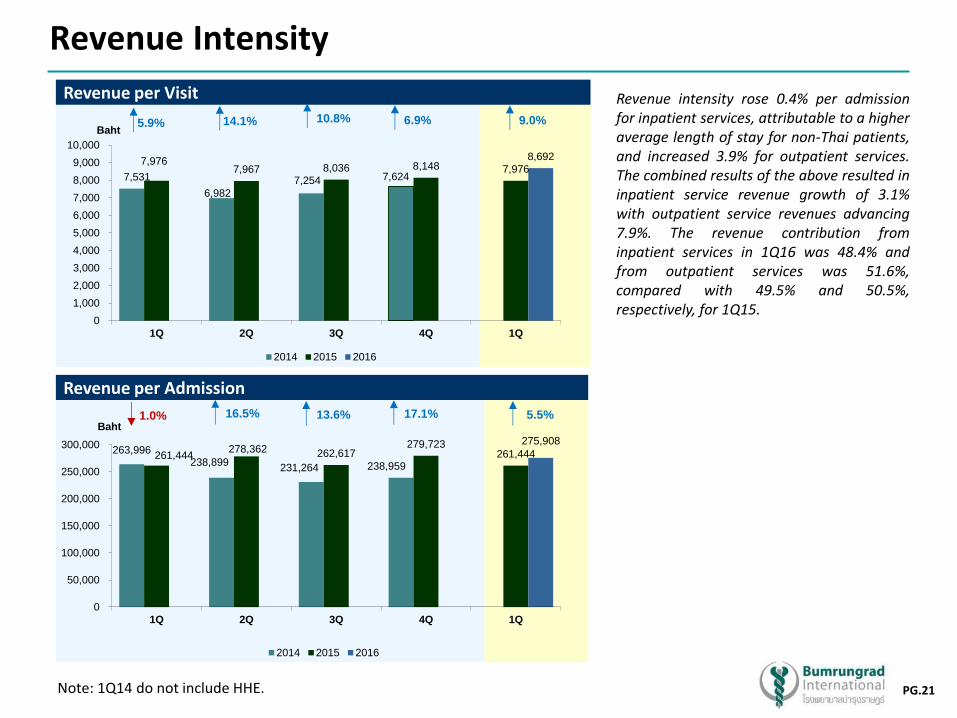
7,531
6,982
7,254 7,624
7,976 7,967 8,036 8,148 7,976
8,692
0
1,000
2,000
3,000
4,000
5,000
6,000
7,000
8,000
9,000
10,000
1Q 2Q 3Q 4Q 1Q
2014 2015 2016
Revenue Intensity
Baht
Revenue per Visit
14.1% 10.8% 6.9%
263,996 238,899
231,264 238,959 261,444
278,362 262,617 279,723
261,444
275,908
0
50,000
100,000
150,000
200,000
250,000
300,000
1Q 2Q 3Q 4Q 1Q
2014 2015 2016
Baht
Revenue per Admission
16.5% 13.6% 5.5% 1.0%
Note: 1Q14 do not include HHE.
5.9% 9.0%
17.1%
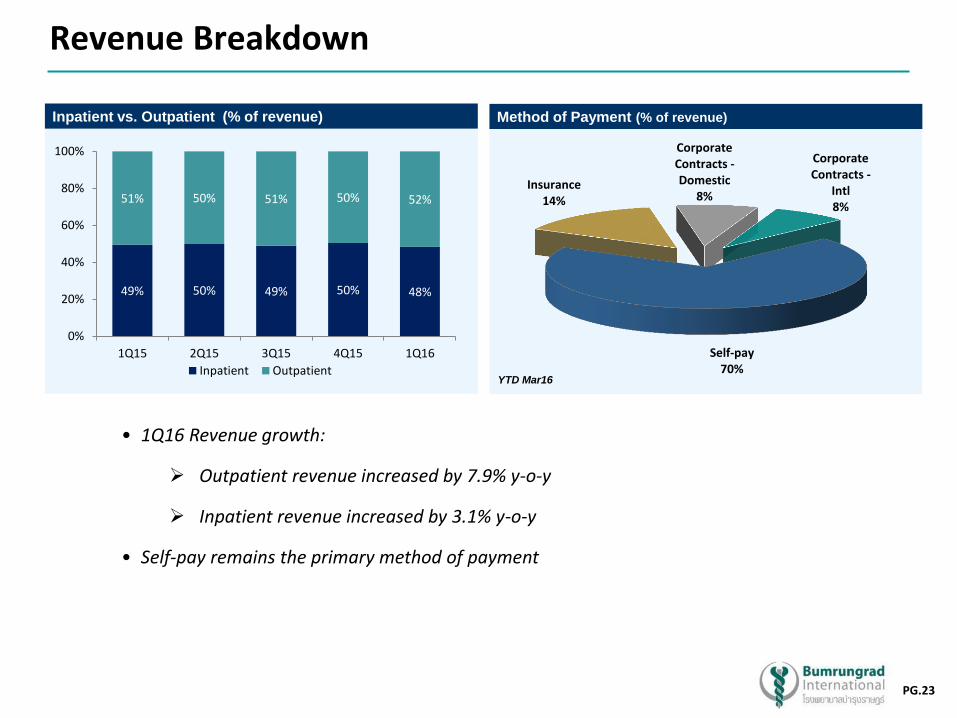
Revenue intensity rose 0.4% per admission for inpatient services, attributable to a higher average length of stay for non-Thai patients, and increased 3.9% for outpatient services. The combined results of the above resulted in inpatient service revenue growth of 3.1% with outpatient service revenues advancing 7.9%. The revenue contribution from inpatient services in 1Q16 was 48.4% and from outpatient services was 51.6%, compared with 49.5% and 50.5%, respectively, for 1Q15.
PG.22
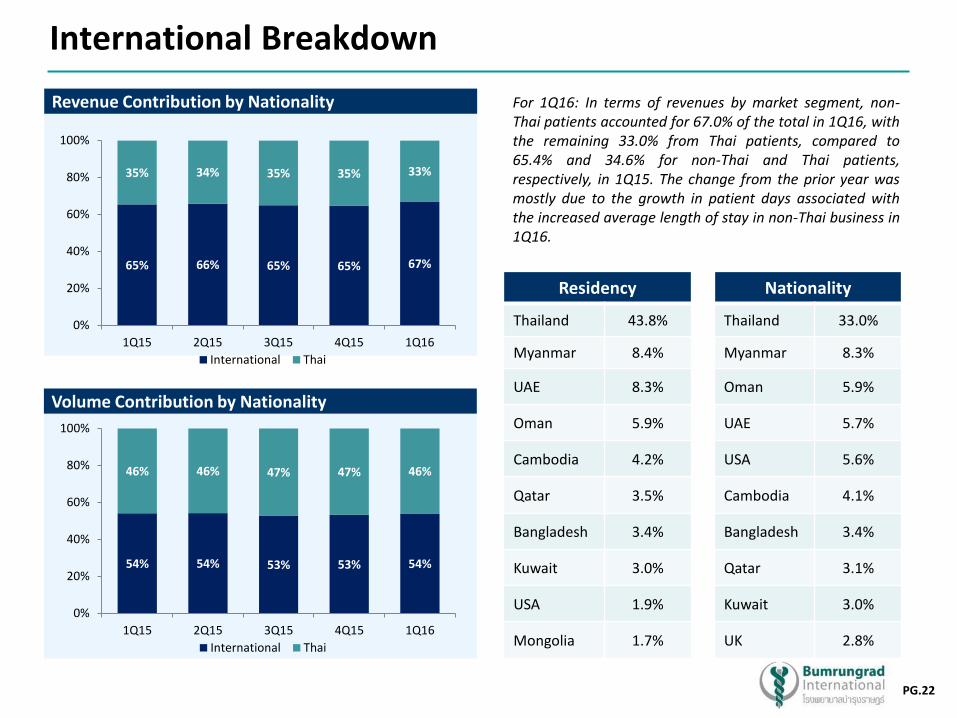
Volume Contribution by Nationality
Revenue Contribution by Nationality
International Breakdown
For 1Q16: In terms of revenues by market segment, non-Thai patients accounted for 67.0% of the total in 1Q16, with the remaining 33.0% from Thai patients, compared to 65.4% and 34.6% for non-Thai and Thai patients, respectively, in 1Q15. The change from the prior year was mostly due to the growth in patient days associated with the increased average length of stay in non-Thai business in 1Q16.
65% 66% 65% 65% 67%
35% 34% 35% 35% 33%
0%
20%
40%
60%
80%
100%
1Q15 2Q15 3Q15 4Q15 1Q16
International Thai
54% 54% 53% 53% 54%
46% 46% 47% 47% 46%
0%
20%
40%
60%
80%
100%
1Q15 2Q15 3Q15 4Q15 1Q16
International Thai
Nationality
Thailand 33.0%
Myanmar 8.3%
Oman 5.9%
UAE 5.7%
USA 5.6%
Cambodia 4.1%
Bangladesh 3.4%
Qatar 3.1%
Kuwait 3.0%
UK 2.8%
Residency
Thailand 43.8%
Myanmar 8.4%
UAE 8.3%
Oman 5.9%
Cambodia 4.2%
Qatar 3.5%
Bangladesh 3.4%
Kuwait 3.0%
USA 1.9%
Mongolia 1.7%
PG.23
Revenue Breakdown
Inpatient vs. Outpatient (% of revenue) Method of Payment (% of revenue)
YTD Mar16
• 1Q16 Revenue growth:
Outpatient revenue increased by 7.9% y-o-y
Inpatient revenue increased by 3.1% y-o-y
• Self-pay remains the primary method of payment
49% 50% 49% 50% 48%
51% 50% 51% 50% 52%
0%
20%
40%
60%
80%
100%
1Q15 2Q15 3Q15 4Q15 1Q16
Inpatient Outpatient
Corporate Contracts - Domestic
8%
Corporate Contracts -
Intl 8%
Self-pay 70%
Insurance 14%
PG.24
Agenda
Strategy
Operational Update
Financial Performance
PG.25
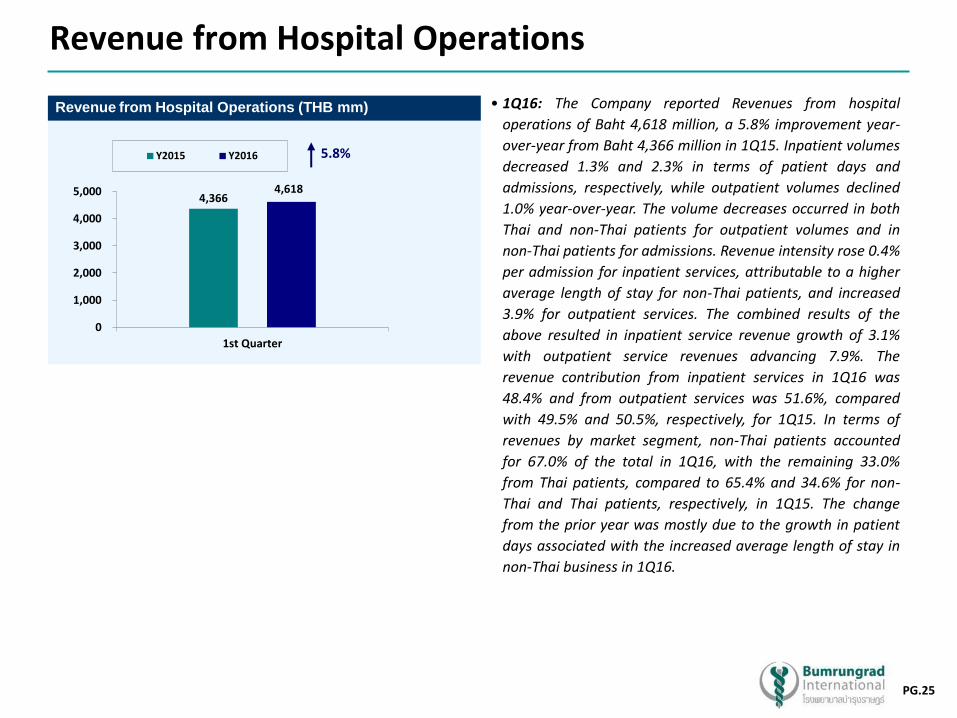
Revenue from Hospital Operations
Revenue from Hospital Operations (THB mm)
4,366 4,618
0
1,000
2,000
3,000
4,000
5,000
1st Quarter
Y2015 Y2016 5.8%
• 1Q16: The Company reported Revenues from hospital
operations of Baht 4,618 million, a 5.8% improvement year-
over-year from Baht 4,366 million in 1Q15. Inpatient volumes
decreased 1.3% and 2.3% in terms of patient days and
admissions, respectively, while outpatient volumes declined
1.0% year-over-year. The volume decreases occurred in both
Thai and non-Thai patients for outpatient volumes and in
non-Thai patients for admissions. Revenue intensity rose 0.4%
per admission for inpatient services, attributable to a higher
average length of stay for non-Thai patients, and increased
3.9% for outpatient services. The combined results of the
above resulted in inpatient service revenue growth of 3.1%
with outpatient service revenues advancing 7.9%. The
revenue contribution from inpatient services in 1Q16 was
48.4% and from outpatient services was 51.6%, compared
with 49.5% and 50.5%, respectively, for 1Q15. In terms of
revenues by market segment, non-Thai patients accounted
for 67.0% of the total in 1Q16, with the remaining 33.0%
from Thai patients, compared to 65.4% and 34.6% for non-
Thai and Thai patients, respectively, in 1Q15. The change
from the prior year was mostly due to the growth in patient
days associated with the increased average length of stay in
non-Thai business in 1Q16.
PG.26
EBITDA and EBITDA Margin
EBITDA (THB mm)
EBITDA Margin
32.9% 32.2%
20.0%
24.0%
28.0%
32.0%
36.0%
1st Quarter
Y2015 Y2016
1,452 1,501
0
600
1,200
1,800
1st Quarter
Y2015 Y2016
3.4%
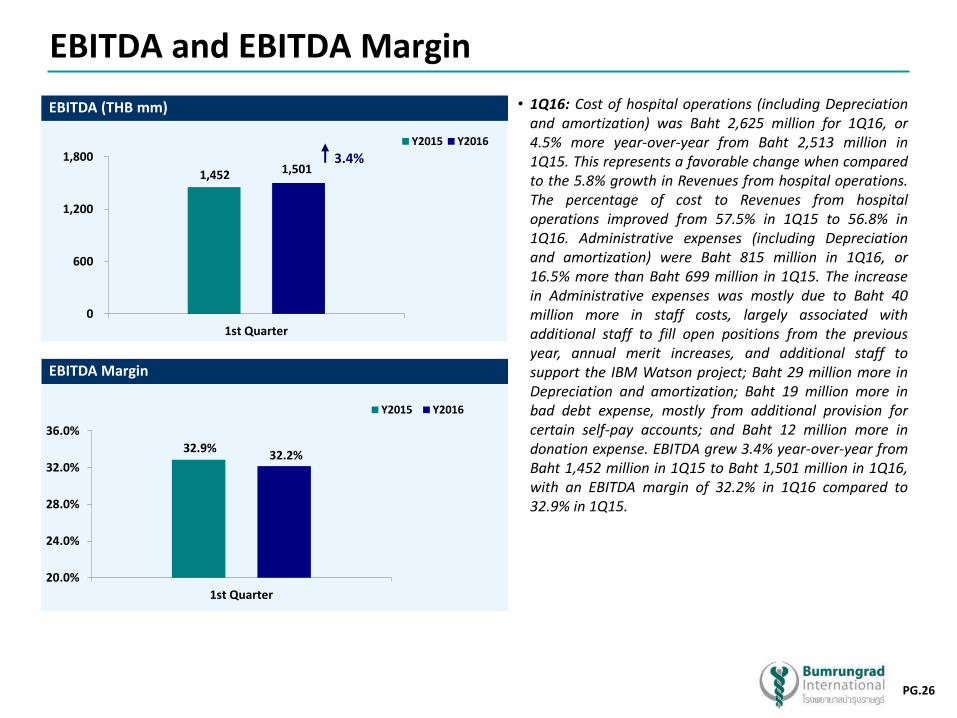
• 1Q16: Cost of hospital operations (including Depreciation and amortization) was Baht 2,625 million for 1Q16, or 4.5% more year-over-year from Baht 2,513 million in 1Q15. This represents a favorable change when compared to the 5.8% growth in Revenues from hospital operations. The percentage of cost to Revenues from hospital operations improved from 57.5% in 1Q15 to 56.8% in 1Q16. Administrative expenses (including Depreciation and amortization) were Baht 815 million in 1Q16, or 16.5% more than Baht 699 million in 1Q15. The increase in Administrative expenses was mostly due to Baht 40 million more in staff costs, largely associated with additional staff to fill open positions from the previous year, annual merit increases, and additional staff to support the IBM Watson project; Baht 29 million more in Depreciation and amortization; Baht 19 million more in bad debt expense, mostly from additional provision for certain self-pay accounts; and Baht 12 million more in donation expense. EBITDA grew 3.4% year-over-year from Baht 1,452 million in 1Q15 to Baht 1,501 million in 1Q16, with an EBITDA margin of 32.2% in 1Q16 compared to 32.9% in 1Q15.
PG.27
Net Profit (THB mm)
Diluted EPS (THB)
Net Profit Margin
Net Profit, Net Profit Margin and Diluted EPS
21.9% 20.8%
14.0%
16.0%
18.0%
20.0%
22.0%
24.0%
1st Quarter
Y2015 Y2016
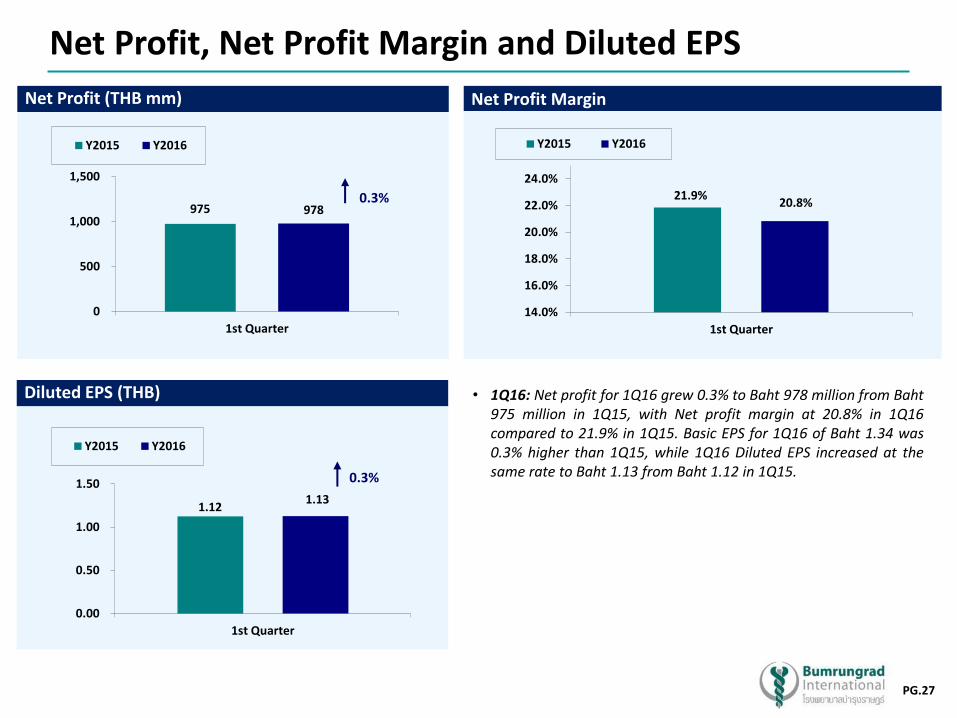
• 1Q16: Net profit for 1Q16 grew 0.3% to Baht 978 million from Baht 975 million in 1Q15, with Net profit margin at 20.8% in 1Q16 compared to 21.9% in 1Q15. Basic EPS for 1Q16 of Baht 1.34 was 0.3% higher than 1Q15, while 1Q16 Diluted EPS increased at the same rate to Baht 1.13 from Baht 1.12 in 1Q15.
975 978
0
500
1,000
1,500
1st Quarter
Y2015 Y2016
0.3%
1.12 1.13
0.00
0.50
1.00
1.50
1st Quarter
Y2015 Y2016
0.3%
PG.28
Leverage x Interest Coverage
x
Net Debt to EBITDA
x
Net Debt to Equity
x
(0.1)
0.2
0.0 0.0
(0.2) (0.25)
0.00
0.25
0.50
0.75
2012
2013 2014 2015
YTDMar16
(0.3)
0.5
0.1 0.0
(0.5) (0.50)
0.00
0.50
1.00
1.50
2012
2013 2014 2015
YTDMar16
13.8 16.4
18.8 22.1
25.0
0
10
20
30
40
2012 2013 2014 2015 YTD Mar16
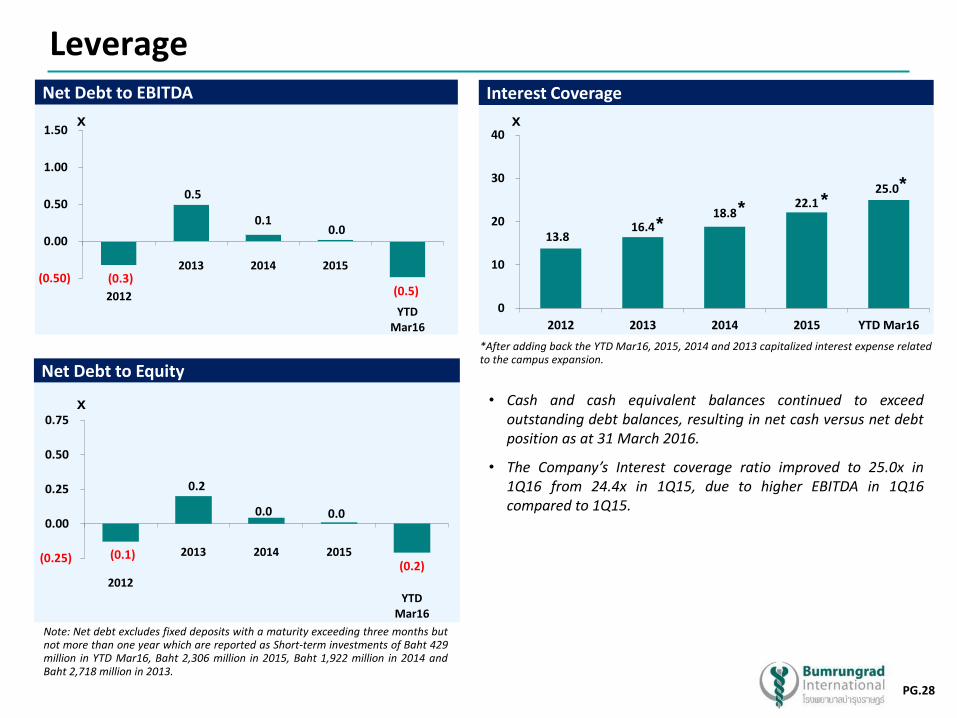
Note: Net debt excludes fixed deposits with a maturity exceeding three months but not more than one year which are reported as Short-term investments of Baht 429 million in YTD Mar16, Baht 2,306 million in 2015, Baht 1,922 million in 2014 and Baht 2,718 million in 2013.
* * *
*
*After adding back the YTD Mar16, 2015, 2014 and 2013 capitalized interest expense related to the campus expansion.
• Cash and cash equivalent balances continued to exceed outstanding debt balances, resulting in net cash versus net debt position as at 31 March 2016.
• The Company’s Interest coverage ratio improved to 25.0x in 1Q16 from 24.4x in 1Q15, due to higher EBITDA in 1Q16 compared to 1Q15.

PG.29
Q & A