Tracking in wireless sensor networks using particle filtering: Physical
Build Your Own Particle Sensor, EPA's Air Quality Workshop 2014
19
1 Build Your Own Particle Sensor Target Age Range: 5th -12th grades Estimated Time: 1 hour Additional ideas for lengthening the activity provided at the end. In addition, older high school age students can complete this activity in as little as 30 minutes with an abbreviated introduction. Objective: Teach basics about particulate matter air pollution and electronics. In addition work on problem solving and other science, technology, engineering, and math (STEM) skills. Figure 1. Sensor kit componetns assembled with materials you can find at home (rubber bands, cardboard box) Figure 2. Sensor kit components assembled using a children's building toy pieces and velcro
-
Upload
nguyendiep -
Category
Documents
-
view
213 -
download
0
Transcript of Build Your Own Particle Sensor, EPA's Air Quality Workshop 2014

1
Build Your Own Particle Sensor
Target Age Range: 5th -12th grades
Estimated Time: 1 hour
Additional ideas for lengthening the activity provided at the end. In addition, older high school
age students can complete this activity in as little as 30 minutes with an abbreviated
introduction.
Objective:
Teach basics about particulate matter air pollution and electronics. In addition work on
problem solving and other science, technology, engineering, and math (STEM) skills.
Figure 1. Sensor kit componetns assembled with materials you can find at home (rubber bands, cardboard box)
Figure 2. Sensor kit components assembled using a children's building toy pieces and velcro

2
Materials Needed:
The list of components is below, with a total cost per kit at approximately $50-60. Students can
work in teams of 2-3 per kit to save on cost. Visit http://www.wishlistr.com/sensorkit/ for a
complete list of materials and purchase links.
Note:
Many of the items from adafruit can be purchased for a lower price on Amazon. However
amazon links are not shown due to the high turnover rate of products listed on Amazon and the
difficulty in ensuring high quality components. Since Arduinos are an open source device some
sold online are not genuine Arduinos. Although this is legal they may not be made with the
same quality as genuine Arduinos and may not perform as desired.
Key components per kit:
Item (suggested source) Number per kit Cost
Arduino Uno R3 (adafruit.com) 1 $26.96
Half-size breadboard (adafruit.com) 1 $4.50
Breadboarding wire bundle (adafruit.com) 6 short wires, 1 long wire (1
wire bundle covers 10-15 kits)
$6.00
Diffused Red 5mm LED (25 pack) (adafruit.com) 3 LEDs (1 pack covers 6 kits) $4.00
9V battery clip with 5.5mm/2.1mm plug (adafruit.com) 1 $2.70
1K Ohm resistor (digikey.com) 3 $0.04
Dust sensor – Shinyei PPD42NS (epictinker.com) 1 $15.00
9 V battery (local hardware store) 1 $3.00
Additional components for organization and programming the Arduino boards
USB cable(s) to program the Arduino boards – programming activities could be an
expansion beyond building the kits.
Small plastic bags (e.g., Ziploc) to store components.
Materials to mount the components to a device that could be hand carried:
o Option 1: Classic Wee Waffle Blocks N’ Bucket Assortment (shown in this
tutorial)
o Option 2: Recycled small cardboard box, attachment with Velcro or rubberbands
o Option 3: Small lunch box – we found a $2 plastic first aid box available online
that we’ve used in recent versions.

3
Materials Provided:
1. Instructions
2. Arduino Code (separate file)
3. Slides for explanation and assembly of device-can be projected or printed multiple to a
sheet as handouts for students
Prep Work (Before first use of kits):
Step 1. Program all Arduinos
Software for Arduino can be found at Arduino.cc under the download tab
The custom program developed for the PM sensor kit (PM_Sensor_Kit_Code.ino) needs to
be uploaded to all Arduinos before the class begins.
Installing Arduino software:
1. Go to http://arduino.cc/
2. Click on the download tab
3. Under the Download heading select the program you need based on the type of
computer you will be using (Windows, Mac, or Linux).
4. Run the installation software.
Once the Arduino program has been installed on
your computer:
1. Save the provided Arduino code
(PM_Sensor_Kit_Code.ino) saved on your
computer in a folder you can easily navigate to.
2. Open the Arduino program either through your
desktop icon or through the programs folder on
your computer. You should have a sketch open
that looks similar to the image on the right.
3. Open the Build your own PM sensor program by
clicking on the “File” tab in the navigation menu,
then “Open”, and then selecting the program file
(PM_Sensor_Kit_Code.ino).
4. Plug an Arduino into your computer using the
USB cable.
5. Click the arrow button to upload the code.
6. In the event of an error pop-up, two things to check:
4
a. If the correct “COM” port is not selected you will get an error. You will need to
change the COM port either through the error message that pops up or click on
the “Tools” tab and then click on “Serial Port”.
b. Make sure that you have the correct board selected under the “Tools” tab and
board “Arduino Uno”.
7. Once you click the arrow button to upload the code and it uploads the code successfully,
check that the code is running by clicking on the “Tools” tab, then selecting “Serial
Monitor”. After a few seconds you should see "BUILD YOUR OWN SENSOR
INITIALIZING" and a particle ratio should appear every 5 seconds.
8. Once you have verified that the code has been uploaded unplug the Arduino.
9. Repeat steps 5-10 for all Arduinos
10. In addition, it is recommended that you assemble one full particle sensor kit after
uploading the code to make sure it is all functioning properly.
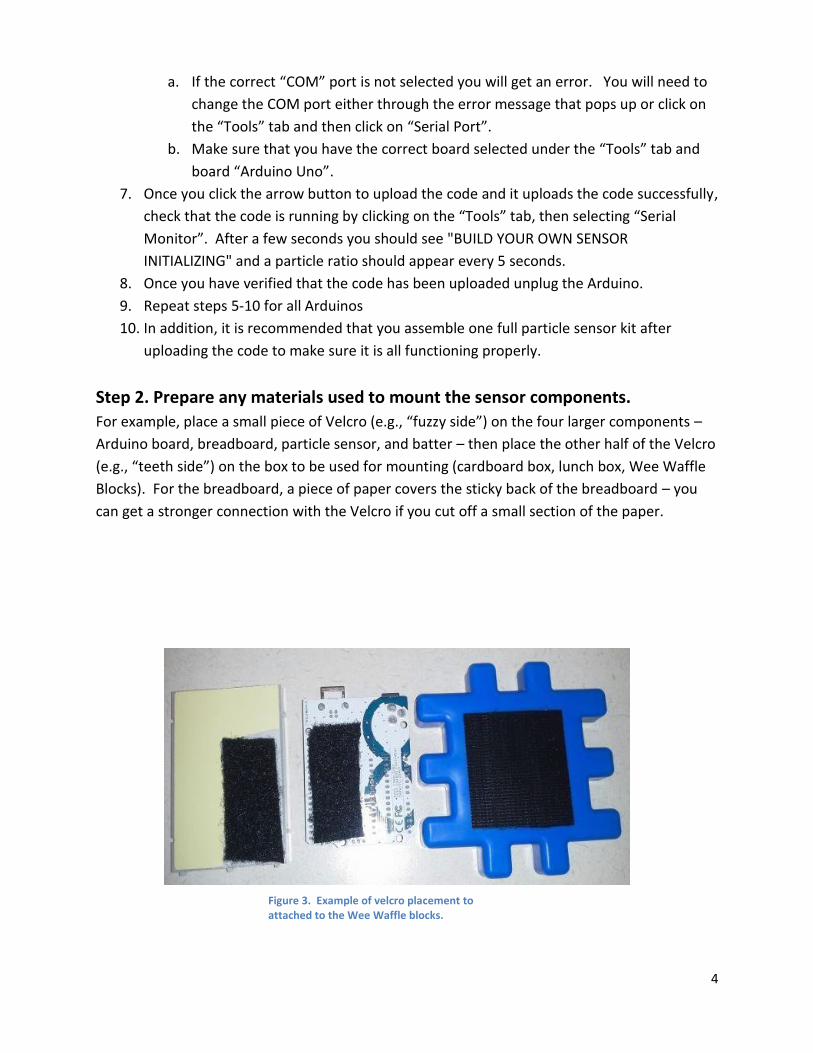
Step 2. Prepare any materials used to mount the sensor components.
For example, place a small piece of Velcro (e.g., “fuzzy side”) on the four larger components –
Arduino board, breadboard, particle sensor, and batter – then place the other half of the Velcro
(e.g., “teeth side”) on the box to be used for mounting (cardboard box, lunch box, Wee Waffle
Blocks). For the breadboard, a piece of paper covers the sticky back of the breadboard – you
can get a stronger connection with the Velcro if you cut off a small section of the paper.
Figure 3. Example of velcro placement to attached to the Wee Waffle blocks.
5
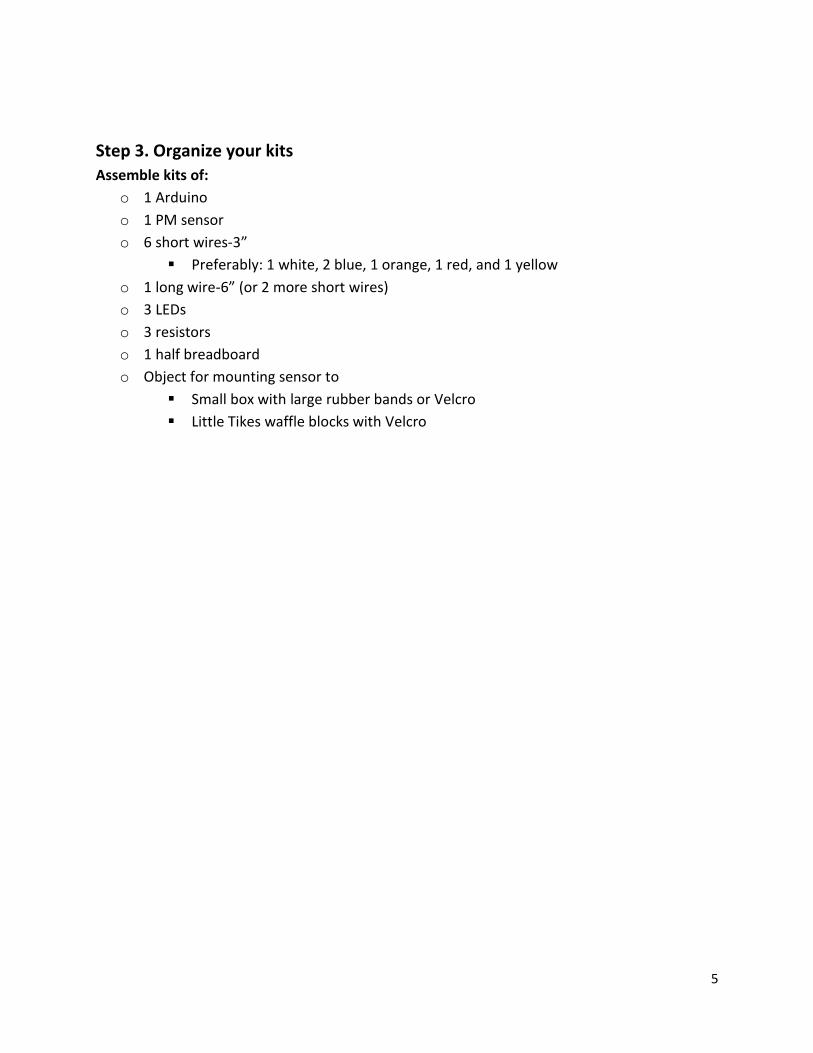
Step 3. Organize your kits
Assemble kits of:
o 1 Arduino
o 1 PM sensor
o 6 short wires-3”
Preferably: 1 white, 2 blue, 1 orange, 1 red, and 1 yellow
o 1 long wire-6” (or 2 more short wires)
o 3 LEDs
o 3 resistors
o 1 half breadboard
o Object for mounting sensor to
Small box with large rubber bands or Velcro
Little Tikes waffle blocks with Velcro
6
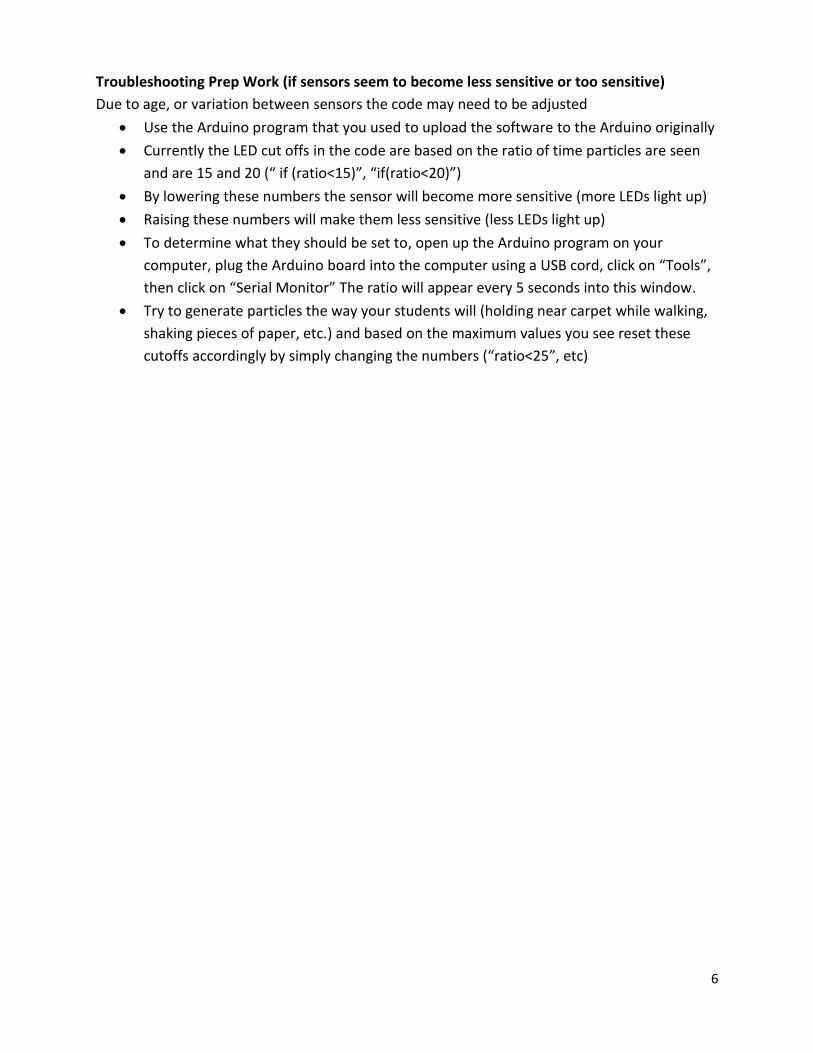
Troubleshooting Prep Work (if sensors seem to become less sensitive or too sensitive)
Due to age, or variation between sensors the code may need to be adjusted
Use the Arduino program that you used to upload the software to the Arduino originally
Currently the LED cut offs in the code are based on the ratio of time particles are seen
and are 15 and 20 (“ if (ratio<15)”, “if(ratio<20)”)
By lowering these numbers the sensor will become more sensitive (more LEDs light up)
Raising these numbers will make them less sensitive (less LEDs light up)
To determine what they should be set to, open up the Arduino program on your
computer, plug the Arduino board into the computer using a USB cord, click on “Tools”,
then click on “Serial Monitor” The ratio will appear every 5 seconds into this window.
Try to generate particles the way your students will (holding near carpet while walking,
shaking pieces of paper, etc.) and based on the maximum values you see reset these
cutoffs accordingly by simply changing the numbers (“ratio<25”, etc)

7
Activity
Introduction (10 min)
Particulate Matter:
Does anyone know about particulate air pollution? “Particle pollution (also called particulate matter or PM) is the term for a mixture of solid particles and liquid droplets found in the air. Some particles, such as dust, dirt, soot, or smoke, are large or dark enough to be seen with the naked eye. Others are so small they can only be detected using an electron microscope…These particles come in many sizes and shapes and can be made up of hundreds of different chemicals.” (http://www.epa.gov/pm/basic.html) “Particle pollution includes ‘inhalable coarse particles,’ with diameters larger than 2.5 micrometers and smaller than 10 micrometers and ‘fine particles,’ with diameters that are 2.5 micrometers and smaller” (http://www.epa.gov/pm/basic.html). How small is 2.5 micrometers? “Think about a single hair from your head. The average human hair is about 70 micrometers in diameter – making it 30 times larger than the largest fine particle.” (http://www.epa.gov/pm/basic.html) Where do you think PM comes from? “Some particles, known as primary particles are emitted directly from a source, such as construction sites, unpaved roads, fields, smokestacks or fires. Others form in complicated reactions in the atmosphere of chemicals such as sulfur dioxides and nitrogen oxides that are emitted from power plants, industries and automobiles. These particles, known as secondary particles, make up most of the fine particle pollution in the country. EPA regulates inhalable particles (fine and coarse). Particles larger than 10 micrometers (sand and large dust) are not regulated by EPA.” (http://www.epa.gov/pm/basic.html) Why is PM pollution bad?
Health “Particle pollution contains microscopic solids or liquid droplets that are so small that they can get deep into the lungs and cause serious health problems.” (http://www.epa.gov/pm/basic.html)
Do you think the size of the particles makes a difference? “The size of particles is directly linked to their potential for
causing health problems. Small particles less than 10 micrometers in diameter pose the greatest problems, because

8
they can get deep into your lungs, and some may even get into your bloodstream." (http://www.epa.gov/pm/basic.html)
Visibility impairment
Fine particles (PM2.5) are the main cause of reduced visibility (haze) in parts of the United States, including many of our treasured national parks and wilderness areas.
(http://www.epa.gov/pm/basic.html) (image sources: 1: http://www.southernenvironment.org/ cases/southern_air_smog/ 2: http://www.guardian.co.uk/ world/2013/jan/14/beijing-smog-continues-media-action 3: http://www.zmescience.com/ecology/ environmental-issues/china-smog-30012013/)
Environmental damage “Particles can be carried over long distances by wind and then settle on ground or water. The effects of this settling include: making lakes and streams acidic; changing the nutrient balance in coastal waters and large river basins; depleting the nutrients in soil; damaging sensitive forests and farm crops; and affecting the diversity of ecosystems. More information about the effects of particle pollution and acid rain.” (http://www.epa.gov/pm/health.html)
Aesthetic damage
“Particle pollution can stain and damage stone and
other materials, including culturally important
objects such as statues and monuments”
(http://www.epa.gov/pm/health.html). One
example is Hadrian's Arch, built in Athens Greece in
131 AD. It has been discolored by soot from the city
(http://www.climateandmonuments.com/#!Hadrian
s-Arch-Athens-131-AD/zoom/c1o0z/image41c).
Smog over China
Smog over Charlotte
9
Kit Explanation Use one of the kits so that each component can be held up while it is introduced.
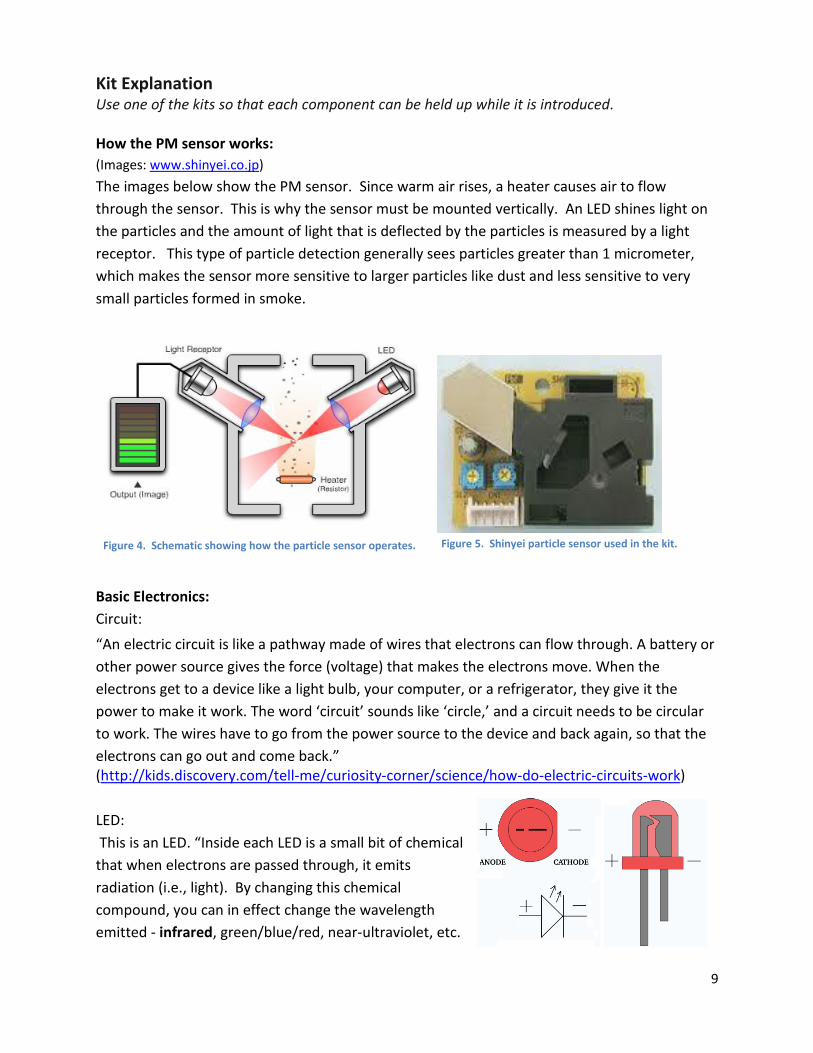
How the PM sensor works:
(Images: www.shinyei.co.jp)
The images below show the PM sensor. Since warm air rises, a heater causes air to flow
through the sensor. This is why the sensor must be mounted vertically. An LED shines light on
the particles and the amount of light that is deflected by the particles is measured by a light
receptor. This type of particle detection generally sees particles greater than 1 micrometer,
which makes the sensor more sensitive to larger particles like dust and less sensitive to very
small particles formed in smoke.
Figure 5. Shinyei particle sensor used in the kit.
Basic Electronics:
Circuit:
“An electric circuit is like a pathway made of wires that electrons can flow through. A battery or
other power source gives the force (voltage) that makes the electrons move. When the
electrons get to a device like a light bulb, your computer, or a refrigerator, they give it the
power to make it work. The word ‘circuit’ sounds like ‘circle,’ and a circuit needs to be circular
to work. The wires have to go from the power source to the device and back again, so that the
electrons can go out and come back.” (http://kids.discovery.com/tell-me/curiosity-corner/science/how-do-electric-circuits-work)
LED:
This is an LED. “Inside each LED is a small bit of chemical
that when electrons are passed through, it emits
radiation (i.e., light). By changing this chemical
compound, you can in effect change the wavelength
emitted - infrared, green/blue/red, near-ultraviolet, etc.
Figure 4. Schematic showing how the particle sensor operates.
10
Be aware that an LED is a diode, meaning that it is polarized. By convention, current can only go
from the anode (positive end) to the cathode (ground, or negative end)…Note that the two
wires on the LED are different lengths. The longer wire is always + and the shorter is -.” (Images:
http://www.societyofrobots.com/electronics_led_tutorial.shtml)
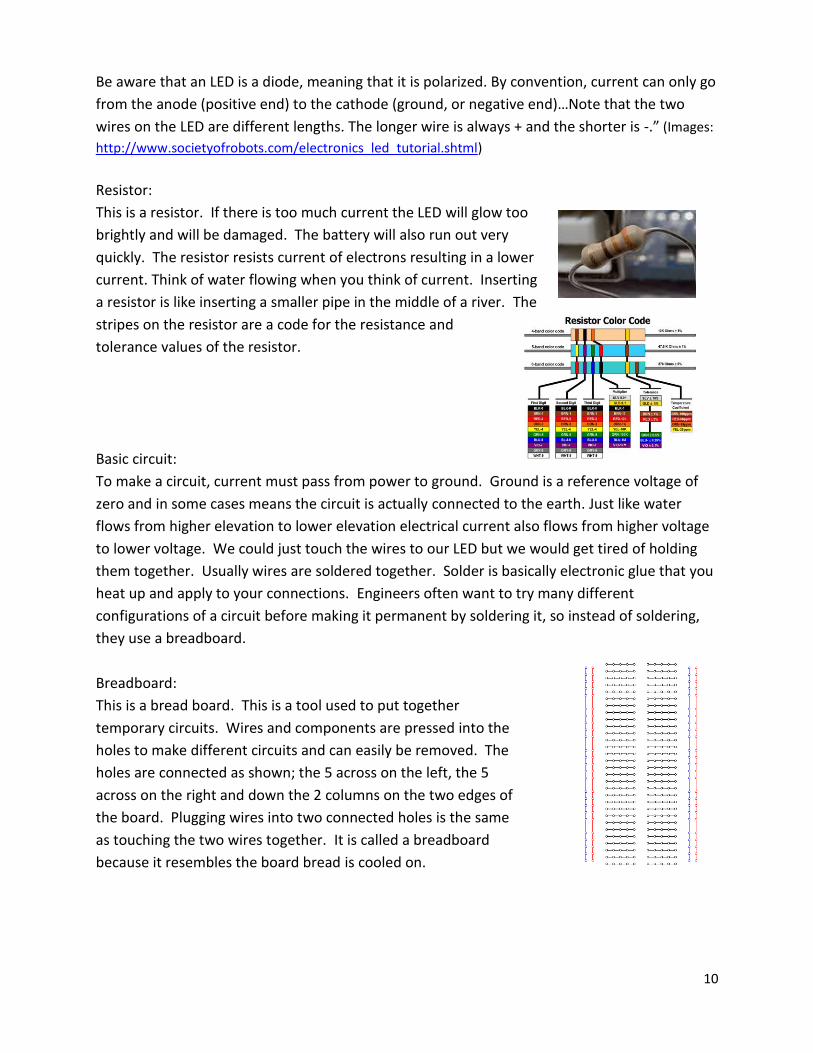
Resistor:
This is a resistor. If there is too much current the LED will glow too
brightly and will be damaged. The battery will also run out very
quickly. The resistor resists current of electrons resulting in a lower
current. Think of water flowing when you think of current. Inserting
a resistor is like inserting a smaller pipe in the middle of a river. The
stripes on the resistor are a code for the resistance and
tolerance values of the resistor.
Basic circuit:
To make a circuit, current must pass from power to ground. Ground is a reference voltage of
zero and in some cases means the circuit is actually connected to the earth. Just like water
flows from higher elevation to lower elevation electrical current also flows from higher voltage
to lower voltage. We could just touch the wires to our LED but we would get tired of holding
them together. Usually wires are soldered together. Solder is basically electronic glue that you
heat up and apply to your connections. Engineers often want to try many different
configurations of a circuit before making it permanent by soldering it, so instead of soldering,
they use a breadboard.
Breadboard:
This is a bread board. This is a tool used to put together
temporary circuits. Wires and components are pressed into the
holes to make different circuits and can easily be removed. The
holes are connected as shown; the 5 across on the left, the 5
across on the right and down the 2 columns on the two edges of
the board. Plugging wires into two connected holes is the same
as touching the two wires together. It is called a breadboard
because it resembles the board bread is cooled on.
11
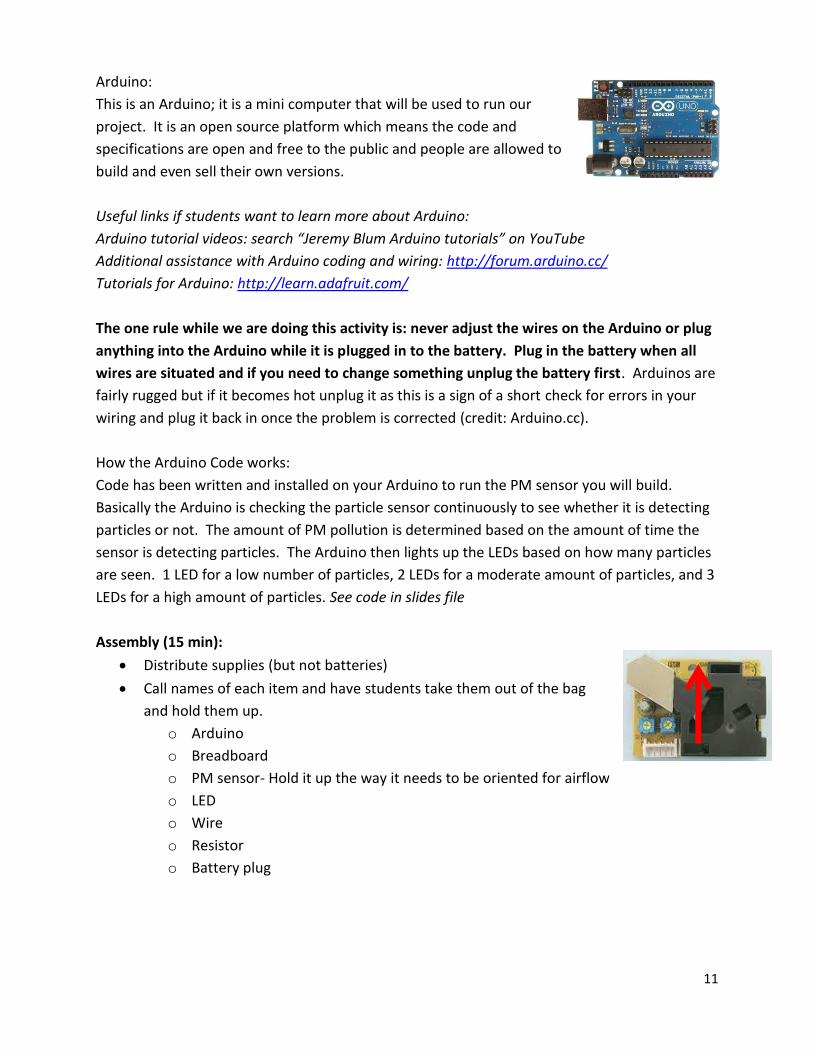
Arduino:
This is an Arduino; it is a mini computer that will be used to run our
project. It is an open source platform which means the code and
specifications are open and free to the public and people are allowed to
build and even sell their own versions.
Useful links if students want to learn more about Arduino:
Arduino tutorial videos: search “Jeremy Blum Arduino tutorials” on YouTube
Additional assistance with Arduino coding and wiring: http://forum.arduino.cc/
Tutorials for Arduino: http://learn.adafruit.com/
The one rule while we are doing this activity is: never adjust the wires on the Arduino or plug
anything into the Arduino while it is plugged in to the battery. Plug in the battery when all
wires are situated and if you need to change something unplug the battery first. Arduinos are
fairly rugged but if it becomes hot unplug it as this is a sign of a short check for errors in your
wiring and plug it back in once the problem is corrected (credit: Arduino.cc).
How the Arduino Code works:
Code has been written and installed on your Arduino to run the PM sensor you will build.
Basically the Arduino is checking the particle sensor continuously to see whether it is detecting
particles or not. The amount of PM pollution is determined based on the amount of time the
sensor is detecting particles. The Arduino then lights up the LEDs based on how many particles
are seen. 1 LED for a low number of particles, 2 LEDs for a moderate amount of particles, and 3
LEDs for a high amount of particles. See code in slides file
Assembly (15 min):
Distribute supplies (but not batteries)
Call names of each item and have students take them out of the bag
and hold them up.
o Arduino
o Breadboard
o PM sensor- Hold it up the way it needs to be oriented for airflow
o LED
o Wire
o Resistor
o Battery plug

12
Step 1. Assemble your LED circuits
Notes about Assembly: For younger students specify holes on the breadboard as
detailed below. In reality it doesn’t matter which rows or columns they go into as long
as the ends that need to be connected are in the same row (see figure to right). In
addition wire color does not matter it is just included for simplicity for younger student.
In addition all “GND” pins on the Arduino are the same so it does not matter which GND
the students connect to.
Assembling the LED circuits:
1. Set aside your long wire (skip this step if students were provided two short wires
instead of a long wire)
2. Notice that the breadboard is labeled a-j across the top and bottom and 1-30
down the sides.
3. Take one LED and plug the long end (the positive end) into E3 on the breadboard
4. Plug the short end (the negative end) of the LED into F3
5. Take the next LED and plug the long leg into E15
6. Plug the short end into F15
7. Take the last LED and plug the long leg into E28
8. Plug the short end into F28
9. Next take a resistor and plug one end into H3 (it doesn’t matter which end you
use since resistors are non polar unlike LEDs)
10. Plug the other end into any hole on the blue negative bar on the right
11. Take the next resistor and place it into H15
12. Plug the other end into any hole on the blue negative bar on the right
13. Take the last resistor and place it into H 28
14. Plug the other end into any hole on the blue negative bar on the right
15. Plug the blue wire into A3 and leave the other end hanging
16. Plug the Orange wire into A15 and leave the other end hanging
17. Plug the white wire into A28 and leave the other end hanging
13
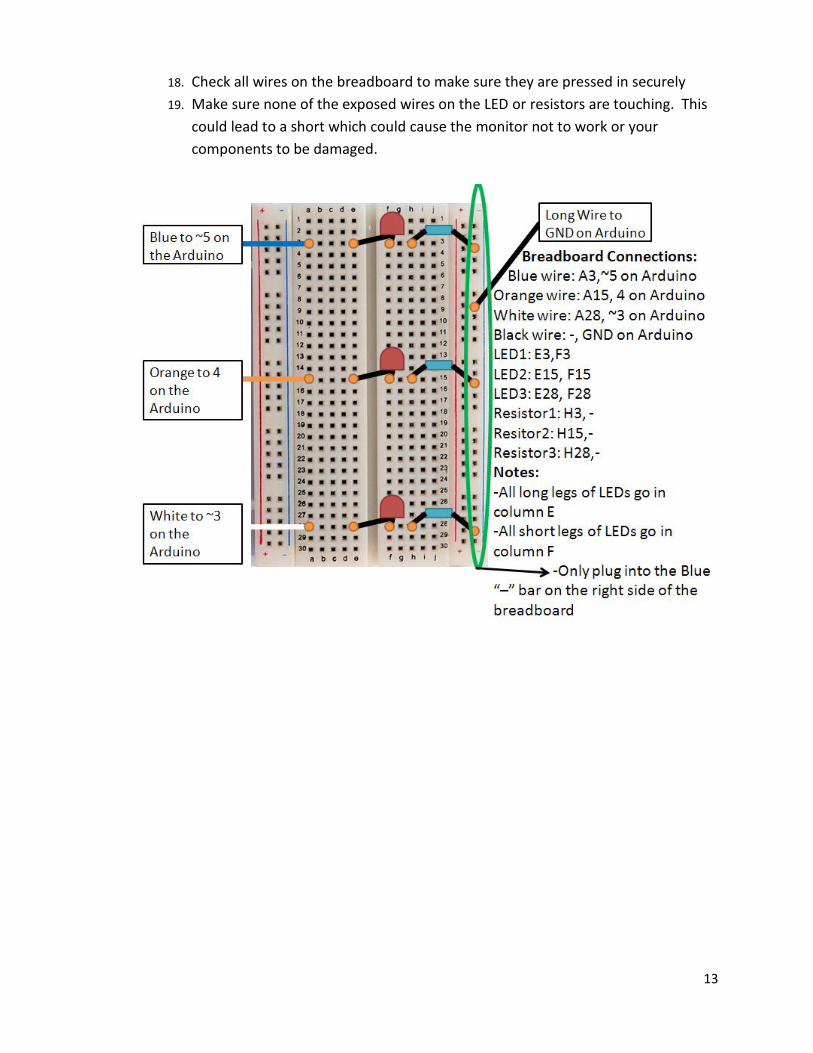
18. Check all wires on the breadboard to make sure they are pressed in securely
19. Make sure none of the exposed wires on the LED or resistors are touching. This
could lead to a short which could cause the monitor not to work or your
components to be damaged.
14
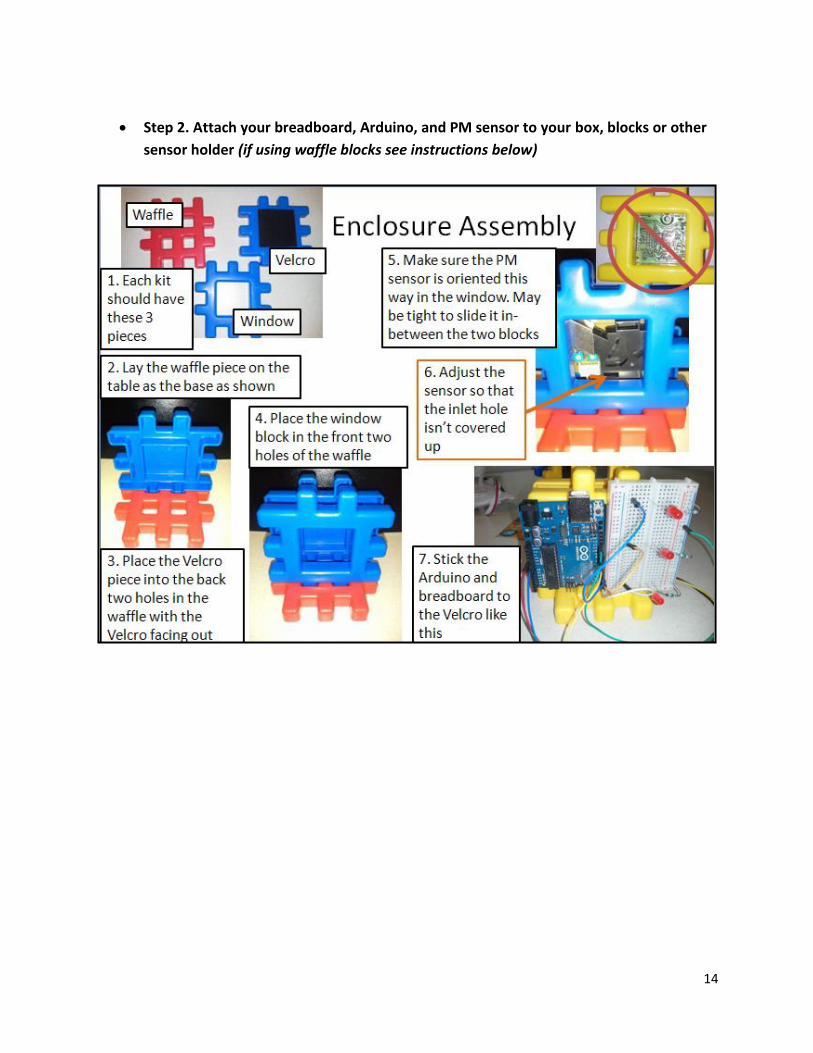
Step 2. Attach your breadboard, Arduino, and PM sensor to your box, blocks or other
sensor holder (if using waffle blocks see instructions below)
15
Step 3. Connect your PM sensor
o Find the white connector on the end of the PM sensor
o Using the three remaining wires (that have not been plugged in anywhere yet):
Plug the red wire into red
Yellow into yellow
And blue into black
Step 4. Connect all wires to Arduino
1. Take the blue wire from the first LED and plug it into “~5” on the right side of the
Arduino (“~5” is printed on the Arduino this does not mean approximately 5).
Make sure to look at the Arduino straight on or count the number of pins up
from the bottom or down from the top so that you get all the wires in the right
place. It is very easy to get your wires shifted up or down by one but then your
sensor will not work.
2. Plug the orange wire from the second LED into 4 on the right side of the Arduino
3. Plug the white wire from the third LED into the ~3 on the Arduino
4. Plug the wire connected to the yellow wire from the PM sensor into 8 on the
right side of the Arduino
5. Plug the wire connected to the black wire from the PM sensor into GND on the
Arduino
6. Plug the wire connected to the red wire from the PM sensor into 5V on the
Arduino
7. Plug the long wire into the blue negative column on the right where all your
resistors are plugged in
8. Plug the other end of the long wire into GND on the Arduino

16
Figure 6. Schematic of wiring the Arduino board to the PM sensor and breadboard
Step 5. Review wiring and plug in battery.
o Instructor checks circuit to protect against potentially damaging the components-
Make sure LEDs are oriented correctly (long leg +/ short leg -). Another common
mistake is getting the wires plugged into the correct pins on the Arduino.
o Give students battery once all wires have been checked
o Once your sensor has been checked you may connect the battery
Testing (10 min): Have students test their new monitors around the room. See what sources of
PM they can find.
Discussion and clean up (15 min)
What activities produced the most particles?
A few examples:
Walking on carpet
Rubbing hands together
Sweeping up dust
Tearing paper/napkins
Chalk/white board erasers
Breathing on the sensor
Rubbing clothing
Shaking hair
Why?
Walking on carpet-dust particles released into air from carpet
17
Rubbing hands together-skin cells being released into air
Sweeping up dust-dust being released into the
Tearing paper-small paper particles being released into air
Clean up
Have students carefully remove all components and wires from breadboard and Arduino and
put them back in their containers. Ask the students to straighten any crimps in the resistors.
Closing discussion (If additional time remains)- an also repeat questions from beginning to see
what students remember or go over anything that you didn’t have time to cover in the
beginning.
What can you do to reduce PM?
Drive less
Use less electricity since power plants are a major source
How can you reduce your exposure to PM?
Stay indoors on bad air quality days
Where a mask when doing dusty activities (mowing the lawn, construction work, etc)
Fun Facts How many gallons of Air do you think the average adult breaths in a day? The average adult breathes 3,000 gallons of air per day.
(http://www.epa.gov/air/basic.html) So that’s a lot of opportunity to breath in air pollutants like particulate
matter Are Children or Adults more affected by air pollutants? According to the American Academy of Pediatrics, children and infants are among the
most susceptible to many air pollutants. Children have increased exposure compared with adults because of higher levels of physical activity and other factors.
Additional Facts: http://www.epa.gov/pm/fastfacts.html
Additional Activities to extend into multiple classes or longer sessions:
Drawing
Engineers often have to draw up plans so that another person can build what they have design.
Have students diagram what they have built so that another student could reassemble it. Have
the students draw it from the different views (angles) etc.
18
Hacking (need to purchase more USB cables)
Allow students to modify the code and enclosure for their sensor. Allow them to add more
LEDs or change display method (blinking for different concentrations, etc).
Useful links if students want to learn more about Arduino:
Arduino tutorial videos: search “Jeremy Blum Arduino tutorials” on YouTube
Additional assistance with Arduino coding and wiring: http://forum.arduino.cc/
Tutorials for Arduino: http://learn.adafruit.com/
Resistors (need to purchase more Resistors)
Purchase a few different value resistors. Allow students to experiment with plugging in higher
and lower values into their monitor. Have them figure out what the values are based on the
resistor code. Students can also experiment with LEDs in series and parallel circuits.
19
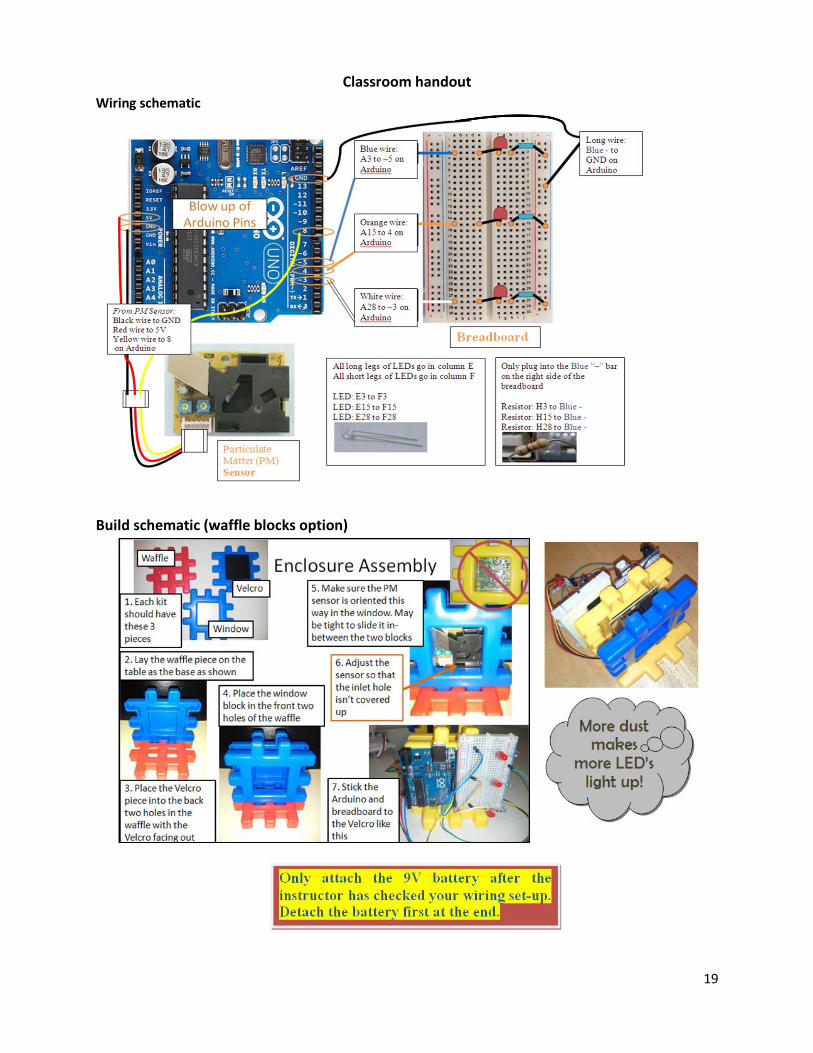
Classroom handout
Wiring schematic
Build schematic (waffle blocks option)