Budget - Winfield, KS
140
Budget 2017 Annual
Transcript of Budget - Winfield, KS
Budget
2017 Annual
2017 Budget City of Winfield Page i ~~~~~~~~~~~~~~~~~~~~~~~~~~~~~~~~~~~~~~~~~~~~~~~~~~~~~~~~~~~~~~~~~~~~~~~~~~~~~~~
~~~~~~~~~~~~~~~~~~~~~~~~~~~~~~~~~~~~~~~~~~~~~~~~~~~~~~~~~~~~~~~~~~~~~~~~~~~~~~~~~~~~
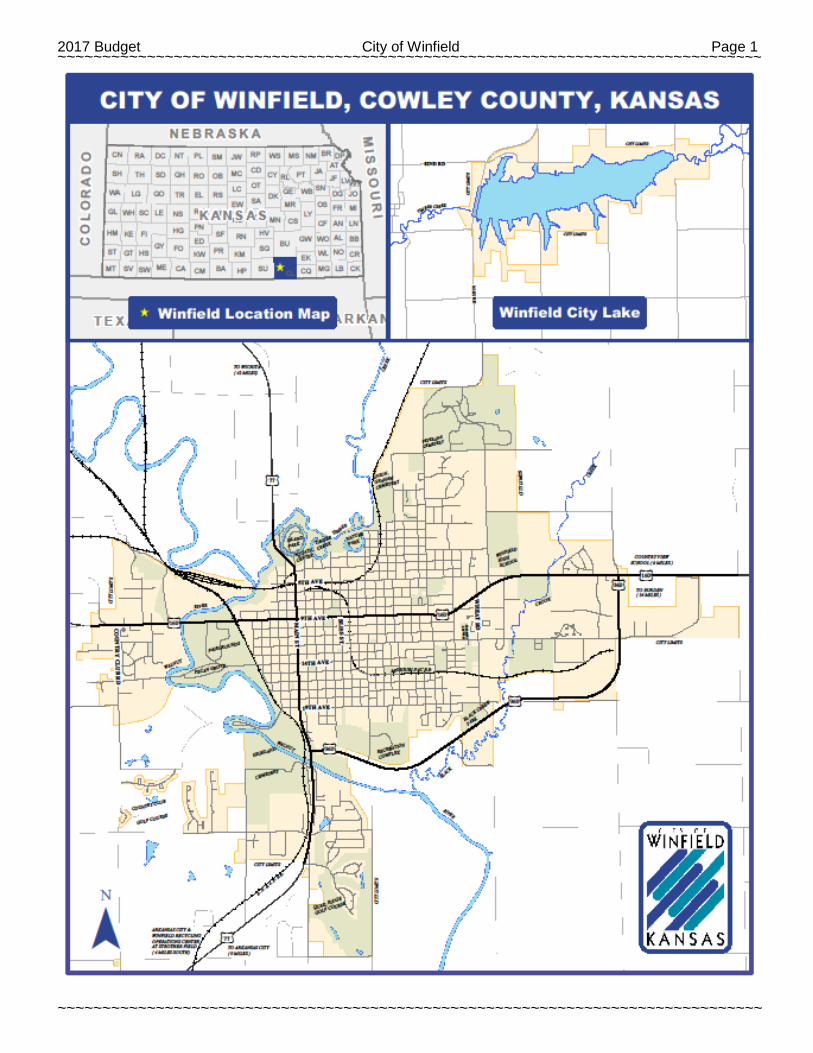
City of Winfield, Kansas Table of Contents
I. Budget Message ......................................................................................................................................... a
II. Summary Information City Limits Map ....................................................................................................................................... 1 City of Winfield Organization.................................................................................................................. 2 The City of Winfield Budget Process ..................................................................................................... 3 History of Mill Levy ................................................................................................................................. 4 Value of Your City of Winfield Tax Dollar .............................................................................................. 5 Mill Levy by Taxing Unit ......................................................................................................................... 6 One Cent Sales Tax Collections ............................................................................................................ 7 Employee Benefits ................................................................................................................................. 8 Sources of Revenue ............................................................................................................................ 10 Five Year Capital Improvement Projects ............................................................................................. 11 Schedule of Transfers .......................................................................................................................... 12 Statement of Indebtedness .................................................................................................................. 13 Proposed Capital Outlay ...................................................................................................................... 14
III. Financial Position Revenue Detail and Expenditure Summary General Fund-001 ................................................................................................................................ 17 Flood Control Fund-106 ....................................................................................................................... 20 Alcohol and Drug Safety Action-115 .................................................................................................... 20 Special Parks and Recreation Fund-116 ............................................................................................. 21 Special Alcohol and Drug Program Fund-117 ..................................................................................... 21 Law Enforcement Trust Fund-119 ....................................................................................................... 22 Water Preservation Fund-120 .............................................................................................................. 22 Senior Citizens Fund-122 .................................................................................................................... 23 Special Liability Fund-125 .................................................................................................................... 23 Special Streets and Highway Fund-132 .............................................................................................. 24 Industrial Development Fund-133 ........................................................................................................ 25 Convention & Tourism Fund-134 ......................................................................................................... 25 Cemetery Improvement Fund-135 ....................................................................................................... 26 Fairgrounds Improvement Fund-136 ................................................................................................... 26 Sales Tax Streets-137 ......................................................................................................................... 27 Drug Task Force-138 ........................................................................................................................... 27 Library Fund-172 .................................................................................................................................. 27 Bond & Interest Fund-260 .................................................................................................................... 28 Electric Fund-402 ................................................................................................................................. 29 Gas Fund-403 ...................................................................................................................................... 30 Water Fund-404 ................................................................................................................................... 31 Refuse Fund-412 ................................................................................................................................. 32 Wastewater Fund-413 .......................................................................................................................... 33 Stormwater Drainage Fund-414 .......................................................................................................... 33 Quail Ridge Golf Course-433 ............................................................................................................... 34 Management Services Fund-508 ......................................................................................................... 35 Operational Services Fund-509 ........................................................................................................... 36
IV. Department Summaries General Fund
Municipal Court .............................................................................................................................. 37 Community Development .............................................................................................................. 38 Police ............................................................................................................................................. 41 Fire Department ............................................................................................................................. 44 EMS ............................................................................................................................................... 47 Winfield City Lake .......................................................................................................................... 49 Park Department ............................................................................................................................ 52 Cemetery Department ................................................................................................................... 54 Aquatic Facility ............................................................................................................................... 56
Page ii City of Winfield 2017 Budget ~~~~~~~~~~~~~~~~~~~~~~~~~~~~~~~~~~~~~~~~~~~~~~~~~~~~~~~~~~~~~~~~~~~~~~~~~~~~~~~
~~~~~~~~~~~~~~~~~~~~~~~~~~~~~~~~~~~~~~~~~~~~~~~~~~~~~~~~~~~~~~~~~~~~~~~~~~~~~~~~~~~~
City of Winfield, Kansas Table of Contents – Continued –
Public Parking ................................................................................................................................ 58 General Administrative .................................................................................................................. 59 Baden Square ................................................................................................................................ 60
Flood Control Maintenance .................................................................................................................. 62 Alcohol and Drug Safety Action ........................................................................................................... 63 Special Parks & Recreation ................................................................................................................. 64 Special Alcohol and Drug Program Fund ............................................................................................ 65 Law Enforcement Trust Fund............................................................................................................... 66 Water Preservation Fund ..................................................................................................................... 67 Senior Citizens Fund ............................................................................................................................ 68 Special Liability Fund ........................................................................................................................... 69 Special Streets and Highway Fund ...................................................................................................... 70 Industrial Development Fund ............................................................................................................... 71 Convention & Tourism ......................................................................................................................... 73 Advisory Committee Discretionary Funds ........................................................................................... 74 Cemetery Improvement Fund .............................................................................................................. 75 Fairgrounds Improvement Fund .......................................................................................................... 76 Sales Tax Streets ................................................................................................................................. 77 Drug Task Force .................................................................................................................................. 78 Library Fund ......................................................................................................................................... 79 Bond & Interest Fund ........................................................................................................................... 80 Electric Fund ........................................................................................................................................ 84
Electric Production (East and West Plants) ................................................................................... 85 Electric Distribution ........................................................................................................................ 87 Electric Administration ................................................................................................................... 89
Gas Fund.............................................................................................................................................. 91 Gas Distribution ............................................................................................................................. 92 Gas Administration ........................................................................................................................ 94
Water .................................................................................................................................................... 96 Water Production ........................................................................................................................... 97 Water Distribution .......................................................................................................................... 99 Water Administration ................................................................................................................... 101
Refuse ................................................................................................................................................ 102 Refuse Collection ......................................................................................................................... 103 Recycling Center.......................................................................................................................... 105
Wastewater ........................................................................................................................................ 107 Wastewater Collection ................................................................................................................. 108 Wastewater Treatment ................................................................................................................ 110 Veteran's Home Pump Station .................................................................................................... 112 Wastewater Administration .......................................................................................................... 113
Stormwater Drainage Fund ................................................................................................................ 115 Quail Ridge Golf Course .................................................................................................................... 116
Quail Ridge Maintenance ............................................................................................................ 117 Quail Ridge Clubhouse ................................................................................................................ 119
Management Services Fund .............................................................................................................. 121 MIS ............................................................................................................................................... 122 Customer Service ........................................................................................................................ 123 Management Services ................................................................................................................. 124 Purchasing/DOC .......................................................................................................................... 126 City Hall ........................................................................................................................................ 127 Engineering .................................................................................................................................. 128
Operational Services .......................................................................................................................... 130 Fleet Management ....................................................................................................................... 131 Operation Center Building ........................................................................................................... 133
a
November 22, 2016 Honorable Mayor Butters and Commissioners Hutto and Thompson City Hall City of Winfield Winfield, Kansas Dear Mayor Butters and Commissioners Hutto and Thompson: All is connected. No one thing can change by itself. Paul Hawken It is my privilege and responsibility to present to you the 2017 City of Winfield operating and capital budget. As always, this document is an effort put together by many folks, all with the goal of delivering services to our residents and customers [among the finest in the country]? at an overall affordable cost. I believe we do an excellent job and the 2017 budget was developed to maintain an affordable level of service. I'll go anywhere as long as it's forward. David Livingston The next year will be very busy, both from an infrastructure development plan and from a human resource management perspective. On the transportation side in 2017, KDOT will be providing over $2 million for the replacement of the 14th Avenue bridge; the replacement of a portion of 12th Avenue; and another KLINK resurfacing project. Additionally, the City will be providing at least $2.6 million in local financing for these projects plus local street maintenance activities funded by sales tax and the CIP. This will be the largest transportation program since the K-360 bypass was completed in 1996. We also have initial funding for the architectural review of the USD 465 buildings in the planning for the Public Safety facilities. We also have numerous other projects that will keep staff committed to completing ongoing infrastructure improvements throughout the community. On the personnel side over the next eighteen months, we will see changes in a number of leadership positions. Many dedicated and long-serving employees will be leaving the city and the organization will continue to evolve as change is inevitable. We change, the world changes. Change is the law of life and those who look only to the past or present are certain to miss the future. John F. Kennedy

b
We expect two housing developments to be completed in 2017; Country Club Villas and multi-family development at 19th and Bliss. Both projects will need some additional refinement, but still have potential to be a portion of the solution for the documented housing needs in Winfield. We also have an application in to Kansas Housing to assist in funding improvements for rental property. It has been an active process through 2016 and project development will become more focused in 2017. This budget will be the last one prior to implementation of the state legislature imposed Property Tax Lid. For next year, property valuation did increase by 2.6%, from $68,400,604 to $70,208,999. The total property tax rate for the City of Winfield for 2017 budget year declines from 53.722 to 53.359, a decrease of 0.363 mills. For 2017, we have already made an adjustment to fairground fees that might raise an additional $6,000 per year. The City Commission also approved the initial increase in base rate fees to the natural gas rate structure. The rates for natural gas had not been altered since 2001, but it has become apparent that the Enable Pipeline transmission contract issues will require either significant resources to conduct a legal battle or large capital to perform upgrades on the existing line. A contract extension has been signed through March 2018, so the issue will quickly need to be addressed, one way or another. Phase I of the increase will be effective January 1, 2017, and will increase residential fees $1 per month and other customer classes a correspondingly percentage increase. Phase I will raise about $65,000 per year, with continually annual increases through 2020. We have also made small modifications to the Electric Industrial rates for 2017. We will continue to work with a development group in an attempt to add transmission capacity to the community with minimal investment and risk. The process will continue. The one major financial stress area in the utilities is the Water Fund. Although we have annual rate increases approved through 2020, record rainfalls through the previous decade has really stagnated revenues. Once again, the water fund will likely operate in a deficit condition. People don't resist change. They resist being changed. Peter Senge We have attempted to be good stewards with the city's debt structure. We have maintained our A+/Stable bond rating with Standard and Poors. We will issue temporary notes in December 2016 for 14th Avenue Bridge engineering and 2017 KLINK project, plus assistance for William Newton Hospital that the organization will be responsible for repayment. We will look to issue debt in 2017 for the bridge project and potential development projects. One key to successful leadership is personal change. Personal change is a reflection of our inner growth and empowerment. Robert E. Quinn As always, nothing could be accomplished without a talented and loyal group of employees. They continue to be our greatest asset. We are responsible for the safety and wellbeing for over 18,000 persons per day that purchase our utilities and rely on us for public safety protection and response. It doesn't matter if it is the hottest day of the year or Christmas Day, when the public needs our service, we will have someone respond. It has been a pleasure and an honor to work with a great and loyal group of City of Winfield employees. I hope that I haven't disappointed them.

c
For 2017, we are proposing a 1% increase in the overall wage scale. We have also funded an additional step increase to "J" for those employees that are at the end of the scale, effective with the first payroll in September 2017, and subject to a favorable evaluation. We have also funded an 8% increase in health care contribution, but we received great news with an 18 month renewal increase of only 3.8%. This allows us to "reserve" the budgeted difference for buffering of future increases or changing the delivery method. We will see a decrease in the city share of mandatory contributions for KPERS and KPF, plus hopefully continued success with our excellent safety record and low workers compensation rates. We tend to forget that happiness doesn't come as a result of getting something we don't have but rather of recognizing and appreciating what we do have. Frederich Keoning It is with much confliction that I prepare my final budget message for the City of Winfield. I am so grateful for everyone that has made the past twenty years so enjoyable. Thank you everyone, I have been blessed. Only the wisest and stupidest of men never change. Confucius On behalf of the region, the community, and our organization, I want to thank you, the elected officials for your dedicated service to the citizens and visitors of Winfield and the consumers of our services. You continue to put the best interest of the community ahead of personal gain to make Winfield a better place. It is a pleasure to serve a great and dedicated governing body. Respectfully,
Warren Porter City Manager
2017 Budget City of Winfield Page 1 ~~~~~~~~~~~~~~~~~~~~~~~~~~~~~~~~~~~~~~~~~~~~~~~~~~~~~~~~~~~~~~~~~~~~~~~~~~~~~~~
~~~~~~~~~~~~~~~~~~~~~~~~~~~~~~~~~~~~~~~~~~~~~~~~~~~~~~~~~~~~~~~~~~~~~~~~~~~~~~~

Page 2 City of Winfield 2017 Budget ~~~~~~~~~~~~~~~~~~~~~~~~~~~~~~~~~~~~~~~~~~~~~~~~~~~~~~~~~~~~~~~~~~~~~~~~~~~~~~~
~~~~~~~~~~~~~~~~~~~~~~~~~~~~~~~~~~~~~~~~~~~~~~~~~~~~~~~~~~~~~~~~~~~~~~~~~~~~~~~
City of Winfield Organization
3 City Commissioners
City Planning CommissionBoard of Zoning Appeals
Parking Advisory CommitteeSenior Citizens Advisory Committee
Human Relations CommissionWinfield Housing Authority
Transportation Advisory Board
Hospital BoardLibrary BoardPark Board
Convention & Tourism CommitteeBuilding Trades BoardAccess Advisory Board
City Manager
Citizens
City Clerk/Director of FinanceAssistant to City Manager
Director of Public Works/Engineering
Director of Gas & Wastewater UtilitiesDirector of Electric & Water Utlities
Police Chief Fire Chief
Director of Parks and Public Land Director of Community Development
Director of Human Resources

2017 Budget City of Winfield Page 3 ~~~~~~~~~~~~~~~~~~~~~~~~~~~~~~~~~~~~~~~~~~~~~~~~~~~~~~~~~~~~~~~~~~~~~~~~~~~~~~~
~~~~~~~~~~~~~~~~~~~~~~~~~~~~~~~~~~~~~~~~~~~~~~~~~~~~~~~~~~~~~~~~~~~~~~~~~~~~~~~
The City of Winfield Budget Process
May-June 2016
City Manager and budget review committee meet with
Department Heads to review budget requests
March 2016 Budget worksheets
distributed to Department Heads
April 2016 Department Heads submit initial budget requests for 2017
June 2016 Revenues and Expenses
are combined and reviewed by budget committee
June 2016 Follow-up meetings with
Department Heads to review final proposed
budget
July 2016 Proposed Budget presented to City
Commission
August 2016 Public Hearing and Adoption of 2017
Budget
July 2016 Final Budget published in
local newspaper at least 10 days prior to public hearing
August 2016 Adopted Budget filed with County Clerk and
State
March 2017 Begin work on 2018 Budget
December 2016 2017 Budget document
is distributed
January 2017 Budget goes into
effect
November 2016 2016 Budget reviewed
for potential amendments
Page 4 City of Winfield 2017 Budget ~~~~~~~~~~~~~~~~~~~~~~~~~~~~~~~~~~~~~~~~~~~~~~~~~~~~~~~~~~~~~~~~~~~~~~~~~~~~~~~
~~~~~~~~~~~~~~~~~~~~~~~~~~~~~~~~~~~~~~~~~~~~~~~~~~~~~~~~~~~~~~~~~~~~~~~~~~~~~~~
58.0 60.0 62.0 64.0 66.0 68.0 70.0 72.0
2016
2015
2014
2013
2012
2011
2010
2009
2008
2007
2006
Millions
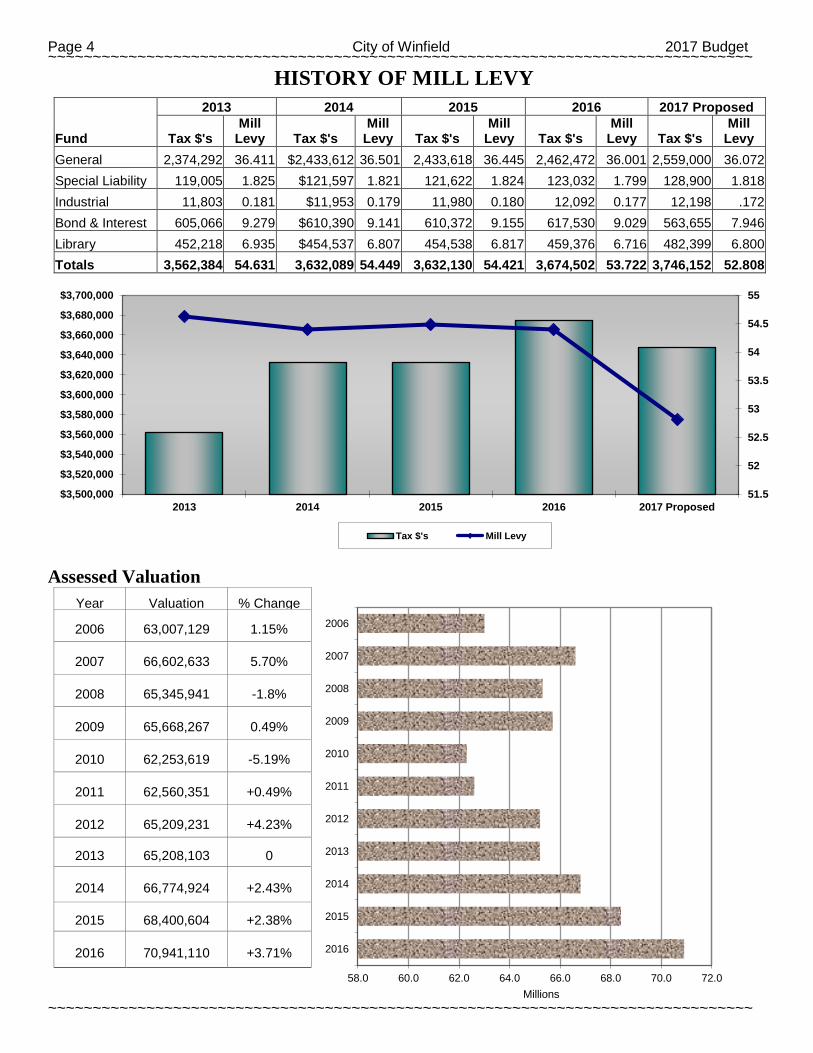
HISTORY OF MILL LEVY
Fund
2013 2014 2015 2016 2017 Proposed
Tax $'s Mill
Levy Tax $'s Mill
Levy Tax $'s Mill
Levy Tax $'s Mill
Levy Tax $'s Mill
Levy General 2,374,292 36.411 $2,433,612 36.501 2,433,618 36.445 2,462,472 36.001 2,559,000 36.072 Special Liability 119,005 1.825 $121,597 1.821 121,622 1.824 123,032 1.799 128,900 1.818 Industrial 11,803 0.181 $11,953 0.179 11,980 0.180 12,092 0.177 12,198 .172 Bond & Interest 605,066 9.279 $610,390 9.141 610,372 9.155 617,530 9.029 563,655 7.946 Library 452,218 6.935 $454,537 6.807 454,538 6.817 459,376 6.716 482,399 6.800 Totals 3,562,384 54.631 3,632,089 54.449 3,632,130 54.421 3,674,502 53.722 3,746,152 52.808
Assessed Valuation
51.5
52
52.5
53
53.5
54
54.5
55
$3,500,000
$3,520,000
$3,540,000
$3,560,000
$3,580,000
$3,600,000
$3,620,000
$3,640,000
$3,660,000
$3,680,000
$3,700,000
2013 2014 2015 2016 2017 Proposed
Tax $'s Mill Levy
Year Valuation % Change
2006 63,007,129 1.15%
2007 66,602,633 5.70%
2008 65,345,941 -1.8%
2009 65,668,267 0.49%
2010 62,253,619 -5.19%
2011 62,560,351 +0.49%
2012 65,209,231 +4.23%
2013 65,208,103 0
2014 66,774,924 +2.43%
2015 68,400,604 +2.38%
2016 70,941,110 +3.71%
2017 Budget City of Winfield Page 5 ~~~~~~~~~~~~~~~~~~~~~~~~~~~~~~~~~~~~~~~~~~~~~~~~~~~~~~~~~~~~~~~~~~~~~~~~~~~~~~~
~~~~~~~~~~~~~~~~~~~~~~~~~~~~~~~~~~~~~~~~~~~~~~~~~~~~~~~~~~~~~~~~~~~~~~~~~~~~~~~
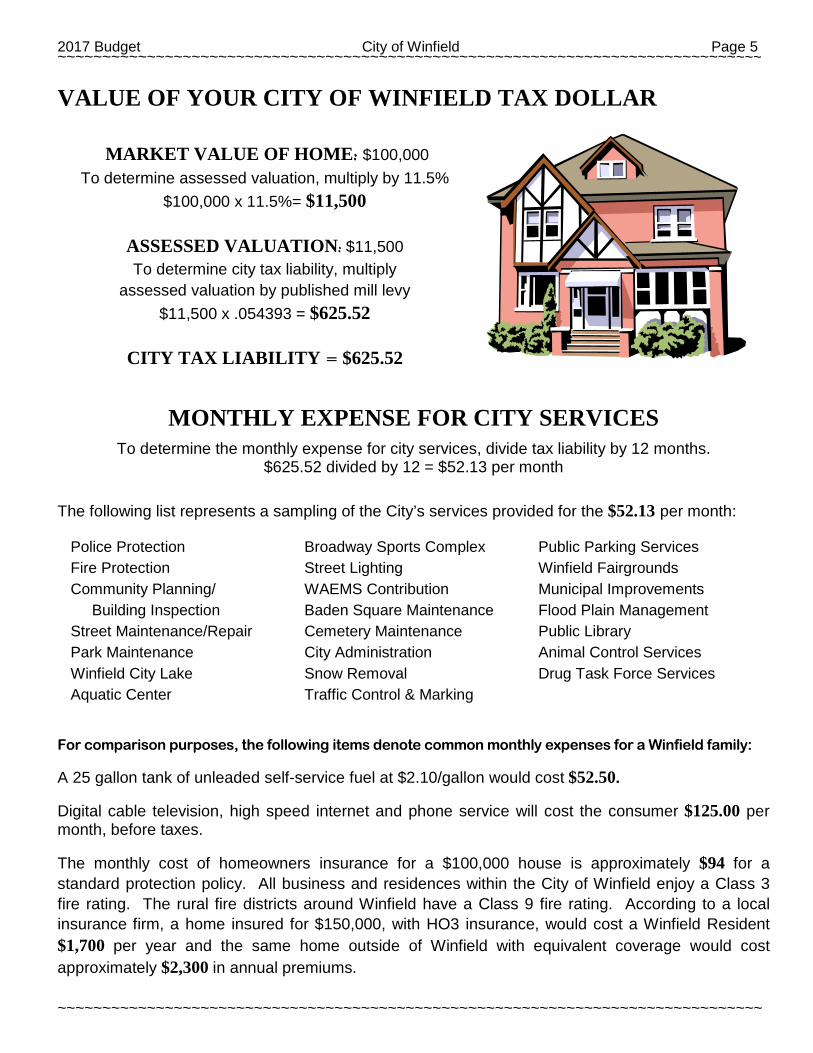
VALUE OF YOUR CITY OF WINFIELD TAX DOLLAR
MARKET VALUE OF HOME: $100,000
To determine assessed valuation, multiply by 11.5% $100,000 x 11.5%= $11,500
ASSESSED VALUATION: $11,500 To determine city tax liability, multiply
assessed valuation by published mill levy $11,500 x .054393 = $625.52
CITY TAX LIABILITY = $625.52
MONTHLY EXPENSE FOR CITY SERVICES
To determine the monthly expense for city services, divide tax liability by 12 months. $625.52 divided by 12 = $52.13 per month
The following list represents a sampling of the City’s services provided for the $52.13 per month:
Police Protection Fire Protection Community Planning/ Building Inspection Street Maintenance/Repair Park Maintenance Winfield City Lake Aquatic Center
Broadway Sports Complex Street Lighting WAEMS Contribution Baden Square Maintenance Cemetery Maintenance City Administration Snow Removal Traffic Control & Marking
Public Parking Services Winfield Fairgrounds Municipal Improvements Flood Plain Management Public Library Animal Control Services Drug Task Force Services
For comparison purposes, the following items denote common monthly expenses for a Winfield family: A 25 gallon tank of unleaded self-service fuel at $2.10/gallon would cost $52.50. Digital cable television, high speed internet and phone service will cost the consumer $125.00 per month, before taxes. The monthly cost of homeowners insurance for a $100,000 house is approximately $94 for a standard protection policy. All business and residences within the City of Winfield enjoy a Class 3 fire rating. The rural fire districts around Winfield have a Class 9 fire rating. According to a local insurance firm, a home insured for $150,000, with HO3 insurance, would cost a Winfield Resident $1,700 per year and the same home outside of Winfield with equivalent coverage would cost approximately $2,300 in annual premiums.
Page 6 City of Winfield 2017 Budget ~~~~~~~~~~~~~~~~~~~~~~~~~~~~~~~~~~~~~~~~~~~~~~~~~~~~~~~~~~~~~~~~~~~~~~~~~~~~~~~
~~~~~~~~~~~~~~~~~~~~~~~~~~~~~~~~~~~~~~~~~~~~~~~~~~~~~~~~~~~~~~~~~~~~~~~~~~~~~~~
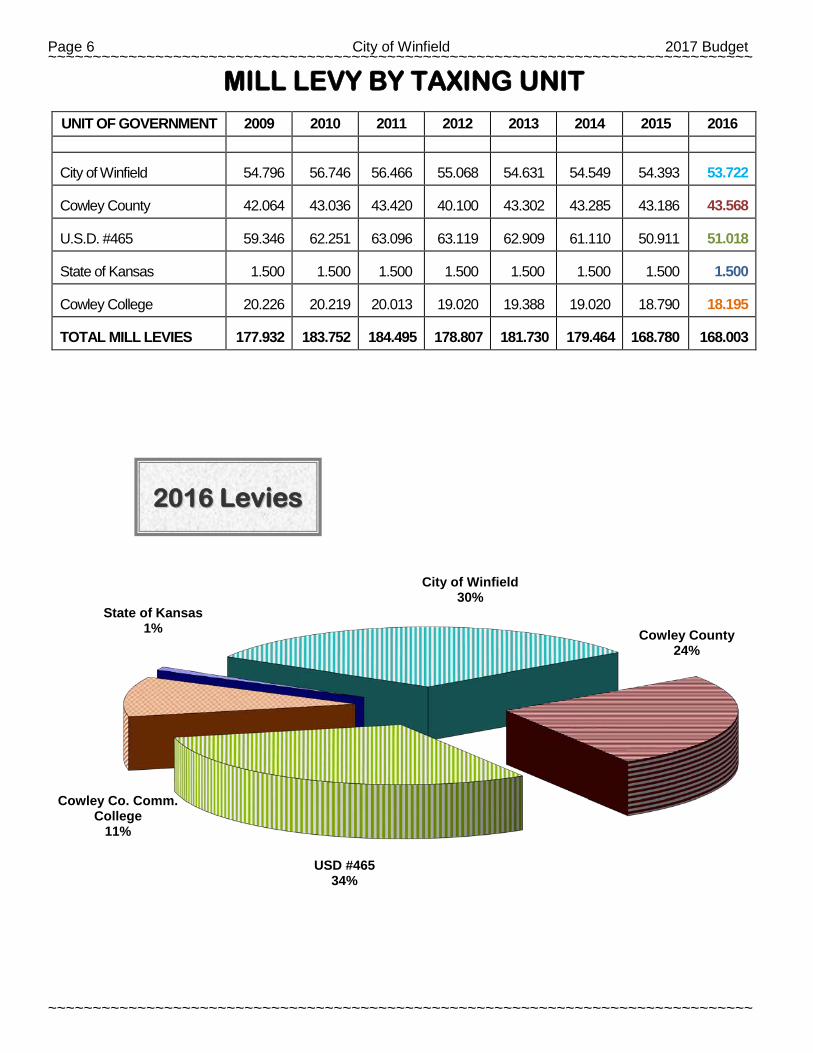
MILL LEVY BY TAXING UNIT
UNIT OF GOVERNMENT 2009 2010 2011 2012 2013 2014 2015 2016
City of Winfield 54.796 56.746 56.466 55.068 54.631 54.549 54.393 53.722
Cowley County 42.064 43.036 43.420 40.100 43.302 43.285 43.186 43.568
U.S.D. #465 59.346 62.251 63.096 63.119 62.909 61.110 50.911 51.018
State of Kansas 1.500 1.500 1.500 1.500 1.500 1.500 1.500 1.500
Cowley College 20.226 20.219 20.013 19.020 19.388 19.020 18.790 18.195
TOTAL MILL LEVIES 177.932 183.752 184.495 178.807 181.730 179.464 168.780 168.003
City of Winfield 30%
Cowley County 24%
USD #465 34%
Cowley Co. Comm. College
11%
State of Kansas 1%
22001166 LLeevviieess
2017 Budget City of Winfield Page 7 ~~~~~~~~~~~~~~~~~~~~~~~~~~~~~~~~~~~~~~~~~~~~~~~~~~~~~~~~~~~~~~~~~~~~~~~~~~~~~~~
~~~~~~~~~~~~~~~~~~~~~~~~~~~~~~~~~~~~~~~~~~~~~~~~~~~~~~~~~~~~~~~~~~~~~~~~~~~~~~~
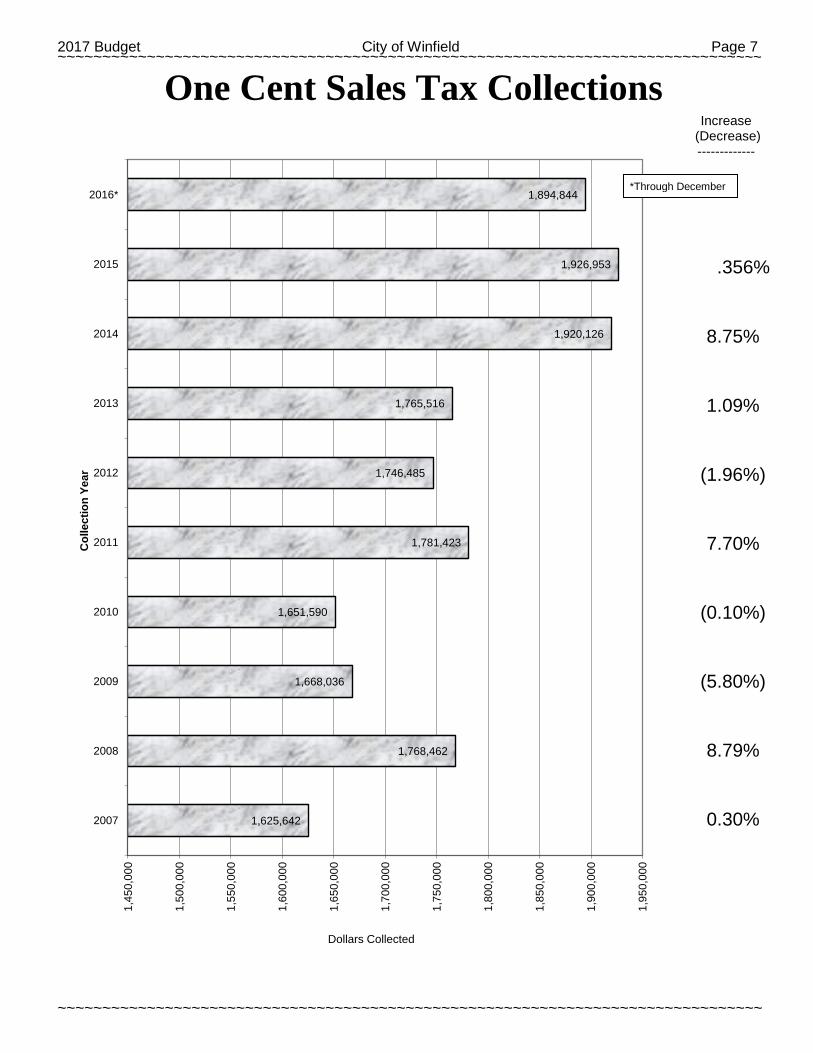
One Cent Sales Tax Collections Increase
(Decrease) -------------
.356%
8.75%
1.09%
(1.96%)
7.70%
(0.10%)
(5.80%)
8.79%
0.30%
1,625,642
1,768,462
1,668,036
1,651,590
1,781,423
1,746,485
1,765,516
1,920,126
1,926,953
1,894,844
1,45
0,00
0
1,50
0,00
0
1,55
0,00
0
1,60
0,00
0
1,65
0,00
0
1,70
0,00
0
1,75
0,00
0
1,80
0,00
0
1,85
0,00
0
1,90
0,00
0
1,95
0,00
0
2007
2008
2009
2010
2011
2012
2013
2014
2015
2016*
Dollars Collected
Col
lect
ion
Year
*Through December

Page 8 City of Winfield 2017 Budget ~~~~~~~~~~~~~~~~~~~~~~~~~~~~~~~~~~~~~~~~~~~~~~~~~~~~~~~~~~~~~~~~~~~~~~~~~~~~~~~
~~~~~~~~~~~~~~~~~~~~~~~~~~~~~~~~~~~~~~~~~~~~~~~~~~~~~~~~~~~~~~~~~~~~~~~~~~~~~~~
Employee Benefits The City of Winfield provides several benefit programs to all city employees. State and Federal legislation require FICA, KPERS or KP&F and FUTA benefits be offered by the employer and is based on the employee’s wage. The balance of the benefits offered by the City of Winfield is by choice of the City Commission. The following is a brief synopsis of the current benefit package offered to City employees. FICA (Social Security) - Through the federal old age, survivors, disability and health insurance program, benefits are paid when family income is lost as a result of the employee’s disability, retirement, or death.
The current program is contributory with both the employee and employer contributing to the support and maintenance of the program.
The City’s FICA (Social Security) comparative data for City contributions is as follows:
2009 2010 2011 2012 2013 2014 2015 2016 2017 7.65% 7.65% 7.65% 7.65% 7.65% 7.65% 7.65% 7.65% 7.65%
Kansas Public Employee Retirement System - KPERS is an umbrella organization that administers several public employee retirement programs. Membership is mandatory for all full-time City employees who are in covered positions regardless of their ages. Certain positions in the City are covered under a subsidiary system. The KPERS system like FICA provides retirement benefits and disability income as well as life insurance. KPERS is also a contributory system with the employee contributing 4% of his or her annual gross salary and the City’s share is established by the KPERS Board of Directors on a yearly basis. The following is a synopsis of the City’s contribution rates:
2009 2010 2011 2012 2013 2014 2015 2016 2017 6.54% 7.14% 7.74% 8.34% 8.94% 9.69% 10.33% 10.18% 8.46%
Kansas Police and Fireman’s Retirement System - KP&F is a subsidiary program of the KPERS system designed for Police and Firefighters. The program covers our commissioned police officers and firefighters. Each member of the KP&F system contributes 7%, 4% or .94% of gross annual wages depending on which KP&F plan the employee is on. The City provides a contribution that is established by the retirement system board. The following reflects the current and comparative KP&F rates:
2009 2010 2011 2012 2013 2014 2015 2016 2017 17.33% 16.70% 18.10% 20.15% 20.76% 23.69% 25.13% 23.95% 21.84%
SUTA (Unemployment Insurance) - SUTA is one of the federally mandated programs that helps to provide relief to unemployed persons. Since the program is based on employer experience, the City has some control over the rate that it is required to pay. The City has pursued an aggressive policy of reviewing and taking appropriate action on each unemployment claim filed against the City, which has aided in minimizing increases in the City’s rate. Comparative rate data is as follows:
2009 2010 2011 2012 2013 2014 2015 2016 2017 0.10% 0.18% 0.10% 0.13% 0.23% 0.10% 0.39% 0.10% .10%
Health and Dental Care – Rising health care costs continue to be a concern. In 1994 it was determined that employees who selected a family plan would have to contribute towards the cost of health care. In 2003 employees selecting a single plan began contributing $10 per month towards the cost of health care.
2010 2011 2012 2013 2014 2015 2016 2017 City share of family plan 771.47 812.95 761.47 805.33 873.25 1086.38 1131.56 1173.77
Employee share of family plan 106.00 106.00 106.00 106.00 106.00 120.00 140.00 140.00
Total cost of a family plan 877.47 918.95 867.47 911.33 979.25 1206.38 1271.56 1313.77
2017 Budget City of Winfield Page 9 ~~~~~~~~~~~~~~~~~~~~~~~~~~~~~~~~~~~~~~~~~~~~~~~~~~~~~~~~~~~~~~~~~~~~~~~~~~~~~~~
~~~~~~~~~~~~~~~~~~~~~~~~~~~~~~~~~~~~~~~~~~~~~~~~~~~~~~~~~~~~~~~~~~~~~~~~~~~~~~~
Employee Benefits Workers' Compensation - The City pays a premium to the Kansas Eastern Regional Insurance Trust (KERIT) to provide medical and salary assistance coverage for work related accidents. As a member of the KERIT pool of cities and counties, the City has a representative on the KERIT Board of Trustees.
Health Flex Plan - City employees have the option to participate in the City sponsored health flex plan. The plan allows employees to pay for medical expenses, health insurance costs, and certain dependent care expenses on a pretax basis. The tax savings include federal income, state income, and social security taxes.
Computer/Electronics Purchase Program - Allows employees to purchase computers and other electronic devices through approved vendors. Through 26 payroll deductions, employees can purchase computers, software and other electronic devices for their personal home use.
Employee Tuition Reimbursement Program - The City's employee tuition reimbursement program will reimburse full-time employees for 50% of the cost of certain tuition/training, up to $1,250 per budget year. The courses or training must be relevant to the employee's current position, another position or a requirement of a degree completion program. To be eligible for reimbursement, the course must be completed, and the employee must receive at least a 'C' grade or a 'pass' for a pass/fail program.
Firearms Purchase Program - The Firearms Purchase program allows conceal carry permit holding employees to purchase firearms from local vendors and pay the balance through 26 payroll deductions.
Fitness Membership Program - Allows City employees to purchase local Fitness Center memberships from approved vendors and have the fees deducted through 4 payroll deductions.
Golf Course Membership Program - Allows City employees to purchase memberships to the public golf course and have the fees deducted through 26 payroll deductions.
Page 10 City of Winfield 2017 Budget ~~~~~~~~~~~~~~~~~~~~~~~~~~~~~~~~~~~~~~~~~~~~~~~~~~~~~~~~~~~~~~~~~~~~~~~~~~~~~~~
~~~~~~~~~~~~~~~~~~~~~~~~~~~~~~~~~~~~~~~~~~~~~~~~~~~~~~~~~~~~~~~~~~~~~~~~~~~~~~~
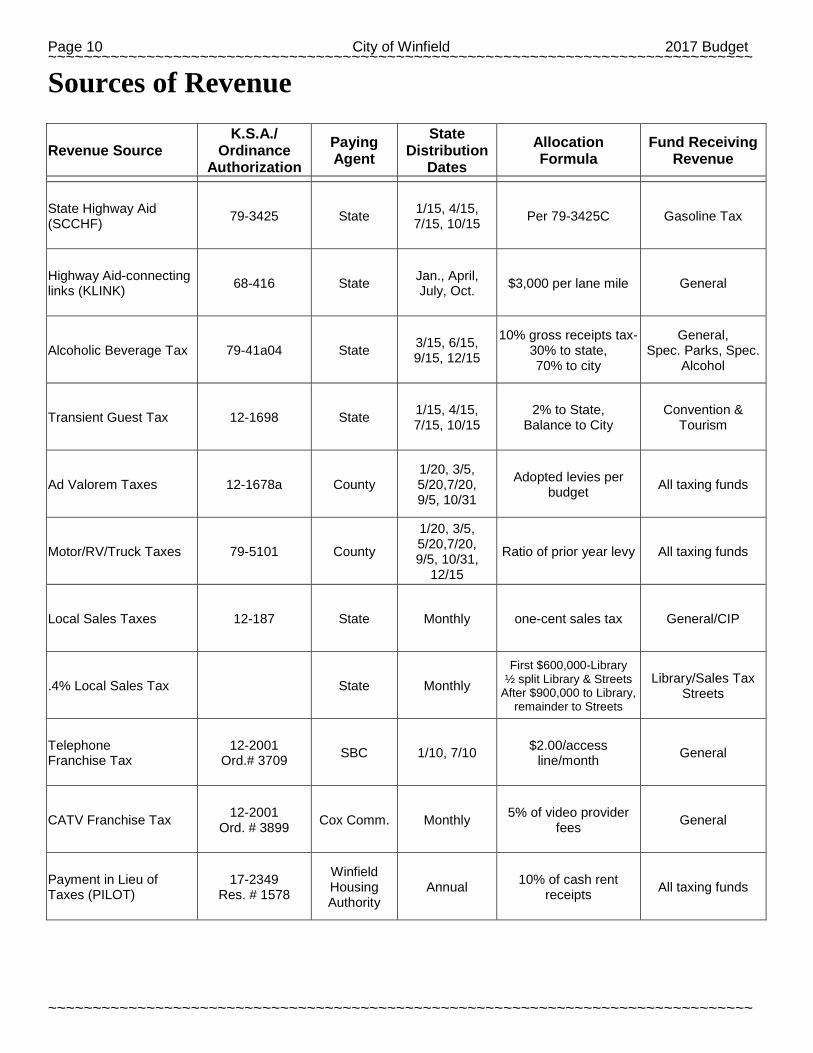
Sources of Revenue
Revenue Source K.S.A./
Ordinance Authorization
Paying Agent
State Distribution
Dates Allocation Formula
Fund Receiving Revenue
State Highway Aid (SCCHF) 79-3425 State 1/15, 4/15,
7/15, 10/15 Per 79-3425C Gasoline Tax
Highway Aid-connecting links (KLINK) 68-416 State Jan., April,
July, Oct. $3,000 per lane mile General
Alcoholic Beverage Tax 79-41a04 State 3/15, 6/15, 9/15, 12/15
10% gross receipts tax- 30% to state, 70% to city
General, Spec. Parks, Spec.
Alcohol
Transient Guest Tax 12-1698 State 1/15, 4/15, 7/15, 10/15
2% to State, Balance to City
Convention & Tourism
Ad Valorem Taxes 12-1678a County 1/20, 3/5, 5/20,7/20, 9/5, 10/31
Adopted levies per budget All taxing funds
Motor/RV/Truck Taxes 79-5101 County
1/20, 3/5, 5/20,7/20, 9/5, 10/31,
12/15
Ratio of prior year levy All taxing funds
Local Sales Taxes 12-187 State Monthly one-cent sales tax General/CIP
.4% Local Sales Tax State Monthly First $600,000-Library
½ split Library & Streets After $900,000 to Library,
remainder to Streets
Library/Sales Tax Streets
Telephone Franchise Tax
12-2001 Ord.# 3709 SBC 1/10, 7/10 $2.00/access
line/month General
CATV Franchise Tax 12-2001 Ord. # 3899 Cox Comm. Monthly 5% of video provider
fees General
Payment in Lieu of Taxes (PILOT)
17-2349 Res. # 1578
Winfield Housing Authority
Annual 10% of cash rent receipts All taxing funds
2017 Budget City of Winfield Page 11 ~~~~~~~~~~~~~~~~~~~~~~~~~~~~~~~~~~~~~~~~~~~~~~~~~~~~~~~~~~~~~~~~~~~~~~~~~~~~~~~
~~~~~~~~~~~~~~~~~~~~~~~~~~~~~~~~~~~~~~~~~~~~~~~~~~~~~~~~~~~~~~~~~~~~~~~~~~~~~~~
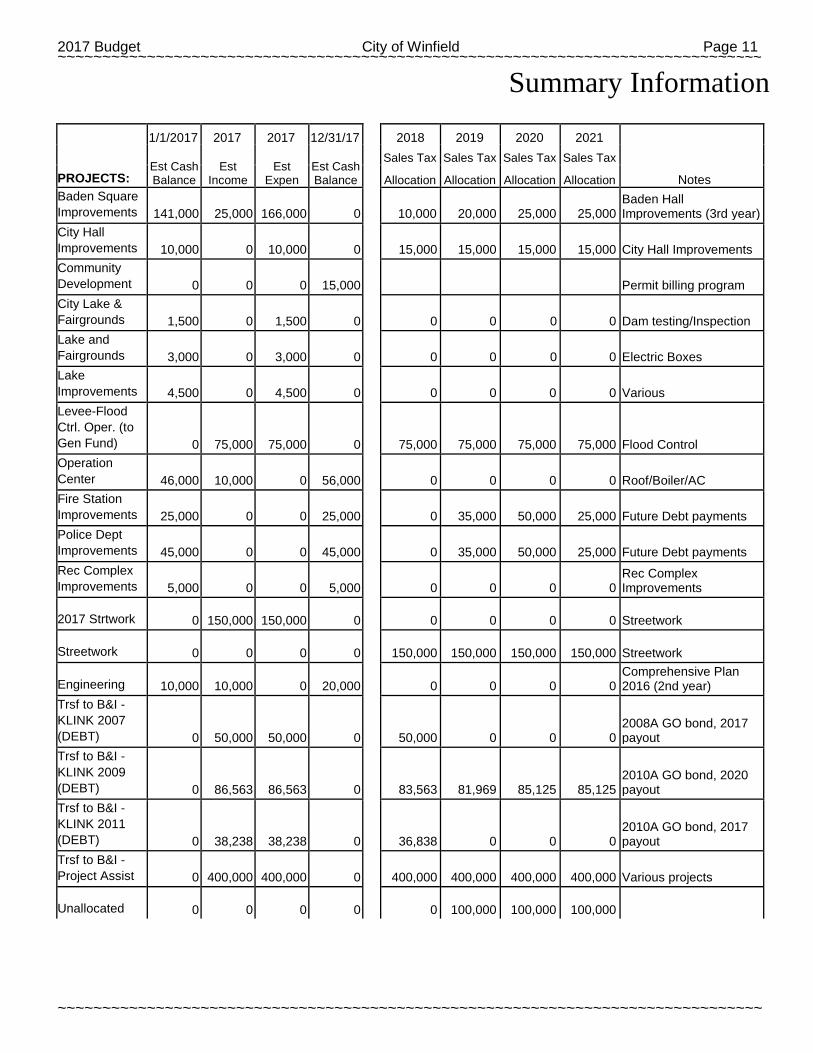
Summary Information
1/1/2017 2017 2017 12/31/17
2018 2019 2020 2021
PROJECTS: Est Cash Balance
Est Income
Est Expen
Est Cash Balance
Sales Tax Sales Tax Sales Tax Sales Tax
Notes Allocation Allocation Allocation Allocation Baden Square Improvements 141,000 25,000 166,000 0 10,000 20,000 25,000 25,000
Baden Hall Improvements (3rd year)
City Hall Improvements 10,000 0 10,000 0
15,000 15,000 15,000 15,000 City Hall Improvements
Community Development 0 0 0 15,000
Permit billing program
City Lake & Fairgrounds 1,500 0 1,500 0
0 0 0 0 Dam testing/Inspection
Lake and Fairgrounds 3,000 0 3,000 0
0 0 0 0 Electric Boxes
Lake Improvements 4,500 0 4,500 0
0 0 0 0 Various
Levee-Flood Ctrl. Oper. (to Gen Fund) 0 75,000 75,000 0
75,000 75,000 75,000 75,000 Flood Control
Operation Center 46,000 10,000 0 56,000
0 0 0 0 Roof/Boiler/AC
Fire Station Improvements 25,000 0 0 25,000
0 35,000 50,000 25,000 Future Debt payments
Police Dept Improvements 45,000 0 0 45,000
0 35,000 50,000 25,000 Future Debt payments
Rec Complex Improvements 5,000 0 0 5,000
0 0 0 0
Rec Complex Improvements
2017 Strtwork 0 150,000 150,000 0
0 0 0 0 Streetwork
Streetwork 0 0 0 0
150,000 150,000 150,000 150,000 Streetwork
Engineering 10,000 10,000 0 20,000
0 0 0 0 Comprehensive Plan 2016 (2nd year)
Trsf to B&I -KLINK 2007 (DEBT) 0 50,000 50,000 0
50,000 0 0 0
2008A GO bond, 2017 payout
Trsf to B&I - KLINK 2009 (DEBT) 0 86,563 86,563 0
83,563 81,969 85,125 85,125
2010A GO bond, 2020 payout
Trsf to B&I - KLINK 2011 (DEBT) 0 38,238 38,238 0
36,838 0 0 0
2010A GO bond, 2017 payout
Trsf to B&I - Project Assist 0 400,000 400,000 0
400,000 400,000 400,000 400,000 Various projects
Unallocated 0 0 0 0
0 100,000 100,000 100,000
Page 12 City of Winfield 2017 Budget ~~~~~~~~~~~~~~~~~~~~~~~~~~~~~~~~~~~~~~~~~~~~~~~~~~~~~~~~~~~~~~~~~~~~~~~~~~~~~~~
~~~~~~~~~~~~~~~~~~~~~~~~~~~~~~~~~~~~~~~~~~~~~~~~~~~~~~~~~~~~~~~~~~~~~~~~~~~~~~~
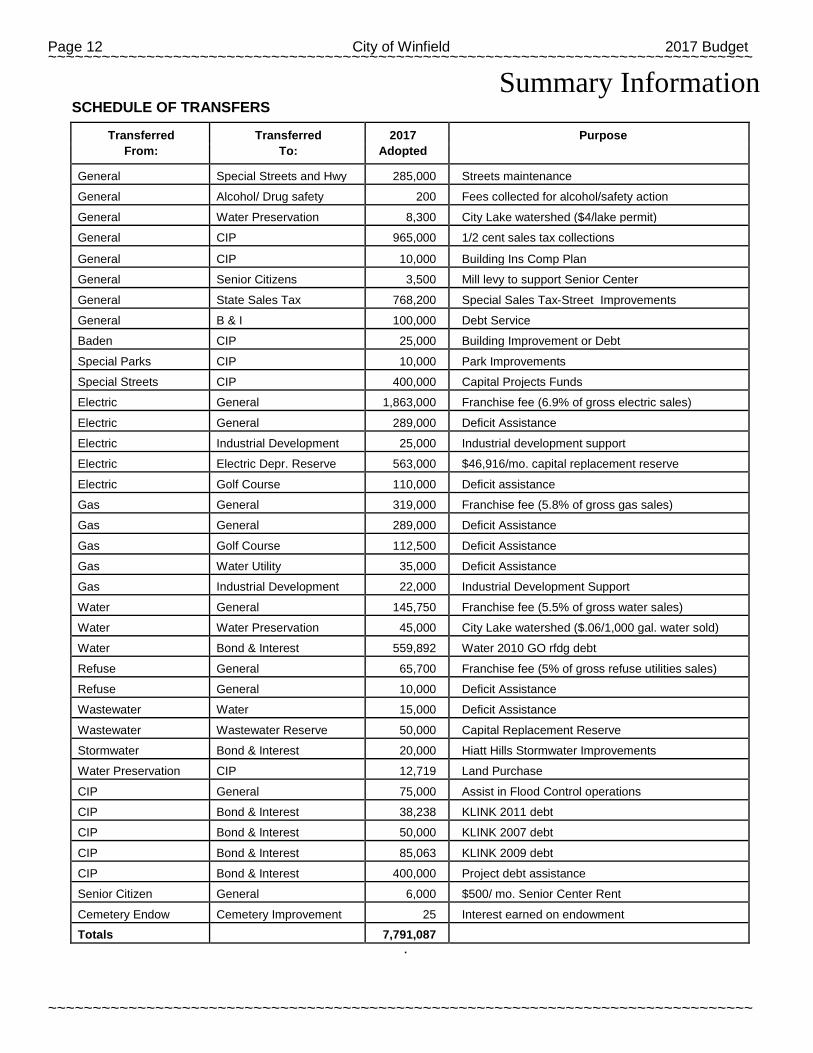
Summary Information SCHEDULE OF TRANSFERS
Transferred Transferred 2017 Purpose From: To: Adopted
General Special Streets and Hwy 285,000 Streets maintenance
General Alcohol/ Drug safety 200 Fees collected for alcohol/safety action
General Water Preservation 8,300 City Lake watershed ($4/lake permit)
General CIP 965,000 1/2 cent sales tax collections
General CIP 10,000 Building Ins Comp Plan
General Senior Citizens 3,500 Mill levy to support Senior Center
General State Sales Tax 768,200 Special Sales Tax-Street Improvements
General B & I 100,000 Debt Service
Baden CIP 25,000 Building Improvement or Debt
Special Parks CIP 10,000 Park Improvements
Special Streets CIP 400,000 Capital Projects Funds
Electric General 1,863,000 Franchise fee (6.9% of gross electric sales)
Electric General 289,000 Deficit Assistance
Electric Industrial Development 25,000 Industrial development support
Electric Electric Depr. Reserve 563,000 $46,916/mo. capital replacement reserve
Electric Golf Course 110,000 Deficit assistance
Gas General 319,000 Franchise fee (5.8% of gross gas sales)
Gas General 289,000 Deficit Assistance
Gas Golf Course 112,500 Deficit Assistance
Gas Water Utility 35,000 Deficit Assistance
Gas Industrial Development 22,000 Industrial Development Support
Water General 145,750 Franchise fee (5.5% of gross water sales)
Water Water Preservation 45,000 City Lake watershed ($.06/1,000 gal. water sold)
Water Bond & Interest 559,892 Water 2010 GO rfdg debt
Refuse General 65,700 Franchise fee (5% of gross refuse utilities sales)
Refuse General 10,000 Deficit Assistance
Wastewater Water 15,000 Deficit Assistance
Wastewater Wastewater Reserve 50,000 Capital Replacement Reserve
Stormwater Bond & Interest 20,000 Hiatt Hills Stormwater Improvements
Water Preservation CIP 12,719 Land Purchase
CIP General 75,000 Assist in Flood Control operations
CIP Bond & Interest 38,238 KLINK 2011 debt
CIP Bond & Interest 50,000 KLINK 2007 debt
CIP Bond & Interest 85,063 KLINK 2009 debt
CIP Bond & Interest 400,000 Project debt assistance
Senior Citizen General 6,000 $500/ mo. Senior Center Rent
Cemetery Endow Cemetery Improvement 25 Interest earned on endowment
Totals 7,791,087 .
2017 Budget City of Winfield Page 13 ~~~~~~~~~~~~~~~~~~~~~~~~~~~~~~~~~~~~~~~~~~~~~~~~~~~~~~~~~~~~~~~~~~~~~~~~~~~~~~~
~~~~~~~~~~~~~~~~~~~~~~~~~~~~~~~~~~~~~~~~~~~~~~~~~~~~~~~~~~~~~~~~~~~~~~~~~~~~~~~
Summary Information
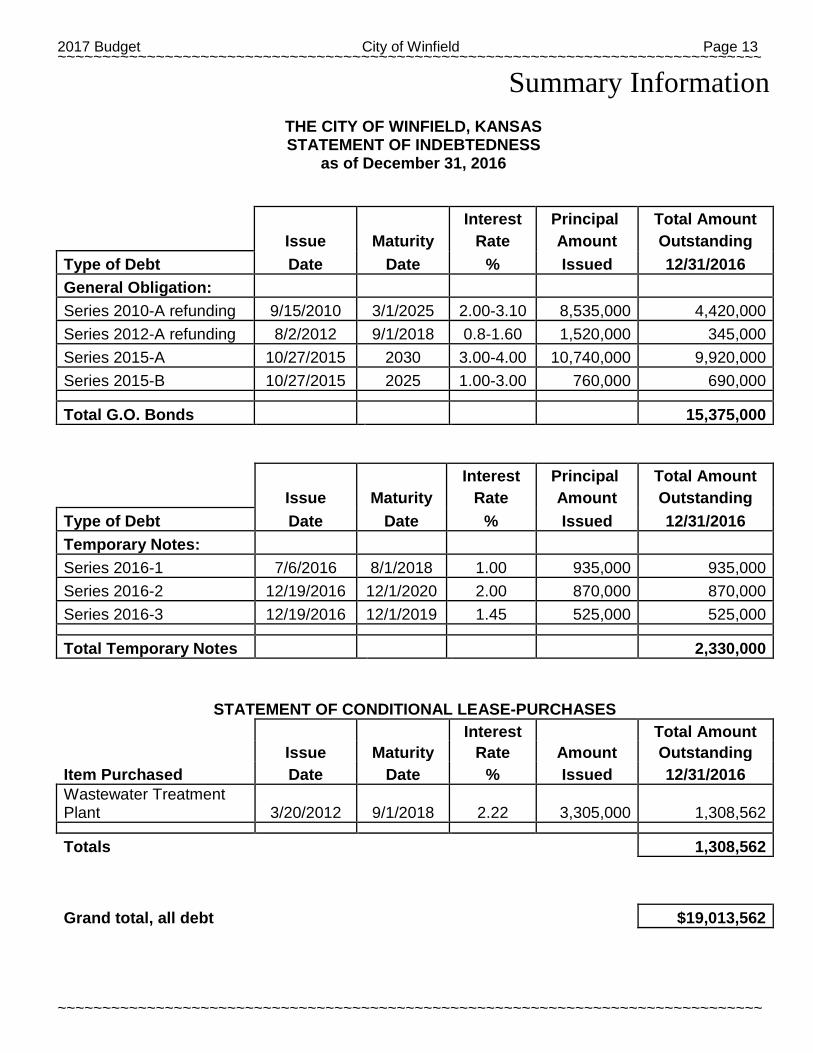
THE CITY OF WINFIELD, KANSAS STATEMENT OF INDEBTEDNESS
as of December 31, 2016
Interest Principal Total Amount
Issue Maturity Rate Amount Outstanding
Type of Debt Date Date % Issued 12/31/2016 General Obligation: Series 2010-A refunding 9/15/2010 3/1/2025 2.00-3.10 8,535,000 4,420,000 Series 2012-A refunding 8/2/2012 9/1/2018 0.8-1.60 1,520,000 345,000 Series 2015-A 10/27/2015 2030 3.00-4.00 10,740,000 9,920,000 Series 2015-B 10/27/2015 2025 1.00-3.00 760,000 690,000
Total G.O. Bonds 15,375,000
Interest Principal Total Amount
Issue Maturity Rate Amount Outstanding
Type of Debt Date Date % Issued 12/31/2016 Temporary Notes: Series 2016-1 7/6/2016 8/1/2018 1.00 935,000 935,000 Series 2016-2 12/19/2016 12/1/2020 2.00 870,000 870,000 Series 2016-3 12/19/2016 12/1/2019 1.45 525,000 525,000
Total Temporary Notes 2,330,000
STATEMENT OF CONDITIONAL LEASE-PURCHASES
Interest Total Amount
Issue Maturity Rate Amount Outstanding
Item Purchased Date Date % Issued 12/31/2016 Wastewater Treatment Plant 3/20/2012 9/1/2018 2.22 3,305,000 1,308,562
Totals
1,308,562
Grand total, all debt
$19,013,562
Page 14 City of Winfield 2017 Budget ~~~~~~~~~~~~~~~~~~~~~~~~~~~~~~~~~~~~~~~~~~~~~~~~~~~~~~~~~~~~~~~~~~~~~~~~~~~~~~~
~~~~~~~~~~~~~~~~~~~~~~~~~~~~~~~~~~~~~~~~~~~~~~~~~~~~~~~~~~~~~~~~~~~~~~~~~~~~~~~
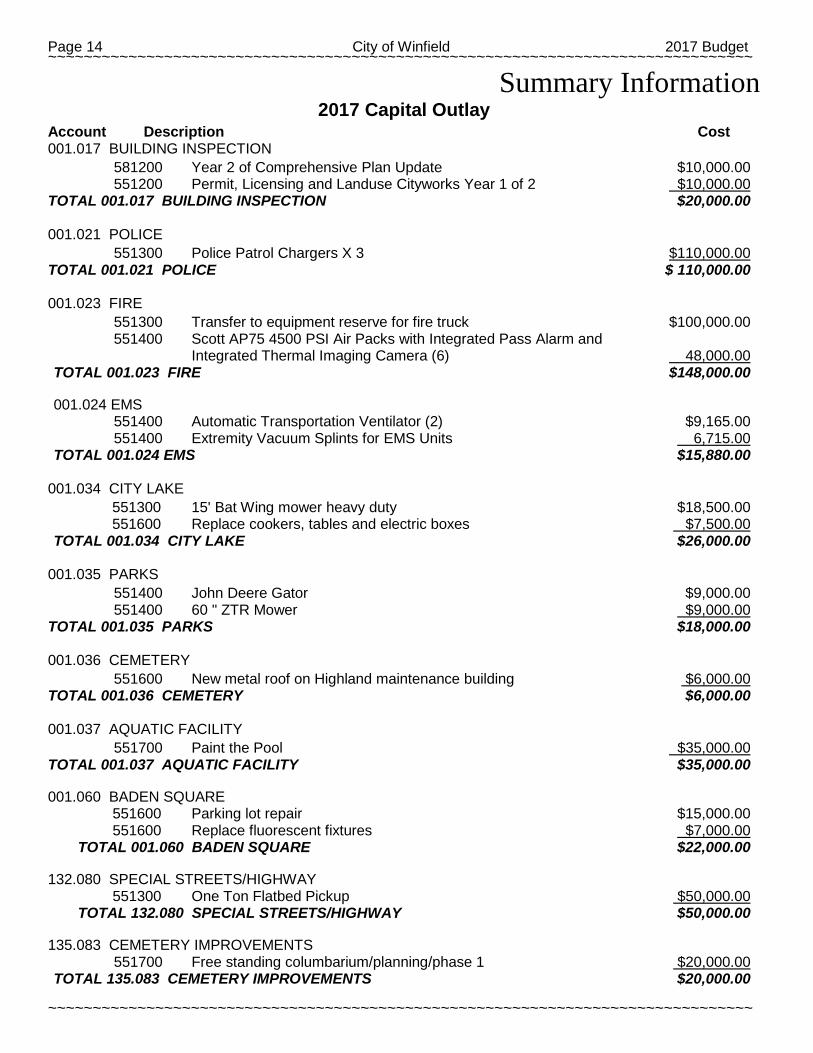
Summary Information 2017 Capital Outlay
Account Description Cost 001.017 BUILDING INSPECTION 581200 Year 2 of Comprehensive Plan Update $10,000.00 551200 Permit, Licensing and Landuse Cityworks Year 1 of 2 $10,000.00
TOTAL 001.017 BUILDING INSPECTION $20,000.00 001.021 POLICE 551300 Police Patrol Chargers X 3 $110,000.00
TOTAL 001.021 POLICE $ 110,000.00 001.023 FIRE 551300 Transfer to equipment reserve for fire truck $100,000.00 551400 Scott AP75 4500 PSI Air Packs with Integrated Pass Alarm and Integrated Thermal Imaging Camera (6) 48,000.00 TOTAL 001.023 FIRE $148,000.00 001.024 EMS 551400 Automatic Transportation Ventilator (2) $9,165.00 551400 Extremity Vacuum Splints for EMS Units 6,715.00 TOTAL 001.024 EMS $15,880.00
001.034 CITY LAKE 551300 15' Bat Wing mower heavy duty $18,500.00 551600 Replace cookers, tables and electric boxes $7,500.00 TOTAL 001.034 CITY LAKE $26,000.00
001.035 PARKS 551400 John Deere Gator $9,000.00 551400 60 " ZTR Mower $9,000.00
TOTAL 001.035 PARKS $18,000.00 001.036 CEMETERY 551600 New metal roof on Highland maintenance building $6,000.00
TOTAL 001.036 CEMETERY $6,000.00 001.037 AQUATIC FACILITY 551700 Paint the Pool $35,000.00
TOTAL 001.037 AQUATIC FACILITY $35,000.00 001.060 BADEN SQUARE 551600 Parking lot repair $15,000.00 551600 Replace fluorescent fixtures $7,000.00
TOTAL 001.060 BADEN SQUARE $22,000.00 132.080 SPECIAL STREETS/HIGHWAY 551300 One Ton Flatbed Pickup $50,000.00
TOTAL 132.080 SPECIAL STREETS/HIGHWAY $50,000.00 135.083 CEMETERY IMPROVEMENTS 551700 Free standing columbarium/planning/phase 1 $20,000.00 TOTAL 135.083 CEMETERY IMPROVEMENTS $20,000.00
2017 Budget City of Winfield Page 15 ~~~~~~~~~~~~~~~~~~~~~~~~~~~~~~~~~~~~~~~~~~~~~~~~~~~~~~~~~~~~~~~~~~~~~~~~~~~~~~~
~~~~~~~~~~~~~~~~~~~~~~~~~~~~~~~~~~~~~~~~~~~~~~~~~~~~~~~~~~~~~~~~~~~~~~~~~~~~~~~
Summary Information
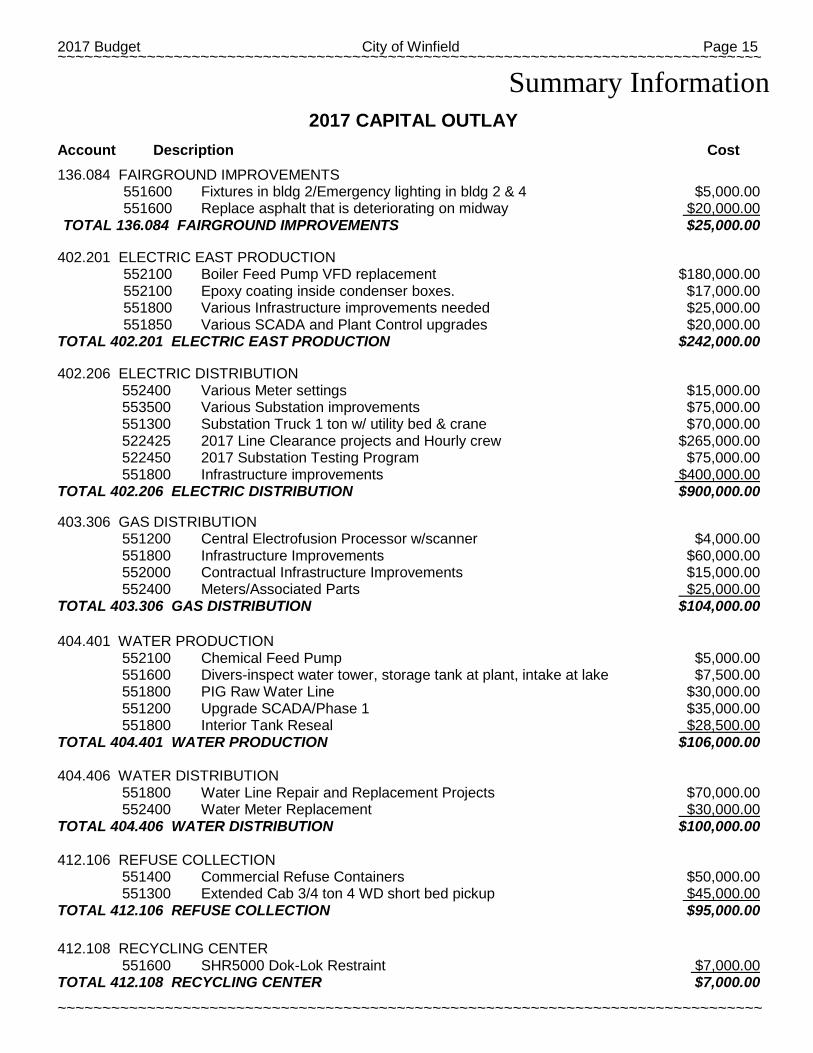
2017 CAPITAL OUTLAY
Account Description Cost
136.084 FAIRGROUND IMPROVEMENTS 551600 Fixtures in bldg 2/Emergency lighting in bldg 2 & 4 $5,000.00 551600 Replace asphalt that is deteriorating on midway $20,000.00 TOTAL 136.084 FAIRGROUND IMPROVEMENTS $25,000.00
402.201 ELECTRIC EAST PRODUCTION 552100 Boiler Feed Pump VFD replacement $180,000.00 552100 Epoxy coating inside condenser boxes. $17,000.00 551800 Various Infrastructure improvements needed $25,000.00 551850 Various SCADA and Plant Control upgrades $20,000.00
TOTAL 402.201 ELECTRIC EAST PRODUCTION $242,000.00 402.206 ELECTRIC DISTRIBUTION 552400 Various Meter settings $15,000.00 553500 Various Substation improvements $75,000.00 551300 Substation Truck 1 ton w/ utility bed & crane $70,000.00 522425 2017 Line Clearance projects and Hourly crew $265,000.00 522450 2017 Substation Testing Program $75,000.00 551800 Infrastructure improvements $400,000.00
TOTAL 402.206 ELECTRIC DISTRIBUTION $900,000.00 403.306 GAS DISTRIBUTION 551200 Central Electrofusion Processor w/scanner $4,000.00 551800 Infrastructure Improvements $60,000.00 552000 Contractual Infrastructure Improvements $15,000.00 552400 Meters/Associated Parts $25,000.00
TOTAL 403.306 GAS DISTRIBUTION $104,000.00 404.401 WATER PRODUCTION 552100 Chemical Feed Pump $5,000.00 551600 Divers-inspect water tower, storage tank at plant, intake at lake $7,500.00 551800 PIG Raw Water Line $30,000.00 551200 Upgrade SCADA/Phase 1 $35,000.00 551800 Interior Tank Reseal $28,500.00
TOTAL 404.401 WATER PRODUCTION $106,000.00 404.406 WATER DISTRIBUTION 551800 Water Line Repair and Replacement Projects $70,000.00 552400 Water Meter Replacement $30,000.00
TOTAL 404.406 WATER DISTRIBUTION $100,000.00 412.106 REFUSE COLLECTION 551400 Commercial Refuse Containers $50,000.00 551300 Extended Cab 3/4 ton 4 WD short bed pickup $45,000.00
TOTAL 412.106 REFUSE COLLECTION $95,000.00 412.108 RECYCLING CENTER 551600 SHR5000 Dok-Lok Restraint $7,000.00
TOTAL 412.108 RECYCLING CENTER $7,000.00
Page 16 City of Winfield 2017 Budget ~~~~~~~~~~~~~~~~~~~~~~~~~~~~~~~~~~~~~~~~~~~~~~~~~~~~~~~~~~~~~~~~~~~~~~~~~~~~~~~
~~~~~~~~~~~~~~~~~~~~~~~~~~~~~~~~~~~~~~~~~~~~~~~~~~~~~~~~~~~~~~~~~~~~~~~~~~~~~~~
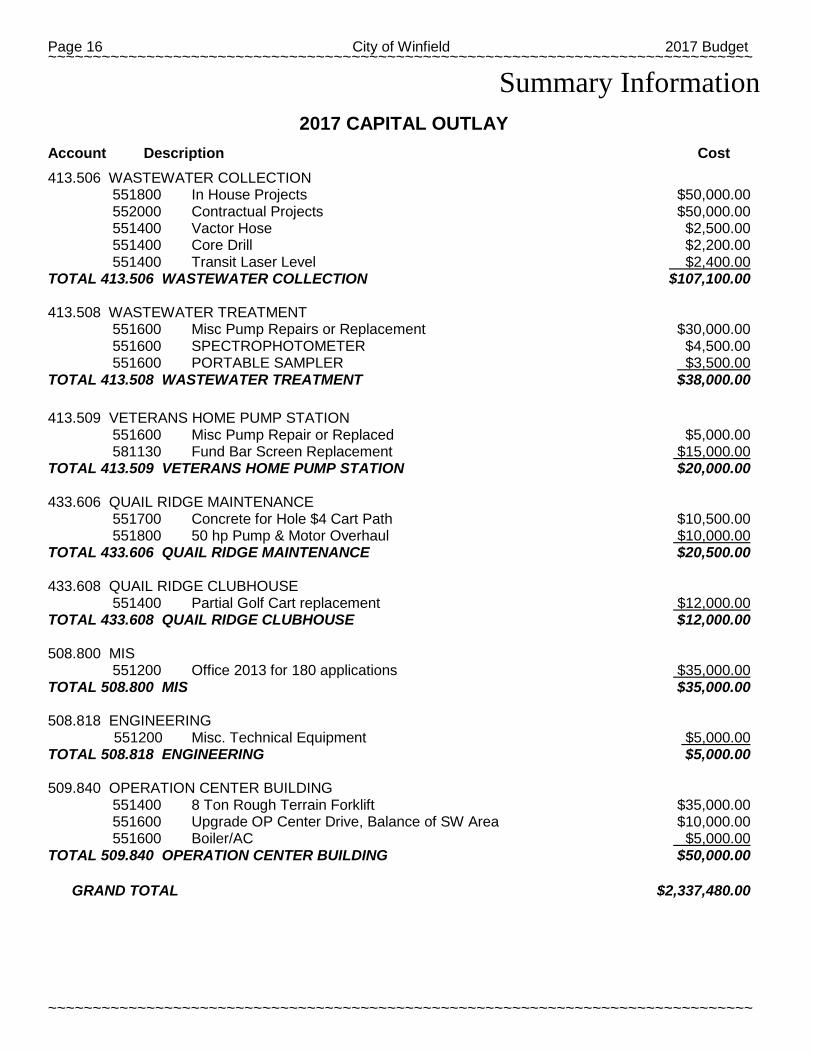
Summary Information
2017 CAPITAL OUTLAY
Account Description Cost
413.506 WASTEWATER COLLECTION 551800 In House Projects $50,000.00 552000 Contractual Projects $50,000.00 551400 Vactor Hose $2,500.00 551400 Core Drill $2,200.00 551400 Transit Laser Level $2,400.00
TOTAL 413.506 WASTEWATER COLLECTION $107,100.00 413.508 WASTEWATER TREATMENT 551600 Misc Pump Repairs or Replacement $30,000.00 551600 SPECTROPHOTOMETER $4,500.00 551600 PORTABLE SAMPLER $3,500.00
TOTAL 413.508 WASTEWATER TREATMENT $38,000.00 413.509 VETERANS HOME PUMP STATION 551600 Misc Pump Repair or Replaced $5,000.00 581130 Fund Bar Screen Replacement $15,000.00
TOTAL 413.509 VETERANS HOME PUMP STATION $20,000.00 433.606 QUAIL RIDGE MAINTENANCE 551700 Concrete for Hole $4 Cart Path $10,500.00 551800 50 hp Pump & Motor Overhaul $10,000.00
TOTAL 433.606 QUAIL RIDGE MAINTENANCE $20,500.00 433.608 QUAIL RIDGE CLUBHOUSE 551400 Partial Golf Cart replacement $12,000.00
TOTAL 433.608 QUAIL RIDGE CLUBHOUSE $12,000.00 508.800 MIS 551200 Office 2013 for 180 applications $35,000.00
TOTAL 508.800 MIS $35,000.00 508.818 ENGINEERING 551200 Misc. Technical Equipment $5,000.00
TOTAL 508.818 ENGINEERING $5,000.00 509.840 OPERATION CENTER BUILDING 551400 8 Ton Rough Terrain Forklift $35,000.00 551600 Upgrade OP Center Drive, Balance of SW Area $10,000.00 551600 Boiler/AC $5,000.00
TOTAL 509.840 OPERATION CENTER BUILDING $50,000.00 GRAND TOTAL $2,337,480.00
2017 Budget City of Winfield Page 17 ~~~~~~~~~~~~~~~~~~~~~~~~~~~~~~~~~~~~~~~~~~~~~~~~~~~~~~~~~~~~~~~~~~~~~~~~~~~~~~~
~~~~~~~~~~~~~~~~~~~~~~~~~~~~~~~~~~~~~~~~~~~~~~~~~~~~~~~~~~~~~~~~~~~~~~~~~~~~~~~
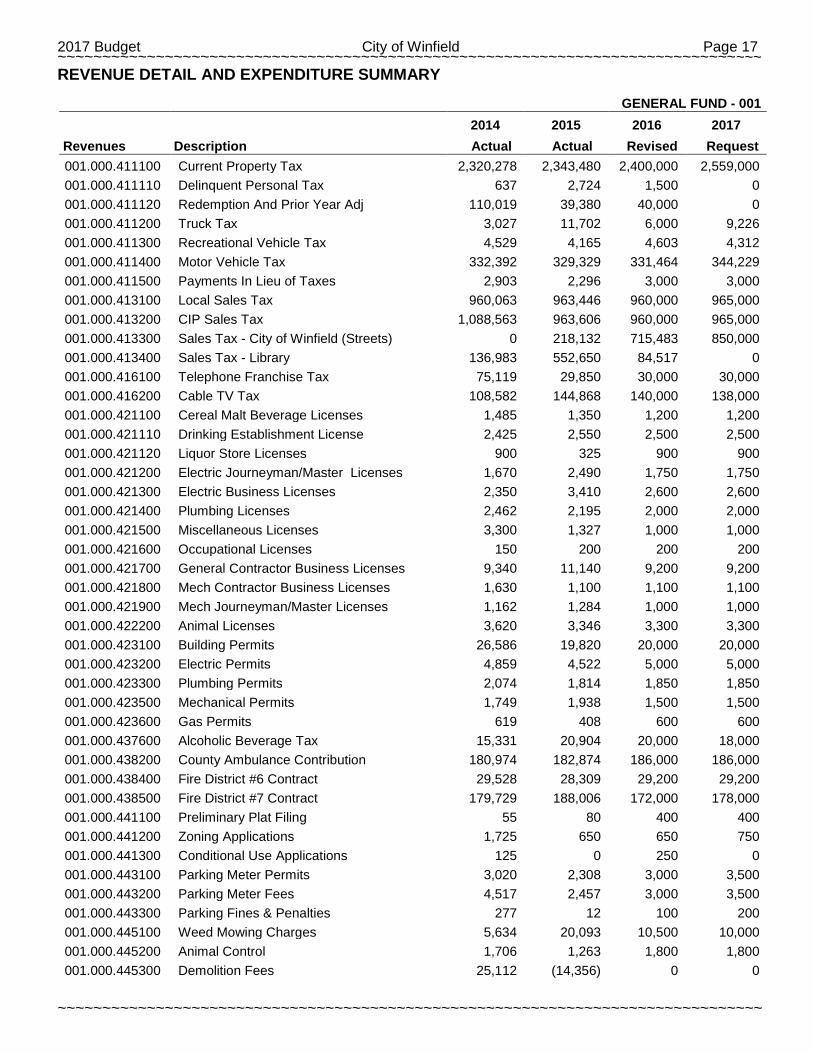
REVENUE DETAIL AND EXPENDITURE SUMMARY
GENERAL FUND - 001
2014 2015 2016 2017
Revenues Description Actual Actual Revised Request 001.000.411100 Current Property Tax 2,320,278 2,343,480 2,400,000 2,559,000 001.000.411110 Delinquent Personal Tax 637 2,724 1,500 0 001.000.411120 Redemption And Prior Year Adj 110,019 39,380 40,000 0 001.000.411200 Truck Tax 3,027 11,702 6,000 9,226 001.000.411300 Recreational Vehicle Tax 4,529 4,165 4,603 4,312 001.000.411400 Motor Vehicle Tax 332,392 329,329 331,464 344,229 001.000.411500 Payments In Lieu of Taxes 2,903 2,296 3,000 3,000 001.000.413100 Local Sales Tax 960,063 963,446 960,000 965,000 001.000.413200 CIP Sales Tax 1,088,563 963,606 960,000 965,000 001.000.413300 Sales Tax - City of Winfield (Streets) 0 218,132 715,483 850,000 001.000.413400 Sales Tax - Library 136,983 552,650 84,517 0 001.000.416100 Telephone Franchise Tax 75,119 29,850 30,000 30,000 001.000.416200 Cable TV Tax 108,582 144,868 140,000 138,000 001.000.421100 Cereal Malt Beverage Licenses 1,485 1,350 1,200 1,200 001.000.421110 Drinking Establishment License 2,425 2,550 2,500 2,500 001.000.421120 Liquor Store Licenses 900 325 900 900 001.000.421200 Electric Journeyman/Master Licenses 1,670 2,490 1,750 1,750 001.000.421300 Electric Business Licenses 2,350 3,410 2,600 2,600 001.000.421400 Plumbing Licenses 2,462 2,195 2,000 2,000 001.000.421500 Miscellaneous Licenses 3,300 1,327 1,000 1,000 001.000.421600 Occupational Licenses 150 200 200 200 001.000.421700 General Contractor Business Licenses 9,340 11,140 9,200 9,200 001.000.421800 Mech Contractor Business Licenses 1,630 1,100 1,100 1,100 001.000.421900 Mech Journeyman/Master Licenses 1,162 1,284 1,000 1,000 001.000.422200 Animal Licenses 3,620 3,346 3,300 3,300 001.000.423100 Building Permits 26,586 19,820 20,000 20,000 001.000.423200 Electric Permits 4,859 4,522 5,000 5,000 001.000.423300 Plumbing Permits 2,074 1,814 1,850 1,850 001.000.423500 Mechanical Permits 1,749 1,938 1,500 1,500 001.000.423600 Gas Permits 619 408 600 600 001.000.437600 Alcoholic Beverage Tax 15,331 20,904 20,000 18,000 001.000.438200 County Ambulance Contribution 180,974 182,874 186,000 186,000 001.000.438400 Fire District #6 Contract 29,528 28,309 29,200 29,200 001.000.438500 Fire District #7 Contract 179,729 188,006 172,000 178,000 001.000.441100 Preliminary Plat Filing 55 80 400 400 001.000.441200 Zoning Applications 1,725 650 650 750 001.000.441300 Conditional Use Applications 125 0 250 0 001.000.443100 Parking Meter Permits 3,020 2,308 3,000 3,500 001.000.443200 Parking Meter Fees 4,517 2,457 3,000 3,500 001.000.443300 Parking Fines & Penalties 277 12 100 200 001.000.445100 Weed Mowing Charges 5,634 20,093 10,500 10,000 001.000.445200 Animal Control 1,706 1,263 1,800 1,800 001.000.445300 Demolition Fees 25,112 (14,356) 0 0
Page 18 City of Winfield 2017 Budget ~~~~~~~~~~~~~~~~~~~~~~~~~~~~~~~~~~~~~~~~~~~~~~~~~~~~~~~~~~~~~~~~~~~~~~~~~~~~~~~
~~~~~~~~~~~~~~~~~~~~~~~~~~~~~~~~~~~~~~~~~~~~~~~~~~~~~~~~~~~~~~~~~~~~~~~~~~~~~~~
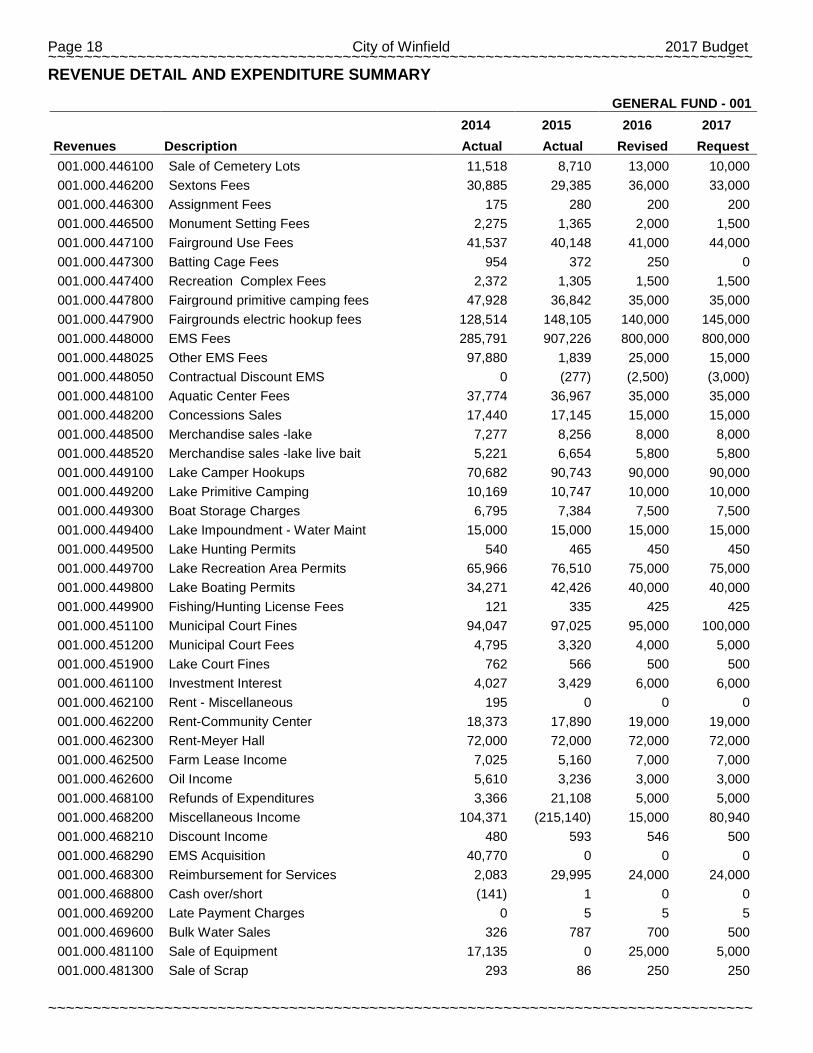
REVENUE DETAIL AND EXPENDITURE SUMMARY
GENERAL FUND - 001
2014 2015 2016 2017
Revenues Description Actual Actual Revised Request 001.000.446100 Sale of Cemetery Lots 11,518 8,710 13,000 10,000 001.000.446200 Sextons Fees 30,885 29,385 36,000 33,000 001.000.446300 Assignment Fees 175 280 200 200 001.000.446500 Monument Setting Fees 2,275 1,365 2,000 1,500 001.000.447100 Fairground Use Fees 41,537 40,148 41,000 44,000 001.000.447300 Batting Cage Fees 954 372 250 0 001.000.447400 Recreation Complex Fees 2,372 1,305 1,500 1,500 001.000.447800 Fairground primitive camping fees 47,928 36,842 35,000 35,000 001.000.447900 Fairgrounds electric hookup fees 128,514 148,105 140,000 145,000 001.000.448000 EMS Fees 285,791 907,226 800,000 800,000 001.000.448025 Other EMS Fees 97,880 1,839 25,000 15,000 001.000.448050 Contractual Discount EMS 0 (277) (2,500) (3,000) 001.000.448100 Aquatic Center Fees 37,774 36,967 35,000 35,000 001.000.448200 Concessions Sales 17,440 17,145 15,000 15,000 001.000.448500 Merchandise sales -lake 7,277 8,256 8,000 8,000 001.000.448520 Merchandise sales -lake live bait 5,221 6,654 5,800 5,800 001.000.449100 Lake Camper Hookups 70,682 90,743 90,000 90,000 001.000.449200 Lake Primitive Camping 10,169 10,747 10,000 10,000 001.000.449300 Boat Storage Charges 6,795 7,384 7,500 7,500 001.000.449400 Lake Impoundment - Water Maint 15,000 15,000 15,000 15,000 001.000.449500 Lake Hunting Permits 540 465 450 450 001.000.449700 Lake Recreation Area Permits 65,966 76,510 75,000 75,000 001.000.449800 Lake Boating Permits 34,271 42,426 40,000 40,000 001.000.449900 Fishing/Hunting License Fees 121 335 425 425 001.000.451100 Municipal Court Fines 94,047 97,025 95,000 100,000 001.000.451200 Municipal Court Fees 4,795 3,320 4,000 5,000 001.000.451900 Lake Court Fines 762 566 500 500 001.000.461100 Investment Interest 4,027 3,429 6,000 6,000 001.000.462100 Rent - Miscellaneous 195 0 0 0 001.000.462200 Rent-Community Center 18,373 17,890 19,000 19,000 001.000.462300 Rent-Meyer Hall 72,000 72,000 72,000 72,000 001.000.462500 Farm Lease Income 7,025 5,160 7,000 7,000 001.000.462600 Oil Income 5,610 3,236 3,000 3,000 001.000.468100 Refunds of Expenditures 3,366 21,108 5,000 5,000 001.000.468200 Miscellaneous Income 104,371 (215,140) 15,000 80,940 001.000.468210 Discount Income 480 593 546 500 001.000.468290 EMS Acquisition 40,770 0 0 0 001.000.468300 Reimbursement for Services 2,083 29,995 24,000 24,000 001.000.468800 Cash over/short (141) 1 0 0 001.000.469200 Late Payment Charges 0 5 5 5 001.000.469600 Bulk Water Sales 326 787 700 500 001.000.481100 Sale of Equipment 17,135 0 25,000 5,000 001.000.481300 Sale of Scrap 293 86 250 250
2017 Budget City of Winfield Page 19 ~~~~~~~~~~~~~~~~~~~~~~~~~~~~~~~~~~~~~~~~~~~~~~~~~~~~~~~~~~~~~~~~~~~~~~~~~~~~~~~
~~~~~~~~~~~~~~~~~~~~~~~~~~~~~~~~~~~~~~~~~~~~~~~~~~~~~~~~~~~~~~~~~~~~~~~~~~~~~~~
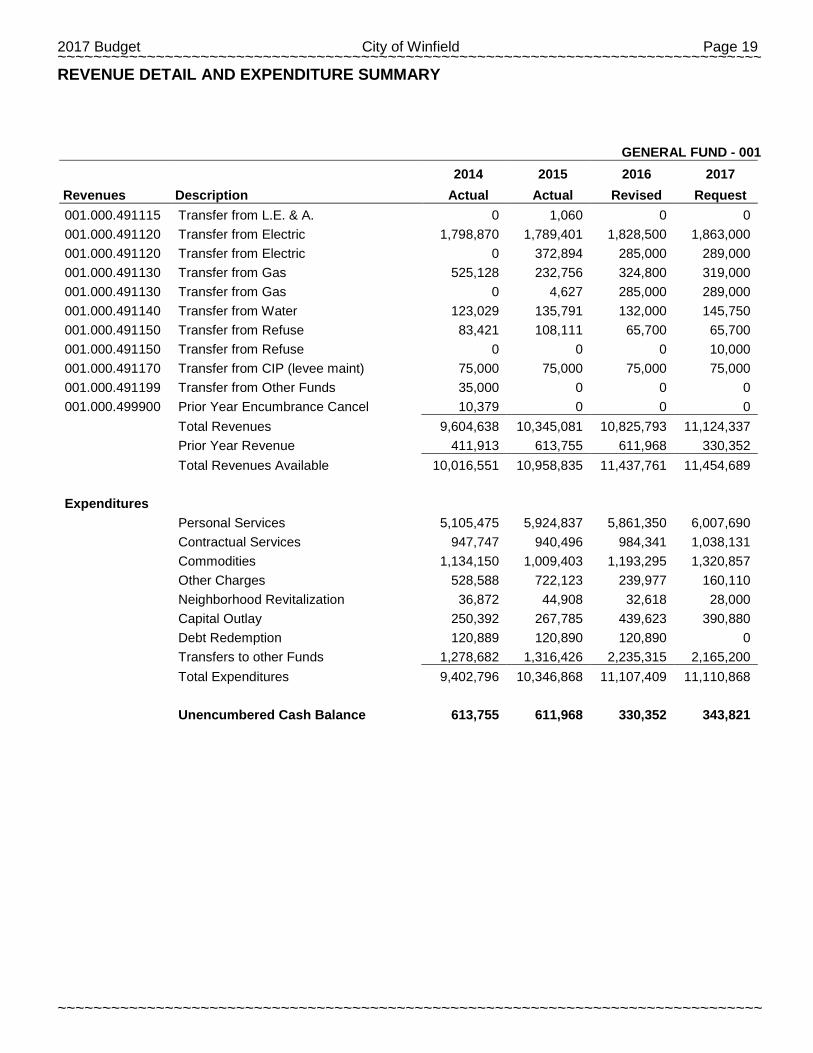
REVENUE DETAIL AND EXPENDITURE SUMMARY
GENERAL FUND - 001
2014 2015 2016 2017
Revenues Description Actual Actual Revised Request 001.000.491115 Transfer from L.E. & A. 0 1,060 0 0 001.000.491120 Transfer from Electric 1,798,870 1,789,401 1,828,500 1,863,000 001.000.491120 Transfer from Electric 0 372,894 285,000 289,000 001.000.491130 Transfer from Gas 525,128 232,756 324,800 319,000 001.000.491130 Transfer from Gas 0 4,627 285,000 289,000 001.000.491140 Transfer from Water 123,029 135,791 132,000 145,750 001.000.491150 Transfer from Refuse 83,421 108,111 65,700 65,700 001.000.491150 Transfer from Refuse 0 0 0 10,000 001.000.491170 Transfer from CIP (levee maint) 75,000 75,000 75,000 75,000 001.000.491199 Transfer from Other Funds 35,000 0 0 0 001.000.499900 Prior Year Encumbrance Cancel 10,379 0 0 0
Total Revenues 9,604,638 10,345,081 10,825,793 11,124,337
Prior Year Revenue 411,913 613,755 611,968 330,352
Total Revenues Available 10,016,551 10,958,835 11,437,761 11,454,689
Expenditures
Personal Services 5,105,475 5,924,837 5,861,350 6,007,690
Contractual Services 947,747 940,496 984,341 1,038,131
Commodities 1,134,150 1,009,403 1,193,295 1,320,857
Other Charges 528,588 722,123 239,977 160,110
Neighborhood Revitalization 36,872 44,908 32,618 28,000
Capital Outlay 250,392 267,785 439,623 390,880
Debt Redemption 120,889 120,890 120,890 0
Transfers to other Funds 1,278,682 1,316,426 2,235,315 2,165,200
Total Expenditures 9,402,796 10,346,868 11,107,409 11,110,868
Unencumbered Cash Balance 613,755 611,968 330,352 343,821
Page 20 City of Winfield 2017 Budget ~~~~~~~~~~~~~~~~~~~~~~~~~~~~~~~~~~~~~~~~~~~~~~~~~~~~~~~~~~~~~~~~~~~~~~~~~~~~~~~
~~~~~~~~~~~~~~~~~~~~~~~~~~~~~~~~~~~~~~~~~~~~~~~~~~~~~~~~~~~~~~~~~~~~~~~~~~~~~~~
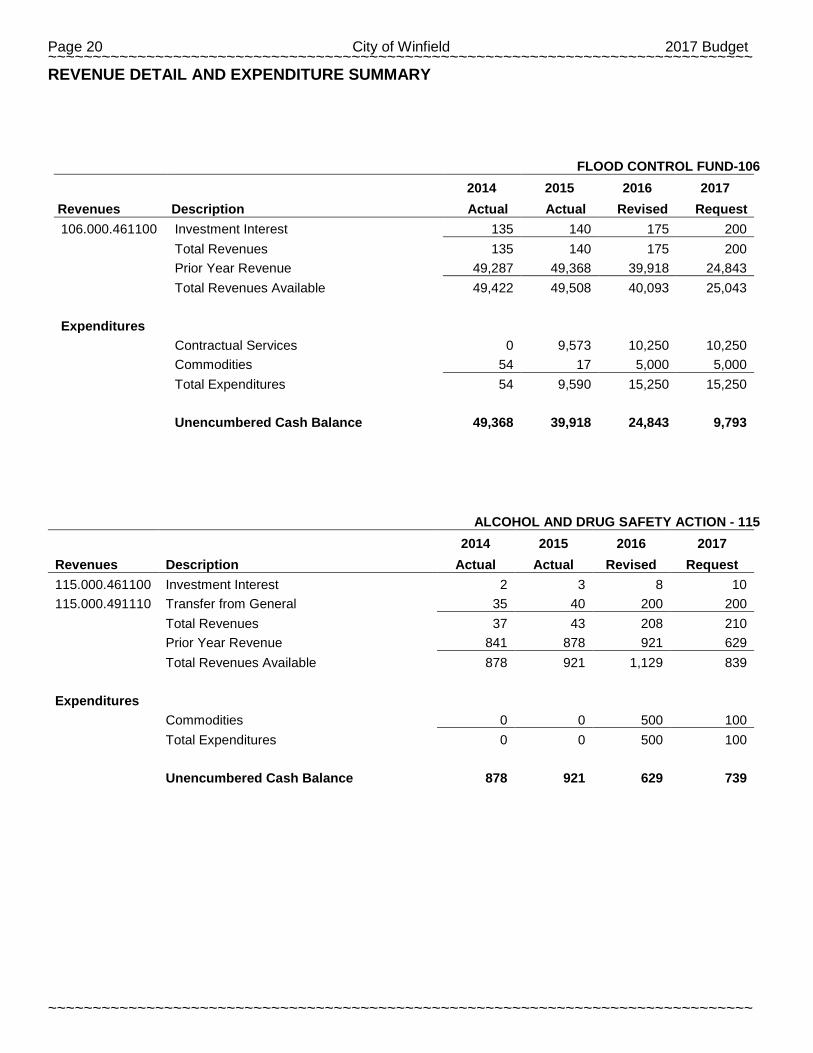
REVENUE DETAIL AND EXPENDITURE SUMMARY
FLOOD CONTROL FUND-106
2014 2015 2016 2017
Revenues Description Actual Actual Revised Request 106.000.461100 Investment Interest 135 140 175 200
Total Revenues 135 140 175 200
Prior Year Revenue 49,287 49,368 39,918 24,843
Total Revenues Available 49,422 49,508 40,093 25,043
Expenditures
Contractual Services 0 9,573 10,250 10,250
Commodities 54 17 5,000 5,000
Total Expenditures 54 9,590 15,250 15,250
Unencumbered Cash Balance 49,368 39,918 24,843 9,793
ALCOHOL AND DRUG SAFETY ACTION - 115
2014 2015 2016 2017
Revenues Description Actual Actual Revised Request 115.000.461100 Investment Interest 2 3 8 10 115.000.491110 Transfer from General 35 40 200 200
Total Revenues 37 43 208 210
Prior Year Revenue 841 878 921 629
Total Revenues Available 878 921 1,129 839
Expenditures
Commodities 0 0 500 100
Total Expenditures 0 0 500 100
Unencumbered Cash Balance 878 921 629 739
2017 Budget City of Winfield Page 21 ~~~~~~~~~~~~~~~~~~~~~~~~~~~~~~~~~~~~~~~~~~~~~~~~~~~~~~~~~~~~~~~~~~~~~~~~~~~~~~~
~~~~~~~~~~~~~~~~~~~~~~~~~~~~~~~~~~~~~~~~~~~~~~~~~~~~~~~~~~~~~~~~~~~~~~~~~~~~~~~
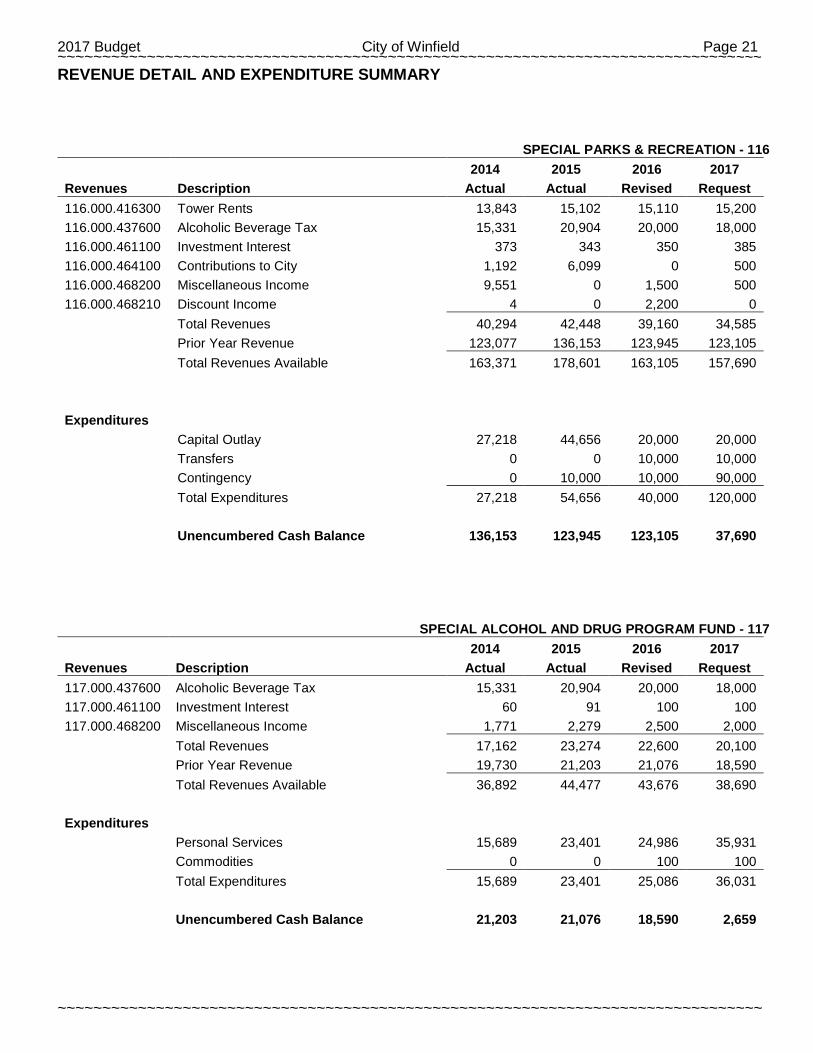
REVENUE DETAIL AND EXPENDITURE SUMMARY
SPECIAL PARKS & RECREATION - 116
2014 2015 2016 2017
Revenues Description Actual Actual Revised Request 116.000.416300 Tower Rents 13,843 15,102 15,110 15,200 116.000.437600 Alcoholic Beverage Tax 15,331 20,904 20,000 18,000 116.000.461100 Investment Interest 373 343 350 385 116.000.464100 Contributions to City 1,192 6,099 0 500 116.000.468200 Miscellaneous Income 9,551 0 1,500 500 116.000.468210 Discount Income 4 0 2,200 0
Total Revenues 40,294 42,448 39,160 34,585
Prior Year Revenue 123,077 136,153 123,945 123,105
Total Revenues Available 163,371 178,601 163,105 157,690
Expenditures
Capital Outlay 27,218 44,656 20,000 20,000
Transfers 0 0 10,000 10,000
Contingency 0 10,000 10,000 90,000
Total Expenditures 27,218 54,656 40,000 120,000
Unencumbered Cash Balance 136,153 123,945 123,105 37,690
SPECIAL ALCOHOL AND DRUG PROGRAM FUND - 117
2014 2015 2016 2017
Revenues Description Actual Actual Revised Request 117.000.437600 Alcoholic Beverage Tax 15,331 20,904 20,000 18,000 117.000.461100 Investment Interest 60 91 100 100 117.000.468200 Miscellaneous Income 1,771 2,279 2,500 2,000
Total Revenues 17,162 23,274 22,600 20,100
Prior Year Revenue 19,730 21,203 21,076 18,590
Total Revenues Available 36,892 44,477 43,676 38,690
Expenditures
Personal Services 15,689 23,401 24,986 35,931
Commodities 0 0 100 100
Total Expenditures 15,689 23,401 25,086 36,031
Unencumbered Cash Balance 21,203 21,076 18,590 2,659
Page 22 City of Winfield 2017 Budget ~~~~~~~~~~~~~~~~~~~~~~~~~~~~~~~~~~~~~~~~~~~~~~~~~~~~~~~~~~~~~~~~~~~~~~~~~~~~~~~
~~~~~~~~~~~~~~~~~~~~~~~~~~~~~~~~~~~~~~~~~~~~~~~~~~~~~~~~~~~~~~~~~~~~~~~~~~~~~~~
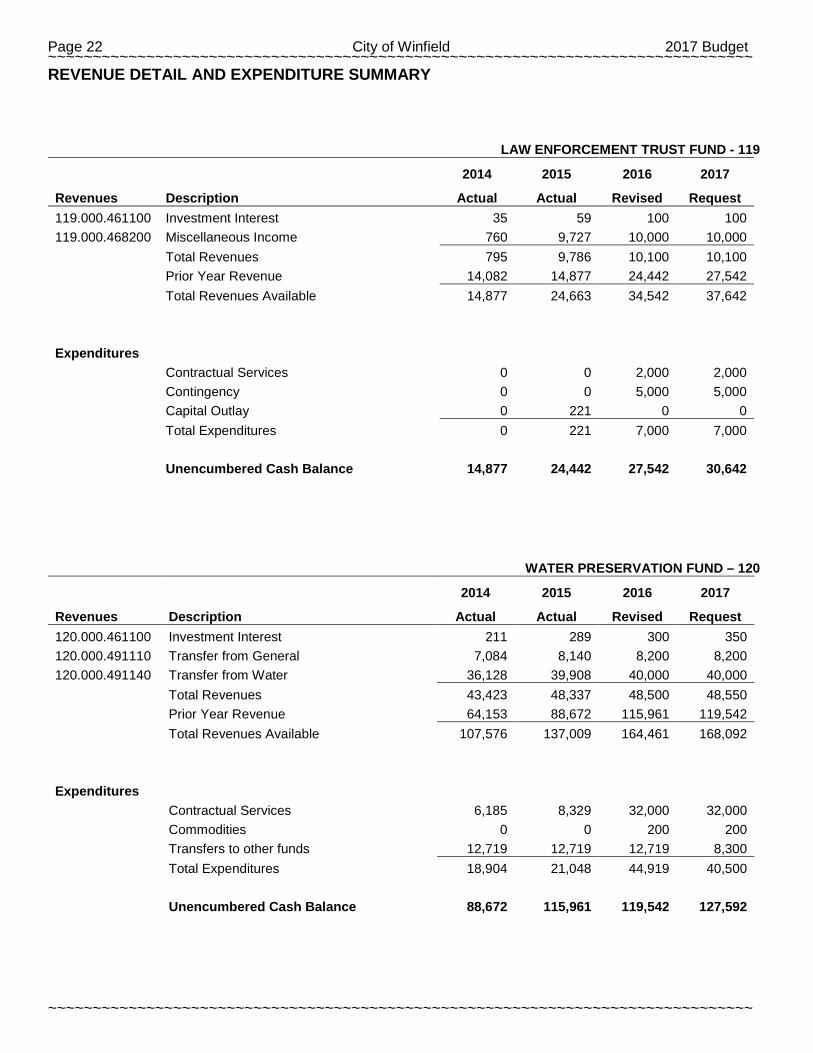
REVENUE DETAIL AND EXPENDITURE SUMMARY
LAW ENFORCEMENT TRUST FUND - 119
2014 2015 2016 2017
Revenues Description Actual Actual Revised Request 119.000.461100 Investment Interest 35 59 100 100 119.000.468200 Miscellaneous Income 760 9,727 10,000 10,000
Total Revenues 795 9,786 10,100 10,100
Prior Year Revenue 14,082 14,877 24,442 27,542
Total Revenues Available 14,877 24,663 34,542 37,642
Expenditures
Contractual Services 0 0 2,000 2,000
Contingency 0 0 5,000 5,000
Capital Outlay 0 221 0 0
Total Expenditures 0 221 7,000 7,000
Unencumbered Cash Balance 14,877 24,442 27,542 30,642
WATER PRESERVATION FUND – 120
2014 2015 2016 2017
Revenues Description Actual Actual Revised Request 120.000.461100 Investment Interest 211 289 300 350 120.000.491110 Transfer from General 7,084 8,140 8,200 8,200 120.000.491140 Transfer from Water 36,128 39,908 40,000 40,000
Total Revenues 43,423 48,337 48,500 48,550
Prior Year Revenue 64,153 88,672 115,961 119,542
Total Revenues Available 107,576 137,009 164,461 168,092
Expenditures
Contractual Services 6,185 8,329 32,000 32,000
Commodities 0 0 200 200
Transfers to other funds 12,719 12,719 12,719 8,300
Total Expenditures 18,904 21,048 44,919 40,500
Unencumbered Cash Balance 88,672 115,961 119,542 127,592
2017 Budget City of Winfield Page 23 ~~~~~~~~~~~~~~~~~~~~~~~~~~~~~~~~~~~~~~~~~~~~~~~~~~~~~~~~~~~~~~~~~~~~~~~~~~~~~~~
~~~~~~~~~~~~~~~~~~~~~~~~~~~~~~~~~~~~~~~~~~~~~~~~~~~~~~~~~~~~~~~~~~~~~~~~~~~~~~~
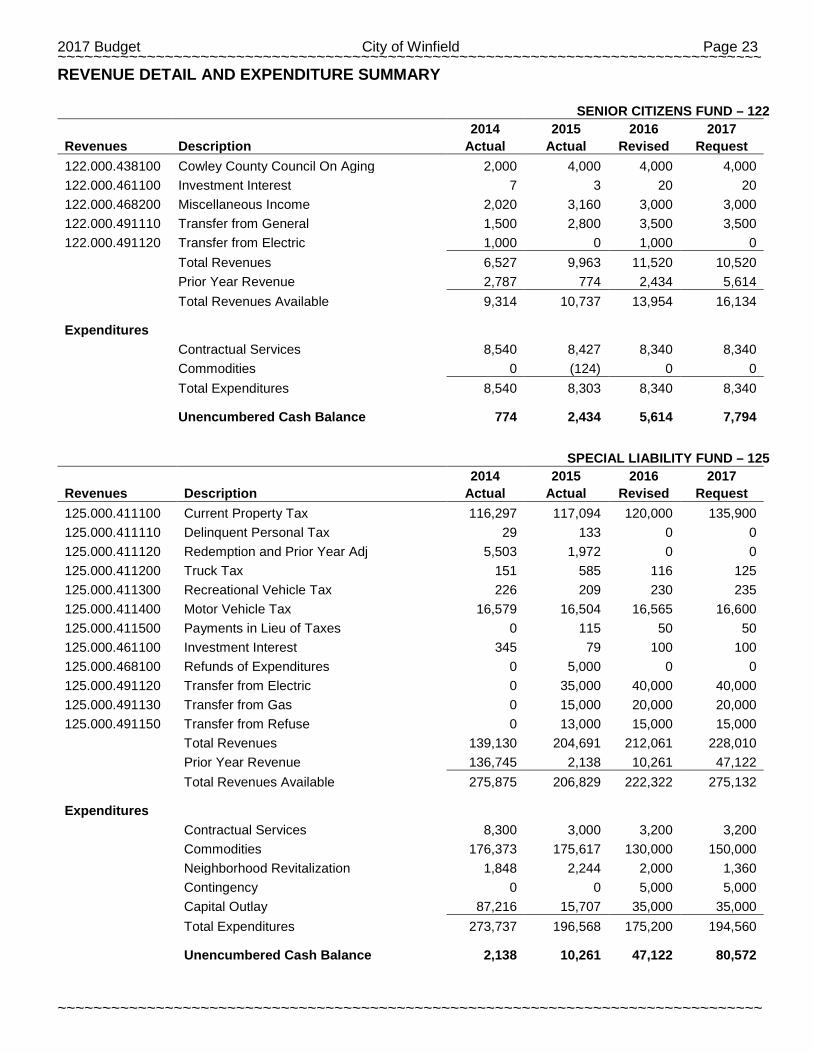
REVENUE DETAIL AND EXPENDITURE SUMMARY
SENIOR CITIZENS FUND – 122
2014 2015 2016 2017
Revenues Description Actual Actual Revised Request 122.000.438100 Cowley County Council On Aging 2,000 4,000 4,000 4,000 122.000.461100 Investment Interest 7 3 20 20 122.000.468200 Miscellaneous Income 2,020 3,160 3,000 3,000 122.000.491110 Transfer from General 1,500 2,800 3,500 3,500 122.000.491120 Transfer from Electric 1,000 0 1,000 0
Total Revenues 6,527 9,963 11,520 10,520
Prior Year Revenue 2,787 774 2,434 5,614
Total Revenues Available 9,314 10,737 13,954 16,134
Expenditures
Contractual Services 8,540 8,427 8,340 8,340
Commodities 0 (124) 0 0
Total Expenditures 8,540 8,303 8,340 8,340
Unencumbered Cash Balance 774 2,434 5,614 7,794
SPECIAL LIABILITY FUND – 125
2014 2015 2016 2017
Revenues Description Actual Actual Revised Request 125.000.411100 Current Property Tax 116,297 117,094 120,000 135,900 125.000.411110 Delinquent Personal Tax 29 133 0 0 125.000.411120 Redemption and Prior Year Adj 5,503 1,972 0 0 125.000.411200 Truck Tax 151 585 116 125 125.000.411300 Recreational Vehicle Tax 226 209 230 235 125.000.411400 Motor Vehicle Tax 16,579 16,504 16,565 16,600 125.000.411500 Payments in Lieu of Taxes 0 115 50 50 125.000.461100 Investment Interest 345 79 100 100 125.000.468100 Refunds of Expenditures 0 5,000 0 0 125.000.491120 Transfer from Electric 0 35,000 40,000 40,000 125.000.491130 Transfer from Gas 0 15,000 20,000 20,000 125.000.491150 Transfer from Refuse 0 13,000 15,000 15,000
Total Revenues 139,130 204,691 212,061 228,010
Prior Year Revenue 136,745 2,138 10,261 47,122
Total Revenues Available 275,875 206,829 222,322 275,132
Expenditures
Contractual Services 8,300 3,000 3,200 3,200
Commodities 176,373 175,617 130,000 150,000
Neighborhood Revitalization 1,848 2,244 2,000 1,360
Contingency 0 0 5,000 5,000
Capital Outlay 87,216 15,707 35,000 35,000
Total Expenditures 273,737 196,568 175,200 194,560
Unencumbered Cash Balance 2,138 10,261 47,122 80,572
Page 24 City of Winfield 2017 Budget ~~~~~~~~~~~~~~~~~~~~~~~~~~~~~~~~~~~~~~~~~~~~~~~~~~~~~~~~~~~~~~~~~~~~~~~~~~~~~~~
~~~~~~~~~~~~~~~~~~~~~~~~~~~~~~~~~~~~~~~~~~~~~~~~~~~~~~~~~~~~~~~~~~~~~~~~~~~~~~~
REVENUE DETAIL AND EXPENDITURE SUMMARY
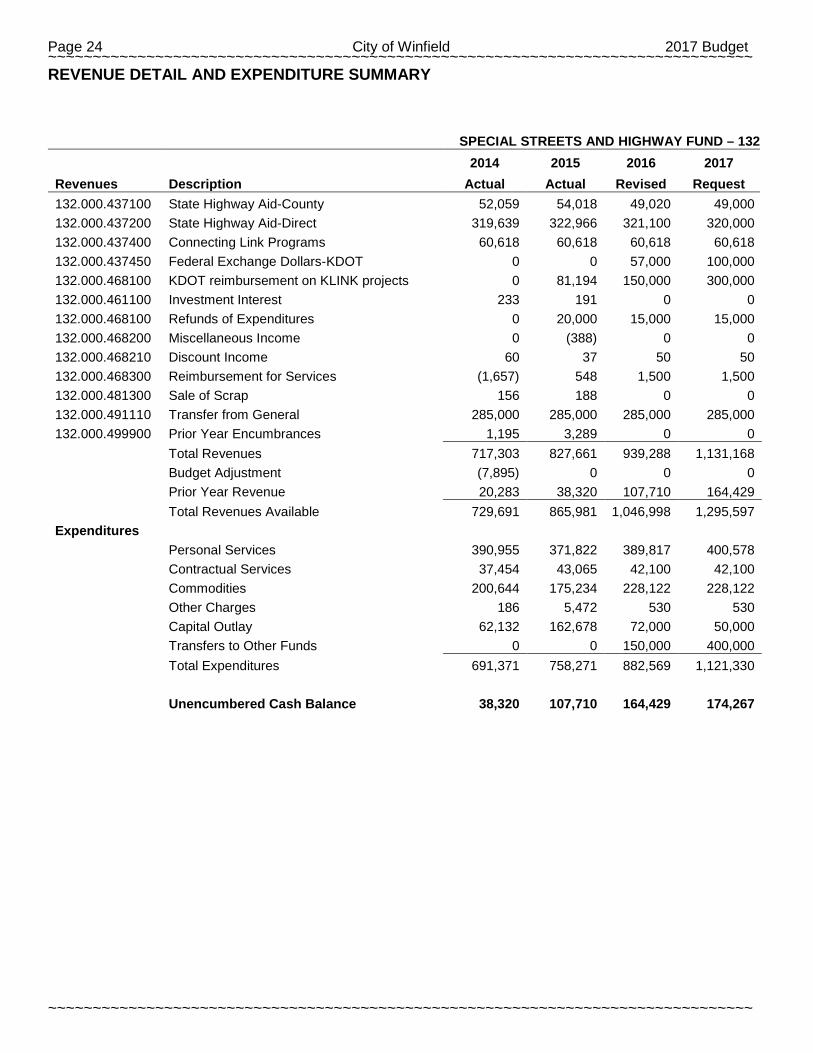
SPECIAL STREETS AND HIGHWAY FUND – 132
2014 2015 2016 2017
Revenues Description Actual Actual Revised Request 132.000.437100 State Highway Aid-County 52,059 54,018 49,020 49,000 132.000.437200 State Highway Aid-Direct 319,639 322,966 321,100 320,000 132.000.437400 Connecting Link Programs 60,618 60,618 60,618 60,618 132.000.437450 Federal Exchange Dollars-KDOT 0 0 57,000 100,000 132.000.468100 KDOT reimbursement on KLINK projects 0 81,194 150,000 300,000 132.000.461100 Investment Interest 233 191 0 0 132.000.468100 Refunds of Expenditures 0 20,000 15,000 15,000 132.000.468200 Miscellaneous Income 0 (388) 0 0 132.000.468210 Discount Income 60 37 50 50 132.000.468300 Reimbursement for Services (1,657) 548 1,500 1,500 132.000.481300 Sale of Scrap 156 188 0 0 132.000.491110 Transfer from General 285,000 285,000 285,000 285,000 132.000.499900 Prior Year Encumbrances 1,195 3,289 0 0
Total Revenues 717,303 827,661 939,288 1,131,168
Budget Adjustment (7,895) 0 0 0
Prior Year Revenue 20,283 38,320 107,710 164,429
Total Revenues Available 729,691 865,981 1,046,998 1,295,597
Expenditures
Personal Services 390,955 371,822 389,817 400,578
Contractual Services 37,454 43,065 42,100 42,100
Commodities 200,644 175,234 228,122 228,122
Other Charges 186 5,472 530 530
Capital Outlay 62,132 162,678 72,000 50,000
Transfers to Other Funds 0 0 150,000 400,000
Total Expenditures 691,371 758,271 882,569 1,121,330
Unencumbered Cash Balance 38,320 107,710 164,429 174,267
2017 Budget City of Winfield Page 25 ~~~~~~~~~~~~~~~~~~~~~~~~~~~~~~~~~~~~~~~~~~~~~~~~~~~~~~~~~~~~~~~~~~~~~~~~~~~~~~~
~~~~~~~~~~~~~~~~~~~~~~~~~~~~~~~~~~~~~~~~~~~~~~~~~~~~~~~~~~~~~~~~~~~~~~~~~~~~~~~
REVENUE DETAIL AND EXPENDITURE SUMMARY
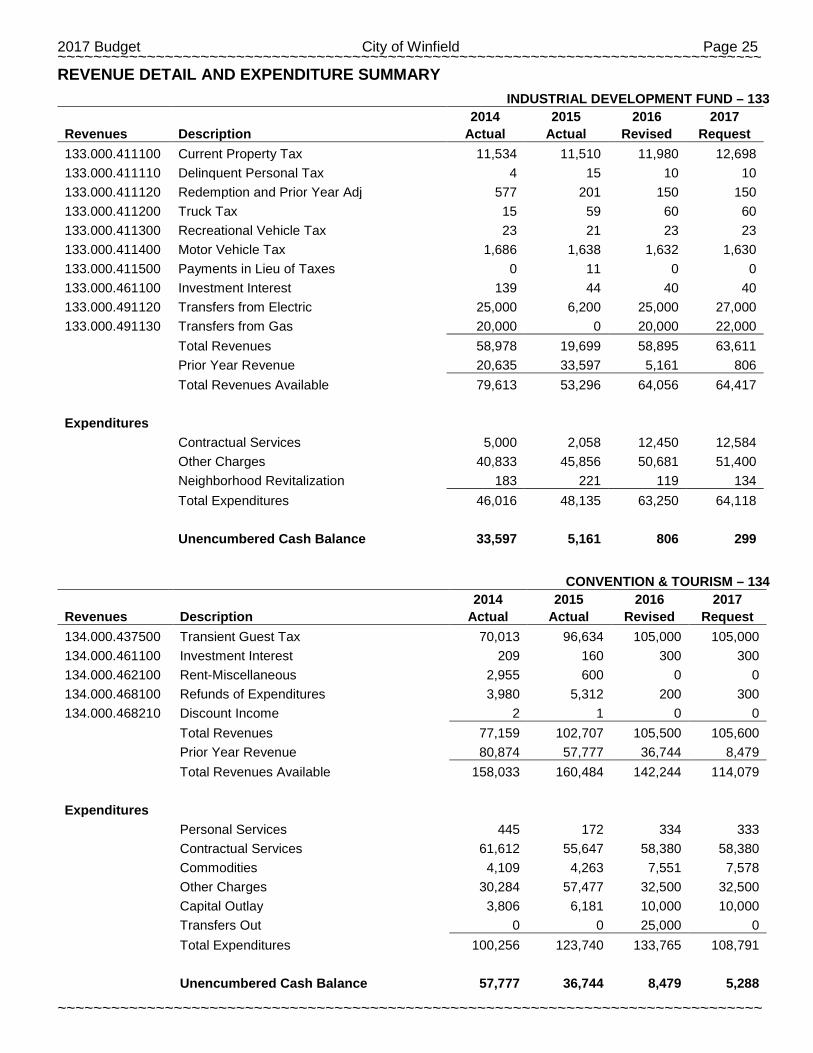
INDUSTRIAL DEVELOPMENT FUND – 133
2014 2015 2016 2017
Revenues Description Actual Actual Revised Request 133.000.411100 Current Property Tax 11,534 11,510 11,980 12,698 133.000.411110 Delinquent Personal Tax 4 15 10 10 133.000.411120 Redemption and Prior Year Adj 577 201 150 150 133.000.411200 Truck Tax 15 59 60 60 133.000.411300 Recreational Vehicle Tax 23 21 23 23 133.000.411400 Motor Vehicle Tax 1,686 1,638 1,632 1,630 133.000.411500 Payments in Lieu of Taxes 0 11 0 0 133.000.461100 Investment Interest 139 44 40 40 133.000.491120 Transfers from Electric 25,000 6,200 25,000 27,000 133.000.491130 Transfers from Gas 20,000 0 20,000 22,000
Total Revenues 58,978 19,699 58,895 63,611
Prior Year Revenue 20,635 33,597 5,161 806
Total Revenues Available 79,613 53,296 64,056 64,417
Expenditures
Contractual Services 5,000 2,058 12,450 12,584
Other Charges 40,833 45,856 50,681 51,400
Neighborhood Revitalization 183 221 119 134
Total Expenditures 46,016 48,135 63,250 64,118
Unencumbered Cash Balance 33,597 5,161 806 299
CONVENTION & TOURISM – 134
2014 2015 2016 2017
Revenues Description Actual Actual Revised Request 134.000.437500 Transient Guest Tax 70,013 96,634 105,000 105,000 134.000.461100 Investment Interest 209 160 300 300 134.000.462100 Rent-Miscellaneous 2,955 600 0 0 134.000.468100 Refunds of Expenditures 3,980 5,312 200 300 134.000.468210 Discount Income 2 1 0 0
Total Revenues 77,159 102,707 105,500 105,600
Prior Year Revenue 80,874 57,777 36,744 8,479
Total Revenues Available 158,033 160,484 142,244 114,079
Expenditures
Personal Services 445 172 334 333
Contractual Services 61,612 55,647 58,380 58,380
Commodities 4,109 4,263 7,551 7,578
Other Charges 30,284 57,477 32,500 32,500
Capital Outlay 3,806 6,181 10,000 10,000
Transfers Out 0 0 25,000 0
Total Expenditures 100,256 123,740 133,765 108,791
Unencumbered Cash Balance 57,777 36,744 8,479 5,288
Page 26 City of Winfield 2017 Budget ~~~~~~~~~~~~~~~~~~~~~~~~~~~~~~~~~~~~~~~~~~~~~~~~~~~~~~~~~~~~~~~~~~~~~~~~~~~~~~~
~~~~~~~~~~~~~~~~~~~~~~~~~~~~~~~~~~~~~~~~~~~~~~~~~~~~~~~~~~~~~~~~~~~~~~~~~~~~~~~
REVENUE DETAIL AND EXPENDITURE SUMMARY
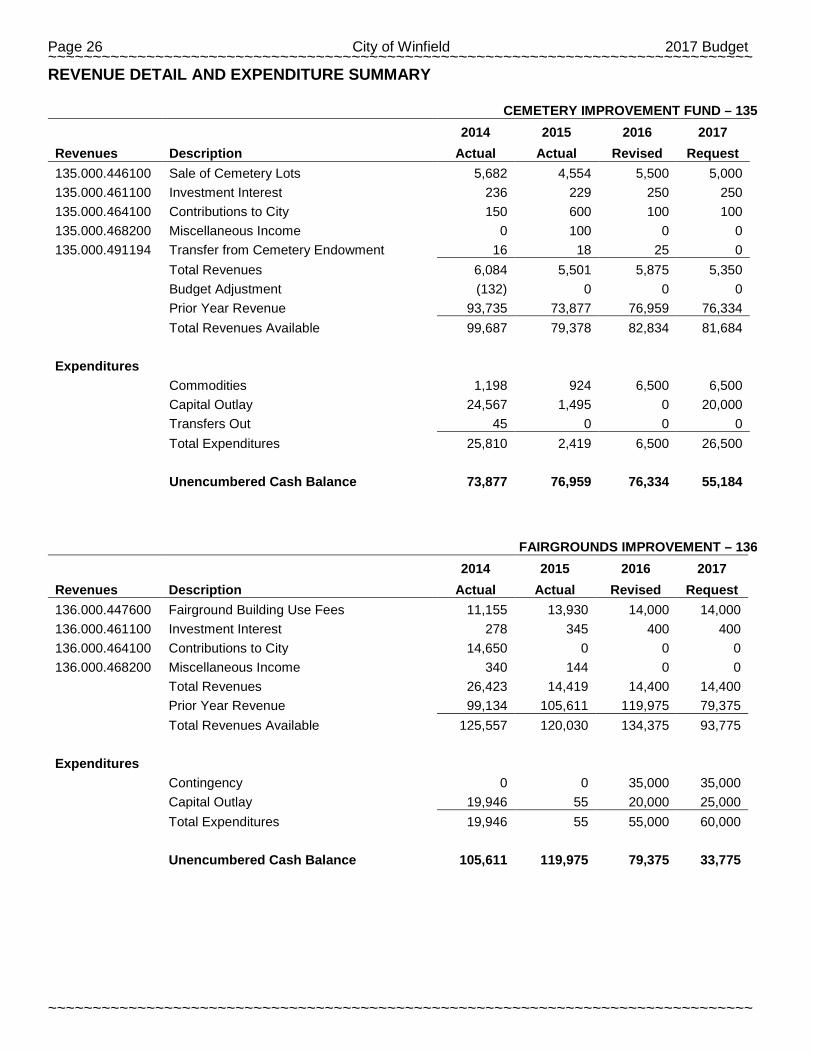
CEMETERY IMPROVEMENT FUND – 135
2014 2015 2016 2017
Revenues Description Actual Actual Revised Request 135.000.446100 Sale of Cemetery Lots 5,682 4,554 5,500 5,000 135.000.461100 Investment Interest 236 229 250 250 135.000.464100 Contributions to City 150 600 100 100 135.000.468200 Miscellaneous Income 0 100 0 0 135.000.491194 Transfer from Cemetery Endowment 16 18 25 0
Total Revenues 6,084 5,501 5,875 5,350
Budget Adjustment (132) 0 0 0
Prior Year Revenue 93,735 73,877 76,959 76,334
Total Revenues Available 99,687 79,378 82,834 81,684
Expenditures
Commodities 1,198 924 6,500 6,500
Capital Outlay 24,567 1,495 0 20,000
Transfers Out 45 0 0 0
Total Expenditures 25,810 2,419 6,500 26,500
Unencumbered Cash Balance 73,877 76,959 76,334 55,184
FAIRGROUNDS IMPROVEMENT – 136
2014 2015 2016 2017
Revenues Description Actual Actual Revised Request 136.000.447600 Fairground Building Use Fees 11,155 13,930 14,000 14,000 136.000.461100 Investment Interest 278 345 400 400 136.000.464100 Contributions to City 14,650 0 0 0 136.000.468200 Miscellaneous Income 340 144 0 0
Total Revenues 26,423 14,419 14,400 14,400
Prior Year Revenue 99,134 105,611 119,975 79,375
Total Revenues Available 125,557 120,030 134,375 93,775
Expenditures
Contingency 0 0 35,000 35,000
Capital Outlay 19,946 55 20,000 25,000
Total Expenditures 19,946 55 55,000 60,000
Unencumbered Cash Balance 105,611 119,975 79,375 33,775

2017 Budget City of Winfield Page 27 ~~~~~~~~~~~~~~~~~~~~~~~~~~~~~~~~~~~~~~~~~~~~~~~~~~~~~~~~~~~~~~~~~~~~~~~~~~~~~~~
~~~~~~~~~~~~~~~~~~~~~~~~~~~~~~~~~~~~~~~~~~~~~~~~~~~~~~~~~~~~~~~~~~~~~~~~~~~~~~~
REVENUE DETAIL AND EXPENDITURE SUMMARY
SALES TAX STREETS – 137
2014 2015 2016 2017
Revenues Description Actual Actual Revised Request 137.000.491110 Transfer from General Fund 0 0 933,615 768,200
Total Revenues 0 0 933,615 768,200
Prior Year Revenue 0 0 0 83,615
Total Revenues Available 0 0 933,615 851,815
Expenditures
Capital Outlay 0 0 850,000 850,000
Total Expenditures 0 0 850,000 850,000
Unencumbered Cash Balance 0 0 83,615 1,815
DRUG TASK FORCE – 138
2014 2015 2016 2017
Revenues Description Actual Actual Revised Request 138.000.438700 Winfield Contribution 5,000 0 0 0 138.000.438800 Ark City Contribution 5,000 0 0 0 138.000.438900 County Contribution 5,190 0 0 0 138.000.461100 Investment Interest 127 55 0 0 138.000.468200 Miscellaneous Income 2,180 1,130 0 0
Total Revenues 17,497 1,185 0 0
Prior Year Revenue 44,978 40,712 0 0
Total Revenues Available 62,475 41,897 0 0
Expenditures
Contractual Services 6,093 3,090 0 0
Commodities 7,856 17,003 0 0
Other Charges 2,779 8,291 0 0
Capital Outlay 5,035 0 0 0
Total Expenditures 21,763 28,384 0 0
Unencumbered Cash Balance 40,712 13,513 0 0
LIBRARY FUND - 172
2014 2015 2016 2017
Revenues Description Actual Actual Revised Request 172.000.411100 Current Property Tax 441,928 437,710 450,000 482,390 172.000.411110 Delinquent Personal Tax 119 511 150 150 172.000.411120 Redemption and Prior year Adj 20,481 7,424 5,000 5,000 172.000.411200 Truck Tax 564 2,188 2,000 1,721 172.000.411300 Recreational Vehicle Tax 839 792 860 804 172.000.411400 Motor Vehicle Tax 61,593 62,659 61,909 64,216 172.000.411500 Payments in Lieu of Taxes 0 437 250 250
Total Revenues 525,524 511,721 520,169 554,531
Prior Year Revenue 0 17,380 10,397 (75,698)
Total Revenues Available 525,524 529,101 530,566 478,833
Expenditures
Distributions 501,121 510,318 600,173 549,459
Neighborhood Revitalization 7,023 8,386 6,091 5,072
Total Expenditures 508,144 518,704 606,264 554,531
Unencumbered Cash Balance 17,380 10,397 (75,698) (75,698)

Page 28 City of Winfield 2017 Budget ~~~~~~~~~~~~~~~~~~~~~~~~~~~~~~~~~~~~~~~~~~~~~~~~~~~~~~~~~~~~~~~~~~~~~~~~~~~~~~~
~~~~~~~~~~~~~~~~~~~~~~~~~~~~~~~~~~~~~~~~~~~~~~~~~~~~~~~~~~~~~~~~~~~~~~~~~~~~~~~
REVENUE DETAIL AND EXPENDITURE SUMMARY
BOND & INTEREST FUND - 260
2014 2015 2016 2017
Revenues Description Actual Actual Revised Request 260.000.411100 Current Property Tax 591,301 587,791 605,000 563,655 260.000.411110 Delinquent Personal Tax 168 704 2,500 300 260.000.411120 Redemption And Prior Year Adj 28,098 10,048 8,000 8,000 260.000.411200 Truck Tax 770 2,976 2,500 2,314 260.000.411300 Recreational Vehicle Tax 1,151 1,061 1,175 1,081 260.000.411400 Motor Vehicle Tax 84,463 83,917 85,172 86,324 260.000.411500 Payments In Lieu of Taxes 0 585 500 500 260.000.439500 Other Gov Debt Pymt-Strother 6,435 6,435 0 0 260.000.439600 Other Gov Debt Pymt-USD465 6,377 6,377 6,377 6,377 260.000.439600 Other Gov Debt Pymt- USD465 (tennis courts) 0 10,000 10,000 10,000 260.000.439650 Other Gov Debt Pymt- SW Collg (tennis courts) 0 10,000 10,000 10,000 260.000.461100 Investment Interest 2,631 1,065 1,500 1,500 260.000.465100 Special Assessments 223,940 204,679 230,000 206,000 260.000.491110 Transfer from General (Tennis Courts) 0 0 10,000 10,000 260.000.491110 Transfer from General 0 0 0 100,000 260.000.491135 Transfer from Stormwater Drnge 113,638 20,000 20,000 20,000 260.000.491140 Trsf from Water Fund (2 KDHE loans rfd) 569,217 571,912 559,892 559,892 260.000.491170 Transfer from CIP-KLINK 2007 50,000 50,000 50,000 50,000 260.000.491170 Transfer from CIP-Other Support 400,000 400,000 400,000 400,000 260.000.491170 Transfer from CIP-Aquatic Facility 100,000 100,000 0 0 260.000.491170 Trsf from CIP-Klink 2009 Geom TR0113 86,563 83,013 86,563 83,013 260.000.491170 Transfer from CIP-KLINK 2011 38,238 38,238 38,238 38,238 260.000.491191 Transfer from Wastewater (Vactor) 0 0 50,000 50,000 260.000.491195 Trsf from Cap Projects (Tennis Courts) 0 175,290 0 0 260.000.491199 Transfer from Other Funds 0 322,475 0 0 260.000.495100 G.O. Bond Proceeds 0 11,500,000 0 0 260.000.495100 Temp Note Proceeds 8,083,542 0 935,000 0 260.000.495200 GO Bond Net Premiums 0 461,742 0 0 260.000.495300 GO Bond Refunding 0 (2,700,868) 0 0
Total Revenues 10,386,532 11,947,440 3,112,417 2,207,194
Prior Year Revenue 454,283 290,596 434,256 391,220
Total Revenues Available 10,840,815 12,238,036 3,546,673 2,598,414
Expenditures
Debt Redemption 7,423,045 11,700,266 2,191,253 2,180,393
Contractual Services 32,778 92,250 30,000 0
Transfers to Other funds 3,085,000 0 925,000 0
Neighborhood Revitalization 9,396 11,264 9,200 6,829
Total Expenditures 10,550,219 11,803,780 3,155,453 2,187,222
Unencumbered Cash Balance 290,596 434,256 391,220 411,192

2017 Budget City of Winfield Page 29 ~~~~~~~~~~~~~~~~~~~~~~~~~~~~~~~~~~~~~~~~~~~~~~~~~~~~~~~~~~~~~~~~~~~~~~~~~~~~~~~
~~~~~~~~~~~~~~~~~~~~~~~~~~~~~~~~~~~~~~~~~~~~~~~~~~~~~~~~~~~~~~~~~~~~~~~~~~~~~~~
REVENUE DETAIL AND EXPENDITURE SUMMARY
ELECTRIC FUND – 402
2014 2015 2016 2017
Revenues Description Actual Actual Revised Request 402.000.461100 Investment Interest 6,820 9,101 11,000 15,000 402.000.462800 Rent-Electric Poles 20,230 20,379 20,000 20,000 402.000.468100 Refunds of Expenditures 1,800 1,802 500 500 402.000.468200 Miscellaneous Income 718 1,074 1,000 1,000 402.000.468210 Discount Income 86 157 100 100 402.000.468300 Reimbursement For Services 181,718 145,380 200,000 100,000 402.000.468500 Reconnect Fees 36,551 27,735 28,000 30,000 402.000.468600 Utility Connections Charge 25,369 23,416 23,000 23,000 402.000.468900 NSF Check Charges 0 30 0 0 402.000.469500 Adjustment For A/R Financing (36,706) (117,107) 0 0 402.000.471100 Sale of Utilities 28,162,696 25,933,354 26,500,000 27,000,000 402.000.473100 Sale of Generated Energy 456,676 102,224 200,000 200,000 402.000.473200 Transmission Revenue 433,040 500,114 325,000 325,000 402.000.473300 KPP Capacity Payments 220,380 224,275 225,000 225,000 402.000.481100 Sale of Equipment 19,015 0 6,000 0 402.000.481300 Sale of Scrap 7,811 12,896 5,000 5,000 402.000.481400 Sales of Inventory/Supplies 495 1,006 500 0 402.000.491199 Transfers from other Funds 30,000 0 0 0 402.000.499900 Prior Year Encumb Cancel 38,791 10,268 0 0
Total Revenues 29,605,490 26,896,104 27,545,100 27,944,600
Budget Adjustment 10,491 0 0 0
Prior Year Revenue 682,196 1,154,274 852,708 864,790
Total Revenues Available 30,298,177 28,050,378 28,397,808 28,809,390
Expenditures
Personal Services 1,935,292 2,092,147 2,003,618 2,147,341
Contractual Services 560,887 527,984 635,175 599,145
Commodities 1,735,651 1,946,163 2,214,215 2,234,754
Purchased Energy for Resale 21,840,301 18,594,686 19,100,000 19,600,000
Other Charges 15,438 167,036 15,750 15,750
Transfers to other funds 2,559,123 3,221,495 2,843,000 2,887,000
Capital Outlay 497,211 648,159 721,260 802,000
Total Expenditures 29,143,903 27,197,670 27,533,018 28,285,990
Unencumbered Cash Balance 1,154,274 852,708 864,790 523,400
Page 30 City of Winfield 2017 Budget ~~~~~~~~~~~~~~~~~~~~~~~~~~~~~~~~~~~~~~~~~~~~~~~~~~~~~~~~~~~~~~~~~~~~~~~~~~~~~~~
~~~~~~~~~~~~~~~~~~~~~~~~~~~~~~~~~~~~~~~~~~~~~~~~~~~~~~~~~~~~~~~~~~~~~~~~~~~~~~~
REVENUE DETAIL AND EXPENDITURE SUMMARY
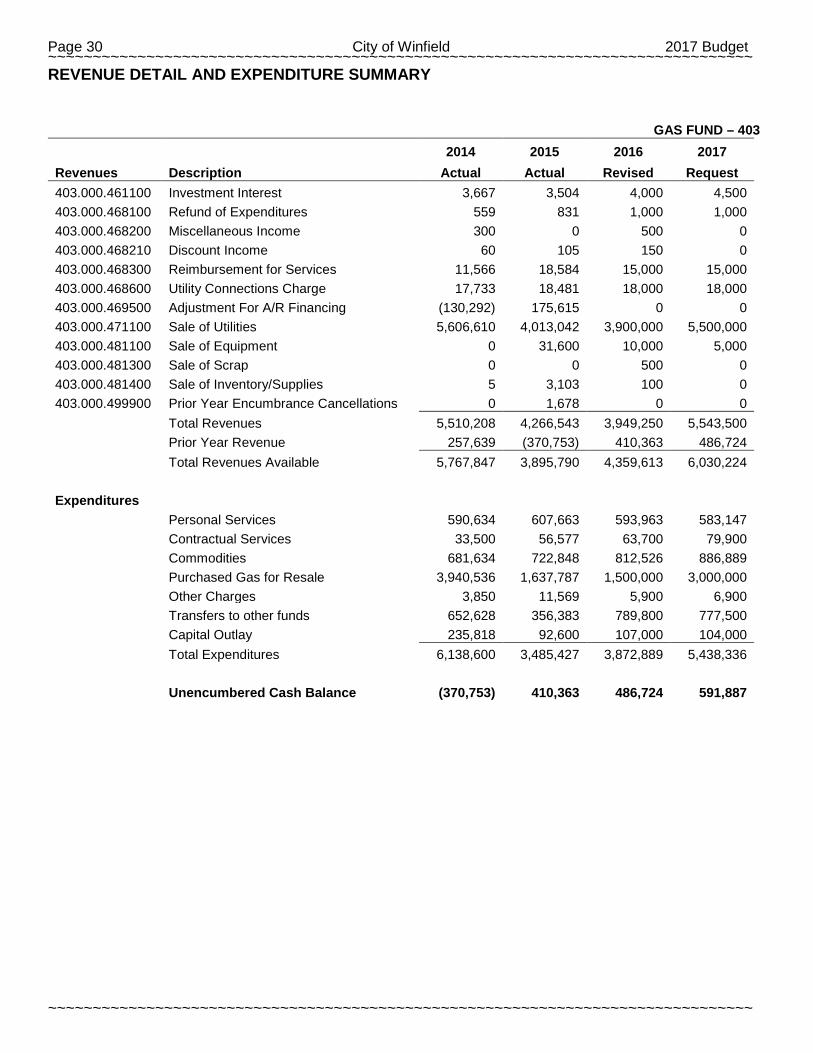
GAS FUND – 403
2014 2015 2016 2017
Revenues Description Actual Actual Revised Request 403.000.461100 Investment Interest 3,667 3,504 4,000 4,500 403.000.468100 Refund of Expenditures 559 831 1,000 1,000 403.000.468200 Miscellaneous Income 300 0 500 0 403.000.468210 Discount Income 60 105 150 0 403.000.468300 Reimbursement for Services 11,566 18,584 15,000 15,000 403.000.468600 Utility Connections Charge 17,733 18,481 18,000 18,000 403.000.469500 Adjustment For A/R Financing (130,292) 175,615 0 0 403.000.471100 Sale of Utilities 5,606,610 4,013,042 3,900,000 5,500,000 403.000.481100 Sale of Equipment 0 31,600 10,000 5,000 403.000.481300 Sale of Scrap 0 0 500 0 403.000.481400 Sale of Inventory/Supplies 5 3,103 100 0 403.000.499900 Prior Year Encumbrance Cancellations 0 1,678 0 0
Total Revenues 5,510,208 4,266,543 3,949,250 5,543,500
Prior Year Revenue 257,639 (370,753) 410,363 486,724
Total Revenues Available 5,767,847 3,895,790 4,359,613 6,030,224
Expenditures
Personal Services 590,634 607,663 593,963 583,147
Contractual Services 33,500 56,577 63,700 79,900
Commodities 681,634 722,848 812,526 886,889
Purchased Gas for Resale 3,940,536 1,637,787 1,500,000 3,000,000
Other Charges 3,850 11,569 5,900 6,900
Transfers to other funds 652,628 356,383 789,800 777,500
Capital Outlay 235,818 92,600 107,000 104,000
Total Expenditures 6,138,600 3,485,427 3,872,889 5,438,336
Unencumbered Cash Balance (370,753) 410,363 486,724 591,887

2017 Budget City of Winfield Page 31 ~~~~~~~~~~~~~~~~~~~~~~~~~~~~~~~~~~~~~~~~~~~~~~~~~~~~~~~~~~~~~~~~~~~~~~~~~~~~~~~
~~~~~~~~~~~~~~~~~~~~~~~~~~~~~~~~~~~~~~~~~~~~~~~~~~~~~~~~~~~~~~~~~~~~~~~~~~~~~~~
REVENUE DETAIL AND EXPENDITURE SUMMARY
WATER – 404
2014 2015 2016 2017
Revenues Description Actual Actual Revised Request 404.000.416300 Tower Rent 15,870 15,870 15,870 15,870 404.000.461100 Investment Interest 67 0 500 500 404.000.468100 Refunds of Expenditures 0 4 0 0 404.000.468200 Miscellaneous Income 0 0 500 0 404.000.468210 Discount Income 46 58 50 0 404.000.468300 Reimbursement for Services 21,009 30,189 25,000 15,000 404.000.468600 Utility Connections Charge 15,720 15,465 15,000 15,000 404.000.469500 Adjustment for A/R Financing (9,578) (14,526) 0 0 404.000.469600 Bulk Water Sales 975 1,136 500 0 404.000.471100 Sale of Utilities 2,238,258 2,286,837 2,400,000 2,650,000 404.000.481100 Sale of Equipment 675 0 3,200 0 404.000.481300 Sale of Scrap 5,931 1,139 100 100 404.000.481400 Sales of Inventory/Supplies 76 405 0 0 404.000.491120 Transfer from Electric 0 270,000 25,000 35,000 404.000.491130 Transfer from Gas 25,000 71,000 35,000 35,000 404.000.491191 Transfer from Wastewater 15,000 0 30,000 15,000 404.000.499900 Prior Year Encumb Cancel 770 68 0 0
Total Revenues 2,329,819 2,677,645 2,550,720 2,781,470
Prior Year Revenue 15,574 (124,694) 48,580 30,624
Total Revenues Available 2,345,393 2,552,951 2,599,300 2,812,094
Expenditures
Personal Services 767,240 755,348 820,541 782,814
Contractual Services 220,905 194,954 230,823 219,925
Commodities 667,120 655,659 629,870 738,376
Other Charges 1,931 15,426 22,550 22,550
Transfers to other funds 728,374 757,705 736,892 750,642
Capital Outlay 84,517 125,279 128,000 206,000
Total Expenditures 2,470,087 2,504,371 2,568,676 2,720,307
Unencumbered Cash Balance (124,694) 48,580 30,624 91,787
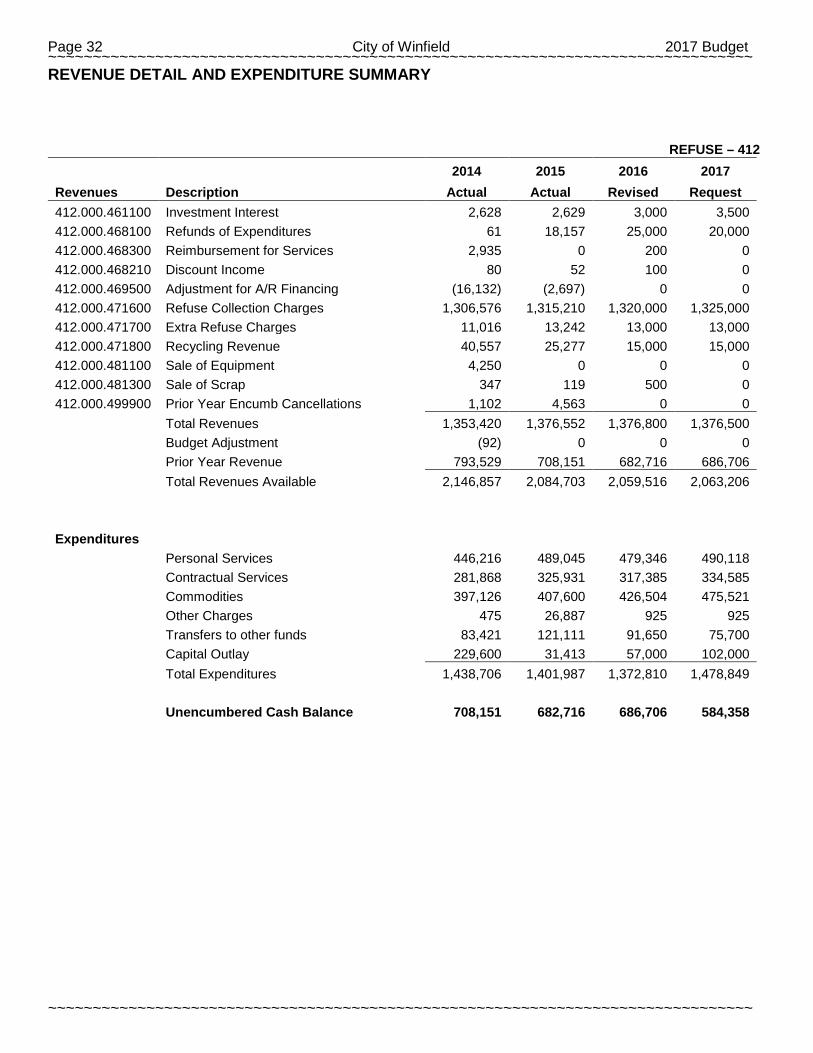
Page 32 City of Winfield 2017 Budget ~~~~~~~~~~~~~~~~~~~~~~~~~~~~~~~~~~~~~~~~~~~~~~~~~~~~~~~~~~~~~~~~~~~~~~~~~~~~~~~
~~~~~~~~~~~~~~~~~~~~~~~~~~~~~~~~~~~~~~~~~~~~~~~~~~~~~~~~~~~~~~~~~~~~~~~~~~~~~~~
REVENUE DETAIL AND EXPENDITURE SUMMARY
REFUSE – 412
2014 2015 2016 2017
Revenues Description Actual Actual Revised Request 412.000.461100 Investment Interest 2,628 2,629 3,000 3,500 412.000.468100 Refunds of Expenditures 61 18,157 25,000 20,000 412.000.468300 Reimbursement for Services 2,935 0 200 0 412.000.468210 Discount Income 80 52 100 0 412.000.469500 Adjustment for A/R Financing (16,132) (2,697) 0 0 412.000.471600 Refuse Collection Charges 1,306,576 1,315,210 1,320,000 1,325,000 412.000.471700 Extra Refuse Charges 11,016 13,242 13,000 13,000 412.000.471800 Recycling Revenue 40,557 25,277 15,000 15,000 412.000.481100 Sale of Equipment 4,250 0 0 0 412.000.481300 Sale of Scrap 347 119 500 0 412.000.499900 Prior Year Encumb Cancellations 1,102 4,563 0 0
Total Revenues 1,353,420 1,376,552 1,376,800 1,376,500
Budget Adjustment (92) 0 0 0
Prior Year Revenue 793,529 708,151 682,716 686,706
Total Revenues Available 2,146,857 2,084,703 2,059,516 2,063,206
Expenditures
Personal Services 446,216 489,045 479,346 490,118
Contractual Services 281,868 325,931 317,385 334,585
Commodities 397,126 407,600 426,504 475,521
Other Charges 475 26,887 925 925
Transfers to other funds 83,421 121,111 91,650 75,700
Capital Outlay 229,600 31,413 57,000 102,000
Total Expenditures 1,438,706 1,401,987 1,372,810 1,478,849
Unencumbered Cash Balance 708,151 682,716 686,706 584,358

2017 Budget City of Winfield Page 33 ~~~~~~~~~~~~~~~~~~~~~~~~~~~~~~~~~~~~~~~~~~~~~~~~~~~~~~~~~~~~~~~~~~~~~~~~~~~~~~~
~~~~~~~~~~~~~~~~~~~~~~~~~~~~~~~~~~~~~~~~~~~~~~~~~~~~~~~~~~~~~~~~~~~~~~~~~~~~~~~
REVENUE DETAIL AND EXPENDITURE SUMMARY
WASTEWATER – 413
2014 2015 2016 2017
Revenues Description Actual Actual Revised Request 413.000.461100 Investment Interest 1,179 775 850 1,000 413.000.468100 Refunds of Expenditures 0 32 0 0 413.000.468200 Miscellaneous Income 9,092 8,178 6,000 6,500 413.000.468210 Discount Income 67 79 80 80 413.000.468300 Reimbursement For Services 1,660 4,816 15,000 6,000 413.000.469500 Adjustment For A/R Financing (5,756) (8,713) 0 0 413.000.471300 Sewer Charges 1,939,683 1,882,116 1,880,000 1,900,000 413.000.471400 Extra Sewer Charges 320 510 100 100 413.000.471500 Vet's Home Pump Station Charges 68,400 60,059 92,000 92,000 413.000.481100 Sale of Equipment 0 0 500 0 413.000.481300 Sale of Scrap 0 16 0 0 413.000.481400 Sales of Inventory/Supplies (411) 4 0 0
Total Revenues 2,014,234 1,947,872 1,994,530 2,005,680
Prior Year Revenue 357,807 267,906 218,124 123,572
Total Revenues Available 2,372,041 2,215,778 2,212,654 2,129,252
Expenditures
Personal Services 616,590 689,896 686,602 712,128
Contractual Services 303,788 280,082 268,461 289,011
Commodities 265,118 253,948 300,530 346,735
Other Charges 623 604 950 1,050
Transfers to other Funds 100,000 25,000 90,000 80,000
Capital Outlay 269,777 199,886 194,300 150,100
Debt Redemption 548,239 548,238 548,239 548,239
Total Expenditures 2,104,135 1,997,654 2,089,082 2,127,263
Unencumbered Cash Balance 267,906 218,124 123,572 1,989
STORMWATER DRAINAGE FUND - 414
2014 2015 2016 2017
Revenues Description Actual Actual Revised Request 414.000.461100 Investment Interest 478 697 700 750 414.000.469500 Adjustment for A/R Financing (2,342) 1,215 0 0 414.000.471900 Storm water Drainage Fees 150,587 150,389 151,000 151,000
Total Revenues 148,723 152,301 151,700 151,750
Prior Year Revenue 164,229 169,892 245,614 266,264
Total Revenues Available 312,952 322,193 397,314 418,014
Expenditures
Contractual Services 6,257 900 51,200 51,200
Commodities 23,165 55,679 59,850 59,850
Transfers 113,638 20,000 20,000 20,000
Total Expenditures 143,060 76,579 131,050 131,050
Unencumbered Cash Balance 169,892 245,614 266,264 286,964
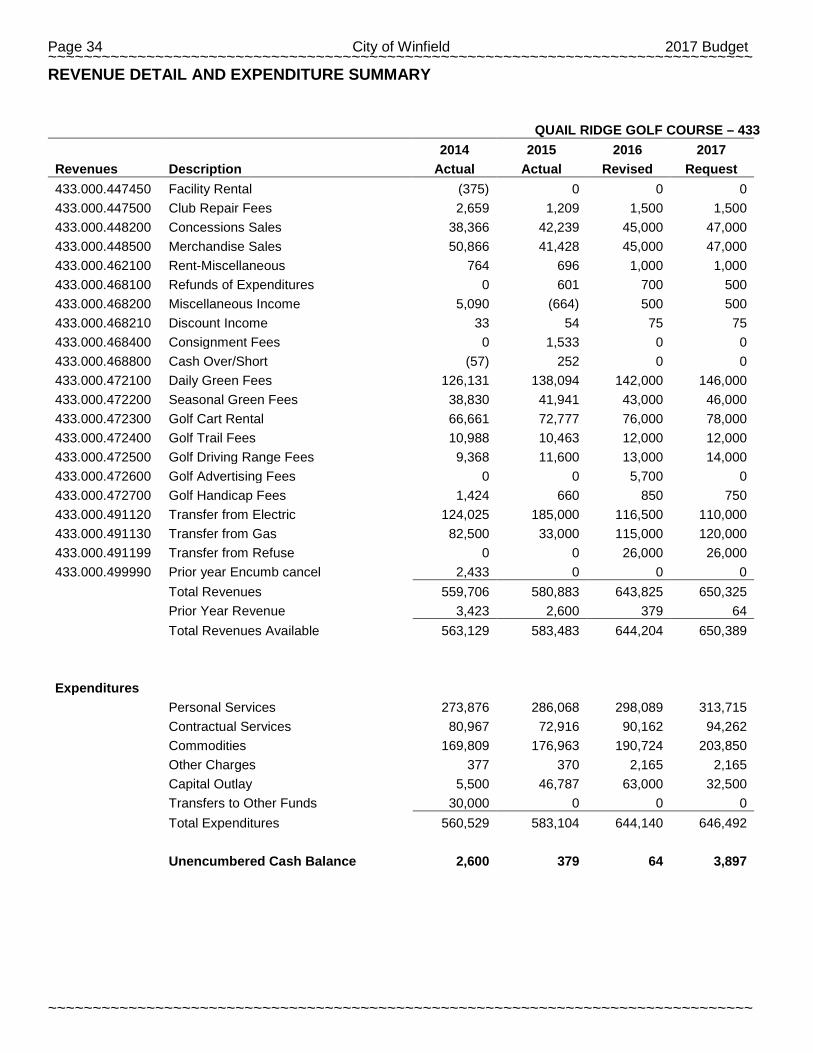
Page 34 City of Winfield 2017 Budget ~~~~~~~~~~~~~~~~~~~~~~~~~~~~~~~~~~~~~~~~~~~~~~~~~~~~~~~~~~~~~~~~~~~~~~~~~~~~~~~
~~~~~~~~~~~~~~~~~~~~~~~~~~~~~~~~~~~~~~~~~~~~~~~~~~~~~~~~~~~~~~~~~~~~~~~~~~~~~~~
REVENUE DETAIL AND EXPENDITURE SUMMARY
QUAIL RIDGE GOLF COURSE – 433
2014 2015 2016 2017
Revenues Description Actual Actual Revised Request 433.000.447450 Facility Rental (375) 0 0 0 433.000.447500 Club Repair Fees 2,659 1,209 1,500 1,500 433.000.448200 Concessions Sales 38,366 42,239 45,000 47,000 433.000.448500 Merchandise Sales 50,866 41,428 45,000 47,000 433.000.462100 Rent-Miscellaneous 764 696 1,000 1,000 433.000.468100 Refunds of Expenditures 0 601 700 500 433.000.468200 Miscellaneous Income 5,090 (664) 500 500 433.000.468210 Discount Income 33 54 75 75 433.000.468400 Consignment Fees 0 1,533 0 0 433.000.468800 Cash Over/Short (57) 252 0 0 433.000.472100 Daily Green Fees 126,131 138,094 142,000 146,000 433.000.472200 Seasonal Green Fees 38,830 41,941 43,000 46,000 433.000.472300 Golf Cart Rental 66,661 72,777 76,000 78,000 433.000.472400 Golf Trail Fees 10,988 10,463 12,000 12,000 433.000.472500 Golf Driving Range Fees 9,368 11,600 13,000 14,000 433.000.472600 Golf Advertising Fees 0 0 5,700 0 433.000.472700 Golf Handicap Fees 1,424 660 850 750 433.000.491120 Transfer from Electric 124,025 185,000 116,500 110,000 433.000.491130 Transfer from Gas 82,500 33,000 115,000 120,000 433.000.491199 Transfer from Refuse 0 0 26,000 26,000 433.000.499990 Prior year Encumb cancel 2,433 0 0 0
Total Revenues 559,706 580,883 643,825 650,325
Prior Year Revenue 3,423 2,600 379 64
Total Revenues Available 563,129 583,483 644,204 650,389
Expenditures
Personal Services 273,876 286,068 298,089 313,715
Contractual Services 80,967 72,916 90,162 94,262
Commodities 169,809 176,963 190,724 203,850
Other Charges 377 370 2,165 2,165
Capital Outlay 5,500 46,787 63,000 32,500
Transfers to Other Funds 30,000 0 0 0
Total Expenditures 560,529 583,104 644,140 646,492
Unencumbered Cash Balance 2,600 379 64 3,897
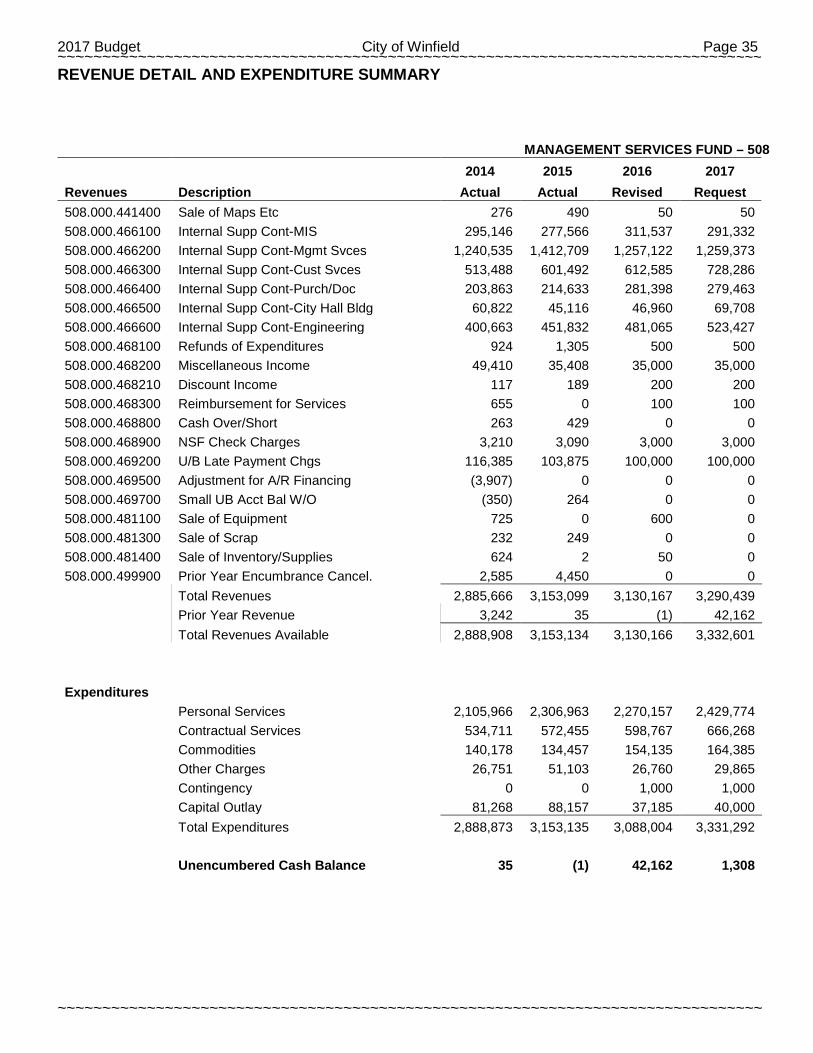
2017 Budget City of Winfield Page 35 ~~~~~~~~~~~~~~~~~~~~~~~~~~~~~~~~~~~~~~~~~~~~~~~~~~~~~~~~~~~~~~~~~~~~~~~~~~~~~~~
~~~~~~~~~~~~~~~~~~~~~~~~~~~~~~~~~~~~~~~~~~~~~~~~~~~~~~~~~~~~~~~~~~~~~~~~~~~~~~~
REVENUE DETAIL AND EXPENDITURE SUMMARY
MANAGEMENT SERVICES FUND – 508
2014 2015 2016 2017
Revenues Description Actual Actual Revised Request 508.000.441400 Sale of Maps Etc 276 490 50 50 508.000.466100 Internal Supp Cont-MIS 295,146 277,566 311,537 291,332 508.000.466200 Internal Supp Cont-Mgmt Svces 1,240,535 1,412,709 1,257,122 1,259,373 508.000.466300 Internal Supp Cont-Cust Svces 513,488 601,492 612,585 728,286 508.000.466400 Internal Supp Cont-Purch/Doc 203,863 214,633 281,398 279,463 508.000.466500 Internal Supp Cont-City Hall Bldg 60,822 45,116 46,960 69,708 508.000.466600 Internal Supp Cont-Engineering 400,663 451,832 481,065 523,427 508.000.468100 Refunds of Expenditures 924 1,305 500 500 508.000.468200 Miscellaneous Income 49,410 35,408 35,000 35,000 508.000.468210 Discount Income 117 189 200 200 508.000.468300 Reimbursement for Services 655 0 100 100 508.000.468800 Cash Over/Short 263 429 0 0 508.000.468900 NSF Check Charges 3,210 3,090 3,000 3,000 508.000.469200 U/B Late Payment Chgs 116,385 103,875 100,000 100,000 508.000.469500 Adjustment for A/R Financing (3,907) 0 0 0 508.000.469700 Small UB Acct Bal W/O (350) 264 0 0 508.000.481100 Sale of Equipment 725 0 600 0 508.000.481300 Sale of Scrap 232 249 0 0 508.000.481400 Sale of Inventory/Supplies 624 2 50 0 508.000.499900 Prior Year Encumbrance Cancel. 2,585 4,450 0 0 Total Revenues 2,885,666 3,153,099 3,130,167 3,290,439 Prior Year Revenue 3,242 35 (1) 42,162 Total Revenues Available 2,888,908 3,153,134 3,130,166 3,332,601
Expenditures
Personal Services 2,105,966 2,306,963 2,270,157 2,429,774
Contractual Services 534,711 572,455 598,767 666,268
Commodities 140,178 134,457 154,135 164,385
Other Charges 26,751 51,103 26,760 29,865
Contingency 0 0 1,000 1,000
Capital Outlay 81,268 88,157 37,185 40,000
Total Expenditures 2,888,873 3,153,135 3,088,004 3,331,292
Unencumbered Cash Balance 35 (1) 42,162 1,308
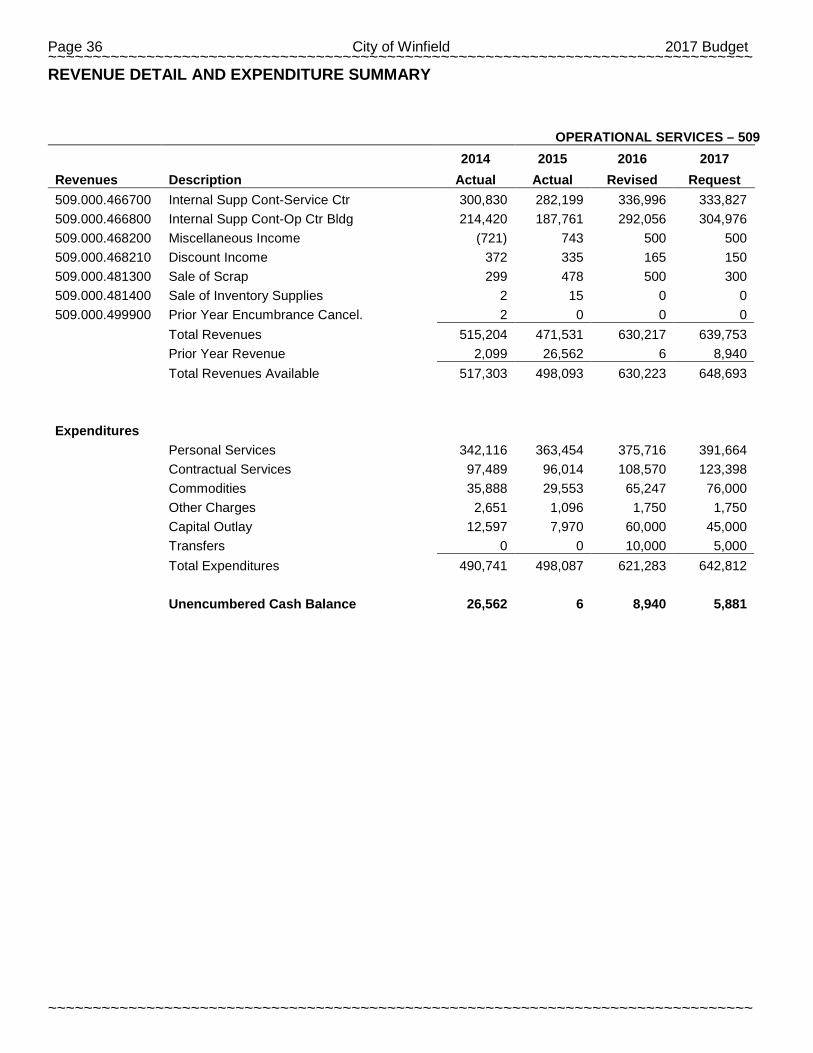
Page 36 City of Winfield 2017 Budget ~~~~~~~~~~~~~~~~~~~~~~~~~~~~~~~~~~~~~~~~~~~~~~~~~~~~~~~~~~~~~~~~~~~~~~~~~~~~~~~
~~~~~~~~~~~~~~~~~~~~~~~~~~~~~~~~~~~~~~~~~~~~~~~~~~~~~~~~~~~~~~~~~~~~~~~~~~~~~~~
REVENUE DETAIL AND EXPENDITURE SUMMARY
OPERATIONAL SERVICES – 509
2014 2015 2016 2017
Revenues Description Actual Actual Revised Request 509.000.466700 Internal Supp Cont-Service Ctr 300,830 282,199 336,996 333,827 509.000.466800 Internal Supp Cont-Op Ctr Bldg 214,420 187,761 292,056 304,976 509.000.468200 Miscellaneous Income (721) 743 500 500 509.000.468210 Discount Income 372 335 165 150 509.000.481300 Sale of Scrap 299 478 500 300 509.000.481400 Sale of Inventory Supplies 2 15 0 0 509.000.499900 Prior Year Encumbrance Cancel. 2 0 0 0
Total Revenues 515,204 471,531 630,217 639,753
Prior Year Revenue 2,099 26,562 6 8,940
Total Revenues Available 517,303 498,093 630,223 648,693
Expenditures
Personal Services 342,116 363,454 375,716 391,664
Contractual Services 97,489 96,014 108,570 123,398
Commodities 35,888 29,553 65,247 76,000
Other Charges 2,651 1,096 1,750 1,750
Capital Outlay 12,597 7,970 60,000 45,000
Transfers 0 0 10,000 5,000
Total Expenditures 490,741 498,087 621,283 642,812
Unencumbered Cash Balance 26,562 6 8,940 5,881
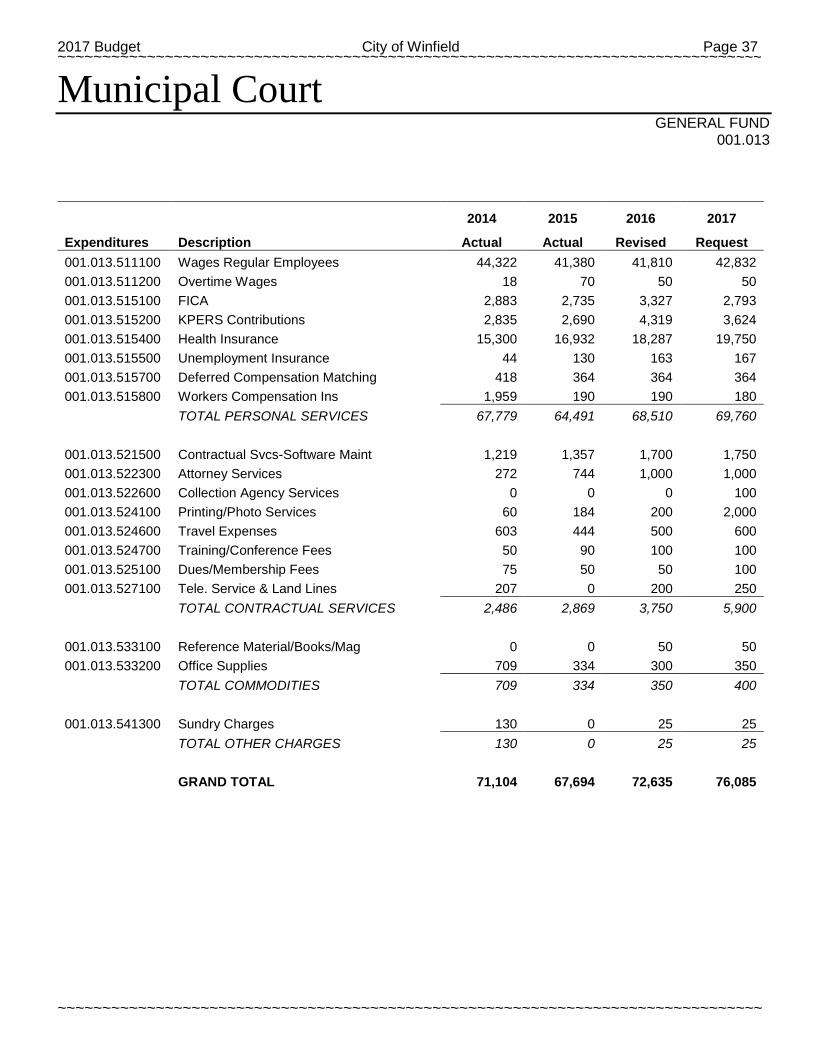
2017 Budget City of Winfield Page 37 ~~~~~~~~~~~~~~~~~~~~~~~~~~~~~~~~~~~~~~~~~~~~~~~~~~~~~~~~~~~~~~~~~~~~~~~~~~~~~~~
~~~~~~~~~~~~~~~~~~~~~~~~~~~~~~~~~~~~~~~~~~~~~~~~~~~~~~~~~~~~~~~~~~~~~~~~~~~~~~~
Municipal Court GENERAL FUND
001.013
2014 2015 2016 2017
Expenditures Description Actual Actual Revised Request 001.013.511100 Wages Regular Employees 44,322 41,380 41,810 42,832 001.013.511200 Overtime Wages 18 70 50 50 001.013.515100 FICA 2,883 2,735 3,327 2,793 001.013.515200 KPERS Contributions 2,835 2,690 4,319 3,624 001.013.515400 Health Insurance 15,300 16,932 18,287 19,750 001.013.515500 Unemployment Insurance 44 130 163 167 001.013.515700 Deferred Compensation Matching 418 364 364 364 001.013.515800 Workers Compensation Ins 1,959 190 190 180
TOTAL PERSONAL SERVICES 67,779 64,491 68,510 69,760
001.013.521500 Contractual Svcs-Software Maint 1,219 1,357 1,700 1,750 001.013.522300 Attorney Services 272 744 1,000 1,000 001.013.522600 Collection Agency Services 0 0 0 100 001.013.524100 Printing/Photo Services 60 184 200 2,000 001.013.524600 Travel Expenses 603 444 500 600 001.013.524700 Training/Conference Fees 50 90 100 100 001.013.525100 Dues/Membership Fees 75 50 50 100 001.013.527100 Tele. Service & Land Lines 207 0 200 250
TOTAL CONTRACTUAL SERVICES 2,486 2,869 3,750 5,900
001.013.533100 Reference Material/Books/Mag 0 0 50 50 001.013.533200 Office Supplies 709 334 300 350
TOTAL COMMODITIES 709 334 350 400
001.013.541300 Sundry Charges 130 0 25 25
TOTAL OTHER CHARGES 130 0 25 25
GRAND TOTAL 71,104 67,694 72,635 76,085
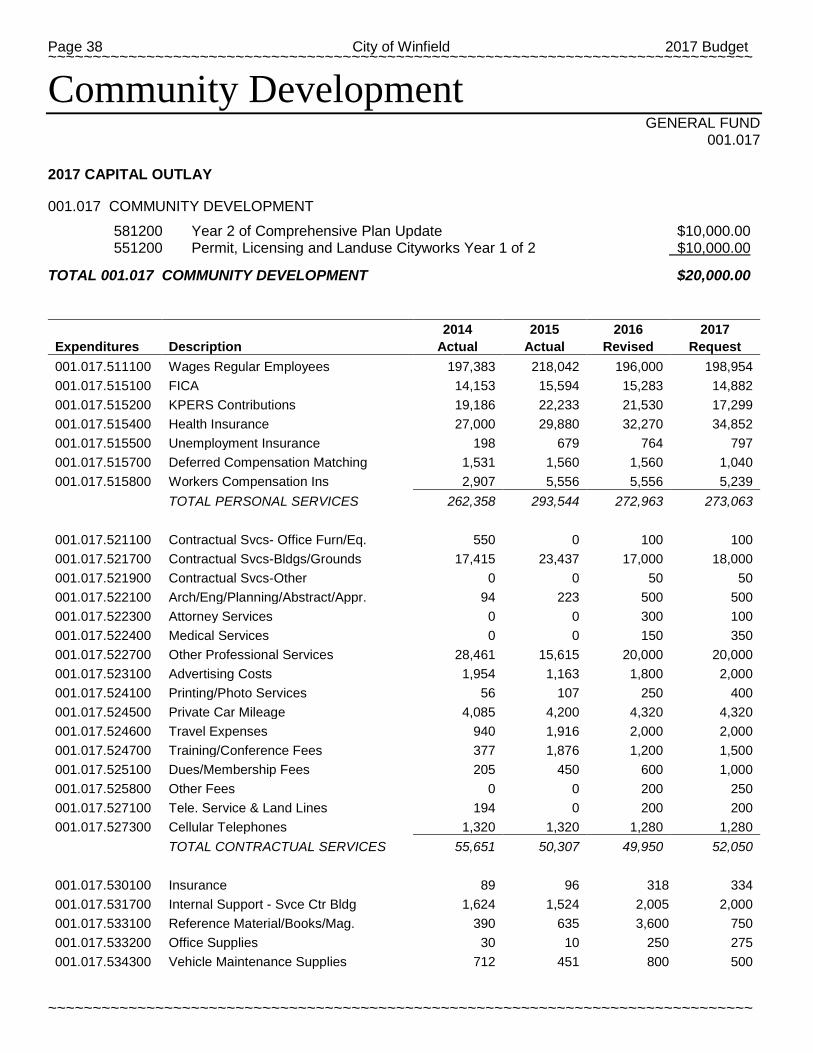
Page 38 City of Winfield 2017 Budget ~~~~~~~~~~~~~~~~~~~~~~~~~~~~~~~~~~~~~~~~~~~~~~~~~~~~~~~~~~~~~~~~~~~~~~~~~~~~~~~
~~~~~~~~~~~~~~~~~~~~~~~~~~~~~~~~~~~~~~~~~~~~~~~~~~~~~~~~~~~~~~~~~~~~~~~~~~~~~~~
Community Development GENERAL FUND
001.017
2017 CAPITAL OUTLAY 001.017 COMMUNITY DEVELOPMENT
581200 Year 2 of Comprehensive Plan Update $10,000.00 551200 Permit, Licensing and Landuse Cityworks Year 1 of 2 $10,000.00
TOTAL 001.017 COMMUNITY DEVELOPMENT $20,000.00
2014 2015 2016 2017
Expenditures Description Actual Actual Revised Request 001.017.511100 Wages Regular Employees 197,383 218,042 196,000 198,954 001.017.515100 FICA 14,153 15,594 15,283 14,882 001.017.515200 KPERS Contributions 19,186 22,233 21,530 17,299 001.017.515400 Health Insurance 27,000 29,880 32,270 34,852 001.017.515500 Unemployment Insurance 198 679 764 797 001.017.515700 Deferred Compensation Matching 1,531 1,560 1,560 1,040 001.017.515800 Workers Compensation Ins 2,907 5,556 5,556 5,239
TOTAL PERSONAL SERVICES 262,358 293,544 272,963 273,063
001.017.521100 Contractual Svcs- Office Furn/Eq. 550 0 100 100 001.017.521700 Contractual Svcs-Bldgs/Grounds 17,415 23,437 17,000 18,000 001.017.521900 Contractual Svcs-Other 0 0 50 50 001.017.522100 Arch/Eng/Planning/Abstract/Appr. 94 223 500 500 001.017.522300 Attorney Services 0 0 300 100 001.017.522400 Medical Services 0 0 150 350 001.017.522700 Other Professional Services 28,461 15,615 20,000 20,000 001.017.523100 Advertising Costs 1,954 1,163 1,800 2,000 001.017.524100 Printing/Photo Services 56 107 250 400 001.017.524500 Private Car Mileage 4,085 4,200 4,320 4,320 001.017.524600 Travel Expenses 940 1,916 2,000 2,000 001.017.524700 Training/Conference Fees 377 1,876 1,200 1,500 001.017.525100 Dues/Membership Fees 205 450 600 1,000 001.017.525800 Other Fees 0 0 200 250 001.017.527100 Tele. Service & Land Lines 194 0 200 200 001.017.527300 Cellular Telephones 1,320 1,320 1,280 1,280
TOTAL CONTRACTUAL SERVICES 55,651 50,307 49,950 52,050
001.017.530100 Insurance 89 96 318 334 001.017.531700 Internal Support - Svce Ctr Bldg 1,624 1,524 2,005 2,000 001.017.533100 Reference Material/Books/Mag. 390 635 3,600 750 001.017.533200 Office Supplies 30 10 250 275 001.017.534300 Vehicle Maintenance Supplies 712 451 800 500
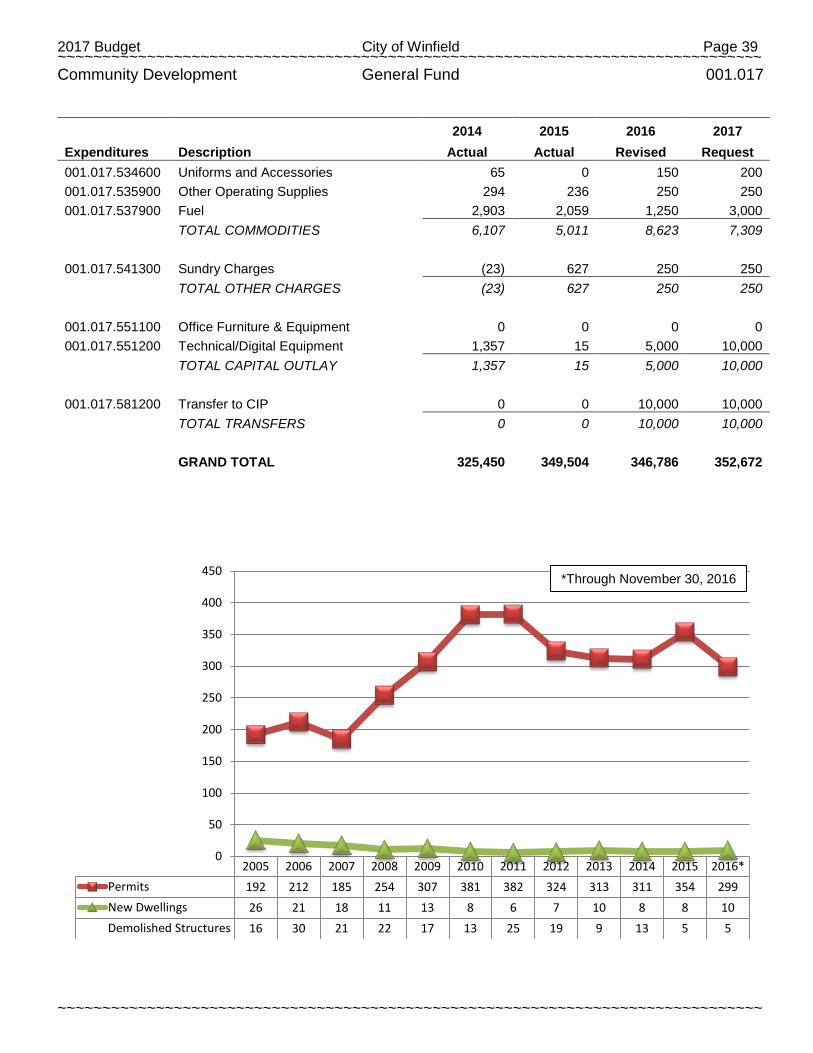
2017 Budget City of Winfield Page 39 ~~~~~~~~~~~~~~~~~~~~~~~~~~~~~~~~~~~~~~~~~~~~~~~~~~~~~~~~~~~~~~~~~~~~~~~~~~~~~~~
~~~~~~~~~~~~~~~~~~~~~~~~~~~~~~~~~~~~~~~~~~~~~~~~~~~~~~~~~~~~~~~~~~~~~~~~~~~~~~~
Community Development General Fund 001.017
2014 2015 2016 2017
Expenditures Description Actual Actual Revised Request 001.017.534600 Uniforms and Accessories 65 0 150 200 001.017.535900 Other Operating Supplies 294 236 250 250 001.017.537900 Fuel 2,903 2,059 1,250 3,000
TOTAL COMMODITIES 6,107 5,011 8,623 7,309
001.017.541300 Sundry Charges (23) 627 250 250
TOTAL OTHER CHARGES (23) 627 250 250
001.017.551100 Office Furniture & Equipment 0 0 0 0 001.017.551200 Technical/Digital Equipment 1,357 15 5,000 10,000
TOTAL CAPITAL OUTLAY 1,357 15 5,000 10,000
001.017.581200 Transfer to CIP 0 0 10,000 10,000
TOTAL TRANSFERS 0 0 10,000 10,000
GRAND TOTAL 325,450 349,504 346,786 352,672
2005 2006 2007 2008 2009 2010 2011 2012 2013 2014 2015 2016* Permits 192 212 185 254 307 381 382 324 313 311 354 299 New Dwellings 26 21 18 11 13 8 6 7 10 8 8 10 Demolished Structures 16 30 21 22 17 13 25 19 9 13 5 5
0
50
100
150
200
250
300
350
400
450 *Through November 30, 2016
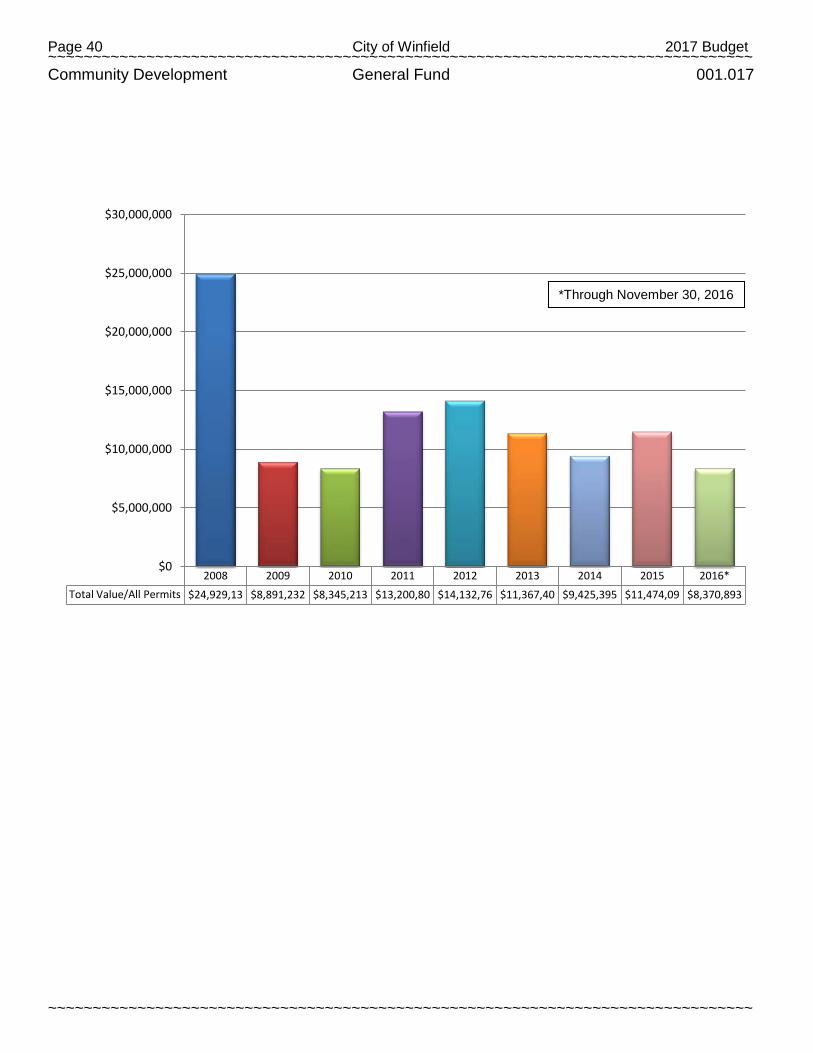
Page 40 City of Winfield 2017 Budget ~~~~~~~~~~~~~~~~~~~~~~~~~~~~~~~~~~~~~~~~~~~~~~~~~~~~~~~~~~~~~~~~~~~~~~~~~~~~~~~
~~~~~~~~~~~~~~~~~~~~~~~~~~~~~~~~~~~~~~~~~~~~~~~~~~~~~~~~~~~~~~~~~~~~~~~~~~~~~~~
Community Development General Fund 001.017
2008 2009 2010 2011 2012 2013 2014 2015 2016* Total Value/All Permits $24,929,13 $8,891,232 $8,345,213 $13,200,80 $14,132,76 $11,367,40 $9,425,395 $11,474,09 $8,370,893
$0
$5,000,000
$10,000,000
$15,000,000
$20,000,000
$25,000,000
$30,000,000
*Through November 30, 2016
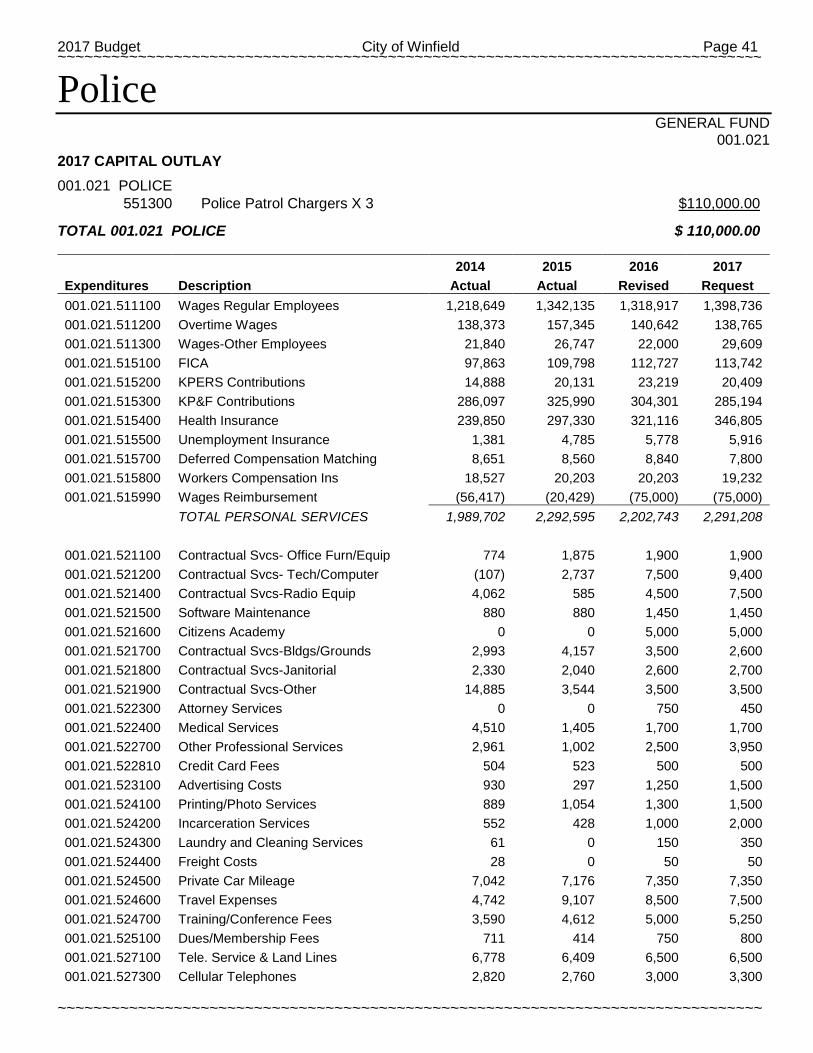
2017 Budget City of Winfield Page 41 ~~~~~~~~~~~~~~~~~~~~~~~~~~~~~~~~~~~~~~~~~~~~~~~~~~~~~~~~~~~~~~~~~~~~~~~~~~~~~~~
~~~~~~~~~~~~~~~~~~~~~~~~~~~~~~~~~~~~~~~~~~~~~~~~~~~~~~~~~~~~~~~~~~~~~~~~~~~~~~~
Police GENERAL FUND
001.021
2017 CAPITAL OUTLAY
001.021 POLICE 551300 Police Patrol Chargers X 3 $110,000.00
TOTAL 001.021 POLICE $ 110,000.00
2014 2015 2016 2017
Expenditures Description Actual Actual Revised Request 001.021.511100 Wages Regular Employees 1,218,649 1,342,135 1,318,917 1,398,736 001.021.511200 Overtime Wages 138,373 157,345 140,642 138,765 001.021.511300 Wages-Other Employees 21,840 26,747 22,000 29,609 001.021.515100 FICA 97,863 109,798 112,727 113,742 001.021.515200 KPERS Contributions 14,888 20,131 23,219 20,409 001.021.515300 KP&F Contributions 286,097 325,990 304,301 285,194 001.021.515400 Health Insurance 239,850 297,330 321,116 346,805 001.021.515500 Unemployment Insurance 1,381 4,785 5,778 5,916 001.021.515700 Deferred Compensation Matching 8,651 8,560 8,840 7,800 001.021.515800 Workers Compensation Ins 18,527 20,203 20,203 19,232 001.021.515990 Wages Reimbursement (56,417) (20,429) (75,000) (75,000)
TOTAL PERSONAL SERVICES 1,989,702 2,292,595 2,202,743 2,291,208
001.021.521100 Contractual Svcs- Office Furn/Equip 774 1,875 1,900 1,900 001.021.521200 Contractual Svcs- Tech/Computer (107) 2,737 7,500 9,400 001.021.521400 Contractual Svcs-Radio Equip 4,062 585 4,500 7,500 001.021.521500 Software Maintenance 880 880 1,450 1,450 001.021.521600 Citizens Academy 0 0 5,000 5,000 001.021.521700 Contractual Svcs-Bldgs/Grounds 2,993 4,157 3,500 2,600 001.021.521800 Contractual Svcs-Janitorial 2,330 2,040 2,600 2,700 001.021.521900 Contractual Svcs-Other 14,885 3,544 3,500 3,500 001.021.522300 Attorney Services 0 0 750 450 001.021.522400 Medical Services 4,510 1,405 1,700 1,700 001.021.522700 Other Professional Services 2,961 1,002 2,500 3,950 001.021.522810 Credit Card Fees 504 523 500 500 001.021.523100 Advertising Costs 930 297 1,250 1,500 001.021.524100 Printing/Photo Services 889 1,054 1,300 1,500 001.021.524200 Incarceration Services 552 428 1,000 2,000 001.021.524300 Laundry and Cleaning Services 61 0 150 350 001.021.524400 Freight Costs 28 0 50 50 001.021.524500 Private Car Mileage 7,042 7,176 7,350 7,350 001.021.524600 Travel Expenses 4,742 9,107 8,500 7,500 001.021.524700 Training/Conference Fees 3,590 4,612 5,000 5,250 001.021.525100 Dues/Membership Fees 711 414 750 800 001.021.527100 Tele. Service & Land Lines 6,778 6,409 6,500 6,500 001.021.527300 Cellular Telephones 2,820 2,760 3,000 3,300
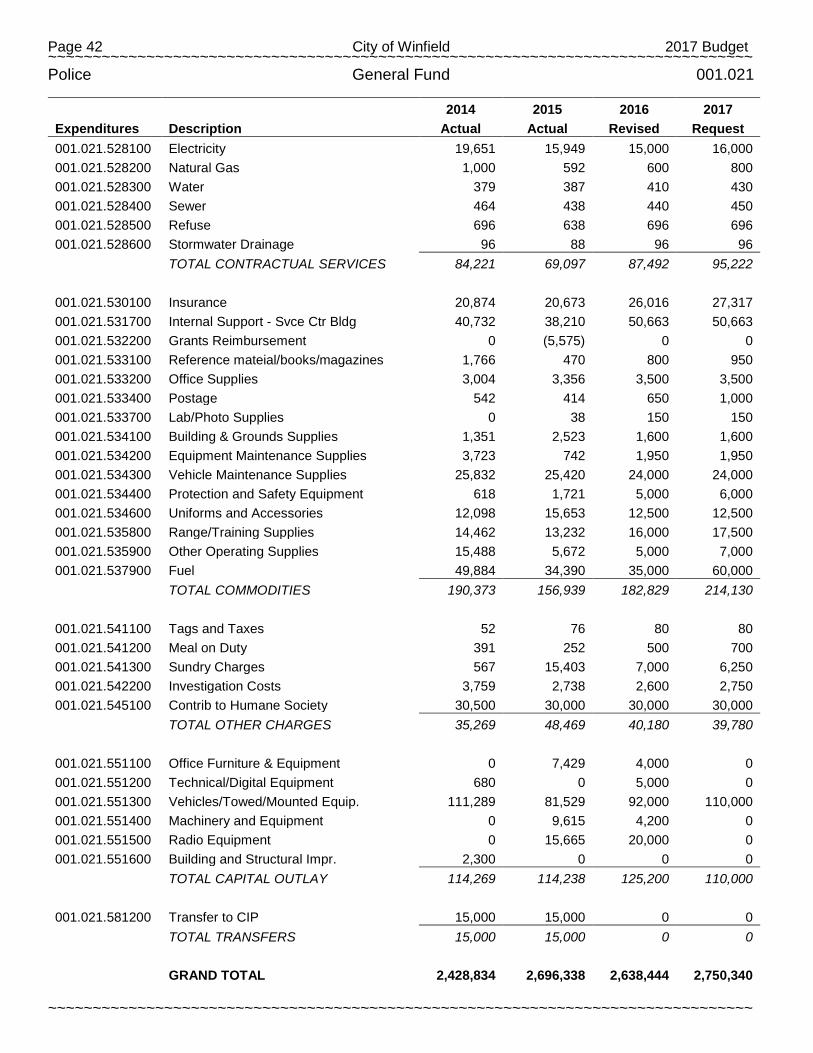
Page 42 City of Winfield 2017 Budget ~~~~~~~~~~~~~~~~~~~~~~~~~~~~~~~~~~~~~~~~~~~~~~~~~~~~~~~~~~~~~~~~~~~~~~~~~~~~~~~
~~~~~~~~~~~~~~~~~~~~~~~~~~~~~~~~~~~~~~~~~~~~~~~~~~~~~~~~~~~~~~~~~~~~~~~~~~~~~~~
Police General Fund 001.021
2014 2015 2016 2017
Expenditures Description Actual Actual Revised Request 001.021.528100 Electricity 19,651 15,949 15,000 16,000 001.021.528200 Natural Gas 1,000 592 600 800 001.021.528300 Water 379 387 410 430 001.021.528400 Sewer 464 438 440 450 001.021.528500 Refuse 696 638 696 696 001.021.528600 Stormwater Drainage 96 88 96 96
TOTAL CONTRACTUAL SERVICES 84,221 69,097 87,492 95,222
001.021.530100 Insurance 20,874 20,673 26,016 27,317 001.021.531700 Internal Support - Svce Ctr Bldg 40,732 38,210 50,663 50,663 001.021.532200 Grants Reimbursement 0 (5,575) 0 0 001.021.533100 Reference mateial/books/magazines 1,766 470 800 950 001.021.533200 Office Supplies 3,004 3,356 3,500 3,500 001.021.533400 Postage 542 414 650 1,000 001.021.533700 Lab/Photo Supplies 0 38 150 150 001.021.534100 Building & Grounds Supplies 1,351 2,523 1,600 1,600 001.021.534200 Equipment Maintenance Supplies 3,723 742 1,950 1,950 001.021.534300 Vehicle Maintenance Supplies 25,832 25,420 24,000 24,000 001.021.534400 Protection and Safety Equipment 618 1,721 5,000 6,000 001.021.534600 Uniforms and Accessories 12,098 15,653 12,500 12,500 001.021.535800 Range/Training Supplies 14,462 13,232 16,000 17,500 001.021.535900 Other Operating Supplies 15,488 5,672 5,000 7,000 001.021.537900 Fuel 49,884 34,390 35,000 60,000
TOTAL COMMODITIES 190,373 156,939 182,829 214,130
001.021.541100 Tags and Taxes 52 76 80 80 001.021.541200 Meal on Duty 391 252 500 700 001.021.541300 Sundry Charges 567 15,403 7,000 6,250 001.021.542200 Investigation Costs 3,759 2,738 2,600 2,750 001.021.545100 Contrib to Humane Society 30,500 30,000 30,000 30,000
TOTAL OTHER CHARGES 35,269 48,469 40,180 39,780
001.021.551100 Office Furniture & Equipment 0 7,429 4,000 0 001.021.551200 Technical/Digital Equipment 680 0 5,000 0 001.021.551300 Vehicles/Towed/Mounted Equip. 111,289 81,529 92,000 110,000 001.021.551400 Machinery and Equipment 0 9,615 4,200 0 001.021.551500 Radio Equipment 0 15,665 20,000 0 001.021.551600 Building and Structural Impr. 2,300 0 0 0
TOTAL CAPITAL OUTLAY 114,269 114,238 125,200 110,000
001.021.581200 Transfer to CIP 15,000 15,000 0 0
TOTAL TRANSFERS 15,000 15,000 0 0
GRAND TOTAL 2,428,834 2,696,338 2,638,444 2,750,340
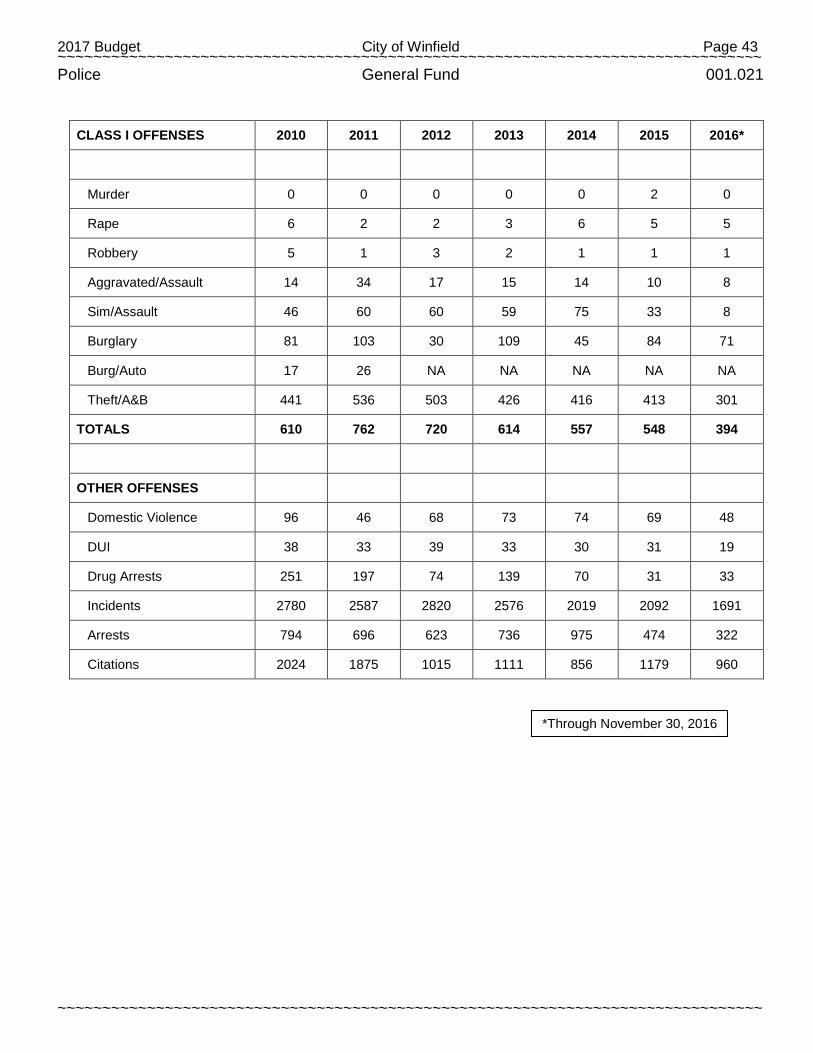
2017 Budget City of Winfield Page 43 ~~~~~~~~~~~~~~~~~~~~~~~~~~~~~~~~~~~~~~~~~~~~~~~~~~~~~~~~~~~~~~~~~~~~~~~~~~~~~~~
~~~~~~~~~~~~~~~~~~~~~~~~~~~~~~~~~~~~~~~~~~~~~~~~~~~~~~~~~~~~~~~~~~~~~~~~~~~~~~~
Police General Fund 001.021
CLASS I OFFENSES 2010 2011 2012 2013 2014 2015 2016*
Murder 0 0 0 0 0 2 0
Rape 6 2 2 3 6 5 5
Robbery 5 1 3 2 1 1 1
Aggravated/Assault 14 34 17 15 14 10 8
Sim/Assault 46 60 60 59 75 33 8
Burglary 81 103 30 109 45 84 71
Burg/Auto 17 26 NA NA NA NA NA
Theft/A&B 441 536 503 426 416 413 301
TOTALS 610 762 720 614 557 548 394
OTHER OFFENSES
Domestic Violence 96 46 68 73 74 69 48
DUI 38 33 39 33 30 31 19
Drug Arrests 251 197 74 139 70 31 33
Incidents 2780 2587 2820 2576 2019 2092 1691
Arrests 794 696 623 736 975 474 322
Citations 2024 1875 1015 1111 856 1179 960
*Through November 30, 2016
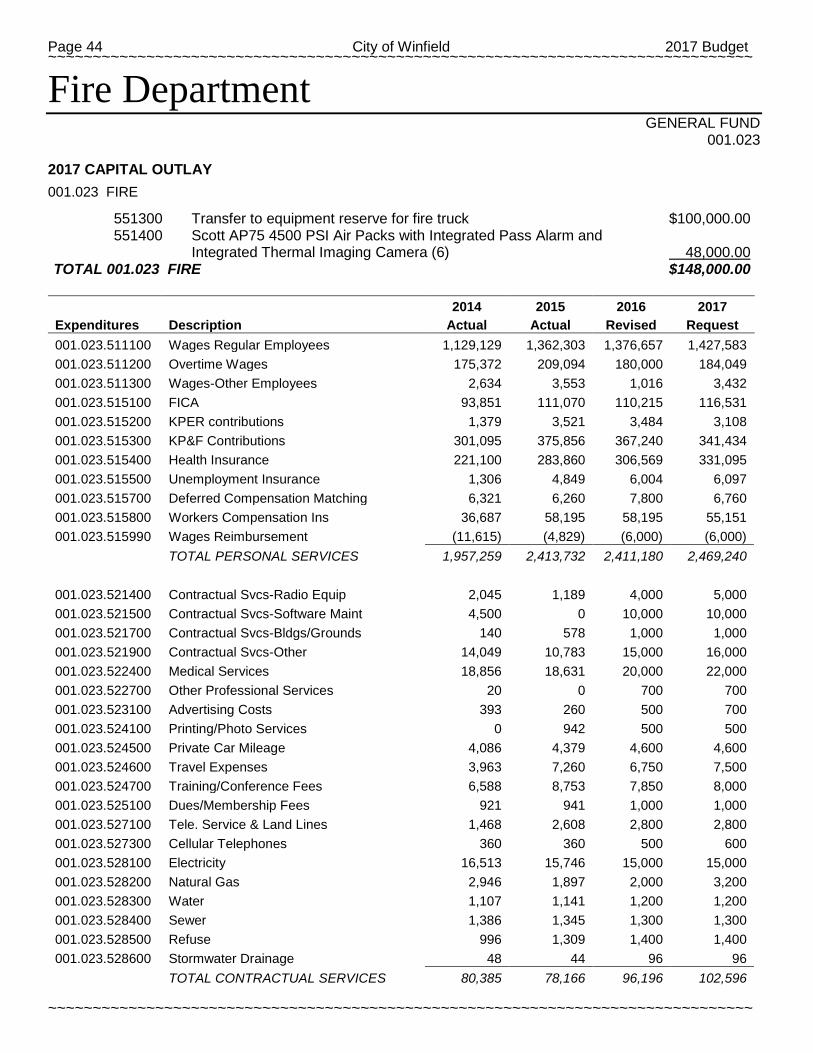
Page 44 City of Winfield 2017 Budget ~~~~~~~~~~~~~~~~~~~~~~~~~~~~~~~~~~~~~~~~~~~~~~~~~~~~~~~~~~~~~~~~~~~~~~~~~~~~~~~
~~~~~~~~~~~~~~~~~~~~~~~~~~~~~~~~~~~~~~~~~~~~~~~~~~~~~~~~~~~~~~~~~~~~~~~~~~~~~~~
Fire Department GENERAL FUND
001.023
2017 CAPITAL OUTLAY
001.023 FIRE
551300 Transfer to equipment reserve for fire truck $100,000.00 551400 Scott AP75 4500 PSI Air Packs with Integrated Pass Alarm and Integrated Thermal Imaging Camera (6) 48,000.00 TOTAL 001.023 FIRE $148,000.00
2014 2015 2016 2017
Expenditures Description Actual Actual Revised Request 001.023.511100 Wages Regular Employees 1,129,129 1,362,303 1,376,657 1,427,583 001.023.511200 Overtime Wages 175,372 209,094 180,000 184,049 001.023.511300 Wages-Other Employees 2,634 3,553 1,016 3,432 001.023.515100 FICA 93,851 111,070 110,215 116,531 001.023.515200 KPER contributions 1,379 3,521 3,484 3,108 001.023.515300 KP&F Contributions 301,095 375,856 367,240 341,434 001.023.515400 Health Insurance 221,100 283,860 306,569 331,095 001.023.515500 Unemployment Insurance 1,306 4,849 6,004 6,097 001.023.515700 Deferred Compensation Matching 6,321 6,260 7,800 6,760 001.023.515800 Workers Compensation Ins 36,687 58,195 58,195 55,151 001.023.515990 Wages Reimbursement (11,615) (4,829) (6,000) (6,000)
TOTAL PERSONAL SERVICES 1,957,259 2,413,732 2,411,180 2,469,240
001.023.521400 Contractual Svcs-Radio Equip 2,045 1,189 4,000 5,000 001.023.521500 Contractual Svcs-Software Maint 4,500 0 10,000 10,000 001.023.521700 Contractual Svcs-Bldgs/Grounds 140 578 1,000 1,000 001.023.521900 Contractual Svcs-Other 14,049 10,783 15,000 16,000 001.023.522400 Medical Services 18,856 18,631 20,000 22,000 001.023.522700 Other Professional Services 20 0 700 700 001.023.523100 Advertising Costs 393 260 500 700 001.023.524100 Printing/Photo Services 0 942 500 500 001.023.524500 Private Car Mileage 4,086 4,379 4,600 4,600 001.023.524600 Travel Expenses 3,963 7,260 6,750 7,500 001.023.524700 Training/Conference Fees 6,588 8,753 7,850 8,000 001.023.525100 Dues/Membership Fees 921 941 1,000 1,000 001.023.527100 Tele. Service & Land Lines 1,468 2,608 2,800 2,800 001.023.527300 Cellular Telephones 360 360 500 600 001.023.528100 Electricity 16,513 15,746 15,000 15,000 001.023.528200 Natural Gas 2,946 1,897 2,000 3,200 001.023.528300 Water 1,107 1,141 1,200 1,200 001.023.528400 Sewer 1,386 1,345 1,300 1,300 001.023.528500 Refuse 996 1,309 1,400 1,400 001.023.528600 Stormwater Drainage 48 44 96 96
TOTAL CONTRACTUAL SERVICES 80,385 78,166 96,196 102,596
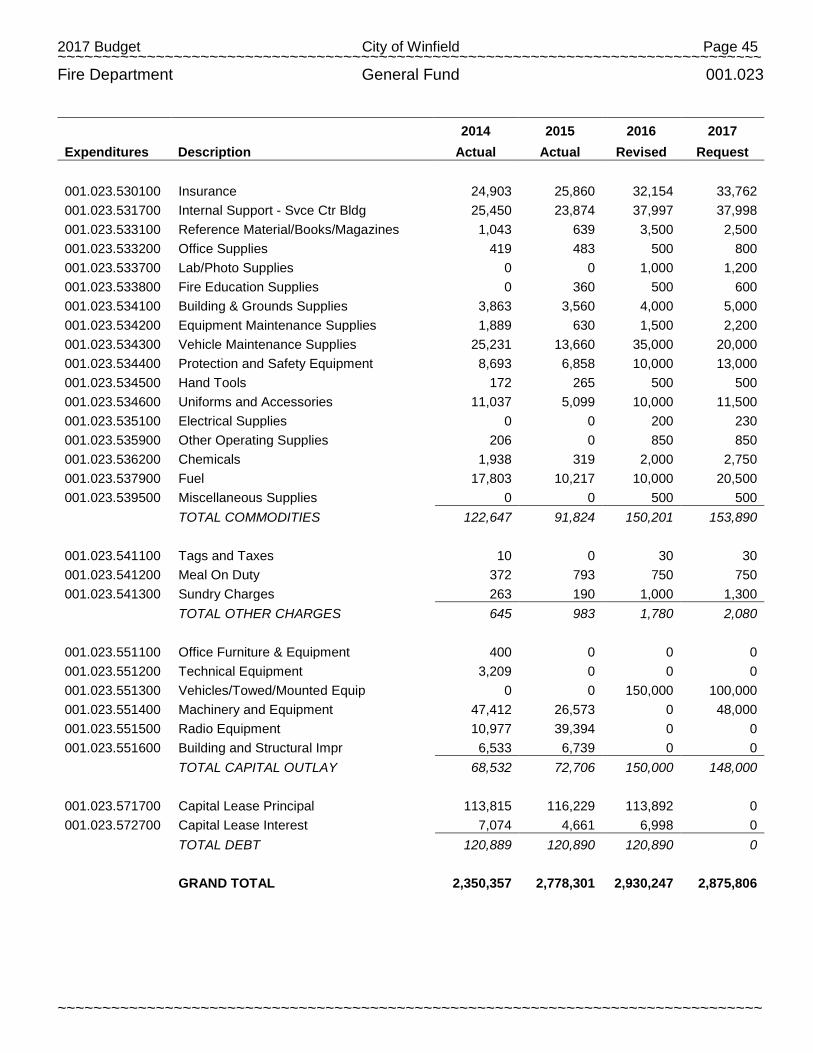
2017 Budget City of Winfield Page 45 ~~~~~~~~~~~~~~~~~~~~~~~~~~~~~~~~~~~~~~~~~~~~~~~~~~~~~~~~~~~~~~~~~~~~~~~~~~~~~~~
~~~~~~~~~~~~~~~~~~~~~~~~~~~~~~~~~~~~~~~~~~~~~~~~~~~~~~~~~~~~~~~~~~~~~~~~~~~~~~~
Fire Department General Fund 001.023
2014 2015 2016 2017
Expenditures Description Actual Actual Revised Request
001.023.530100 Insurance 24,903 25,860 32,154 33,762 001.023.531700 Internal Support - Svce Ctr Bldg 25,450 23,874 37,997 37,998 001.023.533100 Reference Material/Books/Magazines 1,043 639 3,500 2,500 001.023.533200 Office Supplies 419 483 500 800 001.023.533700 Lab/Photo Supplies 0 0 1,000 1,200 001.023.533800 Fire Education Supplies 0 360 500 600 001.023.534100 Building & Grounds Supplies 3,863 3,560 4,000 5,000 001.023.534200 Equipment Maintenance Supplies 1,889 630 1,500 2,200 001.023.534300 Vehicle Maintenance Supplies 25,231 13,660 35,000 20,000 001.023.534400 Protection and Safety Equipment 8,693 6,858 10,000 13,000 001.023.534500 Hand Tools 172 265 500 500 001.023.534600 Uniforms and Accessories 11,037 5,099 10,000 11,500 001.023.535100 Electrical Supplies 0 0 200 230 001.023.535900 Other Operating Supplies 206 0 850 850 001.023.536200 Chemicals 1,938 319 2,000 2,750 001.023.537900 Fuel 17,803 10,217 10,000 20,500 001.023.539500 Miscellaneous Supplies 0 0 500 500
TOTAL COMMODITIES 122,647 91,824 150,201 153,890
001.023.541100 Tags and Taxes 10 0 30 30 001.023.541200 Meal On Duty 372 793 750 750 001.023.541300 Sundry Charges 263 190 1,000 1,300
TOTAL OTHER CHARGES 645 983 1,780 2,080
001.023.551100 Office Furniture & Equipment 400 0 0 0 001.023.551200 Technical Equipment 3,209 0 0 0 001.023.551300 Vehicles/Towed/Mounted Equip 0 0 150,000 100,000 001.023.551400 Machinery and Equipment 47,412 26,573 0 48,000 001.023.551500 Radio Equipment 10,977 39,394 0 0 001.023.551600 Building and Structural Impr 6,533 6,739 0 0
TOTAL CAPITAL OUTLAY 68,532 72,706 150,000 148,000
001.023.571700 Capital Lease Principal 113,815 116,229 113,892 0 001.023.572700 Capital Lease Interest 7,074 4,661 6,998 0
TOTAL DEBT 120,889 120,890 120,890 0
GRAND TOTAL 2,350,357 2,778,301 2,930,247 2,875,806
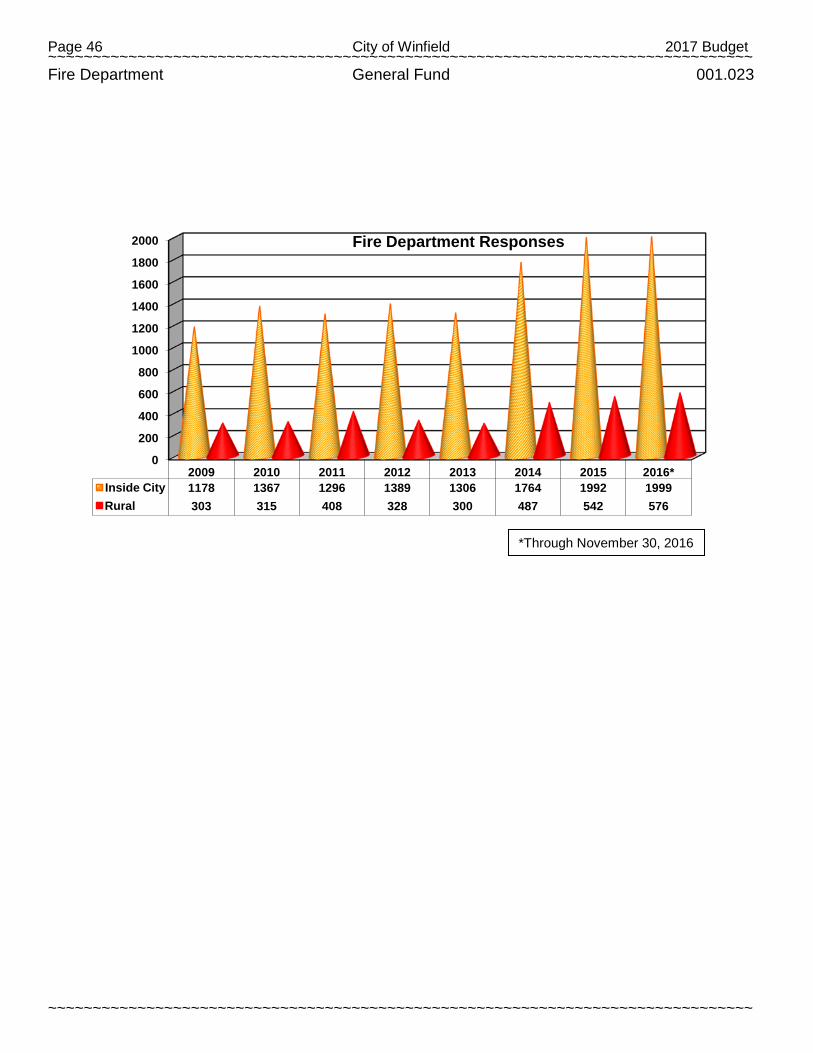
Page 46 City of Winfield 2017 Budget ~~~~~~~~~~~~~~~~~~~~~~~~~~~~~~~~~~~~~~~~~~~~~~~~~~~~~~~~~~~~~~~~~~~~~~~~~~~~~~~
~~~~~~~~~~~~~~~~~~~~~~~~~~~~~~~~~~~~~~~~~~~~~~~~~~~~~~~~~~~~~~~~~~~~~~~~~~~~~~~
Fire Department General Fund 001.023
0
200
400
600
800
1000
1200
1400
1600
1800
2000
2009 2010 2011 2012 2013 2014 2015 2016* Inside City 1178 1367 1296 1389 1306 1764 1992 1999 Rural 303 315 408 328 300 487 542 576
Fire Department Responses
*Through November 30, 2016
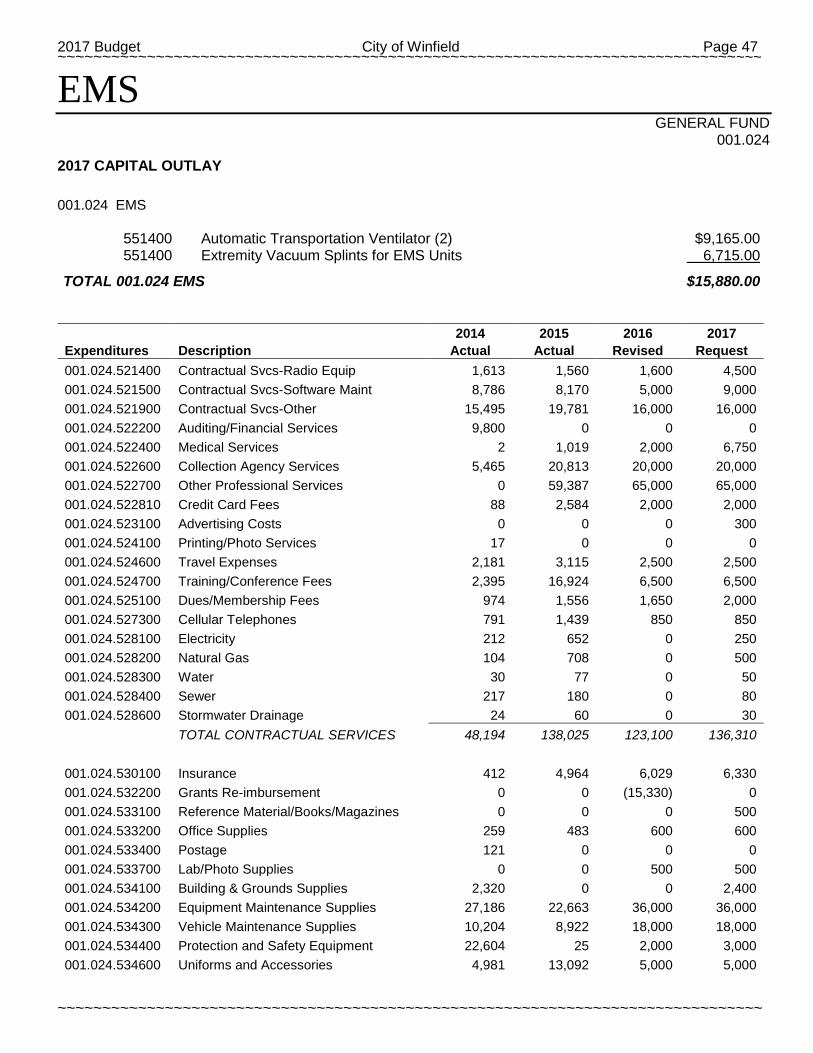
2017 Budget City of Winfield Page 47 ~~~~~~~~~~~~~~~~~~~~~~~~~~~~~~~~~~~~~~~~~~~~~~~~~~~~~~~~~~~~~~~~~~~~~~~~~~~~~~~
~~~~~~~~~~~~~~~~~~~~~~~~~~~~~~~~~~~~~~~~~~~~~~~~~~~~~~~~~~~~~~~~~~~~~~~~~~~~~~~
EMS GENERAL FUND
001.024
2017 CAPITAL OUTLAY
001.024 EMS 551400 Automatic Transportation Ventilator (2) $9,165.00 551400 Extremity Vacuum Splints for EMS Units 6,715.00
TOTAL 001.024 EMS $15,880.00
2014 2015 2016 2017
Expenditures Description Actual Actual Revised Request 001.024.521400 Contractual Svcs-Radio Equip 1,613 1,560 1,600 4,500 001.024.521500 Contractual Svcs-Software Maint 8,786 8,170 5,000 9,000 001.024.521900 Contractual Svcs-Other 15,495 19,781 16,000 16,000 001.024.522200 Auditing/Financial Services 9,800 0 0 0 001.024.522400 Medical Services 2 1,019 2,000 6,750 001.024.522600 Collection Agency Services 5,465 20,813 20,000 20,000 001.024.522700 Other Professional Services 0 59,387 65,000 65,000 001.024.522810 Credit Card Fees 88 2,584 2,000 2,000 001.024.523100 Advertising Costs 0 0 0 300 001.024.524100 Printing/Photo Services 17 0 0 0 001.024.524600 Travel Expenses 2,181 3,115 2,500 2,500 001.024.524700 Training/Conference Fees 2,395 16,924 6,500 6,500 001.024.525100 Dues/Membership Fees 974 1,556 1,650 2,000 001.024.527300 Cellular Telephones 791 1,439 850 850 001.024.528100 Electricity 212 652 0 250 001.024.528200 Natural Gas 104 708 0 500 001.024.528300 Water 30 77 0 50 001.024.528400 Sewer 217 180 0 80 001.024.528600 Stormwater Drainage 24 60 0 30
TOTAL CONTRACTUAL SERVICES 48,194 138,025 123,100 136,310
001.024.530100 Insurance 412 4,964 6,029 6,330 001.024.532200 Grants Re-imbursement 0 0 (15,330) 0 001.024.533100 Reference Material/Books/Magazines 0 0 0 500 001.024.533200 Office Supplies 259 483 600 600 001.024.533400 Postage 121 0 0 0 001.024.533700 Lab/Photo Supplies 0 0 500 500 001.024.534100 Building & Grounds Supplies 2,320 0 0 2,400 001.024.534200 Equipment Maintenance Supplies 27,186 22,663 36,000 36,000 001.024.534300 Vehicle Maintenance Supplies 10,204 8,922 18,000 18,000 001.024.534400 Protection and Safety Equipment 22,604 25 2,000 3,000 001.024.534600 Uniforms and Accessories 4,981 13,092 5,000 5,000
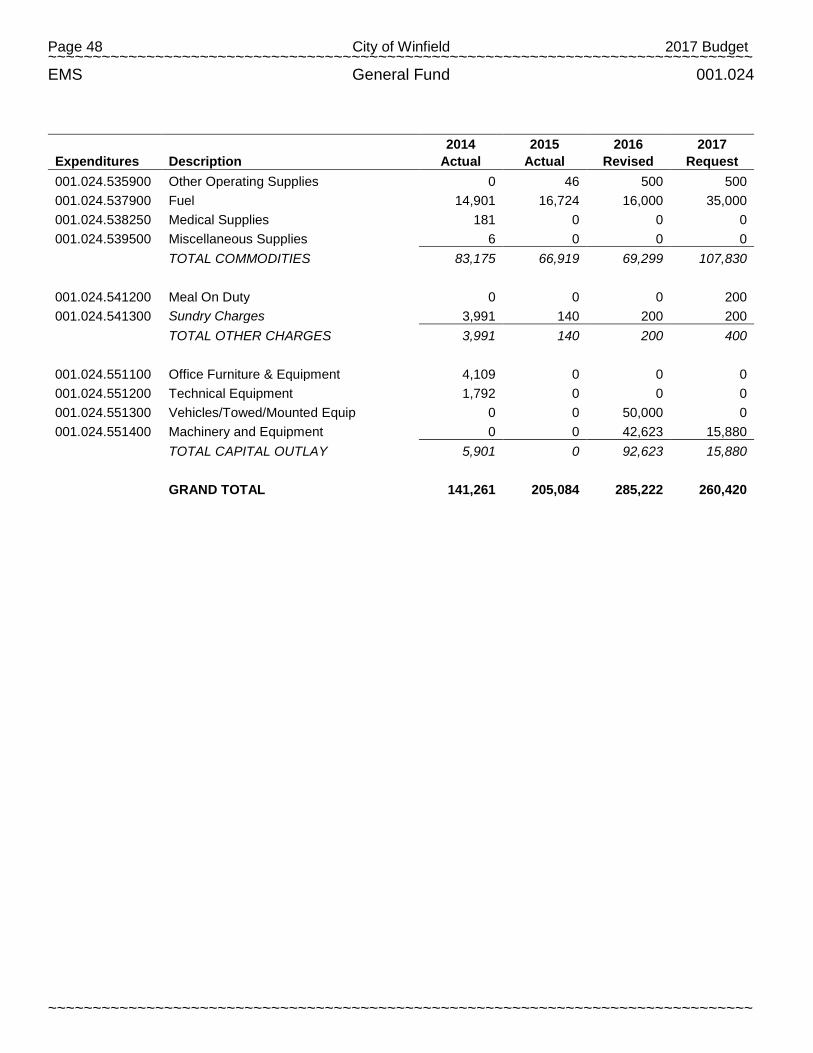
Page 48 City of Winfield 2017 Budget ~~~~~~~~~~~~~~~~~~~~~~~~~~~~~~~~~~~~~~~~~~~~~~~~~~~~~~~~~~~~~~~~~~~~~~~~~~~~~~~
~~~~~~~~~~~~~~~~~~~~~~~~~~~~~~~~~~~~~~~~~~~~~~~~~~~~~~~~~~~~~~~~~~~~~~~~~~~~~~~
EMS General Fund 001.024
2014 2015 2016 2017
Expenditures Description Actual Actual Revised Request 001.024.535900 Other Operating Supplies 0 46 500 500 001.024.537900 Fuel 14,901 16,724 16,000 35,000 001.024.538250 Medical Supplies 181 0 0 0 001.024.539500 Miscellaneous Supplies 6 0 0 0
TOTAL COMMODITIES 83,175 66,919 69,299 107,830
001.024.541200 Meal On Duty 0 0 0 200 001.024.541300 Sundry Charges 3,991 140 200 200
TOTAL OTHER CHARGES 3,991 140 200 400
001.024.551100 Office Furniture & Equipment 4,109 0 0 0 001.024.551200 Technical Equipment 1,792 0 0 0 001.024.551300 Vehicles/Towed/Mounted Equip 0 0 50,000 0 001.024.551400 Machinery and Equipment 0 0 42,623 15,880
TOTAL CAPITAL OUTLAY 5,901 0 92,623 15,880
GRAND TOTAL 141,261 205,084 285,222 260,420

2017 Budget City of Winfield Page 49 ~~~~~~~~~~~~~~~~~~~~~~~~~~~~~~~~~~~~~~~~~~~~~~~~~~~~~~~~~~~~~~~~~~~~~~~~~~~~~~~
~~~~~~~~~~~~~~~~~~~~~~~~~~~~~~~~~~~~~~~~~~~~~~~~~~~~~~~~~~~~~~~~~~~~~~~~~~~~~~~
Winfield City Lake GENERAL FUND
001.034 2017 CAPITAL OUTLAY
001.034 CITY LAKE 551300 15' Bat Wing mower heavy duty $18,500.00 551600 Replace cookers, tables and electric boxes $7,500.00
TOTAL 001.034 CITY LAKE $26,000.00
2014 2015 2016 2017
Expenditures Description Actual Actual Revised Request 001.034.511100 Wages Regular Employees 80,099 85,573 107,916 75,781 001.034.511200 Overtime Wages 6,487 7,361 4,831 6,500 001.034.511300 Wages-Other Employees 35,842 40,289 36,464 39,578 001.034.515100 FICA 8,708 9,612 11,029 8,784 001.034.515200 KPERS Contributions 4,854 5,653 11,654 6,707 001.034.515400 Health Insurance 18,000 19,920 21,514 23,235 001.034.515500 Unemployment Insurance 123 419 582 464 001.034.515700 Deferred Compensation Matching 520 519 520 0 001.034.515800 Workers Compensaiton Ins 2,850 2,142 2,039 2,039
TOTAL PERSONAL SERVICES 157,482 171,488 196,549 163,088
001.034.521700 Contractual Svcs-Bldgs/Grounds 1,196 314 900 900 001.034.521900 Contractual Svcs-Other 385 185 5,300 750 001.034.522400 Medical Services 483 663 750 500 001.034.522700 Other Professional Services 208 150 1,500 5,050 001.034.522810 Credit card fees 2,371 448 2,400 2,400 001.034.523100 Advertising Costs 0 182 250 250 001.034.524100 Printing/Photo Services 3,568 3,850 3,500 3,500 001.034.524600 Travel Expenses 0 0 200 200 001.034.524700 Training/Conference Fees 128 53 250 250 001.034.527100 Tele. Service & Land Lines 899 914 910 910 001.034.527300 Cellular Telephones 360 360 360 360 001.034.528100 Electricity 15,921 8,136 15,000 17,000 001.034.528300 Water 7,705 8,516 9,000 9,000 001.034.528500 Refuse 1,968 1,804 2,000 2,000
TOTAL CONTRACTUAL SERVICES 35,192 25,575 42,320 43,070
001.034.530100 Insurance 2,359 2,160 2,745 2,882 001.034.531700 Internal Support - Svce Ctr Bldg 18,020 16,904 16,325 16,325 001.034.532600 Concession purchases for resale 4,626 5,262 6,000 6,500 001.034.532800 Bait purchases for resale 3,636 4,560 4,650 5,000 001.034.533200 Office Supplies 0 116 200 200 001.034.534100 Building & Grounds Supplies 15,745 18,409 15,000 16,500 001.034.534200 Equipment Maintenance Supplies 2,621 2,297 3,000 4,000
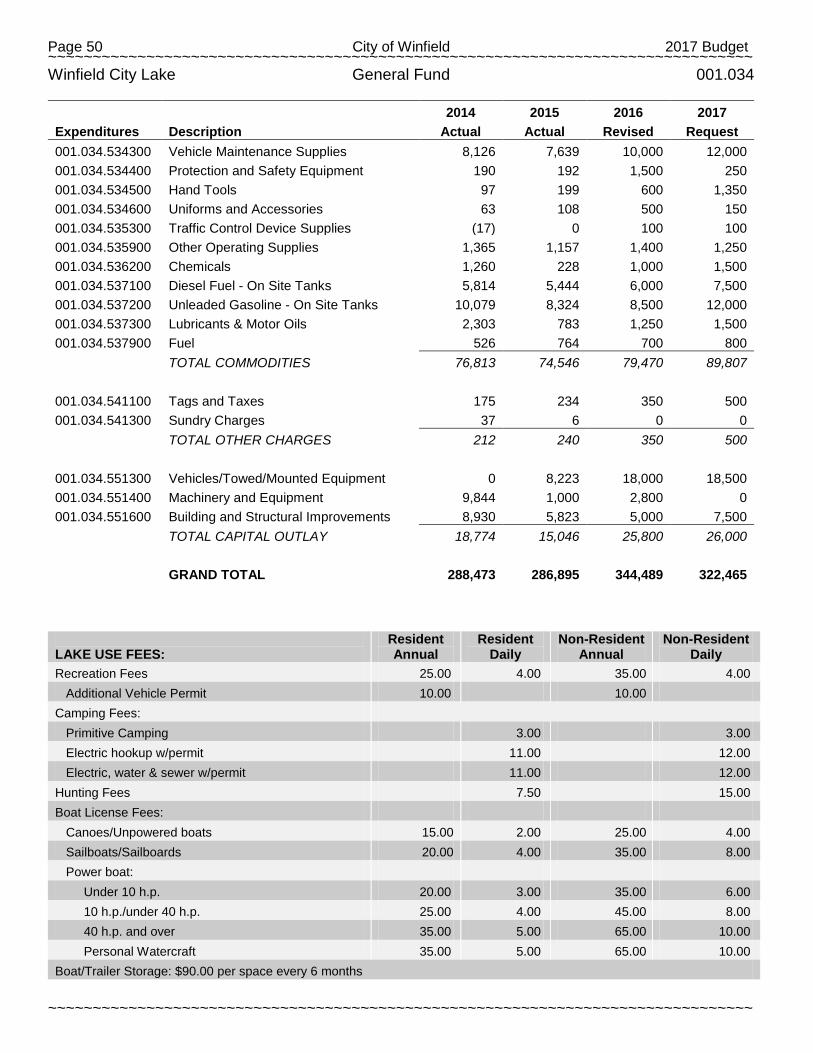
Page 50 City of Winfield 2017 Budget ~~~~~~~~~~~~~~~~~~~~~~~~~~~~~~~~~~~~~~~~~~~~~~~~~~~~~~~~~~~~~~~~~~~~~~~~~~~~~~~
~~~~~~~~~~~~~~~~~~~~~~~~~~~~~~~~~~~~~~~~~~~~~~~~~~~~~~~~~~~~~~~~~~~~~~~~~~~~~~~
Winfield City Lake General Fund 001.034
2014 2015 2016 2017
Expenditures Description Actual Actual Revised Request 001.034.534300 Vehicle Maintenance Supplies 8,126 7,639 10,000 12,000 001.034.534400 Protection and Safety Equipment 190 192 1,500 250 001.034.534500 Hand Tools 97 199 600 1,350 001.034.534600 Uniforms and Accessories 63 108 500 150 001.034.535300 Traffic Control Device Supplies (17) 0 100 100 001.034.535900 Other Operating Supplies 1,365 1,157 1,400 1,250 001.034.536200 Chemicals 1,260 228 1,000 1,500 001.034.537100 Diesel Fuel - On Site Tanks 5,814 5,444 6,000 7,500 001.034.537200 Unleaded Gasoline - On Site Tanks 10,079 8,324 8,500 12,000 001.034.537300 Lubricants & Motor Oils 2,303 783 1,250 1,500 001.034.537900 Fuel 526 764 700 800
TOTAL COMMODITIES 76,813 74,546 79,470 89,807
001.034.541100 Tags and Taxes 175 234 350 500 001.034.541300 Sundry Charges 37 6 0 0
TOTAL OTHER CHARGES 212 240 350 500
001.034.551300 Vehicles/Towed/Mounted Equipment 0 8,223 18,000 18,500 001.034.551400 Machinery and Equipment 9,844 1,000 2,800 0 001.034.551600 Building and Structural Improvements 8,930 5,823 5,000 7,500
TOTAL CAPITAL OUTLAY 18,774 15,046 25,800 26,000
GRAND TOTAL 288,473 286,895 344,489 322,465
LAKE USE FEES:
Resident Annual
Resident Daily
Non-Resident Annual
Non-Resident Daily
Recreation Fees 25.00 4.00 35.00 4.00 Additional Vehicle Permit 10.00 10.00
Camping Fees: Primitive Camping 3.00 3.00 Electric hookup w/permit 11.00 12.00 Electric, water & sewer w/permit 11.00 12.00
Hunting Fees 7.50 15.00 Boat License Fees:
Canoes/Unpowered boats 15.00 2.00 25.00 4.00 Sailboats/Sailboards 20.00 4.00 35.00 8.00 Power boat:
Under 10 h.p. 20.00 3.00 35.00 6.00 10 h.p./under 40 h.p. 25.00 4.00 45.00 8.00 40 h.p. and over 35.00 5.00 65.00 10.00 Personal Watercraft 35.00 5.00 65.00 10.00
Boat/Trailer Storage: $90.00 per space every 6 months
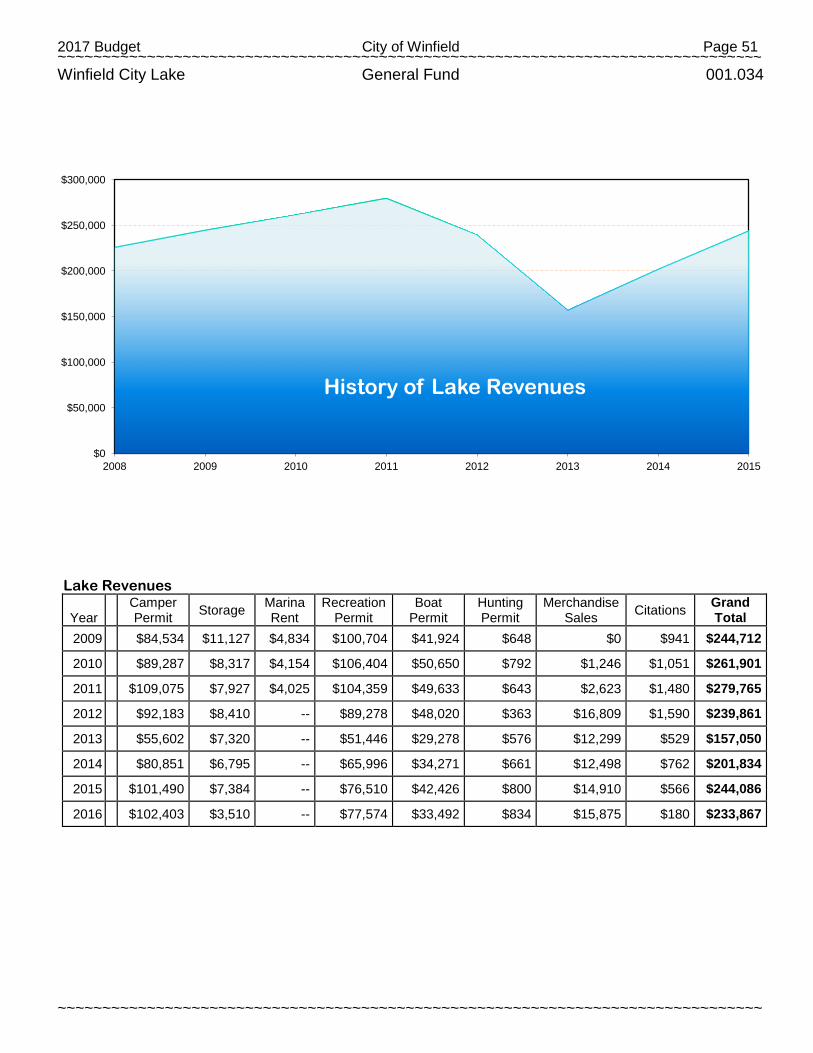
2017 Budget City of Winfield Page 51 ~~~~~~~~~~~~~~~~~~~~~~~~~~~~~~~~~~~~~~~~~~~~~~~~~~~~~~~~~~~~~~~~~~~~~~~~~~~~~~~
~~~~~~~~~~~~~~~~~~~~~~~~~~~~~~~~~~~~~~~~~~~~~~~~~~~~~~~~~~~~~~~~~~~~~~~~~~~~~~~
Winfield City Lake General Fund 001.034
Lake Revenues
Year
Camper Permit Storage Marina
Rent Recreation
Permit Boat
Permit Hunting Permit
Merchandise Sales Citations Grand
Total 2009 $84,534 $11,127 $4,834 $100,704 $41,924 $648 $0 $941 $244,712
2010 $89,287 $8,317 $4,154 $106,404 $50,650 $792 $1,246 $1,051 $261,901
2011 $109,075 $7,927 $4,025 $104,359 $49,633 $643 $2,623 $1,480 $279,765
2012 $92,183 $8,410 -- $89,278 $48,020 $363 $16,809 $1,590 $239,861
2013 $55,602 $7,320 -- $51,446 $29,278 $576 $12,299 $529 $157,050
2014 $80,851 $6,795 -- $65,996 $34,271 $661 $12,498 $762 $201,834
2015 $101,490 $7,384 -- $76,510 $42,426 $800 $14,910 $566 $244,086
2016 $102,403 $3,510 -- $77,574 $33,492 $834 $15,875 $180 $233,867
$0
$50,000
$100,000
$150,000
$200,000
$250,000
$300,000
2008 2009 2010 2011 2012 2013 2014 2015
History of Lake Revenues
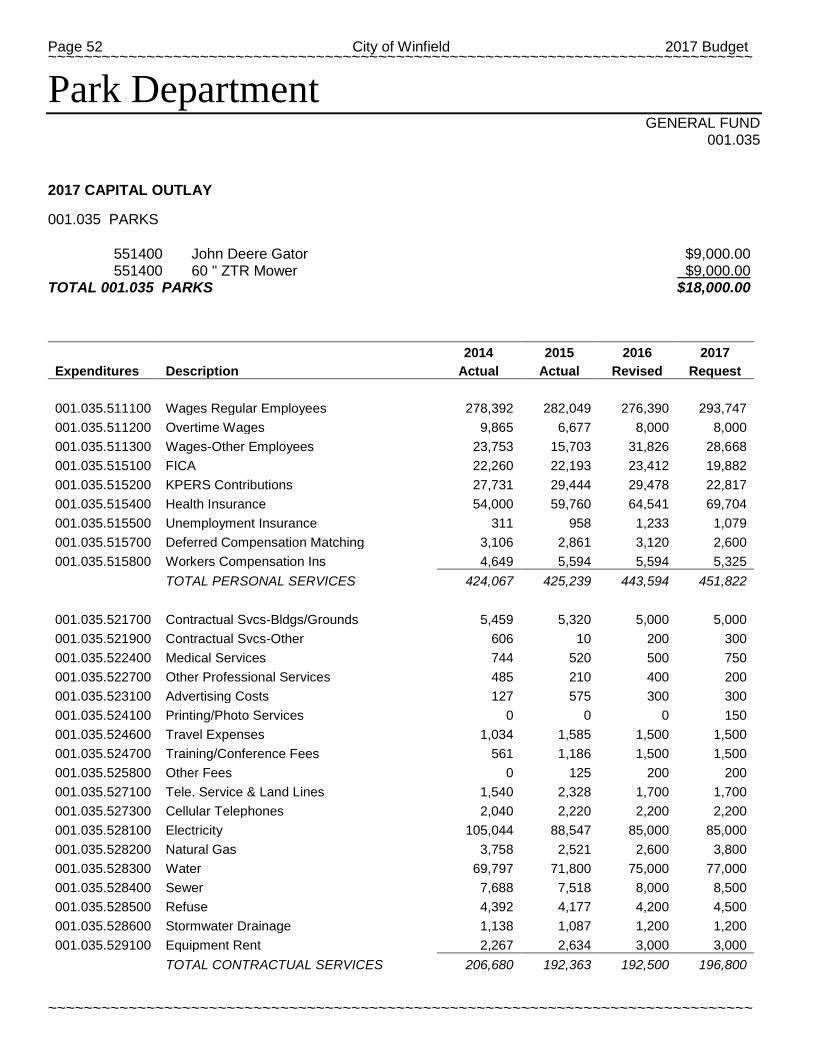
Page 52 City of Winfield 2017 Budget ~~~~~~~~~~~~~~~~~~~~~~~~~~~~~~~~~~~~~~~~~~~~~~~~~~~~~~~~~~~~~~~~~~~~~~~~~~~~~~~
~~~~~~~~~~~~~~~~~~~~~~~~~~~~~~~~~~~~~~~~~~~~~~~~~~~~~~~~~~~~~~~~~~~~~~~~~~~~~~~
Park Department GENERAL FUND
001.035 2017 CAPITAL OUTLAY
001.035 PARKS 551400 John Deere Gator $9,000.00 551400 60 " ZTR Mower $9,000.00
TOTAL 001.035 PARKS $18,000.00
2014 2015 2016 2017
Expenditures Description Actual Actual Revised Request
001.035.511100 Wages Regular Employees 278,392 282,049 276,390 293,747 001.035.511200 Overtime Wages 9,865 6,677 8,000 8,000 001.035.511300 Wages-Other Employees 23,753 15,703 31,826 28,668 001.035.515100 FICA 22,260 22,193 23,412 19,882 001.035.515200 KPERS Contributions 27,731 29,444 29,478 22,817 001.035.515400 Health Insurance 54,000 59,760 64,541 69,704 001.035.515500 Unemployment Insurance 311 958 1,233 1,079 001.035.515700 Deferred Compensation Matching 3,106 2,861 3,120 2,600 001.035.515800 Workers Compensation Ins 4,649 5,594 5,594 5,325
TOTAL PERSONAL SERVICES 424,067 425,239 443,594 451,822
001.035.521700 Contractual Svcs-Bldgs/Grounds 5,459 5,320 5,000 5,000 001.035.521900 Contractual Svcs-Other 606 10 200 300 001.035.522400 Medical Services 744 520 500 750 001.035.522700 Other Professional Services 485 210 400 200 001.035.523100 Advertising Costs 127 575 300 300 001.035.524100 Printing/Photo Services 0 0 0 150 001.035.524600 Travel Expenses 1,034 1,585 1,500 1,500 001.035.524700 Training/Conference Fees 561 1,186 1,500 1,500 001.035.525800 Other Fees 0 125 200 200 001.035.527100 Tele. Service & Land Lines 1,540 2,328 1,700 1,700 001.035.527300 Cellular Telephones 2,040 2,220 2,200 2,200 001.035.528100 Electricity 105,044 88,547 85,000 85,000 001.035.528200 Natural Gas 3,758 2,521 2,600 3,800 001.035.528300 Water 69,797 71,800 75,000 77,000 001.035.528400 Sewer 7,688 7,518 8,000 8,500 001.035.528500 Refuse 4,392 4,177 4,200 4,500 001.035.528600 Stormwater Drainage 1,138 1,087 1,200 1,200 001.035.529100 Equipment Rent 2,267 2,634 3,000 3,000
TOTAL CONTRACTUAL SERVICES 206,680 192,363 192,500 196,800

2017 Budget City of Winfield Page 53 ~~~~~~~~~~~~~~~~~~~~~~~~~~~~~~~~~~~~~~~~~~~~~~~~~~~~~~~~~~~~~~~~~~~~~~~~~~~~~~~
~~~~~~~~~~~~~~~~~~~~~~~~~~~~~~~~~~~~~~~~~~~~~~~~~~~~~~~~~~~~~~~~~~~~~~~~~~~~~~~
Park Department General Fund 001.035
2014 2015 2016 2017
Expenditures Description Actual Actual Revised Request 001.035.530100 Insurance 21,541 17,749 23,274 24,438 001.035.531700 Internal Support - Svce Ctr Bldg 17,353 16,255 18,858 18,858 001.035.533200 Office Supplies 0 13 200 200 001.035.534100 Building & Grounds Supplies 59,540 52,463 50,000 55,000 001.035.534200 Equipment Maintenance Supplies 265 1,257 1,000 3,500 001.035.534300 Vehicle Maintenance Supplies 9,858 9,552 10,000 12,000 001.035.534400 Protection and Safety Equipment 1,773 679 1,000 3,000 001.035.534500 Hand Tools 817 42 500 500 001.035.534600 Uniforms and Accessories 2,504 1,673 1,600 1,600 001.035.535900 Other Operating Supplies 33 9 300 500 001.035.536100 Grass Seed and Sod 0 582 200 200 001.035.536200 Chemicals 1,767 5,358 4,500 5,000 001.035.537100 Diesel Fuel - On Site Tanks 8,797 8,224 8,000 8,000 001.035.537200 Unleaded Gasoline - On Site Tanks 10,567 5,142 6,000 12,500 001.035.537300 Lubricants & Motor Oils 1,392 1,102 1,200 1,200 001.035.537900 Fuel 15,494 10,382 7,500 16,000
TOTAL COMMODITIES 151,701 130,482 134,132 162,496
001.035.541100 Tags and Taxes 0 1,292 0 0 001.035.541200 Meal on Duty 82 318 300 300 001.035.541300 Sundry Charges 15 129 200 200
TOTAL OTHER CHARGES 97 1,739 500 500
001.035.551300 Vehicles/Towed/Mounted Equipment 2,560 22,925 0 0 001.035.551400 Machinery and Equipment 7,000 10,900 31,000 18,000
TOTAL CAPITAL OUTLAY 9,560 33,825 31,000 18,000
001.035.581200 Transfer to CIP 10,000 0 0 0
TRANSFERS OUT 10,000 0 0 0
GRAND TOTAL 802,104 783,648 801,726 829,618
PARKS MAINTAINED BY THE CITY OF WINFIELD
Acres Island Park 18.90 Nature Park 34.81 Swimming Pool 6.29 Fairgrounds 103.59 Pecan Grove 35.72 Tunnel Mill Park 19.19 Hiatt Hills Park 2.00 Cochran Park .96 Memorial Park 2.55 Broadway Recreation Complex 35.00 Jaycee Park 1.31 Lions Park .64 Albright Park 2.68 Cherry Street Park 12.85 Black Creek Park 14.50
TOTAL ACRES 290.99
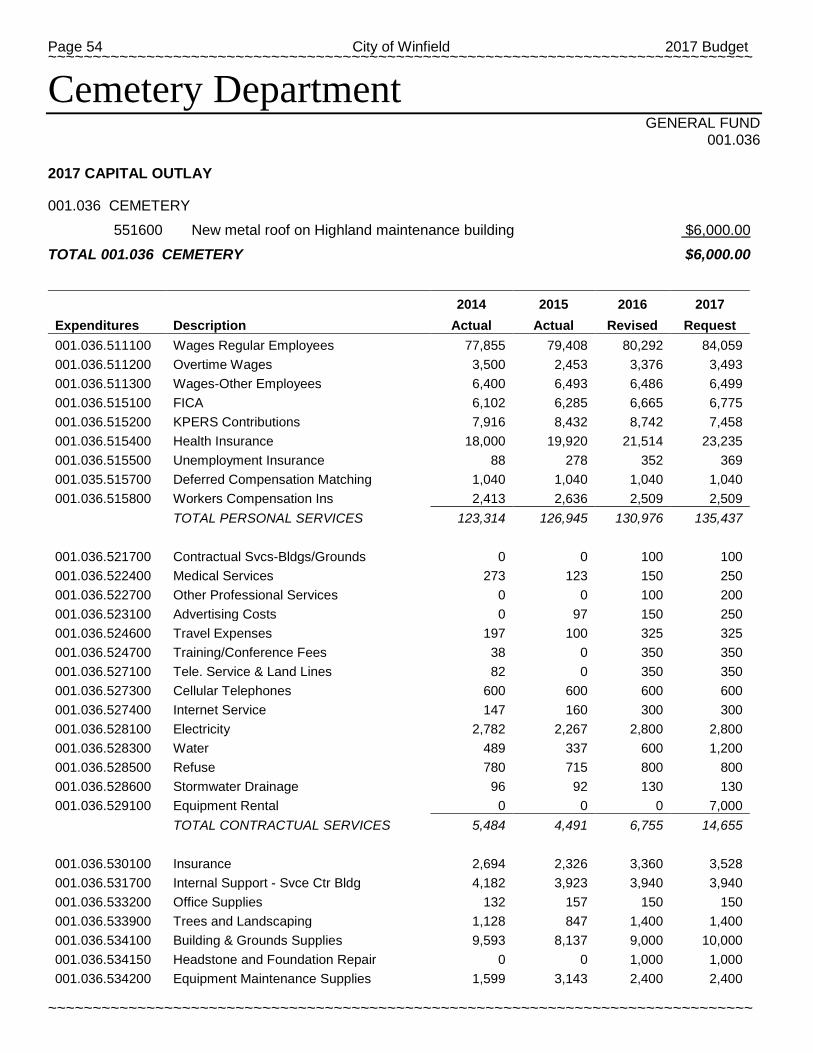
Page 54 City of Winfield 2017 Budget ~~~~~~~~~~~~~~~~~~~~~~~~~~~~~~~~~~~~~~~~~~~~~~~~~~~~~~~~~~~~~~~~~~~~~~~~~~~~~~~
~~~~~~~~~~~~~~~~~~~~~~~~~~~~~~~~~~~~~~~~~~~~~~~~~~~~~~~~~~~~~~~~~~~~~~~~~~~~~~~
Cemetery Department GENERAL FUND
001.036 2017 CAPITAL OUTLAY 001.036 CEMETERY
551600 New metal roof on Highland maintenance building $6,000.00
TOTAL 001.036 CEMETERY $6,000.00
2014 2015 2016 2017
Expenditures Description Actual Actual Revised Request 001.036.511100 Wages Regular Employees 77,855 79,408 80,292 84,059 001.036.511200 Overtime Wages 3,500 2,453 3,376 3,493 001.036.511300 Wages-Other Employees 6,400 6,493 6,486 6,499 001.036.515100 FICA 6,102 6,285 6,665 6,775 001.036.515200 KPERS Contributions 7,916 8,432 8,742 7,458 001.036.515400 Health Insurance 18,000 19,920 21,514 23,235 001.036.515500 Unemployment Insurance 88 278 352 369 001.035.515700 Deferred Compensation Matching 1,040 1,040 1,040 1,040 001.036.515800 Workers Compensation Ins 2,413 2,636 2,509 2,509
TOTAL PERSONAL SERVICES 123,314 126,945 130,976 135,437
001.036.521700 Contractual Svcs-Bldgs/Grounds 0 0 100 100 001.036.522400 Medical Services 273 123 150 250 001.036.522700 Other Professional Services 0 0 100 200 001.036.523100 Advertising Costs 0 97 150 250 001.036.524600 Travel Expenses 197 100 325 325 001.036.524700 Training/Conference Fees 38 0 350 350 001.036.527100 Tele. Service & Land Lines 82 0 350 350 001.036.527300 Cellular Telephones 600 600 600 600 001.036.527400 Internet Service 147 160 300 300 001.036.528100 Electricity 2,782 2,267 2,800 2,800 001.036.528300 Water 489 337 600 1,200 001.036.528500 Refuse 780 715 800 800 001.036.528600 Stormwater Drainage 96 92 130 130 001.036.529100 Equipment Rental 0 0 0 7,000
TOTAL CONTRACTUAL SERVICES 5,484 4,491 6,755 14,655
001.036.530100 Insurance 2,694 2,326 3,360 3,528 001.036.531700 Internal Support - Svce Ctr Bldg 4,182 3,923 3,940 3,940 001.036.533200 Office Supplies 132 157 150 150 001.036.533900 Trees and Landscaping 1,128 847 1,400 1,400 001.036.534100 Building & Grounds Supplies 9,593 8,137 9,000 10,000 001.036.534150 Headstone and Foundation Repair 0 0 1,000 1,000 001.036.534200 Equipment Maintenance Supplies 1,599 3,143 2,400 2,400
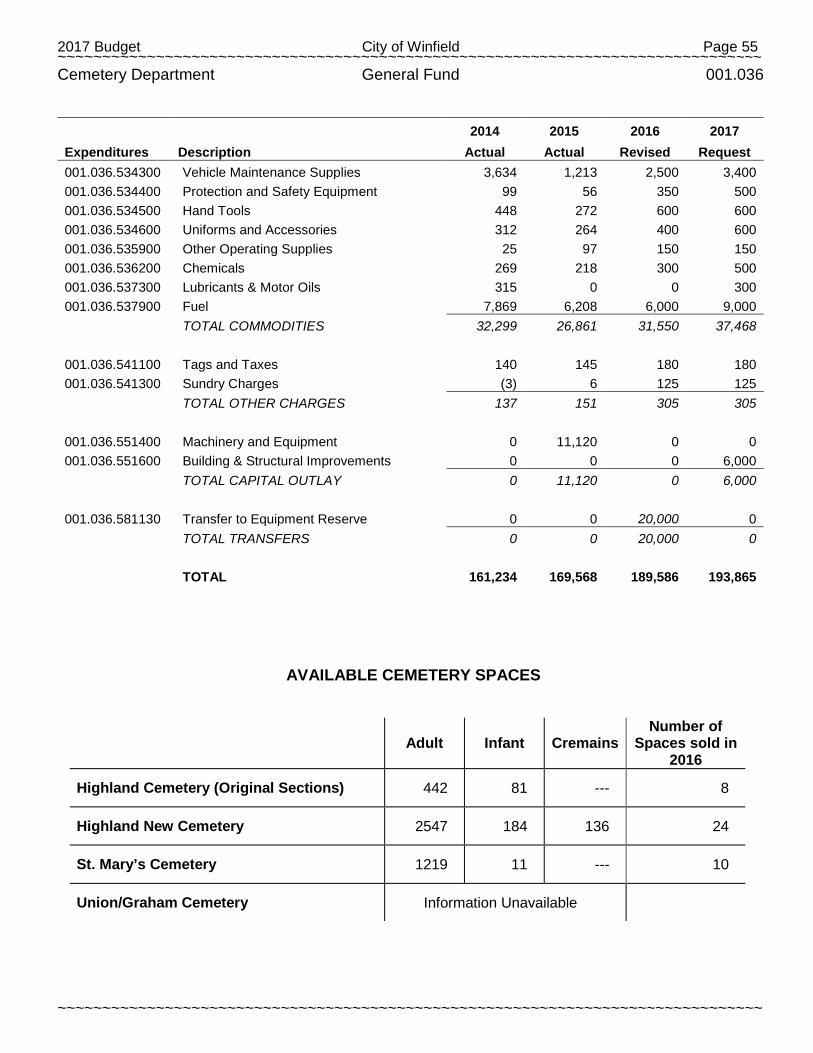
2017 Budget City of Winfield Page 55 ~~~~~~~~~~~~~~~~~~~~~~~~~~~~~~~~~~~~~~~~~~~~~~~~~~~~~~~~~~~~~~~~~~~~~~~~~~~~~~~
~~~~~~~~~~~~~~~~~~~~~~~~~~~~~~~~~~~~~~~~~~~~~~~~~~~~~~~~~~~~~~~~~~~~~~~~~~~~~~~
Cemetery Department General Fund 001.036
2014 2015 2016 2017
Expenditures Description Actual Actual Revised Request 001.036.534300 Vehicle Maintenance Supplies 3,634 1,213 2,500 3,400 001.036.534400 Protection and Safety Equipment 99 56 350 500 001.036.534500 Hand Tools 448 272 600 600 001.036.534600 Uniforms and Accessories 312 264 400 600 001.036.535900 Other Operating Supplies 25 97 150 150 001.036.536200 Chemicals 269 218 300 500 001.036.537300 Lubricants & Motor Oils 315 0 0 300 001.036.537900 Fuel 7,869 6,208 6,000 9,000
TOTAL COMMODITIES 32,299 26,861 31,550 37,468
001.036.541100 Tags and Taxes 140 145 180 180 001.036.541300 Sundry Charges (3) 6 125 125
TOTAL OTHER CHARGES 137 151 305 305
001.036.551400 Machinery and Equipment 0 11,120 0 0 001.036.551600 Building & Structural Improvements 0 0 0 6,000
TOTAL CAPITAL OUTLAY 0 11,120 0 6,000
001.036.581130 Transfer to Equipment Reserve 0 0 20,000 0
TOTAL TRANSFERS 0 0 20,000 0
TOTAL 161,234 169,568 189,586 193,865
AVAILABLE CEMETERY SPACES
Adult Infant Cremains
Number of Spaces sold in
2016
Highland Cemetery (Original Sections) 442 81 --- 8
Highland New Cemetery 2547 184 136 24
St. Mary’s Cemetery 1219 11 --- 10
Union/Graham Cemetery Information Unavailable
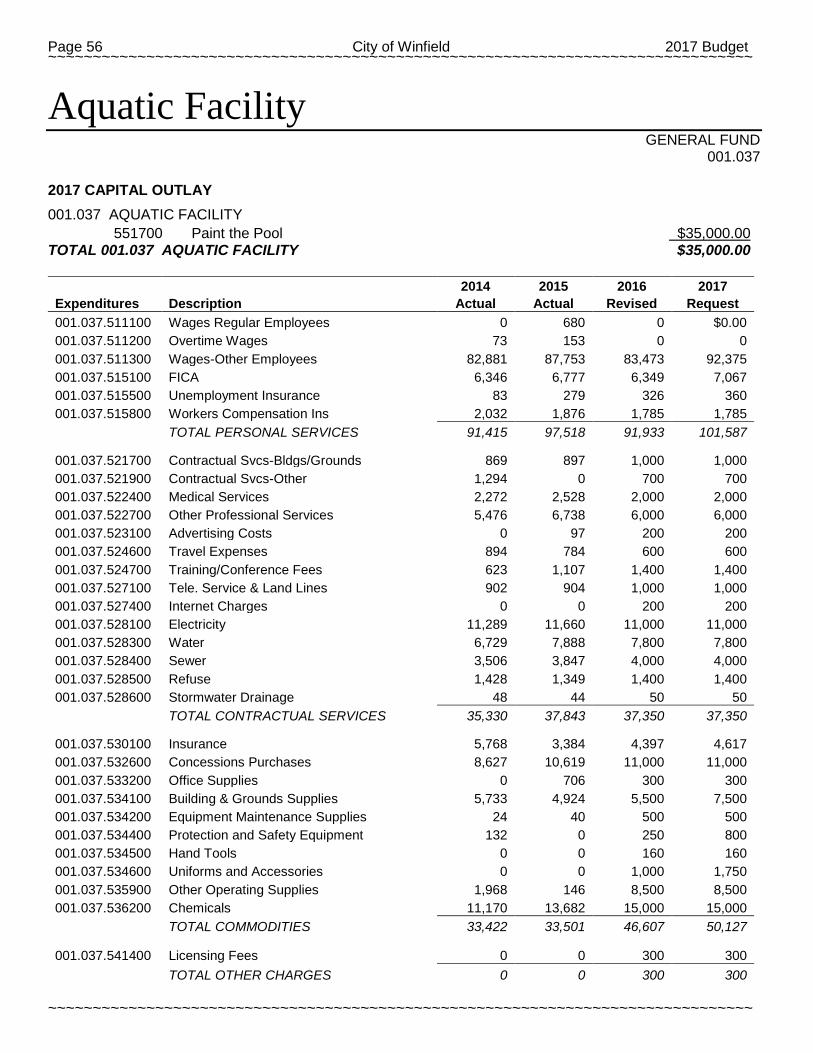
Page 56 City of Winfield 2017 Budget ~~~~~~~~~~~~~~~~~~~~~~~~~~~~~~~~~~~~~~~~~~~~~~~~~~~~~~~~~~~~~~~~~~~~~~~~~~~~~~~
~~~~~~~~~~~~~~~~~~~~~~~~~~~~~~~~~~~~~~~~~~~~~~~~~~~~~~~~~~~~~~~~~~~~~~~~~~~~~~~
Aquatic Facility GENERAL FUND
001.037 2017 CAPITAL OUTLAY
001.037 AQUATIC FACILITY 551700 Paint the Pool $35,000.00
TOTAL 001.037 AQUATIC FACILITY $35,000.00
2014 2015 2016 2017
Expenditures Description Actual Actual Revised Request 001.037.511100 Wages Regular Employees 0 680 0 $0.00 001.037.511200 Overtime Wages 73 153 0 0 001.037.511300 Wages-Other Employees 82,881 87,753 83,473 92,375 001.037.515100 FICA 6,346 6,777 6,349 7,067 001.037.515500 Unemployment Insurance 83 279 326 360 001.037.515800 Workers Compensation Ins 2,032 1,876 1,785 1,785
TOTAL PERSONAL SERVICES 91,415 97,518 91,933 101,587
001.037.521700 Contractual Svcs-Bldgs/Grounds 869 897 1,000 1,000 001.037.521900 Contractual Svcs-Other 1,294 0 700 700 001.037.522400 Medical Services 2,272 2,528 2,000 2,000 001.037.522700 Other Professional Services 5,476 6,738 6,000 6,000 001.037.523100 Advertising Costs 0 97 200 200 001.037.524600 Travel Expenses 894 784 600 600 001.037.524700 Training/Conference Fees 623 1,107 1,400 1,400 001.037.527100 Tele. Service & Land Lines 902 904 1,000 1,000 001.037.527400 Internet Charges 0 0 200 200 001.037.528100 Electricity 11,289 11,660 11,000 11,000 001.037.528300 Water 6,729 7,888 7,800 7,800 001.037.528400 Sewer 3,506 3,847 4,000 4,000 001.037.528500 Refuse 1,428 1,349 1,400 1,400 001.037.528600 Stormwater Drainage 48 44 50 50
TOTAL CONTRACTUAL SERVICES 35,330 37,843 37,350 37,350
001.037.530100 Insurance 5,768 3,384 4,397 4,617 001.037.532600 Concessions Purchases 8,627 10,619 11,000 11,000 001.037.533200 Office Supplies 0 706 300 300 001.037.534100 Building & Grounds Supplies 5,733 4,924 5,500 7,500 001.037.534200 Equipment Maintenance Supplies 24 40 500 500 001.037.534400 Protection and Safety Equipment 132 0 250 800 001.037.534500 Hand Tools 0 0 160 160 001.037.534600 Uniforms and Accessories 0 0 1,000 1,750 001.037.535900 Other Operating Supplies 1,968 146 8,500 8,500 001.037.536200 Chemicals 11,170 13,682 15,000 15,000
TOTAL COMMODITIES 33,422 33,501 46,607 50,127
001.037.541400 Licensing Fees 0 0 300 300
TOTAL OTHER CHARGES 0 0 300 300
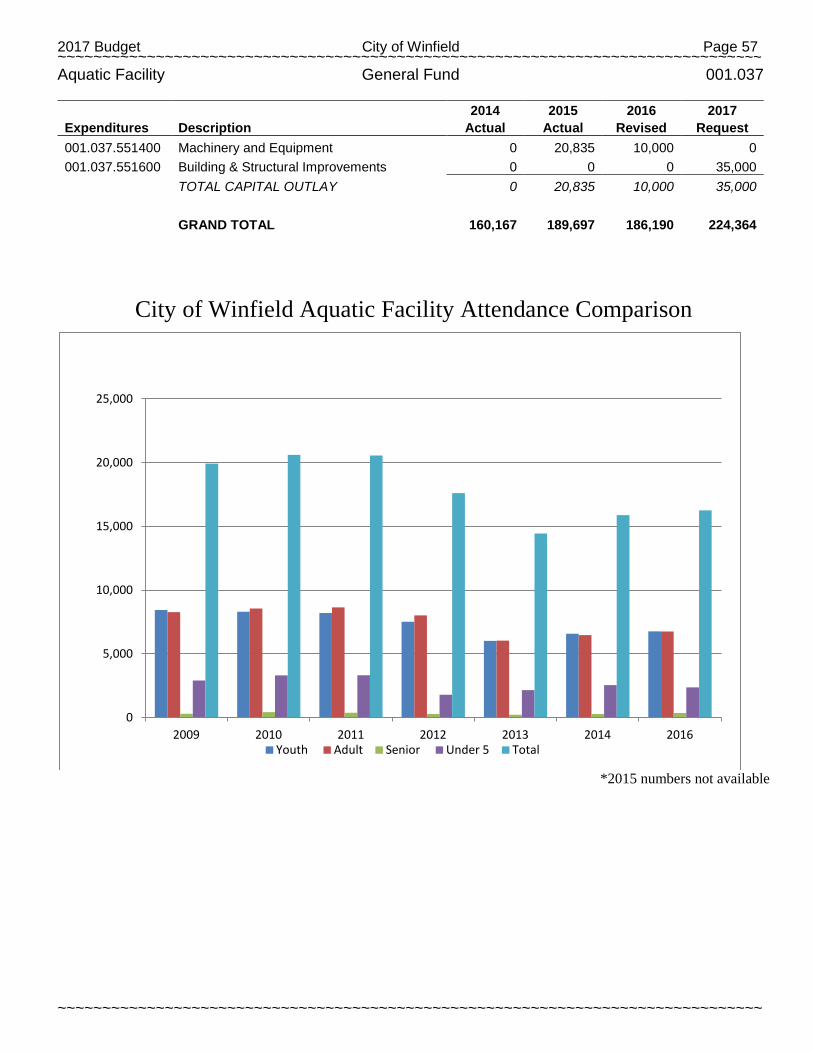
2017 Budget City of Winfield Page 57 ~~~~~~~~~~~~~~~~~~~~~~~~~~~~~~~~~~~~~~~~~~~~~~~~~~~~~~~~~~~~~~~~~~~~~~~~~~~~~~~
~~~~~~~~~~~~~~~~~~~~~~~~~~~~~~~~~~~~~~~~~~~~~~~~~~~~~~~~~~~~~~~~~~~~~~~~~~~~~~~
Aquatic Facility General Fund 001.037
2014 2015 2016 2017
Expenditures Description Actual Actual Revised Request 001.037.551400 Machinery and Equipment 0 20,835 10,000 0 001.037.551600 Building & Structural Improvements 0 0 0 35,000
TOTAL CAPITAL OUTLAY 0 20,835 10,000 35,000
GRAND TOTAL 160,167 189,697 186,190 224,364
City of Winfield Aquatic Facility Attendance Comparison
*2015 numbers not available
0
5,000
10,000
15,000
20,000
25,000
2009 2010 2011 2012 2013 2014 2016 Youth Adult Senior Under 5 Total
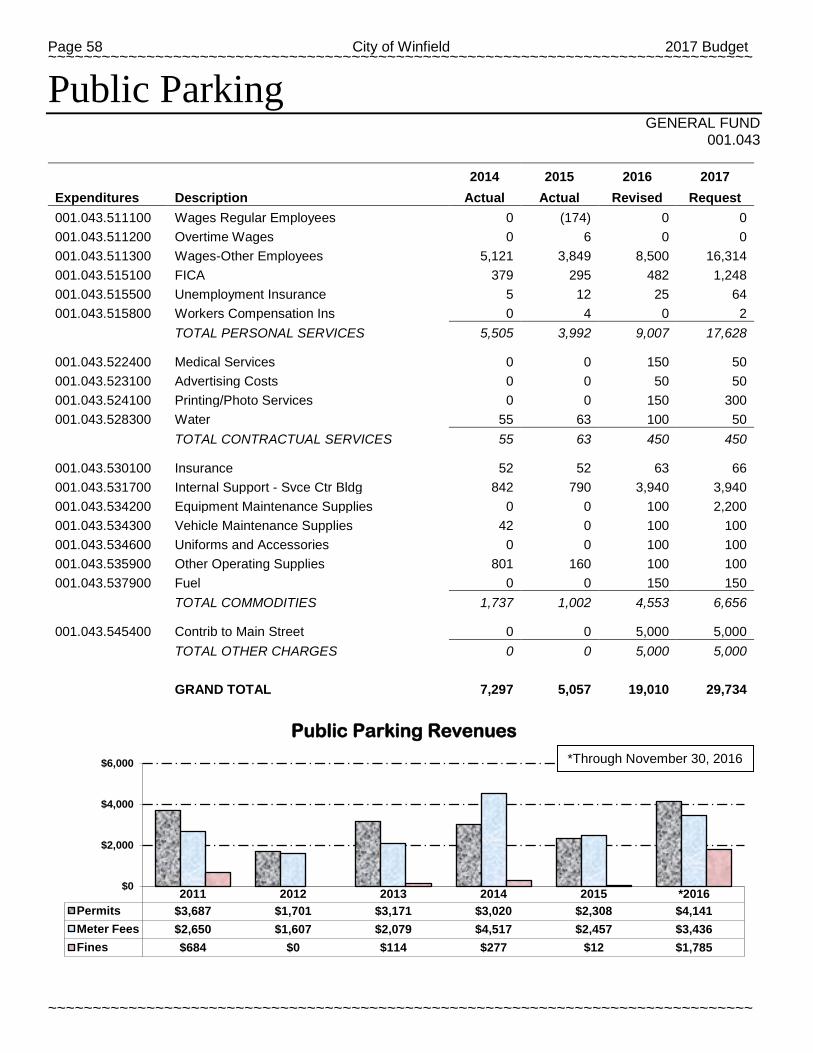
Page 58 City of Winfield 2017 Budget ~~~~~~~~~~~~~~~~~~~~~~~~~~~~~~~~~~~~~~~~~~~~~~~~~~~~~~~~~~~~~~~~~~~~~~~~~~~~~~~
~~~~~~~~~~~~~~~~~~~~~~~~~~~~~~~~~~~~~~~~~~~~~~~~~~~~~~~~~~~~~~~~~~~~~~~~~~~~~~~
2011 2012 2013 2014 2015 *2016 Permits $3,687 $1,701 $3,171 $3,020 $2,308 $4,141 Meter Fees $2,650 $1,607 $2,079 $4,517 $2,457 $3,436 Fines $684 $0 $114 $277 $12 $1,785
$0
$2,000
$4,000
$6,000
Public Parking GENERAL FUND
001.043
2014 2015 2016 2017
Expenditures Description Actual Actual Revised Request 001.043.511100 Wages Regular Employees 0 (174) 0 0 001.043.511200 Overtime Wages 0 6 0 0 001.043.511300 Wages-Other Employees 5,121 3,849 8,500 16,314 001.043.515100 FICA 379 295 482 1,248 001.043.515500 Unemployment Insurance 5 12 25 64 001.043.515800 Workers Compensation Ins 0 4 0 2
TOTAL PERSONAL SERVICES 5,505 3,992 9,007 17,628
001.043.522400 Medical Services 0 0 150 50 001.043.523100 Advertising Costs 0 0 50 50 001.043.524100 Printing/Photo Services 0 0 150 300 001.043.528300 Water 55 63 100 50
TOTAL CONTRACTUAL SERVICES 55 63 450 450
001.043.530100 Insurance 52 52 63 66 001.043.531700 Internal Support - Svce Ctr Bldg 842 790 3,940 3,940 001.043.534200 Equipment Maintenance Supplies 0 0 100 2,200 001.043.534300 Vehicle Maintenance Supplies 42 0 100 100 001.043.534600 Uniforms and Accessories 0 0 100 100 001.043.535900 Other Operating Supplies 801 160 100 100 001.043.537900 Fuel 0 0 150 150
TOTAL COMMODITIES 1,737 1,002 4,553 6,656
001.043.545400 Contrib to Main Street 0 0 5,000 5,000
TOTAL OTHER CHARGES 0 0 5,000 5,000
GRAND TOTAL 7,297 5,057 19,010 29,734
Public Parking Revenues
*Through November 30, 2016
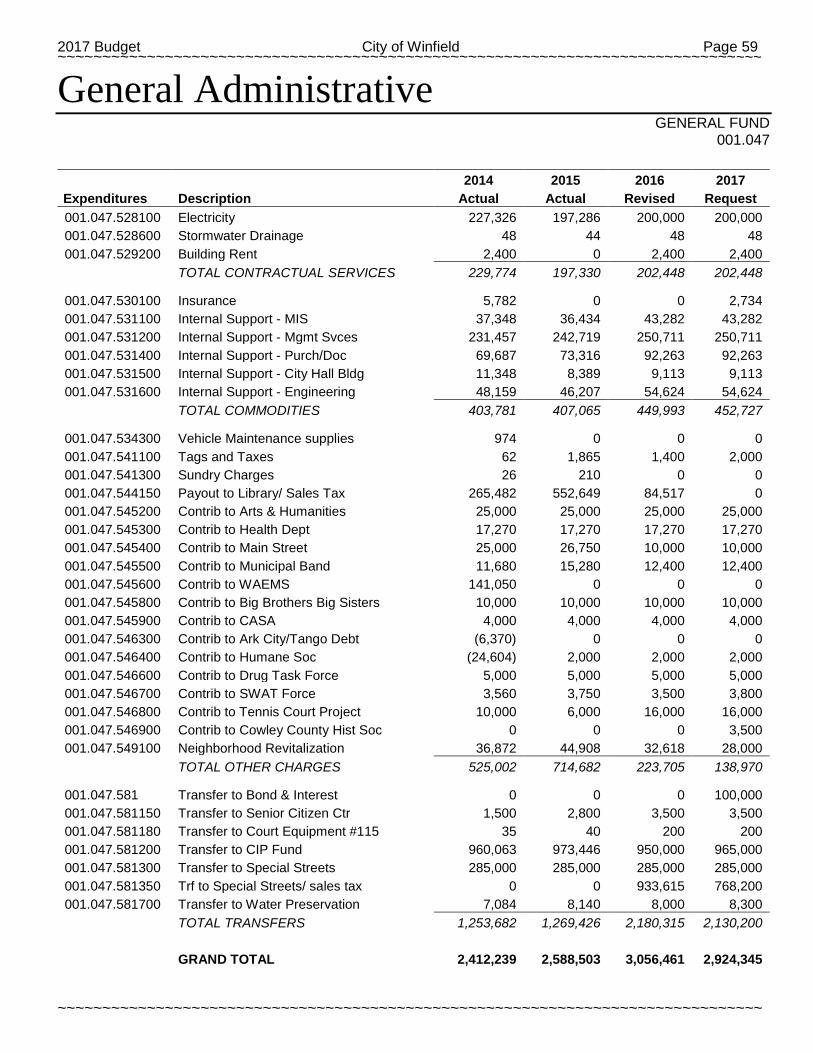
2017 Budget City of Winfield Page 59 ~~~~~~~~~~~~~~~~~~~~~~~~~~~~~~~~~~~~~~~~~~~~~~~~~~~~~~~~~~~~~~~~~~~~~~~~~~~~~~~
~~~~~~~~~~~~~~~~~~~~~~~~~~~~~~~~~~~~~~~~~~~~~~~~~~~~~~~~~~~~~~~~~~~~~~~~~~~~~~~
General Administrative GENERAL FUND
001.047
2014 2015 2016 2017
Expenditures Description Actual Actual Revised Request 001.047.528100 Electricity 227,326 197,286 200,000 200,000 001.047.528600 Stormwater Drainage 48 44 48 48 001.047.529200 Building Rent 2,400 0 2,400 2,400
TOTAL CONTRACTUAL SERVICES 229,774 197,330 202,448 202,448
001.047.530100 Insurance 5,782 0 0 2,734 001.047.531100 Internal Support - MIS 37,348 36,434 43,282 43,282 001.047.531200 Internal Support - Mgmt Svces 231,457 242,719 250,711 250,711 001.047.531400 Internal Support - Purch/Doc 69,687 73,316 92,263 92,263 001.047.531500 Internal Support - City Hall Bldg 11,348 8,389 9,113 9,113 001.047.531600 Internal Support - Engineering 48,159 46,207 54,624 54,624
TOTAL COMMODITIES 403,781 407,065 449,993 452,727
001.047.534300 Vehicle Maintenance supplies 974 0 0 0 001.047.541100 Tags and Taxes 62 1,865 1,400 2,000 001.047.541300 Sundry Charges 26 210 0 0 001.047.544150 Payout to Library/ Sales Tax 265,482 552,649 84,517 0 001.047.545200 Contrib to Arts & Humanities 25,000 25,000 25,000 25,000 001.047.545300 Contrib to Health Dept 17,270 17,270 17,270 17,270 001.047.545400 Contrib to Main Street 25,000 26,750 10,000 10,000 001.047.545500 Contrib to Municipal Band 11,680 15,280 12,400 12,400 001.047.545600 Contrib to WAEMS 141,050 0 0 0 001.047.545800 Contrib to Big Brothers Big Sisters 10,000 10,000 10,000 10,000 001.047.545900 Contrib to CASA 4,000 4,000 4,000 4,000 001.047.546300 Contrib to Ark City/Tango Debt (6,370) 0 0 0 001.047.546400 Contrib to Humane Soc (24,604) 2,000 2,000 2,000 001.047.546600 Contrib to Drug Task Force 5,000 5,000 5,000 5,000 001.047.546700 Contrib to SWAT Force 3,560 3,750 3,500 3,800 001.047.546800 Contrib to Tennis Court Project 10,000 6,000 16,000 16,000 001.047.546900 Contrib to Cowley County Hist Soc 0 0 0 3,500 001.047.549100 Neighborhood Revitalization 36,872 44,908 32,618 28,000
TOTAL OTHER CHARGES 525,002 714,682 223,705 138,970
001.047.581 Transfer to Bond & Interest 0 0 0 100,000 001.047.581150 Transfer to Senior Citizen Ctr 1,500 2,800 3,500 3,500 001.047.581180 Transfer to Court Equipment #115 35 40 200 200 001.047.581200 Transfer to CIP Fund 960,063 973,446 950,000 965,000 001.047.581300 Transfer to Special Streets 285,000 285,000 285,000 285,000 001.047.581350 Trf to Special Streets/ sales tax 0 0 933,615 768,200 001.047.581700 Transfer to Water Preservation 7,084 8,140 8,000 8,300
TOTAL TRANSFERS 1,253,682 1,269,426 2,180,315 2,130,200
GRAND TOTAL 2,412,239 2,588,503 3,056,461 2,924,345
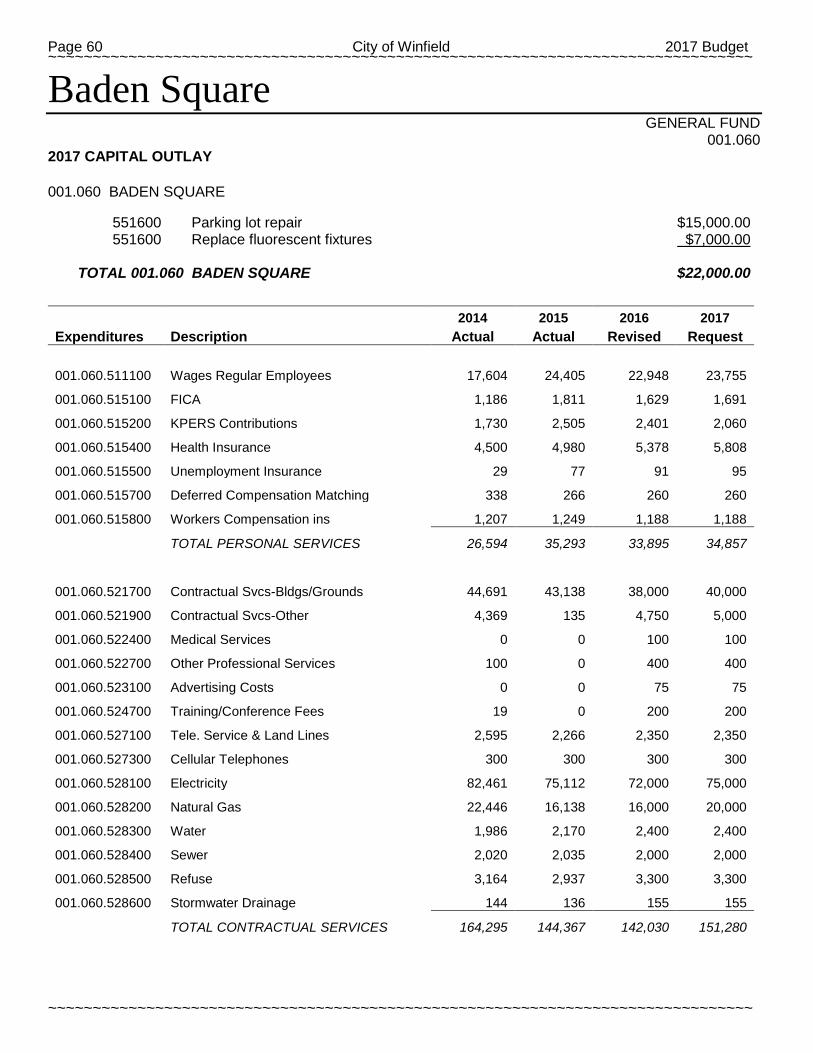
Page 60 City of Winfield 2017 Budget ~~~~~~~~~~~~~~~~~~~~~~~~~~~~~~~~~~~~~~~~~~~~~~~~~~~~~~~~~~~~~~~~~~~~~~~~~~~~~~~
~~~~~~~~~~~~~~~~~~~~~~~~~~~~~~~~~~~~~~~~~~~~~~~~~~~~~~~~~~~~~~~~~~~~~~~~~~~~~~~
Baden Square GENERAL FUND
001.060 2017 CAPITAL OUTLAY 001.060 BADEN SQUARE 551600 Parking lot repair $15,000.00 551600 Replace fluorescent fixtures $7,000.00
TOTAL 001.060 BADEN SQUARE $22,000.00
2014 2015 2016 2017
Expenditures Description Actual Actual Revised Request
001.060.511100 Wages Regular Employees 17,604 24,405 22,948 23,755
001.060.515100 FICA 1,186 1,811 1,629 1,691
001.060.515200 KPERS Contributions 1,730 2,505 2,401 2,060
001.060.515400 Health Insurance 4,500 4,980 5,378 5,808
001.060.515500 Unemployment Insurance 29 77 91 95
001.060.515700 Deferred Compensation Matching 338 266 260 260
001.060.515800 Workers Compensation ins 1,207 1,249 1,188 1,188
TOTAL PERSONAL SERVICES 26,594 35,293 33,895 34,857
001.060.521700 Contractual Svcs-Bldgs/Grounds 44,691 43,138 38,000 40,000
001.060.521900 Contractual Svcs-Other 4,369 135 4,750 5,000
001.060.522400 Medical Services 0 0 100 100
001.060.522700 Other Professional Services 100 0 400 400
001.060.523100 Advertising Costs 0 0 75 75
001.060.524700 Training/Conference Fees 19 0 200 200
001.060.527100 Tele. Service & Land Lines 2,595 2,266 2,350 2,350
001.060.527300 Cellular Telephones 300 300 300 300
001.060.528100 Electricity 82,461 75,112 72,000 75,000
001.060.528200 Natural Gas 22,446 16,138 16,000 20,000
001.060.528300 Water 1,986 2,170 2,400 2,400
001.060.528400 Sewer 2,020 2,035 2,000 2,000
001.060.528500 Refuse 3,164 2,937 3,300 3,300
001.060.528600 Stormwater Drainage 144 136 155 155
TOTAL CONTRACTUAL SERVICES 164,295 144,367 142,030 151,280
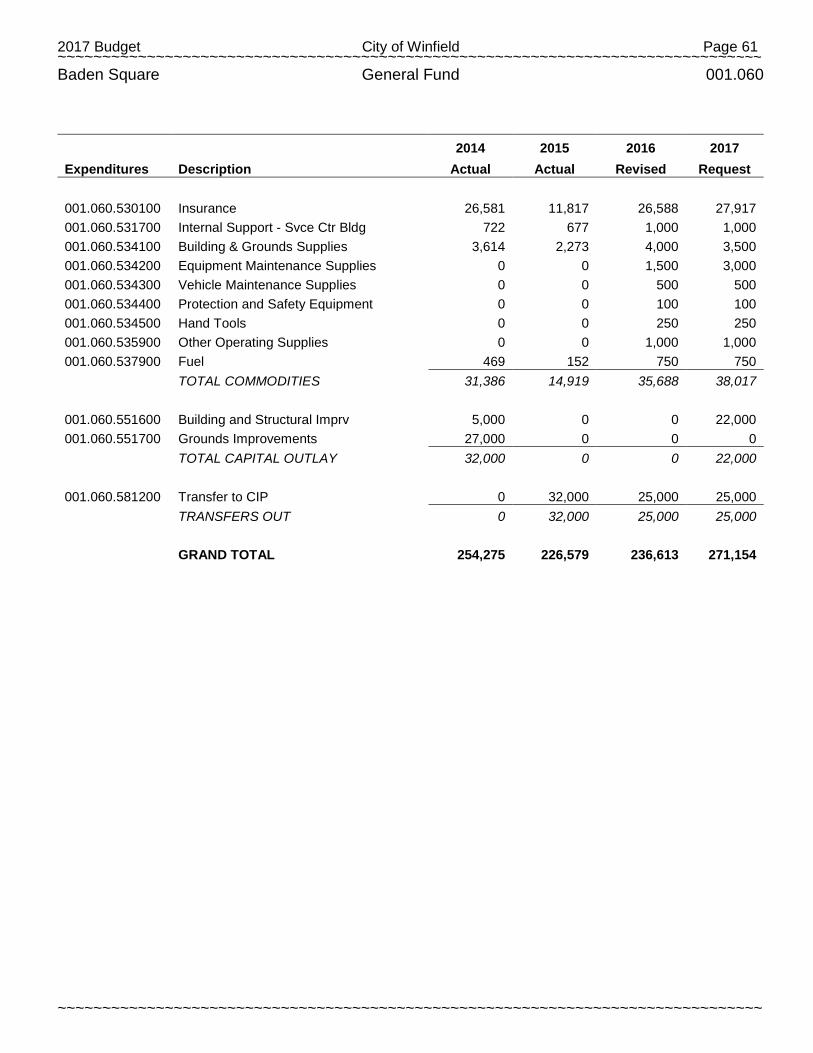
2017 Budget City of Winfield Page 61 ~~~~~~~~~~~~~~~~~~~~~~~~~~~~~~~~~~~~~~~~~~~~~~~~~~~~~~~~~~~~~~~~~~~~~~~~~~~~~~~
~~~~~~~~~~~~~~~~~~~~~~~~~~~~~~~~~~~~~~~~~~~~~~~~~~~~~~~~~~~~~~~~~~~~~~~~~~~~~~~
Baden Square General Fund 001.060
2014 2015 2016 2017
Expenditures Description Actual Actual Revised Request
001.060.530100 Insurance 26,581 11,817 26,588 27,917 001.060.531700 Internal Support - Svce Ctr Bldg 722 677 1,000 1,000 001.060.534100 Building & Grounds Supplies 3,614 2,273 4,000 3,500 001.060.534200 Equipment Maintenance Supplies 0 0 1,500 3,000 001.060.534300 Vehicle Maintenance Supplies 0 0 500 500 001.060.534400 Protection and Safety Equipment 0 0 100 100 001.060.534500 Hand Tools 0 0 250 250 001.060.535900 Other Operating Supplies 0 0 1,000 1,000 001.060.537900 Fuel 469 152 750 750
TOTAL COMMODITIES 31,386 14,919 35,688 38,017
001.060.551600 Building and Structural Imprv 5,000 0 0 22,000 001.060.551700 Grounds Improvements 27,000 0 0 0
TOTAL CAPITAL OUTLAY 32,000 0 0 22,000
001.060.581200 Transfer to CIP 0 32,000 25,000 25,000
TRANSFERS OUT 0 32,000 25,000 25,000
GRAND TOTAL 254,275 226,579 236,613 271,154
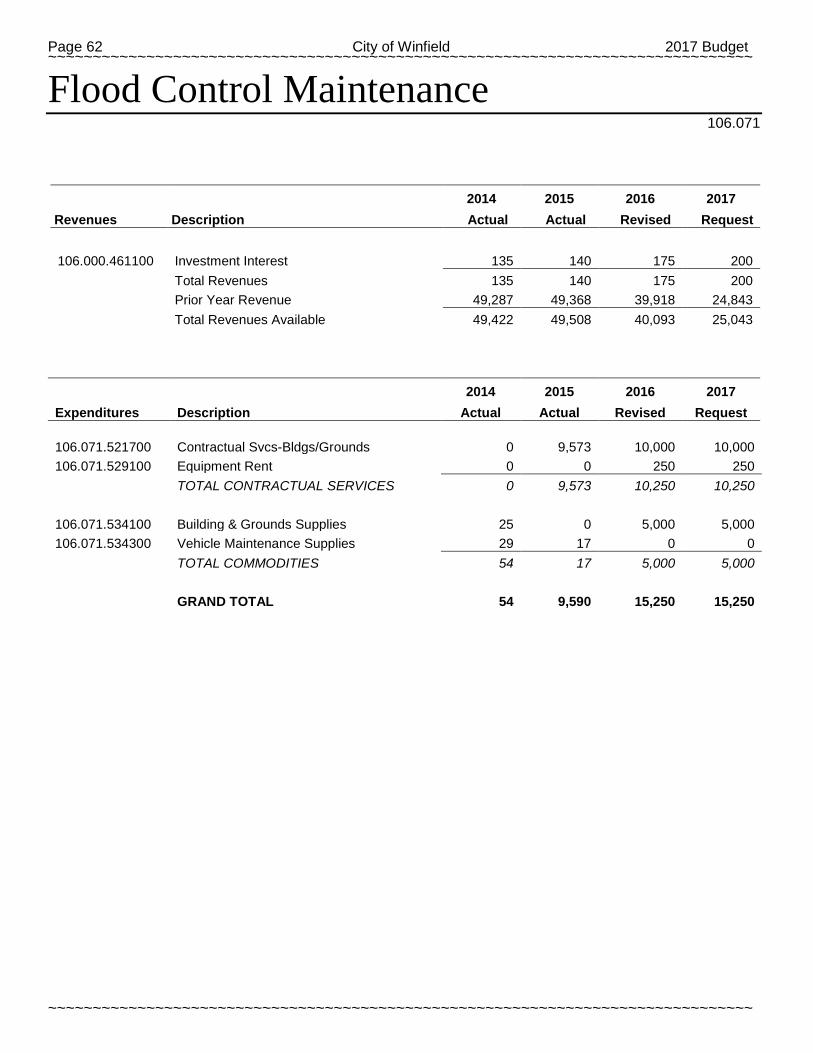
Page 62 City of Winfield 2017 Budget ~~~~~~~~~~~~~~~~~~~~~~~~~~~~~~~~~~~~~~~~~~~~~~~~~~~~~~~~~~~~~~~~~~~~~~~~~~~~~~~
~~~~~~~~~~~~~~~~~~~~~~~~~~~~~~~~~~~~~~~~~~~~~~~~~~~~~~~~~~~~~~~~~~~~~~~~~~~~~~~
Flood Control Maintenance 106.071
2014 2015 2016 2017
Revenues Description Actual Actual Revised Request
106.000.461100 Investment Interest 135 140 175 200
Total Revenues 135 140 175 200
Prior Year Revenue 49,287 49,368 39,918 24,843
Total Revenues Available 49,422 49,508 40,093 25,043
2014 2015 2016 2017
Expenditures Description Actual Actual Revised Request
106.071.521700 Contractual Svcs-Bldgs/Grounds 0 9,573 10,000 10,000 106.071.529100 Equipment Rent 0 0 250 250
TOTAL CONTRACTUAL SERVICES 0 9,573 10,250 10,250
106.071.534100 Building & Grounds Supplies 25 0 5,000 5,000 106.071.534300 Vehicle Maintenance Supplies 29 17 0 0
TOTAL COMMODITIES 54 17 5,000 5,000
GRAND TOTAL 54 9,590 15,250 15,250
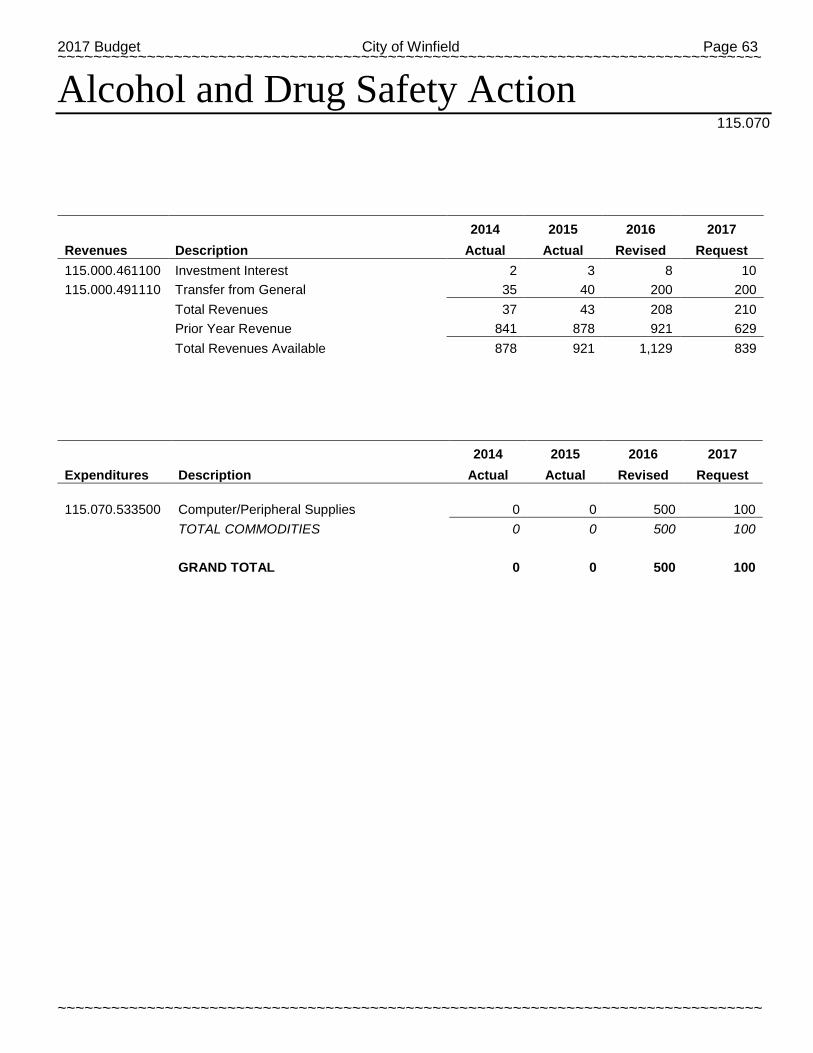
2017 Budget City of Winfield Page 63 ~~~~~~~~~~~~~~~~~~~~~~~~~~~~~~~~~~~~~~~~~~~~~~~~~~~~~~~~~~~~~~~~~~~~~~~~~~~~~~~
~~~~~~~~~~~~~~~~~~~~~~~~~~~~~~~~~~~~~~~~~~~~~~~~~~~~~~~~~~~~~~~~~~~~~~~~~~~~~~~
Alcohol and Drug Safety Action 115.070
2014 2015 2016 2017
Revenues Description Actual Actual Revised Request 115.000.461100 Investment Interest 2 3 8 10 115.000.491110 Transfer from General 35 40 200 200
Total Revenues 37 43 208 210
Prior Year Revenue 841 878 921 629
Total Revenues Available 878 921 1,129 839
2014 2015 2016 2017
Expenditures Description Actual Actual Revised Request
115.070.533500 Computer/Peripheral Supplies 0 0 500 100
TOTAL COMMODITIES 0 0 500 100
GRAND TOTAL 0 0 500 100
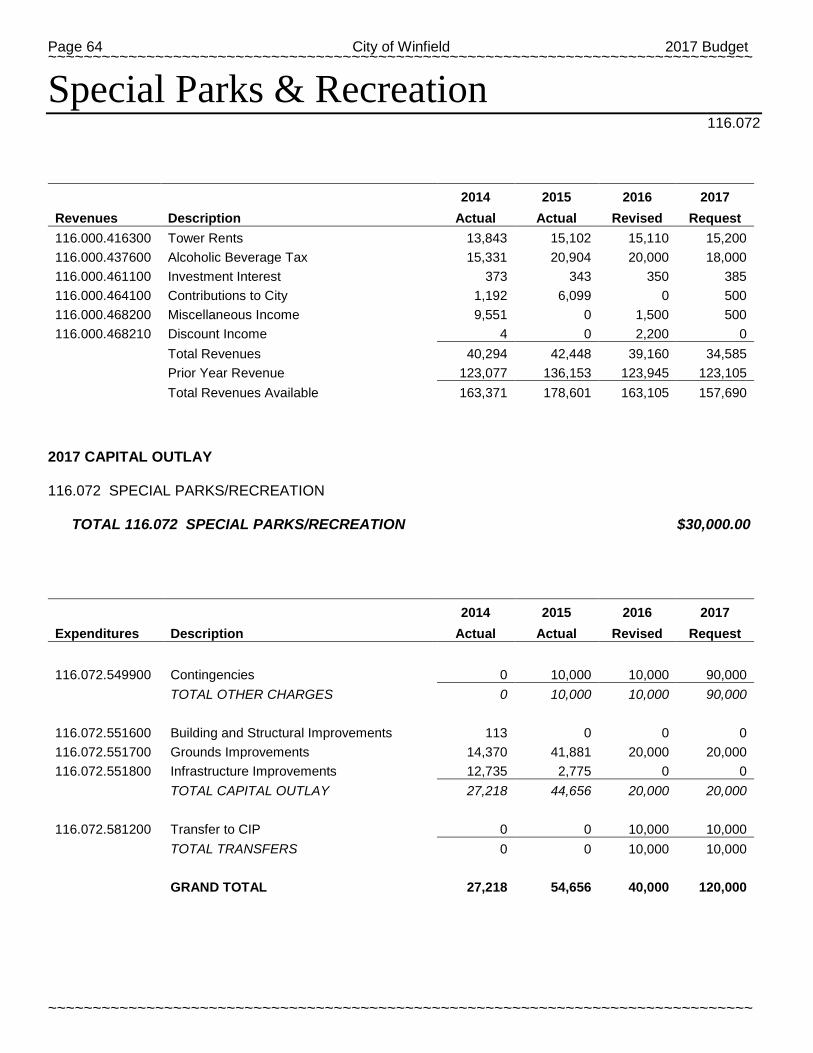
Page 64 City of Winfield 2017 Budget ~~~~~~~~~~~~~~~~~~~~~~~~~~~~~~~~~~~~~~~~~~~~~~~~~~~~~~~~~~~~~~~~~~~~~~~~~~~~~~~
~~~~~~~~~~~~~~~~~~~~~~~~~~~~~~~~~~~~~~~~~~~~~~~~~~~~~~~~~~~~~~~~~~~~~~~~~~~~~~~
Special Parks & Recreation 116.072
2014 2015 2016 2017
Revenues Description Actual Actual Revised Request 116.000.416300 Tower Rents 13,843 15,102 15,110 15,200 116.000.437600 Alcoholic Beverage Tax 15,331 20,904 20,000 18,000 116.000.461100 Investment Interest 373 343 350 385 116.000.464100 Contributions to City 1,192 6,099 0 500 116.000.468200 Miscellaneous Income 9,551 0 1,500 500 116.000.468210 Discount Income 4 0 2,200 0
Total Revenues 40,294 42,448 39,160 34,585
Prior Year Revenue 123,077 136,153 123,945 123,105
Total Revenues Available 163,371 178,601 163,105 157,690
2017 CAPITAL OUTLAY 116.072 SPECIAL PARKS/RECREATION TOTAL 116.072 SPECIAL PARKS/RECREATION $30,000.00
2014 2015 2016 2017
Expenditures Description Actual Actual Revised Request
116.072.549900 Contingencies 0 10,000 10,000 90,000
TOTAL OTHER CHARGES 0 10,000 10,000 90,000
116.072.551600 Building and Structural Improvements 113 0 0 0 116.072.551700 Grounds Improvements 14,370 41,881 20,000 20,000 116.072.551800 Infrastructure Improvements 12,735 2,775 0 0
TOTAL CAPITAL OUTLAY 27,218 44,656 20,000 20,000
116.072.581200 Transfer to CIP 0 0 10,000 10,000
TOTAL TRANSFERS 0 0 10,000 10,000
GRAND TOTAL 27,218 54,656 40,000 120,000
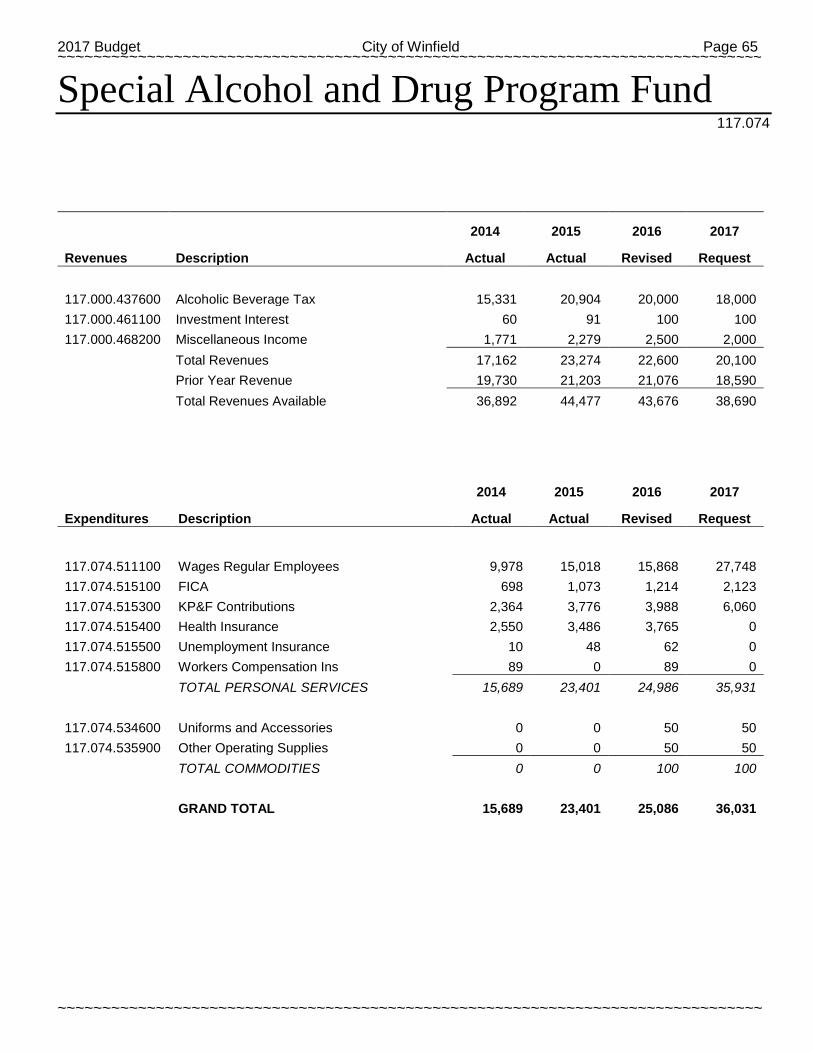
2017 Budget City of Winfield Page 65 ~~~~~~~~~~~~~~~~~~~~~~~~~~~~~~~~~~~~~~~~~~~~~~~~~~~~~~~~~~~~~~~~~~~~~~~~~~~~~~~
~~~~~~~~~~~~~~~~~~~~~~~~~~~~~~~~~~~~~~~~~~~~~~~~~~~~~~~~~~~~~~~~~~~~~~~~~~~~~~~
Special Alcohol and Drug Program Fund 117.074
2014 2015 2016 2017
Revenues Description Actual Actual Revised Request
117.000.437600 Alcoholic Beverage Tax 15,331 20,904 20,000 18,000 117.000.461100 Investment Interest 60 91 100 100 117.000.468200 Miscellaneous Income 1,771 2,279 2,500 2,000
Total Revenues 17,162 23,274 22,600 20,100
Prior Year Revenue 19,730 21,203 21,076 18,590
Total Revenues Available 36,892 44,477 43,676 38,690
2014 2015 2016 2017
Expenditures Description Actual Actual Revised Request
117.074.511100 Wages Regular Employees 9,978 15,018 15,868 27,748 117.074.515100 FICA 698 1,073 1,214 2,123 117.074.515300 KP&F Contributions 2,364 3,776 3,988 6,060 117.074.515400 Health Insurance 2,550 3,486 3,765 0 117.074.515500 Unemployment Insurance 10 48 62 0 117.074.515800 Workers Compensation Ins 89 0 89 0
TOTAL PERSONAL SERVICES 15,689 23,401 24,986 35,931
117.074.534600 Uniforms and Accessories 0 0 50 50 117.074.535900 Other Operating Supplies 0 0 50 50
TOTAL COMMODITIES 0 0 100 100
GRAND TOTAL 15,689 23,401 25,086 36,031
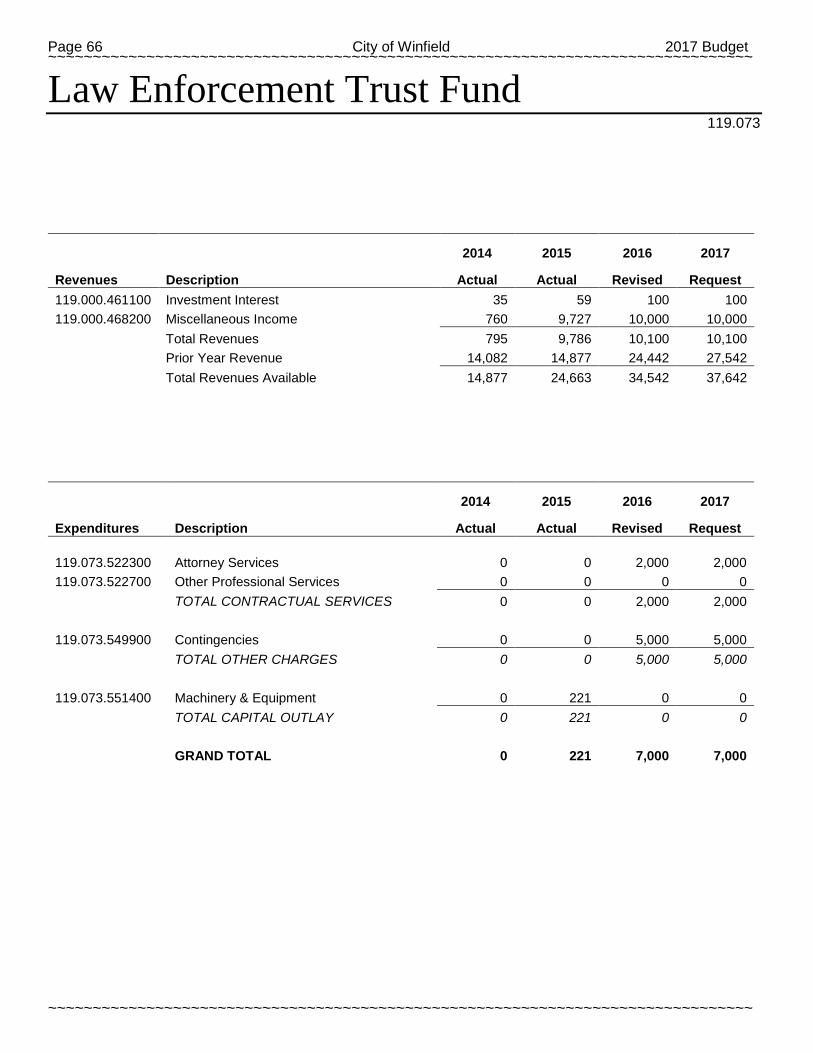
Page 66 City of Winfield 2017 Budget ~~~~~~~~~~~~~~~~~~~~~~~~~~~~~~~~~~~~~~~~~~~~~~~~~~~~~~~~~~~~~~~~~~~~~~~~~~~~~~~
~~~~~~~~~~~~~~~~~~~~~~~~~~~~~~~~~~~~~~~~~~~~~~~~~~~~~~~~~~~~~~~~~~~~~~~~~~~~~~~
Law Enforcement Trust Fund 119.073
2014 2015 2016 2017
Revenues Description Actual Actual Revised Request 119.000.461100 Investment Interest 35 59 100 100 119.000.468200 Miscellaneous Income 760 9,727 10,000 10,000
Total Revenues 795 9,786 10,100 10,100
Prior Year Revenue 14,082 14,877 24,442 27,542
Total Revenues Available 14,877 24,663 34,542 37,642
2014 2015 2016 2017
Expenditures Description Actual Actual Revised Request
119.073.522300 Attorney Services 0 0 2,000 2,000 119.073.522700 Other Professional Services 0 0 0 0
TOTAL CONTRACTUAL SERVICES 0 0 2,000 2,000
119.073.549900 Contingencies 0 0 5,000 5,000
TOTAL OTHER CHARGES 0 0 5,000 5,000
119.073.551400 Machinery & Equipment 0 221 0 0
TOTAL CAPITAL OUTLAY 0 221 0 0
GRAND TOTAL 0 221 7,000 7,000
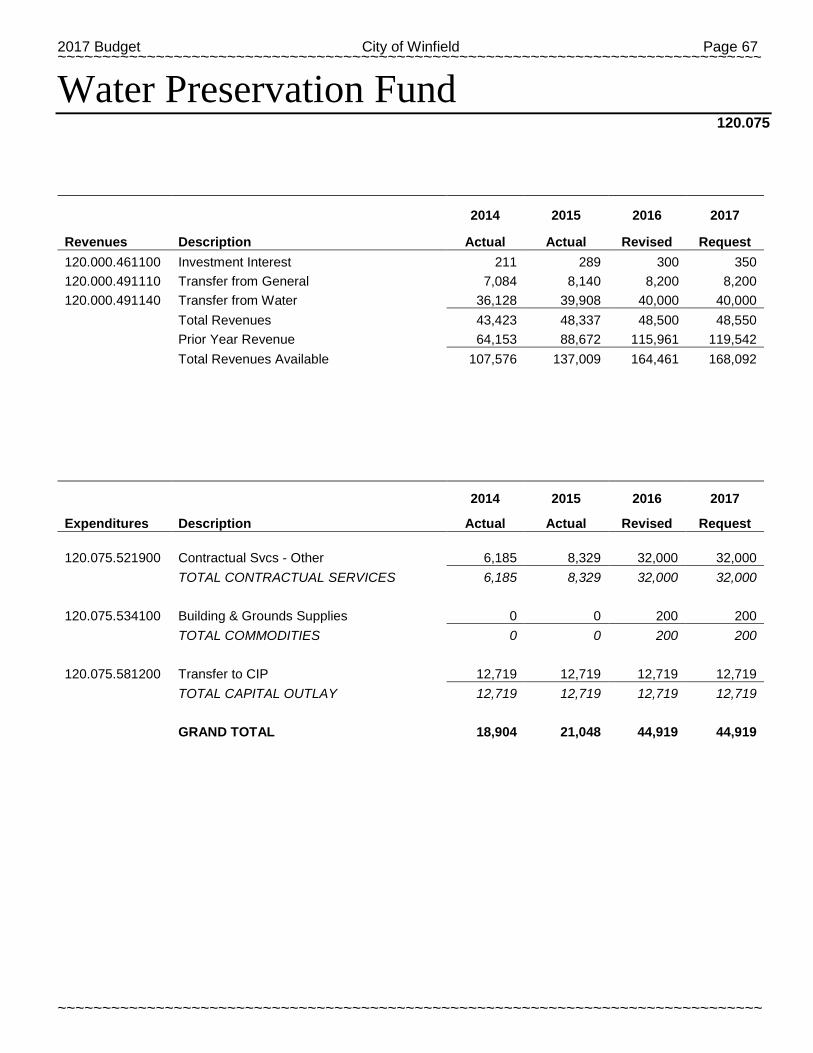
2017 Budget City of Winfield Page 67 ~~~~~~~~~~~~~~~~~~~~~~~~~~~~~~~~~~~~~~~~~~~~~~~~~~~~~~~~~~~~~~~~~~~~~~~~~~~~~~~
~~~~~~~~~~~~~~~~~~~~~~~~~~~~~~~~~~~~~~~~~~~~~~~~~~~~~~~~~~~~~~~~~~~~~~~~~~~~~~~
Water Preservation Fund 120.075
2014 2015 2016 2017
Revenues Description Actual Actual Revised Request 120.000.461100 Investment Interest 211 289 300 350 120.000.491110 Transfer from General 7,084 8,140 8,200 8,200 120.000.491140 Transfer from Water 36,128 39,908 40,000 40,000
Total Revenues 43,423 48,337 48,500 48,550
Prior Year Revenue 64,153 88,672 115,961 119,542
Total Revenues Available 107,576 137,009 164,461 168,092
2014 2015 2016 2017
Expenditures Description Actual Actual Revised Request
120.075.521900 Contractual Svcs - Other 6,185 8,329 32,000 32,000
TOTAL CONTRACTUAL SERVICES 6,185 8,329 32,000 32,000
120.075.534100 Building & Grounds Supplies 0 0 200 200
TOTAL COMMODITIES 0 0 200 200
120.075.581200 Transfer to CIP 12,719 12,719 12,719 12,719
TOTAL CAPITAL OUTLAY 12,719 12,719 12,719 12,719
GRAND TOTAL 18,904 21,048 44,919 44,919
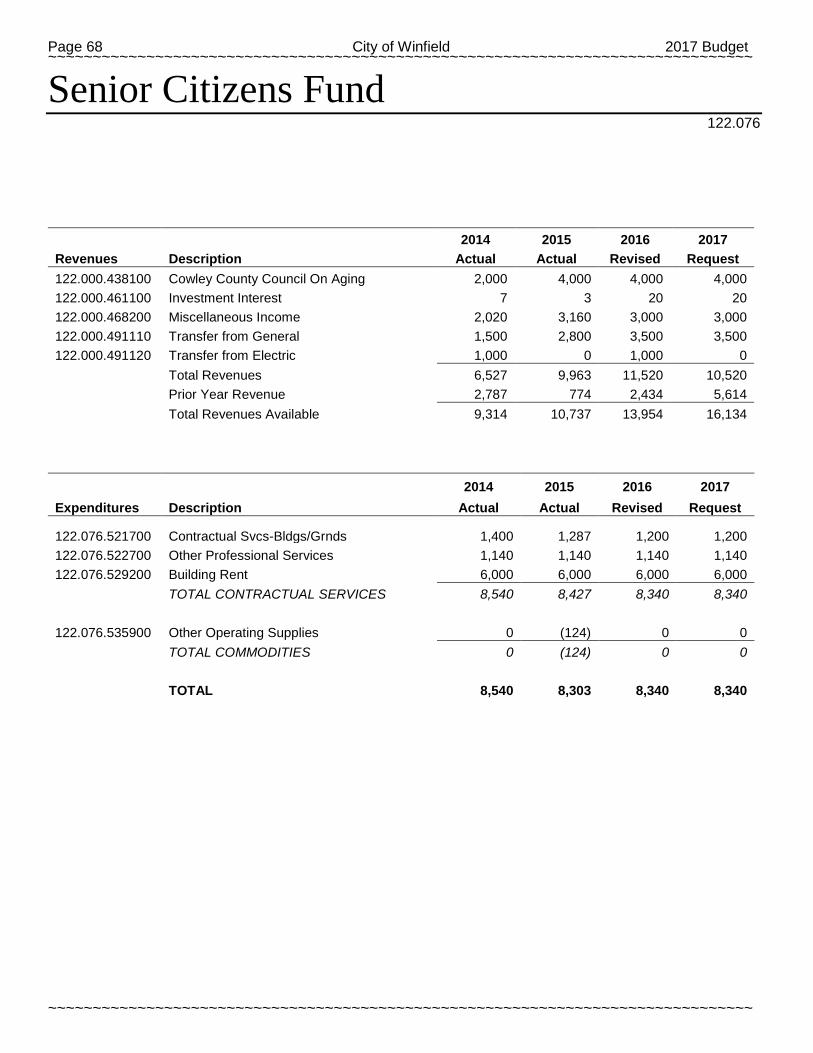
Page 68 City of Winfield 2017 Budget ~~~~~~~~~~~~~~~~~~~~~~~~~~~~~~~~~~~~~~~~~~~~~~~~~~~~~~~~~~~~~~~~~~~~~~~~~~~~~~~
~~~~~~~~~~~~~~~~~~~~~~~~~~~~~~~~~~~~~~~~~~~~~~~~~~~~~~~~~~~~~~~~~~~~~~~~~~~~~~~
Senior Citizens Fund 122.076
2014 2015 2016 2017
Revenues Description Actual Actual Revised Request 122.000.438100 Cowley County Council On Aging 2,000 4,000 4,000 4,000 122.000.461100 Investment Interest 7 3 20 20 122.000.468200 Miscellaneous Income 2,020 3,160 3,000 3,000 122.000.491110 Transfer from General 1,500 2,800 3,500 3,500 122.000.491120 Transfer from Electric 1,000 0 1,000 0
Total Revenues 6,527 9,963 11,520 10,520
Prior Year Revenue 2,787 774 2,434 5,614
Total Revenues Available 9,314 10,737 13,954 16,134
2014 2015 2016 2017
Expenditures Description Actual Actual Revised Request
122.076.521700 Contractual Svcs-Bldgs/Grnds 1,400 1,287 1,200 1,200 122.076.522700 Other Professional Services 1,140 1,140 1,140 1,140 122.076.529200 Building Rent 6,000 6,000 6,000 6,000
TOTAL CONTRACTUAL SERVICES 8,540 8,427 8,340 8,340
122.076.535900 Other Operating Supplies 0 (124) 0 0
TOTAL COMMODITIES 0 (124) 0 0
TOTAL 8,540 8,303 8,340 8,340
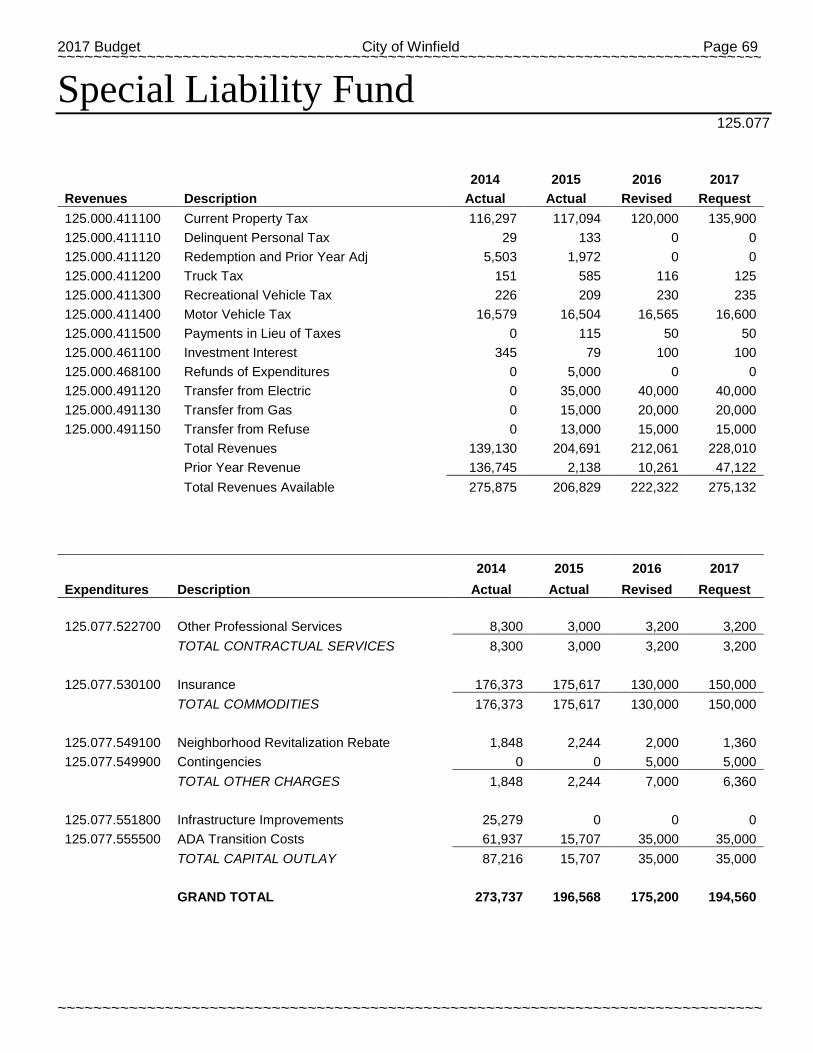
2017 Budget City of Winfield Page 69 ~~~~~~~~~~~~~~~~~~~~~~~~~~~~~~~~~~~~~~~~~~~~~~~~~~~~~~~~~~~~~~~~~~~~~~~~~~~~~~~
~~~~~~~~~~~~~~~~~~~~~~~~~~~~~~~~~~~~~~~~~~~~~~~~~~~~~~~~~~~~~~~~~~~~~~~~~~~~~~~
Special Liability Fund 125.077
2014 2015 2016 2017
Revenues Description Actual Actual Revised Request 125.000.411100 Current Property Tax 116,297 117,094 120,000 135,900 125.000.411110 Delinquent Personal Tax 29 133 0 0 125.000.411120 Redemption and Prior Year Adj 5,503 1,972 0 0 125.000.411200 Truck Tax 151 585 116 125 125.000.411300 Recreational Vehicle Tax 226 209 230 235 125.000.411400 Motor Vehicle Tax 16,579 16,504 16,565 16,600 125.000.411500 Payments in Lieu of Taxes 0 115 50 50 125.000.461100 Investment Interest 345 79 100 100 125.000.468100 Refunds of Expenditures 0 5,000 0 0 125.000.491120 Transfer from Electric 0 35,000 40,000 40,000 125.000.491130 Transfer from Gas 0 15,000 20,000 20,000 125.000.491150 Transfer from Refuse 0 13,000 15,000 15,000
Total Revenues 139,130 204,691 212,061 228,010
Prior Year Revenue 136,745 2,138 10,261 47,122
Total Revenues Available 275,875 206,829 222,322 275,132
2014 2015 2016 2017
Expenditures Description Actual Actual Revised Request
125.077.522700 Other Professional Services 8,300 3,000 3,200 3,200
TOTAL CONTRACTUAL SERVICES 8,300 3,000 3,200 3,200
125.077.530100 Insurance 176,373 175,617 130,000 150,000
TOTAL COMMODITIES 176,373 175,617 130,000 150,000
125.077.549100 Neighborhood Revitalization Rebate 1,848 2,244 2,000 1,360 125.077.549900 Contingencies 0 0 5,000 5,000
TOTAL OTHER CHARGES 1,848 2,244 7,000 6,360
125.077.551800 Infrastructure Improvements 25,279 0 0 0 125.077.555500 ADA Transition Costs 61,937 15,707 35,000 35,000
TOTAL CAPITAL OUTLAY 87,216 15,707 35,000 35,000
GRAND TOTAL 273,737 196,568 175,200 194,560
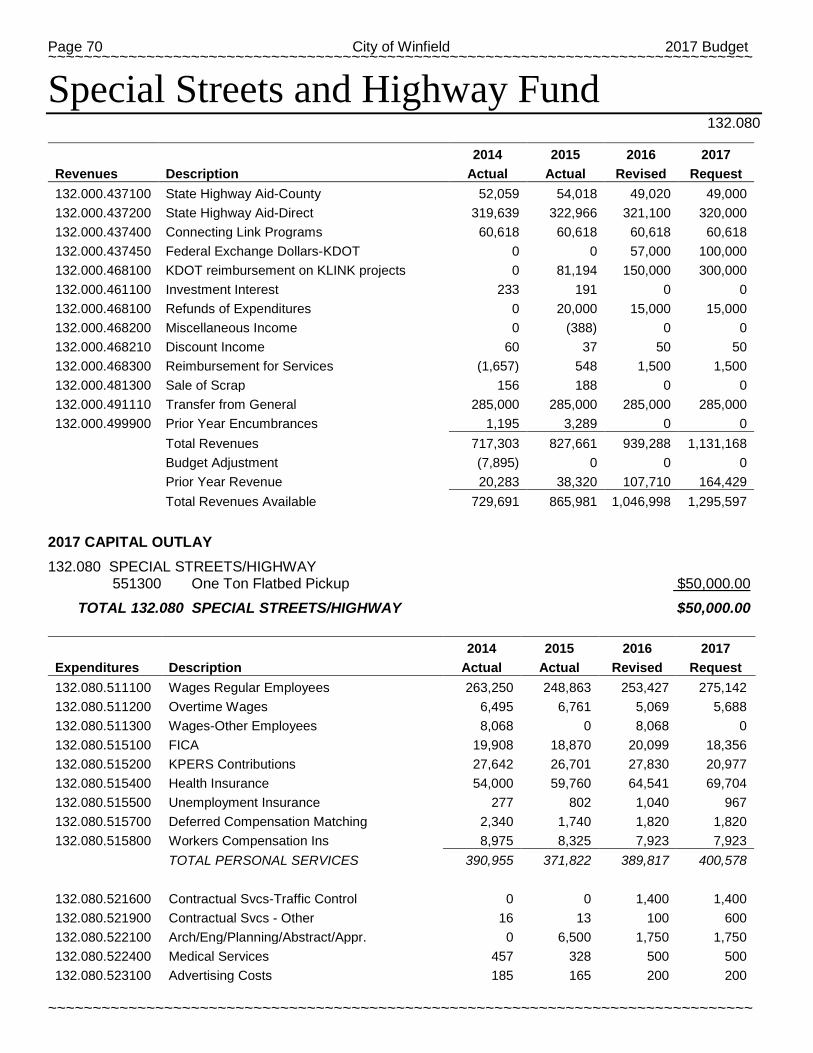
Page 70 City of Winfield 2017 Budget ~~~~~~~~~~~~~~~~~~~~~~~~~~~~~~~~~~~~~~~~~~~~~~~~~~~~~~~~~~~~~~~~~~~~~~~~~~~~~~~
~~~~~~~~~~~~~~~~~~~~~~~~~~~~~~~~~~~~~~~~~~~~~~~~~~~~~~~~~~~~~~~~~~~~~~~~~~~~~~~
Special Streets and Highway Fund 132.080
2014 2015 2016 2017
Revenues Description Actual Actual Revised Request 132.000.437100 State Highway Aid-County 52,059 54,018 49,020 49,000 132.000.437200 State Highway Aid-Direct 319,639 322,966 321,100 320,000 132.000.437400 Connecting Link Programs 60,618 60,618 60,618 60,618 132.000.437450 Federal Exchange Dollars-KDOT 0 0 57,000 100,000 132.000.468100 KDOT reimbursement on KLINK projects 0 81,194 150,000 300,000 132.000.461100 Investment Interest 233 191 0 0 132.000.468100 Refunds of Expenditures 0 20,000 15,000 15,000 132.000.468200 Miscellaneous Income 0 (388) 0 0 132.000.468210 Discount Income 60 37 50 50 132.000.468300 Reimbursement for Services (1,657) 548 1,500 1,500 132.000.481300 Sale of Scrap 156 188 0 0 132.000.491110 Transfer from General 285,000 285,000 285,000 285,000 132.000.499900 Prior Year Encumbrances 1,195 3,289 0 0
Total Revenues 717,303 827,661 939,288 1,131,168
Budget Adjustment (7,895) 0 0 0
Prior Year Revenue 20,283 38,320 107,710 164,429
Total Revenues Available 729,691 865,981 1,046,998 1,295,597
2017 CAPITAL OUTLAY
132.080 SPECIAL STREETS/HIGHWAY 551300 One Ton Flatbed Pickup $50,000.00
TOTAL 132.080 SPECIAL STREETS/HIGHWAY $50,000.00
2014 2015 2016 2017
Expenditures Description Actual Actual Revised Request 132.080.511100 Wages Regular Employees 263,250 248,863 253,427 275,142 132.080.511200 Overtime Wages 6,495 6,761 5,069 5,688 132.080.511300 Wages-Other Employees 8,068 0 8,068 0 132.080.515100 FICA 19,908 18,870 20,099 18,356 132.080.515200 KPERS Contributions 27,642 26,701 27,830 20,977 132.080.515400 Health Insurance 54,000 59,760 64,541 69,704 132.080.515500 Unemployment Insurance 277 802 1,040 967 132.080.515700 Deferred Compensation Matching 2,340 1,740 1,820 1,820 132.080.515800 Workers Compensation Ins 8,975 8,325 7,923 7,923
TOTAL PERSONAL SERVICES 390,955 371,822 389,817 400,578
132.080.521600 Contractual Svcs-Traffic Control 0 0 1,400 1,400 132.080.521900 Contractual Svcs - Other 16 13 100 600 132.080.522100 Arch/Eng/Planning/Abstract/Appr. 0 6,500 1,750 1,750 132.080.522400 Medical Services 457 328 500 500 132.080.523100 Advertising Costs 185 165 200 200
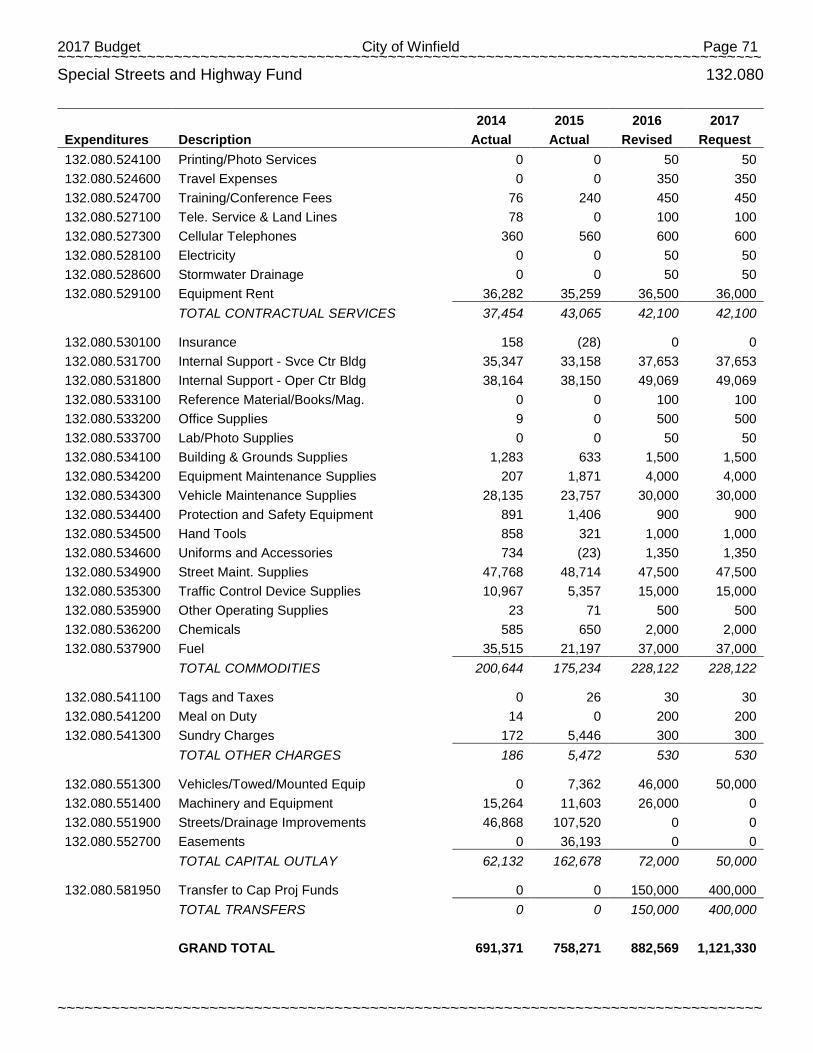
2017 Budget City of Winfield Page 71 ~~~~~~~~~~~~~~~~~~~~~~~~~~~~~~~~~~~~~~~~~~~~~~~~~~~~~~~~~~~~~~~~~~~~~~~~~~~~~~~
~~~~~~~~~~~~~~~~~~~~~~~~~~~~~~~~~~~~~~~~~~~~~~~~~~~~~~~~~~~~~~~~~~~~~~~~~~~~~~~
Special Streets and Highway Fund 132.080
2014 2015 2016 2017
Expenditures Description Actual Actual Revised Request 132.080.524100 Printing/Photo Services 0 0 50 50 132.080.524600 Travel Expenses 0 0 350 350 132.080.524700 Training/Conference Fees 76 240 450 450 132.080.527100 Tele. Service & Land Lines 78 0 100 100 132.080.527300 Cellular Telephones 360 560 600 600 132.080.528100 Electricity 0 0 50 50 132.080.528600 Stormwater Drainage 0 0 50 50 132.080.529100 Equipment Rent 36,282 35,259 36,500 36,000
TOTAL CONTRACTUAL SERVICES 37,454 43,065 42,100 42,100
132.080.530100 Insurance 158 (28) 0 0 132.080.531700 Internal Support - Svce Ctr Bldg 35,347 33,158 37,653 37,653 132.080.531800 Internal Support - Oper Ctr Bldg 38,164 38,150 49,069 49,069 132.080.533100 Reference Material/Books/Mag. 0 0 100 100 132.080.533200 Office Supplies 9 0 500 500 132.080.533700 Lab/Photo Supplies 0 0 50 50 132.080.534100 Building & Grounds Supplies 1,283 633 1,500 1,500 132.080.534200 Equipment Maintenance Supplies 207 1,871 4,000 4,000 132.080.534300 Vehicle Maintenance Supplies 28,135 23,757 30,000 30,000 132.080.534400 Protection and Safety Equipment 891 1,406 900 900 132.080.534500 Hand Tools 858 321 1,000 1,000 132.080.534600 Uniforms and Accessories 734 (23) 1,350 1,350 132.080.534900 Street Maint. Supplies 47,768 48,714 47,500 47,500 132.080.535300 Traffic Control Device Supplies 10,967 5,357 15,000 15,000 132.080.535900 Other Operating Supplies 23 71 500 500 132.080.536200 Chemicals 585 650 2,000 2,000 132.080.537900 Fuel 35,515 21,197 37,000 37,000
TOTAL COMMODITIES 200,644 175,234 228,122 228,122
132.080.541100 Tags and Taxes 0 26 30 30 132.080.541200 Meal on Duty 14 0 200 200 132.080.541300 Sundry Charges 172 5,446 300 300
TOTAL OTHER CHARGES 186 5,472 530 530
132.080.551300 Vehicles/Towed/Mounted Equip 0 7,362 46,000 50,000 132.080.551400 Machinery and Equipment 15,264 11,603 26,000 0 132.080.551900 Streets/Drainage Improvements 46,868 107,520 0 0 132.080.552700 Easements 0 36,193 0 0
TOTAL CAPITAL OUTLAY 62,132 162,678 72,000 50,000
132.080.581950 Transfer to Cap Proj Funds 0 0 150,000 400,000
TOTAL TRANSFERS 0 0 150,000 400,000
GRAND TOTAL 691,371 758,271 882,569 1,121,330
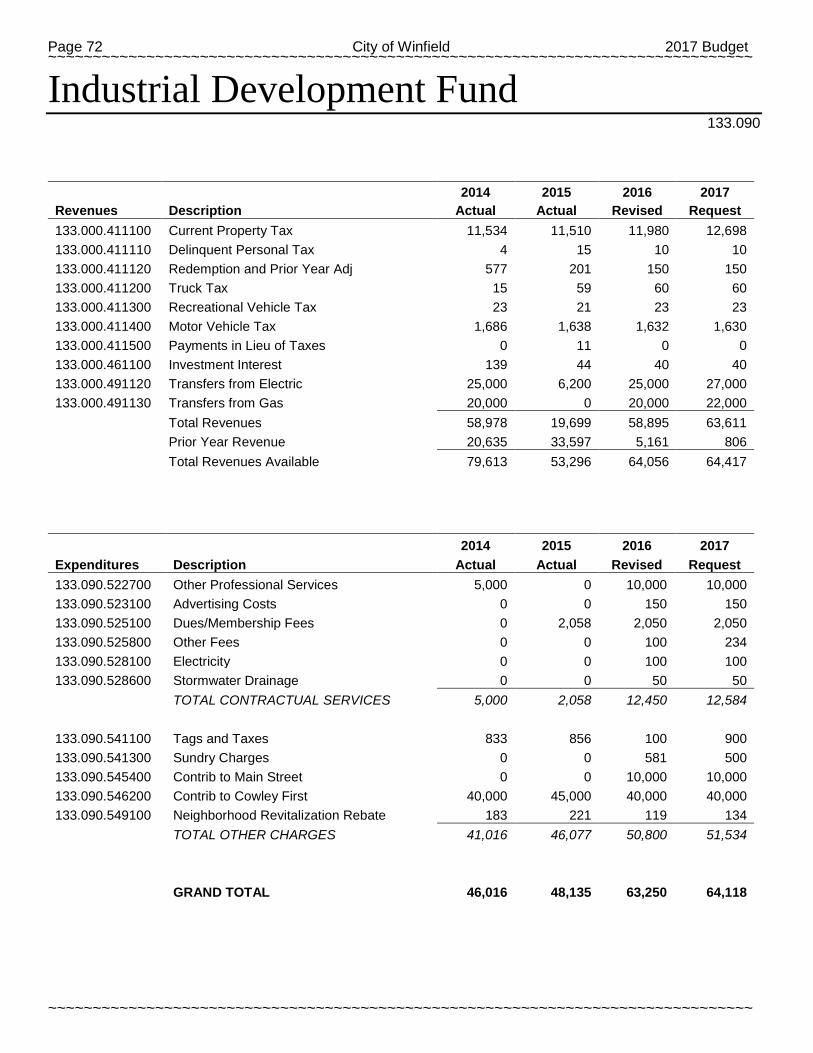
Page 72 City of Winfield 2017 Budget ~~~~~~~~~~~~~~~~~~~~~~~~~~~~~~~~~~~~~~~~~~~~~~~~~~~~~~~~~~~~~~~~~~~~~~~~~~~~~~~
~~~~~~~~~~~~~~~~~~~~~~~~~~~~~~~~~~~~~~~~~~~~~~~~~~~~~~~~~~~~~~~~~~~~~~~~~~~~~~~
Industrial Development Fund 133.090
2014 2015 2016 2017
Revenues Description Actual Actual Revised Request 133.000.411100 Current Property Tax 11,534 11,510 11,980 12,698 133.000.411110 Delinquent Personal Tax 4 15 10 10 133.000.411120 Redemption and Prior Year Adj 577 201 150 150 133.000.411200 Truck Tax 15 59 60 60 133.000.411300 Recreational Vehicle Tax 23 21 23 23 133.000.411400 Motor Vehicle Tax 1,686 1,638 1,632 1,630 133.000.411500 Payments in Lieu of Taxes 0 11 0 0 133.000.461100 Investment Interest 139 44 40 40 133.000.491120 Transfers from Electric 25,000 6,200 25,000 27,000 133.000.491130 Transfers from Gas 20,000 0 20,000 22,000
Total Revenues 58,978 19,699 58,895 63,611
Prior Year Revenue 20,635 33,597 5,161 806
Total Revenues Available 79,613 53,296 64,056 64,417
2014 2015 2016 2017
Expenditures Description Actual Actual Revised Request 133.090.522700 Other Professional Services 5,000 0 10,000 10,000 133.090.523100 Advertising Costs 0 0 150 150 133.090.525100 Dues/Membership Fees 0 2,058 2,050 2,050 133.090.525800 Other Fees 0 0 100 234 133.090.528100 Electricity 0 0 100 100 133.090.528600 Stormwater Drainage 0 0 50 50
TOTAL CONTRACTUAL SERVICES 5,000 2,058 12,450 12,584
133.090.541100 Tags and Taxes 833 856 100 900 133.090.541300 Sundry Charges 0 0 581 500 133.090.545400 Contrib to Main Street 0 0 10,000 10,000 133.090.546200 Contrib to Cowley First 40,000 45,000 40,000 40,000 133.090.549100 Neighborhood Revitalization Rebate 183 221 119 134
TOTAL OTHER CHARGES 41,016 46,077 50,800 51,534
GRAND TOTAL 46,016 48,135 63,250 64,118
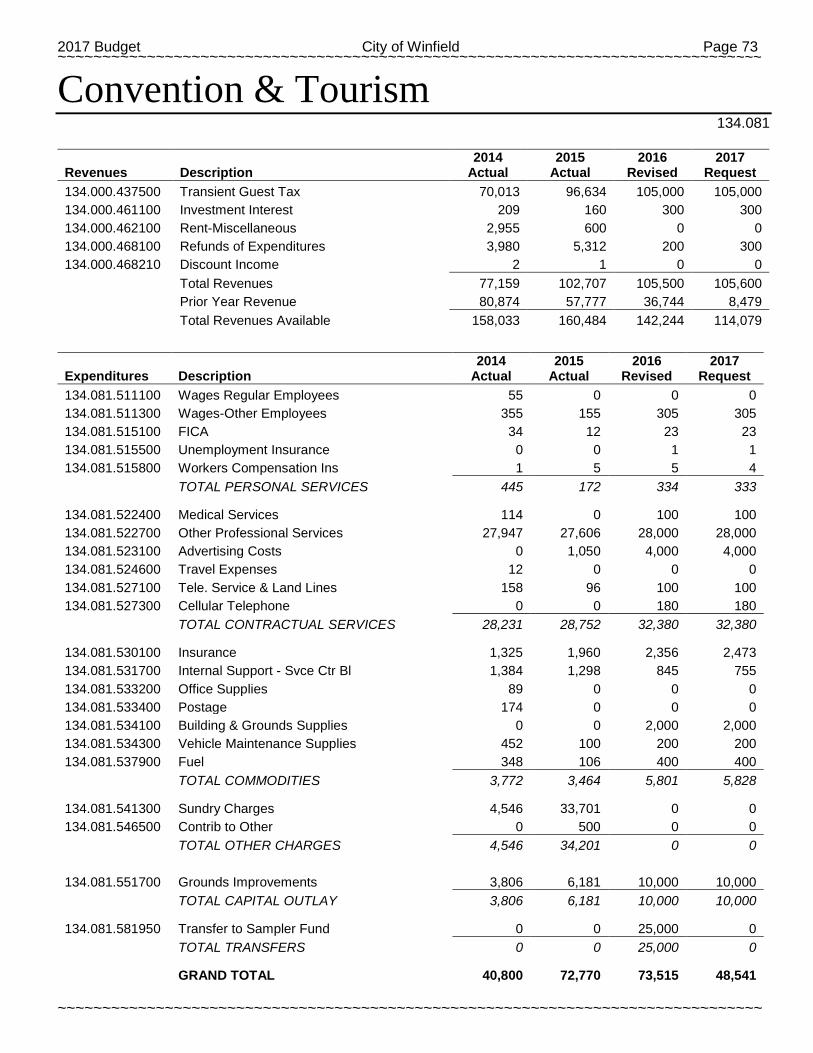
2017 Budget City of Winfield Page 73 ~~~~~~~~~~~~~~~~~~~~~~~~~~~~~~~~~~~~~~~~~~~~~~~~~~~~~~~~~~~~~~~~~~~~~~~~~~~~~~~
~~~~~~~~~~~~~~~~~~~~~~~~~~~~~~~~~~~~~~~~~~~~~~~~~~~~~~~~~~~~~~~~~~~~~~~~~~~~~~~
Convention & Tourism 134.081
2014 2015 2016 2017
Revenues Description Actual Actual Revised Request 134.000.437500 Transient Guest Tax 70,013 96,634 105,000 105,000 134.000.461100 Investment Interest 209 160 300 300 134.000.462100 Rent-Miscellaneous 2,955 600 0 0 134.000.468100 Refunds of Expenditures 3,980 5,312 200 300 134.000.468210 Discount Income 2 1 0 0
Total Revenues 77,159 102,707 105,500 105,600
Prior Year Revenue 80,874 57,777 36,744 8,479
Total Revenues Available 158,033 160,484 142,244 114,079
2014 2015 2016 2017
Expenditures Description Actual Actual Revised Request 134.081.511100 Wages Regular Employees 55 0 0 0 134.081.511300 Wages-Other Employees 355 155 305 305 134.081.515100 FICA 34 12 23 23 134.081.515500 Unemployment Insurance 0 0 1 1 134.081.515800 Workers Compensation Ins 1 5 5 4
TOTAL PERSONAL SERVICES 445 172 334 333
134.081.522400 Medical Services 114 0 100 100 134.081.522700 Other Professional Services 27,947 27,606 28,000 28,000 134.081.523100 Advertising Costs 0 1,050 4,000 4,000 134.081.524600 Travel Expenses 12 0 0 0 134.081.527100 Tele. Service & Land Lines 158 96 100 100 134.081.527300 Cellular Telephone 0 0 180 180
TOTAL CONTRACTUAL SERVICES 28,231 28,752 32,380 32,380
134.081.530100 Insurance 1,325 1,960 2,356 2,473 134.081.531700 Internal Support - Svce Ctr Bl 1,384 1,298 845 755 134.081.533200 Office Supplies 89 0 0 0 134.081.533400 Postage 174 0 0 0 134.081.534100 Building & Grounds Supplies 0 0 2,000 2,000 134.081.534300 Vehicle Maintenance Supplies 452 100 200 200 134.081.537900 Fuel 348 106 400 400
TOTAL COMMODITIES 3,772 3,464 5,801 5,828
134.081.541300 Sundry Charges 4,546 33,701 0 0 134.081.546500 Contrib to Other 0 500 0 0
TOTAL OTHER CHARGES 4,546 34,201 0 0
134.081.551700 Grounds Improvements 3,806 6,181 10,000 10,000
TOTAL CAPITAL OUTLAY 3,806 6,181 10,000 10,000
134.081.581950 Transfer to Sampler Fund 0 0 25,000 0
TOTAL TRANSFERS 0 0 25,000 0
GRAND TOTAL 40,800 72,770 73,515 48,541
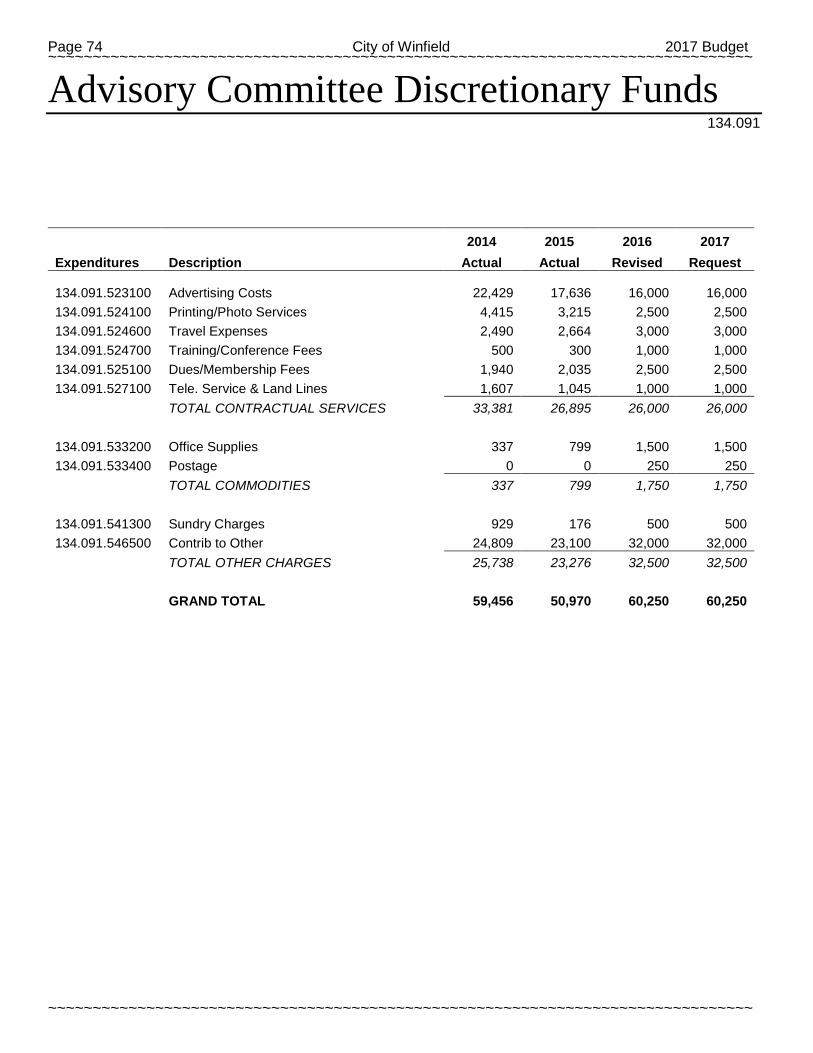
Page 74 City of Winfield 2017 Budget ~~~~~~~~~~~~~~~~~~~~~~~~~~~~~~~~~~~~~~~~~~~~~~~~~~~~~~~~~~~~~~~~~~~~~~~~~~~~~~~
~~~~~~~~~~~~~~~~~~~~~~~~~~~~~~~~~~~~~~~~~~~~~~~~~~~~~~~~~~~~~~~~~~~~~~~~~~~~~~~
Advisory Committee Discretionary Funds 134.091
2014 2015 2016 2017
Expenditures Description Actual Actual Revised Request
134.091.523100 Advertising Costs 22,429 17,636 16,000 16,000 134.091.524100 Printing/Photo Services 4,415 3,215 2,500 2,500 134.091.524600 Travel Expenses 2,490 2,664 3,000 3,000 134.091.524700 Training/Conference Fees 500 300 1,000 1,000 134.091.525100 Dues/Membership Fees 1,940 2,035 2,500 2,500 134.091.527100 Tele. Service & Land Lines 1,607 1,045 1,000 1,000
TOTAL CONTRACTUAL SERVICES 33,381 26,895 26,000 26,000
134.091.533200 Office Supplies 337 799 1,500 1,500 134.091.533400 Postage 0 0 250 250
TOTAL COMMODITIES 337 799 1,750 1,750
134.091.541300 Sundry Charges 929 176 500 500 134.091.546500 Contrib to Other 24,809 23,100 32,000 32,000
TOTAL OTHER CHARGES 25,738 23,276 32,500 32,500
GRAND TOTAL 59,456 50,970 60,250 60,250
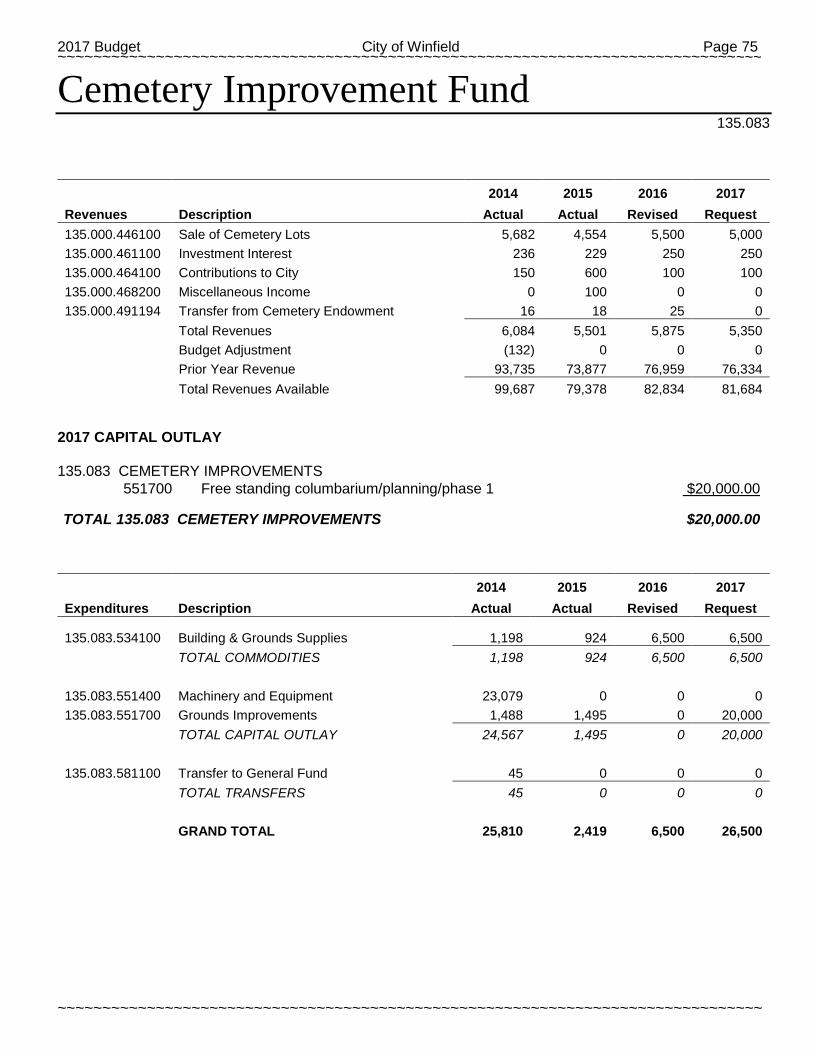
2017 Budget City of Winfield Page 75 ~~~~~~~~~~~~~~~~~~~~~~~~~~~~~~~~~~~~~~~~~~~~~~~~~~~~~~~~~~~~~~~~~~~~~~~~~~~~~~~
~~~~~~~~~~~~~~~~~~~~~~~~~~~~~~~~~~~~~~~~~~~~~~~~~~~~~~~~~~~~~~~~~~~~~~~~~~~~~~~
Cemetery Improvement Fund 135.083
2014 2015 2016 2017
Revenues Description Actual Actual Revised Request 135.000.446100 Sale of Cemetery Lots 5,682 4,554 5,500 5,000 135.000.461100 Investment Interest 236 229 250 250 135.000.464100 Contributions to City 150 600 100 100 135.000.468200 Miscellaneous Income 0 100 0 0 135.000.491194 Transfer from Cemetery Endowment 16 18 25 0
Total Revenues 6,084 5,501 5,875 5,350
Budget Adjustment (132) 0 0 0
Prior Year Revenue 93,735 73,877 76,959 76,334
Total Revenues Available 99,687 79,378 82,834 81,684
2017 CAPITAL OUTLAY 135.083 CEMETERY IMPROVEMENTS 551700 Free standing columbarium/planning/phase 1 $20,000.00 TOTAL 135.083 CEMETERY IMPROVEMENTS $20,000.00
2014 2015 2016 2017
Expenditures Description Actual Actual Revised Request
135.083.534100 Building & Grounds Supplies 1,198 924 6,500 6,500
TOTAL COMMODITIES 1,198 924 6,500 6,500
135.083.551400 Machinery and Equipment 23,079 0 0 0 135.083.551700 Grounds Improvements 1,488 1,495 0 20,000
TOTAL CAPITAL OUTLAY 24,567 1,495 0 20,000
135.083.581100 Transfer to General Fund 45 0 0 0
TOTAL TRANSFERS 45 0 0 0
GRAND TOTAL 25,810 2,419 6,500 26,500
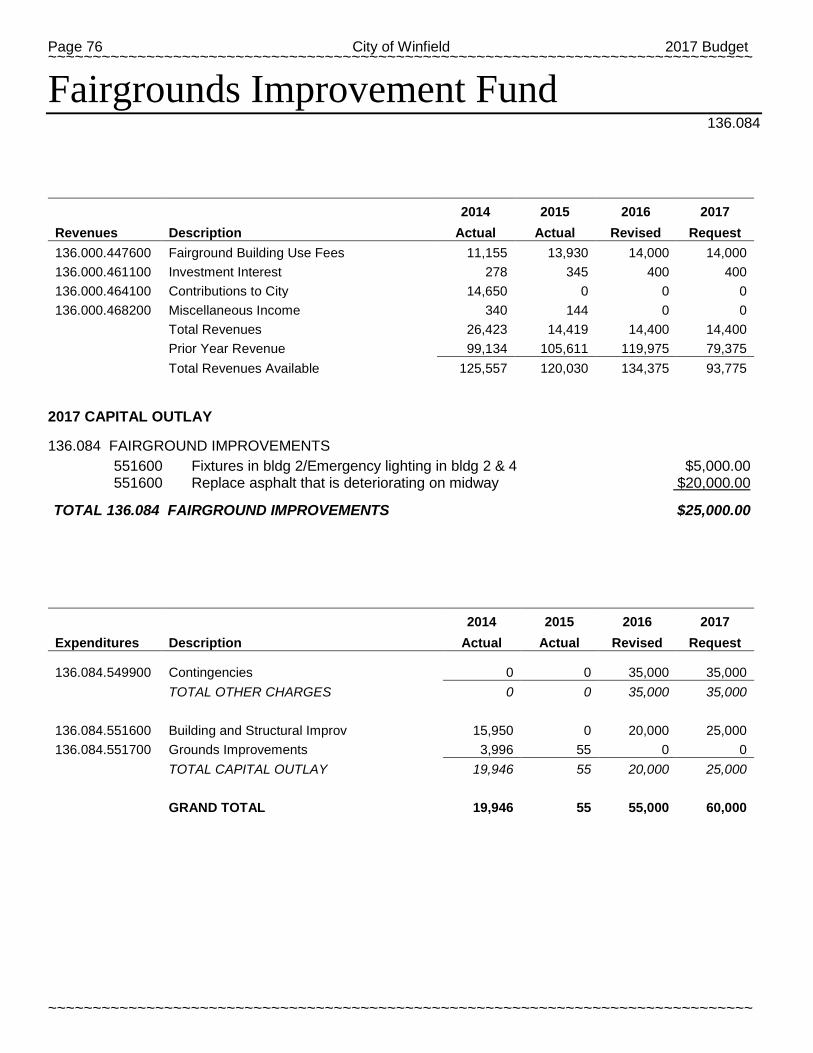
Page 76 City of Winfield 2017 Budget ~~~~~~~~~~~~~~~~~~~~~~~~~~~~~~~~~~~~~~~~~~~~~~~~~~~~~~~~~~~~~~~~~~~~~~~~~~~~~~~
~~~~~~~~~~~~~~~~~~~~~~~~~~~~~~~~~~~~~~~~~~~~~~~~~~~~~~~~~~~~~~~~~~~~~~~~~~~~~~~
Fairgrounds Improvement Fund 136.084
2014 2015 2016 2017
Revenues Description Actual Actual Revised Request 136.000.447600 Fairground Building Use Fees 11,155 13,930 14,000 14,000 136.000.461100 Investment Interest 278 345 400 400 136.000.464100 Contributions to City 14,650 0 0 0 136.000.468200 Miscellaneous Income 340 144 0 0
Total Revenues 26,423 14,419 14,400 14,400
Prior Year Revenue 99,134 105,611 119,975 79,375
Total Revenues Available 125,557 120,030 134,375 93,775
2017 CAPITAL OUTLAY 136.084 FAIRGROUND IMPROVEMENTS 551600 Fixtures in bldg 2/Emergency lighting in bldg 2 & 4 $5,000.00 551600 Replace asphalt that is deteriorating on midway $20,000.00 TOTAL 136.084 FAIRGROUND IMPROVEMENTS $25,000.00
2014 2015 2016 2017
Expenditures Description Actual Actual Revised Request
136.084.549900 Contingencies 0 0 35,000 35,000
TOTAL OTHER CHARGES 0 0 35,000 35,000
136.084.551600 Building and Structural Improv 15,950 0 20,000 25,000 136.084.551700 Grounds Improvements 3,996 55 0 0
TOTAL CAPITAL OUTLAY 19,946 55 20,000 25,000
GRAND TOTAL 19,946 55 55,000 60,000
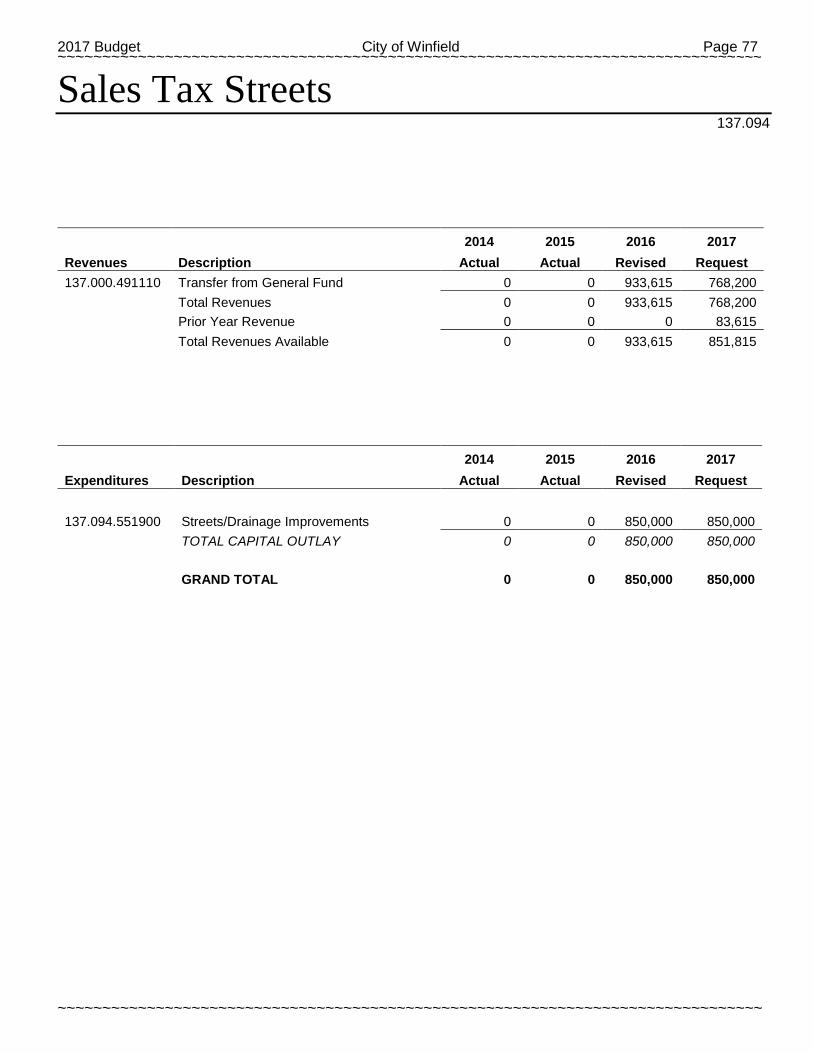
2017 Budget City of Winfield Page 77 ~~~~~~~~~~~~~~~~~~~~~~~~~~~~~~~~~~~~~~~~~~~~~~~~~~~~~~~~~~~~~~~~~~~~~~~~~~~~~~~
~~~~~~~~~~~~~~~~~~~~~~~~~~~~~~~~~~~~~~~~~~~~~~~~~~~~~~~~~~~~~~~~~~~~~~~~~~~~~~~
Sales Tax Streets 137.094
2014 2015 2016 2017
Revenues Description Actual Actual Revised Request 137.000.491110 Transfer from General Fund 0 0 933,615 768,200
Total Revenues 0 0 933,615 768,200
Prior Year Revenue 0 0 0 83,615
Total Revenues Available 0 0 933,615 851,815
2014 2015 2016 2017
Expenditures Description Actual Actual Revised Request
137.094.551900 Streets/Drainage Improvements 0 0 850,000 850,000
TOTAL CAPITAL OUTLAY 0 0 850,000 850,000
GRAND TOTAL 0 0 850,000 850,000
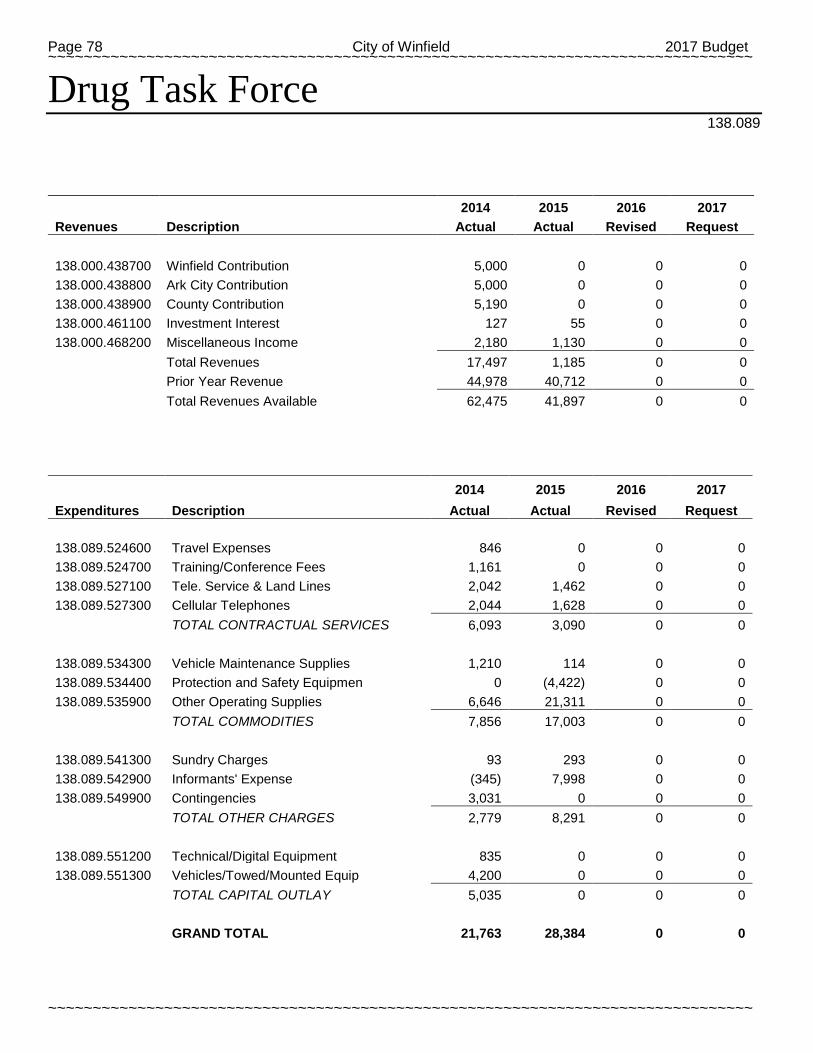
Page 78 City of Winfield 2017 Budget ~~~~~~~~~~~~~~~~~~~~~~~~~~~~~~~~~~~~~~~~~~~~~~~~~~~~~~~~~~~~~~~~~~~~~~~~~~~~~~~
~~~~~~~~~~~~~~~~~~~~~~~~~~~~~~~~~~~~~~~~~~~~~~~~~~~~~~~~~~~~~~~~~~~~~~~~~~~~~~~
Drug Task Force 138.089
2014 2015 2016 2017
Revenues Description Actual Actual Revised Request
138.000.438700 Winfield Contribution 5,000 0 0 0 138.000.438800 Ark City Contribution 5,000 0 0 0 138.000.438900 County Contribution 5,190 0 0 0 138.000.461100 Investment Interest 127 55 0 0 138.000.468200 Miscellaneous Income 2,180 1,130 0 0
Total Revenues 17,497 1,185 0 0
Prior Year Revenue 44,978 40,712 0 0
Total Revenues Available 62,475 41,897 0 0
2014 2015 2016 2017
Expenditures Description Actual Actual Revised Request
138.089.524600 Travel Expenses 846 0 0 0 138.089.524700 Training/Conference Fees 1,161 0 0 0 138.089.527100 Tele. Service & Land Lines 2,042 1,462 0 0 138.089.527300 Cellular Telephones 2,044 1,628 0 0
TOTAL CONTRACTUAL SERVICES 6,093 3,090 0 0
138.089.534300 Vehicle Maintenance Supplies 1,210 114 0 0 138.089.534400 Protection and Safety Equipmen 0 (4,422) 0 0 138.089.535900 Other Operating Supplies 6,646 21,311 0 0
TOTAL COMMODITIES 7,856 17,003 0 0
138.089.541300 Sundry Charges 93 293 0 0 138.089.542900 Informants' Expense (345) 7,998 0 0 138.089.549900 Contingencies 3,031 0 0 0
TOTAL OTHER CHARGES 2,779 8,291 0 0
138.089.551200 Technical/Digital Equipment 835 0 0 0 138.089.551300 Vehicles/Towed/Mounted Equip 4,200 0 0 0
TOTAL CAPITAL OUTLAY 5,035 0 0 0
GRAND TOTAL 21,763 28,384 0 0
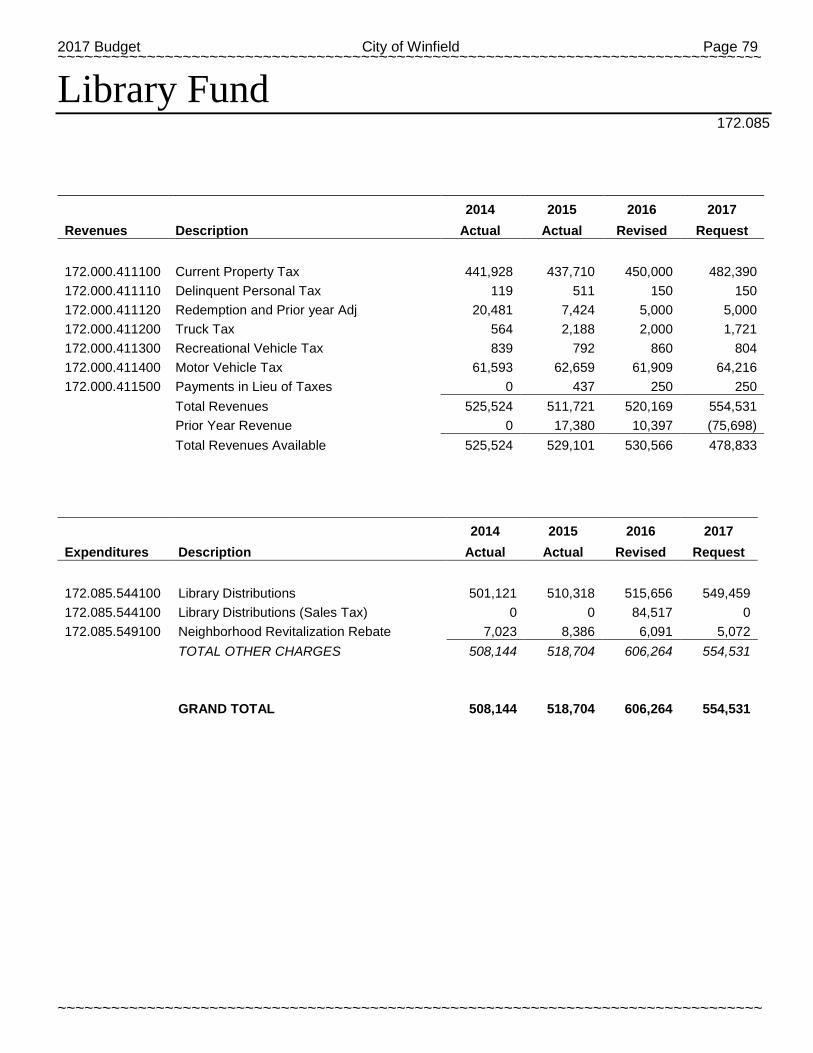
2017 Budget City of Winfield Page 79 ~~~~~~~~~~~~~~~~~~~~~~~~~~~~~~~~~~~~~~~~~~~~~~~~~~~~~~~~~~~~~~~~~~~~~~~~~~~~~~~
~~~~~~~~~~~~~~~~~~~~~~~~~~~~~~~~~~~~~~~~~~~~~~~~~~~~~~~~~~~~~~~~~~~~~~~~~~~~~~~
Library Fund 172.085
2014 2015 2016 2017
Revenues Description Actual Actual Revised Request
172.000.411100 Current Property Tax 441,928 437,710 450,000 482,390 172.000.411110 Delinquent Personal Tax 119 511 150 150 172.000.411120 Redemption and Prior year Adj 20,481 7,424 5,000 5,000 172.000.411200 Truck Tax 564 2,188 2,000 1,721 172.000.411300 Recreational Vehicle Tax 839 792 860 804 172.000.411400 Motor Vehicle Tax 61,593 62,659 61,909 64,216 172.000.411500 Payments in Lieu of Taxes 0 437 250 250
Total Revenues 525,524 511,721 520,169 554,531
Prior Year Revenue 0 17,380 10,397 (75,698)
Total Revenues Available 525,524 529,101 530,566 478,833
2014 2015 2016 2017
Expenditures Description Actual Actual Revised Request
172.085.544100 Library Distributions 501,121 510,318 515,656 549,459 172.085.544100 Library Distributions (Sales Tax) 0 0 84,517 0 172.085.549100 Neighborhood Revitalization Rebate 7,023 8,386 6,091 5,072
TOTAL OTHER CHARGES 508,144 518,704 606,264 554,531
GRAND TOTAL 508,144 518,704 606,264 554,531
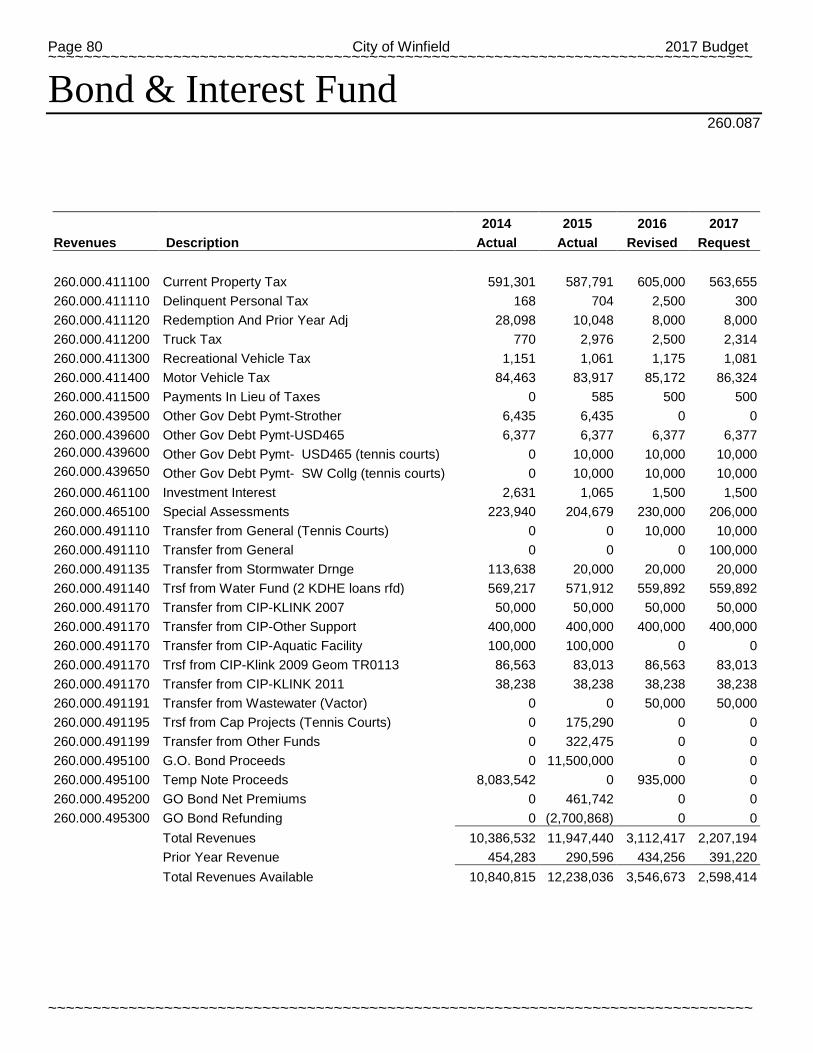
Page 80 City of Winfield 2017 Budget ~~~~~~~~~~~~~~~~~~~~~~~~~~~~~~~~~~~~~~~~~~~~~~~~~~~~~~~~~~~~~~~~~~~~~~~~~~~~~~~
~~~~~~~~~~~~~~~~~~~~~~~~~~~~~~~~~~~~~~~~~~~~~~~~~~~~~~~~~~~~~~~~~~~~~~~~~~~~~~~
Bond & Interest Fund 260.087
2014 2015 2016 2017
Revenues Description Actual Actual Revised Request
260.000.411100 Current Property Tax 591,301 587,791 605,000 563,655 260.000.411110 Delinquent Personal Tax 168 704 2,500 300 260.000.411120 Redemption And Prior Year Adj 28,098 10,048 8,000 8,000 260.000.411200 Truck Tax 770 2,976 2,500 2,314 260.000.411300 Recreational Vehicle Tax 1,151 1,061 1,175 1,081 260.000.411400 Motor Vehicle Tax 84,463 83,917 85,172 86,324 260.000.411500 Payments In Lieu of Taxes 0 585 500 500 260.000.439500 Other Gov Debt Pymt-Strother 6,435 6,435 0 0 260.000.439600 Other Gov Debt Pymt-USD465 6,377 6,377 6,377 6,377 260.000.439600 Other Gov Debt Pymt- USD465 (tennis courts) 0 10,000 10,000 10,000 260.000.439650 Other Gov Debt Pymt- SW Collg (tennis courts) 0 10,000 10,000 10,000 260.000.461100 Investment Interest 2,631 1,065 1,500 1,500 260.000.465100 Special Assessments 223,940 204,679 230,000 206,000 260.000.491110 Transfer from General (Tennis Courts) 0 0 10,000 10,000 260.000.491110 Transfer from General 0 0 0 100,000 260.000.491135 Transfer from Stormwater Drnge 113,638 20,000 20,000 20,000 260.000.491140 Trsf from Water Fund (2 KDHE loans rfd) 569,217 571,912 559,892 559,892 260.000.491170 Transfer from CIP-KLINK 2007 50,000 50,000 50,000 50,000 260.000.491170 Transfer from CIP-Other Support 400,000 400,000 400,000 400,000 260.000.491170 Transfer from CIP-Aquatic Facility 100,000 100,000 0 0 260.000.491170 Trsf from CIP-Klink 2009 Geom TR0113 86,563 83,013 86,563 83,013 260.000.491170 Transfer from CIP-KLINK 2011 38,238 38,238 38,238 38,238 260.000.491191 Transfer from Wastewater (Vactor) 0 0 50,000 50,000 260.000.491195 Trsf from Cap Projects (Tennis Courts) 0 175,290 0 0 260.000.491199 Transfer from Other Funds 0 322,475 0 0 260.000.495100 G.O. Bond Proceeds 0 11,500,000 0 0 260.000.495100 Temp Note Proceeds 8,083,542 0 935,000 0 260.000.495200 GO Bond Net Premiums 0 461,742 0 0 260.000.495300 GO Bond Refunding 0 (2,700,868) 0 0
Total Revenues 10,386,532 11,947,440 3,112,417 2,207,194
Prior Year Revenue 454,283 290,596 434,256 391,220
Total Revenues Available 10,840,815 12,238,036 3,546,673 2,598,414
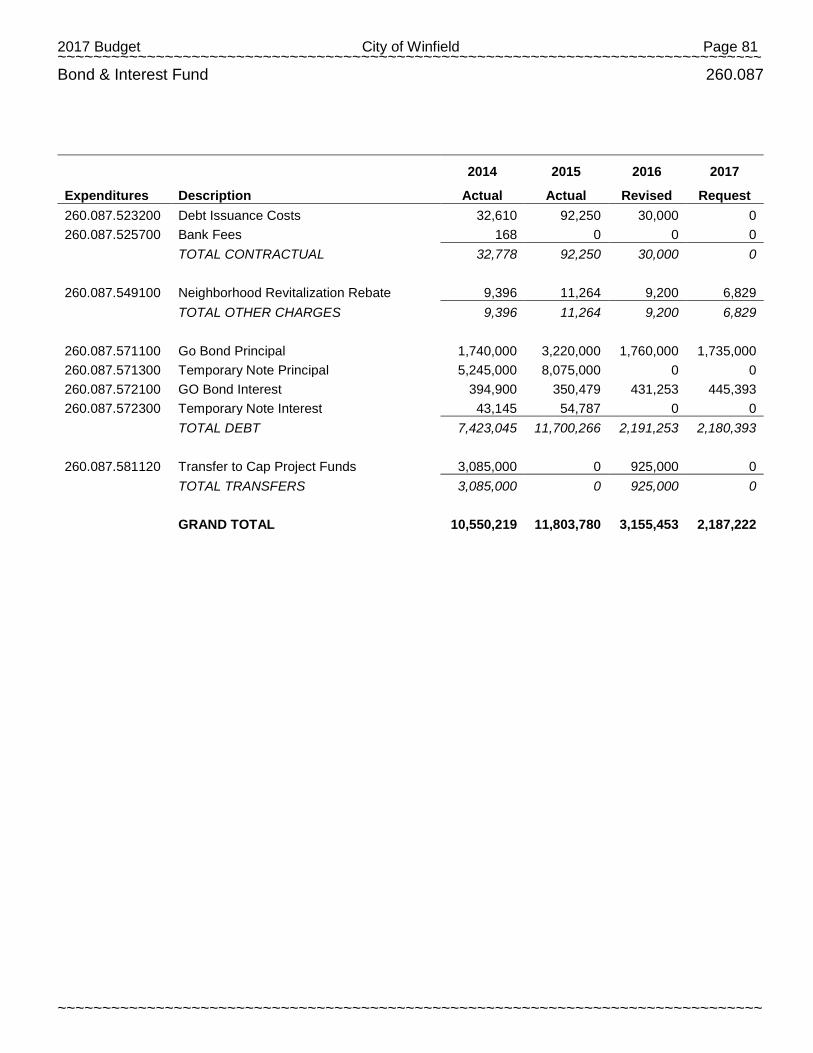
2017 Budget City of Winfield Page 81 ~~~~~~~~~~~~~~~~~~~~~~~~~~~~~~~~~~~~~~~~~~~~~~~~~~~~~~~~~~~~~~~~~~~~~~~~~~~~~~~
~~~~~~~~~~~~~~~~~~~~~~~~~~~~~~~~~~~~~~~~~~~~~~~~~~~~~~~~~~~~~~~~~~~~~~~~~~~~~~~
Bond & Interest Fund 260.087
2014 2015 2016 2017
Expenditures Description Actual Actual Revised Request 260.087.523200 Debt Issuance Costs 32,610 92,250 30,000 0 260.087.525700 Bank Fees 168 0 0 0
TOTAL CONTRACTUAL 32,778 92,250 30,000 0
260.087.549100 Neighborhood Revitalization Rebate 9,396 11,264 9,200 6,829
TOTAL OTHER CHARGES 9,396 11,264 9,200 6,829
260.087.571100 Go Bond Principal 1,740,000 3,220,000 1,760,000 1,735,000 260.087.571300 Temporary Note Principal 5,245,000 8,075,000 0 0 260.087.572100 GO Bond Interest 394,900 350,479 431,253 445,393 260.087.572300 Temporary Note Interest 43,145 54,787 0 0
TOTAL DEBT 7,423,045 11,700,266 2,191,253 2,180,393
260.087.581120 Transfer to Cap Project Funds 3,085,000 0 925,000 0
TOTAL TRANSFERS 3,085,000 0 925,000 0
GRAND TOTAL 10,550,219 11,803,780 3,155,453 2,187,222
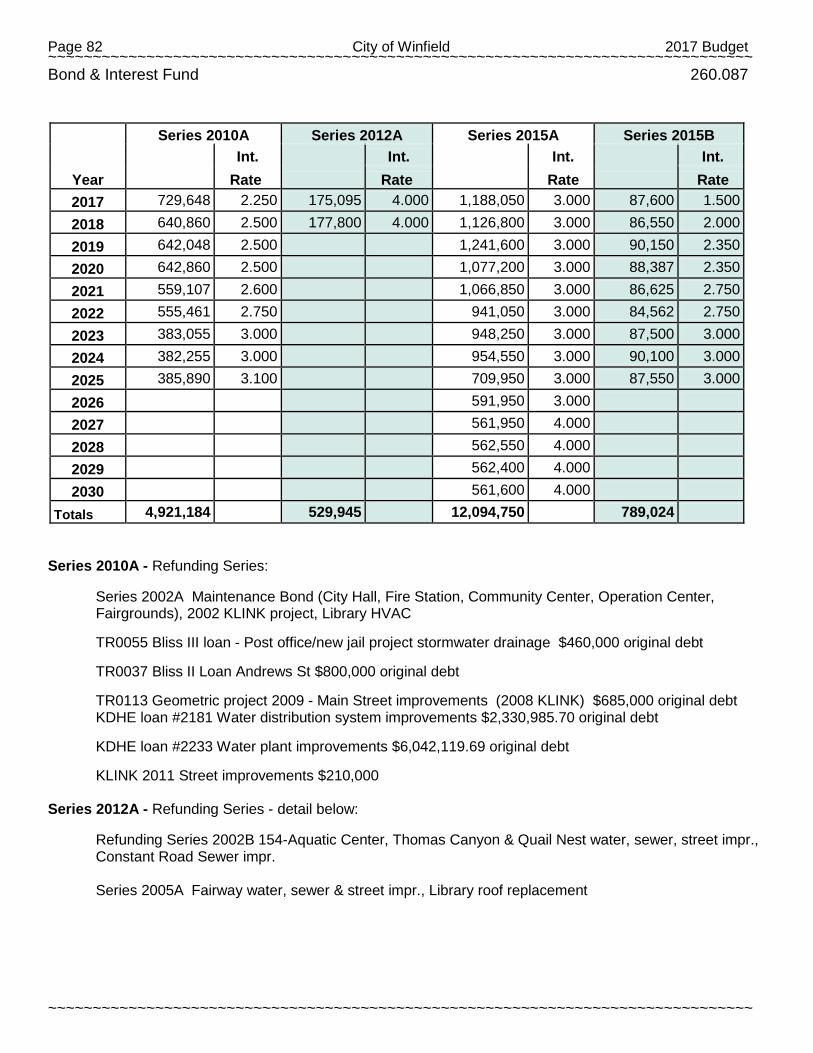
Page 82 City of Winfield 2017 Budget ~~~~~~~~~~~~~~~~~~~~~~~~~~~~~~~~~~~~~~~~~~~~~~~~~~~~~~~~~~~~~~~~~~~~~~~~~~~~~~~
~~~~~~~~~~~~~~~~~~~~~~~~~~~~~~~~~~~~~~~~~~~~~~~~~~~~~~~~~~~~~~~~~~~~~~~~~~~~~~~
Bond & Interest Fund 260.087
Year
Series 2010A Series 2012A Series 2015A Series 2015B
Int.
Int.
Int.
Int.
Rate Rate Rate Rate 2017 729,648 2.250 175,095 4.000 1,188,050 3.000 87,600 1.500 2018 640,860 2.500 177,800 4.000 1,126,800 3.000 86,550 2.000 2019 642,048 2.500 1,241,600 3.000 90,150 2.350 2020 642,860 2.500 1,077,200 3.000 88,387 2.350 2021 559,107 2.600 1,066,850 3.000 86,625 2.750 2022 555,461 2.750 941,050 3.000 84,562 2.750 2023 383,055 3.000 948,250 3.000 87,500 3.000 2024 382,255 3.000 954,550 3.000 90,100 3.000 2025 385,890 3.100 709,950 3.000 87,550 3.000 2026 591,950 3.000 2027 561,950 4.000 2028 562,550 4.000 2029 562,400 4.000 2030 561,600 4.000
Totals 4,921,184 529,945 12,094,750 789,024 Series 2010A - Refunding Series: Series 2002A Maintenance Bond (City Hall, Fire Station, Community Center, Operation Center,
Fairgrounds), 2002 KLINK project, Library HVAC TR0055 Bliss III loan - Post office/new jail project stormwater drainage $460,000 original debt
TR0037 Bliss II Loan Andrews St $800,000 original debt TR0113 Geometric project 2009 - Main Street improvements (2008 KLINK) $685,000 original debt
KDHE loan #2181 Water distribution system improvements $2,330,985.70 original debt
KDHE loan #2233 Water plant improvements $6,042,119.69 original debt KLINK 2011 Street improvements $210,000 Series 2012A - Refunding Series - detail below: Refunding Series 2002B 154-Aquatic Center, Thomas Canyon & Quail Nest water, sewer, street impr.,
Constant Road Sewer impr. Series 2005A Fairway water, sewer & street impr., Library roof replacement
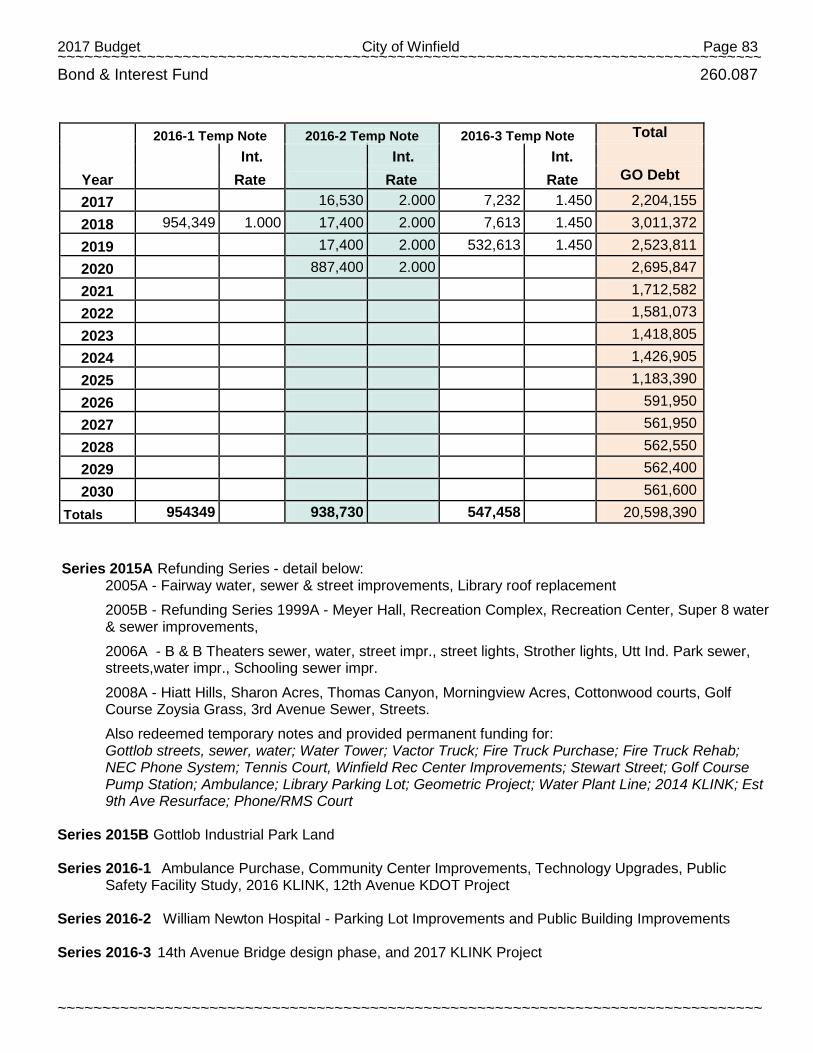
2017 Budget City of Winfield Page 83 ~~~~~~~~~~~~~~~~~~~~~~~~~~~~~~~~~~~~~~~~~~~~~~~~~~~~~~~~~~~~~~~~~~~~~~~~~~~~~~~
~~~~~~~~~~~~~~~~~~~~~~~~~~~~~~~~~~~~~~~~~~~~~~~~~~~~~~~~~~~~~~~~~~~~~~~~~~~~~~~
Bond & Interest Fund 260.087
Year
2016-1 Temp Note 2016-2 Temp Note 2016-3 Temp Note Total
Int.
Int.
Int.
Rate Rate Rate GO Debt
2017 16,530 2.000 7,232 1.450 2,204,155 2018 954,349 1.000 17,400 2.000 7,613 1.450 3,011,372 2019 17,400 2.000 532,613 1.450 2,523,811 2020 887,400 2.000 2,695,847 2021 1,712,582 2022 1,581,073 2023 1,418,805 2024 1,426,905 2025 1,183,390 2026 591,950 2027 561,950 2028 562,550 2029 562,400 2030 561,600
Totals 954349 938,730 547,458 20,598,390 Series 2015A Refunding Series - detail below: 2005A - Fairway water, sewer & street improvements, Library roof replacement
2005B - Refunding Series 1999A - Meyer Hall, Recreation Complex, Recreation Center, Super 8 water & sewer improvements,
2006A - B & B Theaters sewer, water, street impr., street lights, Strother lights, Utt Ind. Park sewer, streets,water impr., Schooling sewer impr.
2008A - Hiatt Hills, Sharon Acres, Thomas Canyon, Morningview Acres, Cottonwood courts, Golf Course Zoysia Grass, 3rd Avenue Sewer, Streets.
Also redeemed temporary notes and provided permanent funding for: Gottlob streets, sewer, water; Water Tower; Vactor Truck; Fire Truck Purchase; Fire Truck Rehab;
NEC Phone System; Tennis Court, Winfield Rec Center Improvements; Stewart Street; Golf Course Pump Station; Ambulance; Library Parking Lot; Geometric Project; Water Plant Line; 2014 KLINK; Est 9th Ave Resurface; Phone/RMS Court
Series 2015B Gottlob Industrial Park Land Series 2016-1 Ambulance Purchase, Community Center Improvements, Technology Upgrades, Public
Safety Facility Study, 2016 KLINK, 12th Avenue KDOT Project Series 2016-2 William Newton Hospital - Parking Lot Improvements and Public Building Improvements Series 2016-3 14th Avenue Bridge design phase, and 2017 KLINK Project
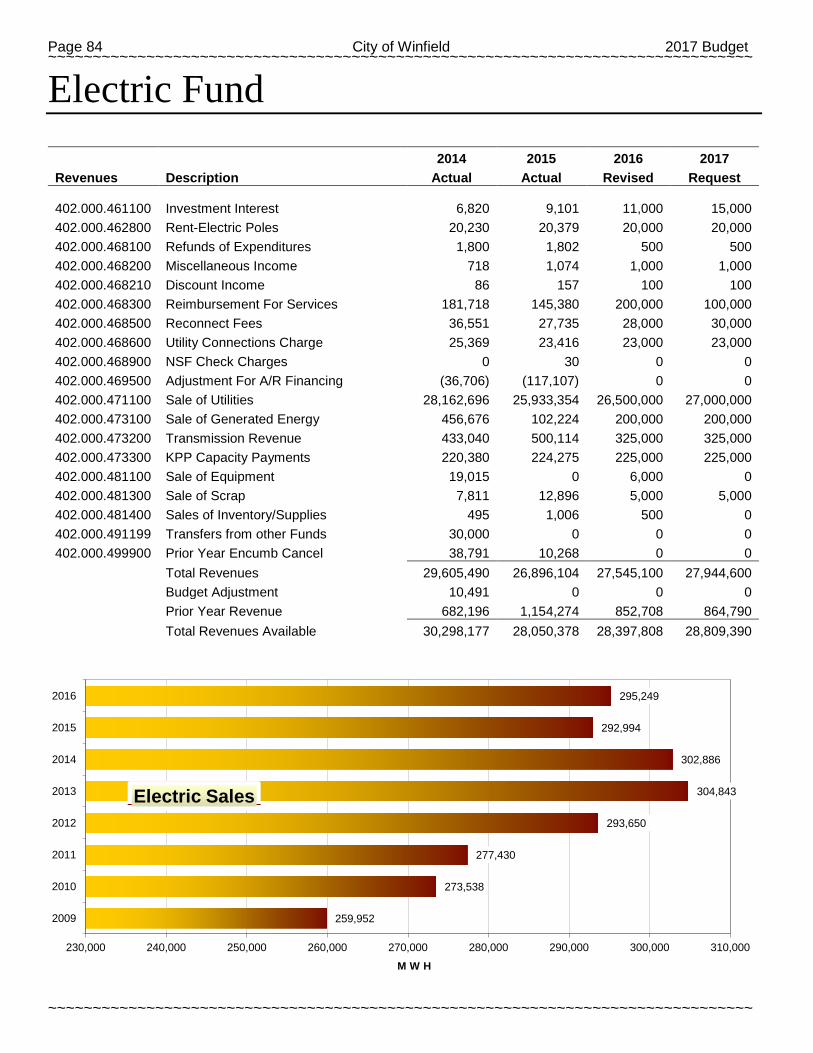
Page 84 City of Winfield 2017 Budget ~~~~~~~~~~~~~~~~~~~~~~~~~~~~~~~~~~~~~~~~~~~~~~~~~~~~~~~~~~~~~~~~~~~~~~~~~~~~~~~
~~~~~~~~~~~~~~~~~~~~~~~~~~~~~~~~~~~~~~~~~~~~~~~~~~~~~~~~~~~~~~~~~~~~~~~~~~~~~~~
Electric Fund
2014 2015 2016 2017
Revenues Description Actual Actual Revised Request
402.000.461100 Investment Interest 6,820 9,101 11,000 15,000 402.000.462800 Rent-Electric Poles 20,230 20,379 20,000 20,000 402.000.468100 Refunds of Expenditures 1,800 1,802 500 500 402.000.468200 Miscellaneous Income 718 1,074 1,000 1,000 402.000.468210 Discount Income 86 157 100 100 402.000.468300 Reimbursement For Services 181,718 145,380 200,000 100,000 402.000.468500 Reconnect Fees 36,551 27,735 28,000 30,000 402.000.468600 Utility Connections Charge 25,369 23,416 23,000 23,000 402.000.468900 NSF Check Charges 0 30 0 0 402.000.469500 Adjustment For A/R Financing (36,706) (117,107) 0 0 402.000.471100 Sale of Utilities 28,162,696 25,933,354 26,500,000 27,000,000 402.000.473100 Sale of Generated Energy 456,676 102,224 200,000 200,000 402.000.473200 Transmission Revenue 433,040 500,114 325,000 325,000 402.000.473300 KPP Capacity Payments 220,380 224,275 225,000 225,000 402.000.481100 Sale of Equipment 19,015 0 6,000 0 402.000.481300 Sale of Scrap 7,811 12,896 5,000 5,000 402.000.481400 Sales of Inventory/Supplies 495 1,006 500 0 402.000.491199 Transfers from other Funds 30,000 0 0 0 402.000.499900 Prior Year Encumb Cancel 38,791 10,268 0 0
Total Revenues 29,605,490 26,896,104 27,545,100 27,944,600
Budget Adjustment 10,491 0 0 0
Prior Year Revenue 682,196 1,154,274 852,708 864,790
Total Revenues Available 30,298,177 28,050,378 28,397,808 28,809,390
259,952
273,538
277,430
293,650
304,843
302,886
292,994
295,249
230,000 240,000 250,000 260,000 270,000 280,000 290,000 300,000 310,000
2009
2010
2011
2012
2013
2014
2015
2016
M W H
Electric Sales
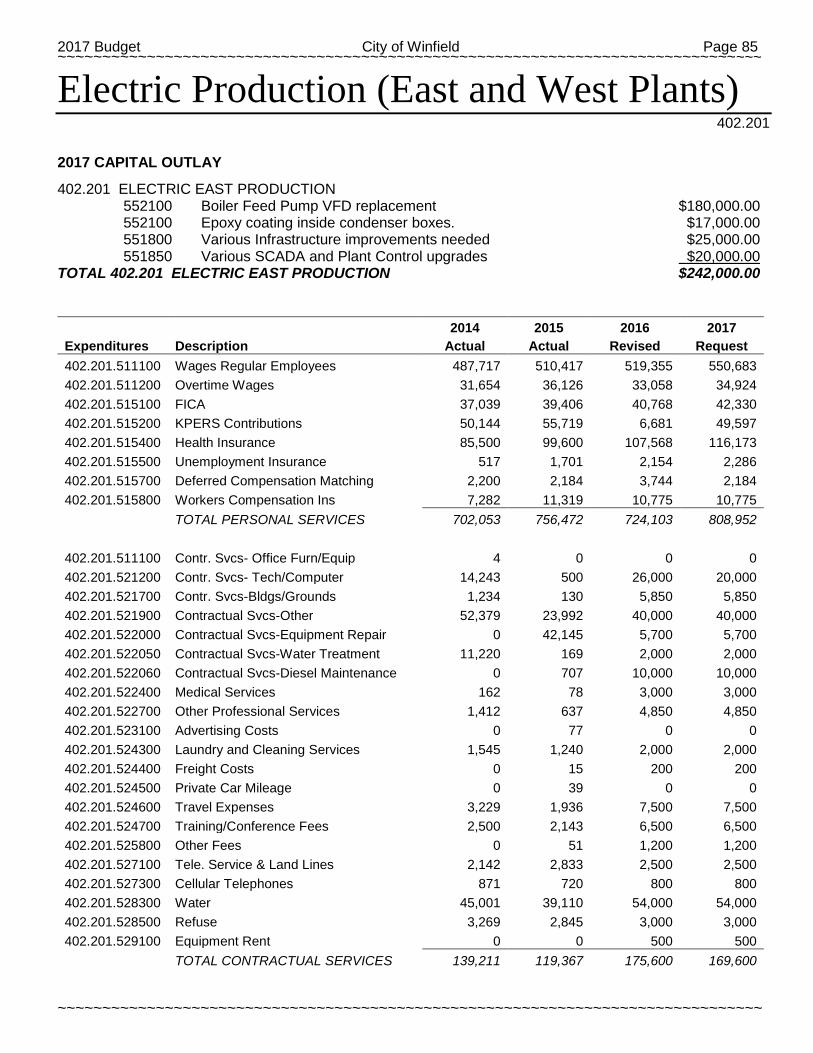
2017 Budget City of Winfield Page 85 ~~~~~~~~~~~~~~~~~~~~~~~~~~~~~~~~~~~~~~~~~~~~~~~~~~~~~~~~~~~~~~~~~~~~~~~~~~~~~~~
~~~~~~~~~~~~~~~~~~~~~~~~~~~~~~~~~~~~~~~~~~~~~~~~~~~~~~~~~~~~~~~~~~~~~~~~~~~~~~~
Electric Production (East and West Plants) 402.201
2017 CAPITAL OUTLAY
402.201 ELECTRIC EAST PRODUCTION 552100 Boiler Feed Pump VFD replacement $180,000.00 552100 Epoxy coating inside condenser boxes. $17,000.00 551800 Various Infrastructure improvements needed $25,000.00 551850 Various SCADA and Plant Control upgrades $20,000.00
TOTAL 402.201 ELECTRIC EAST PRODUCTION $242,000.00
2014 2015 2016 2017
Expenditures Description Actual Actual Revised Request 402.201.511100 Wages Regular Employees 487,717 510,417 519,355 550,683 402.201.511200 Overtime Wages 31,654 36,126 33,058 34,924 402.201.515100 FICA 37,039 39,406 40,768 42,330 402.201.515200 KPERS Contributions 50,144 55,719 6,681 49,597 402.201.515400 Health Insurance 85,500 99,600 107,568 116,173 402.201.515500 Unemployment Insurance 517 1,701 2,154 2,286 402.201.515700 Deferred Compensation Matching 2,200 2,184 3,744 2,184 402.201.515800 Workers Compensation Ins 7,282 11,319 10,775 10,775
TOTAL PERSONAL SERVICES 702,053 756,472 724,103 808,952
402.201.511100 Contr. Svcs- Office Furn/Equip 4 0 0 0 402.201.521200 Contr. Svcs- Tech/Computer 14,243 500 26,000 20,000 402.201.521700 Contr. Svcs-Bldgs/Grounds 1,234 130 5,850 5,850 402.201.521900 Contractual Svcs-Other 52,379 23,992 40,000 40,000 402.201.522000 Contractual Svcs-Equipment Repair 0 42,145 5,700 5,700 402.201.522050 Contractual Svcs-Water Treatment 11,220 169 2,000 2,000 402.201.522060 Contractual Svcs-Diesel Maintenance 0 707 10,000 10,000 402.201.522400 Medical Services 162 78 3,000 3,000 402.201.522700 Other Professional Services 1,412 637 4,850 4,850 402.201.523100 Advertising Costs 0 77 0 0 402.201.524300 Laundry and Cleaning Services 1,545 1,240 2,000 2,000 402.201.524400 Freight Costs 0 15 200 200 402.201.524500 Private Car Mileage 0 39 0 0 402.201.524600 Travel Expenses 3,229 1,936 7,500 7,500 402.201.524700 Training/Conference Fees 2,500 2,143 6,500 6,500 402.201.525800 Other Fees 0 51 1,200 1,200 402.201.527100 Tele. Service & Land Lines 2,142 2,833 2,500 2,500 402.201.527300 Cellular Telephones 871 720 800 800 402.201.528300 Water 45,001 39,110 54,000 54,000 402.201.528500 Refuse 3,269 2,845 3,000 3,000 402.201.529100 Equipment Rent 0 0 500 500
TOTAL CONTRACTUAL SERVICES 139,211 119,367 175,600 169,600

Page 86 City of Winfield 2017 Budget ~~~~~~~~~~~~~~~~~~~~~~~~~~~~~~~~~~~~~~~~~~~~~~~~~~~~~~~~~~~~~~~~~~~~~~~~~~~~~~~
~~~~~~~~~~~~~~~~~~~~~~~~~~~~~~~~~~~~~~~~~~~~~~~~~~~~~~~~~~~~~~~~~~~~~~~~~~~~~~~
Electric Production (East and West Plants) 402.201
2014 2015 2016 2017
Expenditures Description Actual Actual Revised Request
402.201.530100 Insurance 221,870 298,348 305,127 320,383 402.201.531700 Internal Support - Svce Ctr Bldg 3,821 3,584 7,107 4,000 402.201.533100 Ref. Material/Books/Magazines 0 106 300 300 402.201.533200 Office Supplies 208 236 200 200 402.021.533550 SCADA/Plant Controls Mtnce 691 0 5,000 5,000 402.201.533700 Lab/Photo Supplies 0 0 300 300 402.201.534100 Building & Grounds Supplies 5,616 9,543 11,500 11,500 402.201.534200 Equipment Maintenance Supplies 20,828 23,257 48,000 48,000 402.201.534300 Vehicle Maintenance Supplies 9,911 10,683 9,000 9,000 402.201.534400 Protection and Safety Equipment 3,404 5,863 6,000 6,000 402.201.534500 Hand Tools 576 484 7,000 7,000 402.201.534600 Uniforms and Accessories 3,868 3,125 4,800 4,800 402.201.535100 Electrical Supplies 1,528 1,905 4,000 4,000 402.201.535900 Other Operating Supplies 116 93 600 600 402.201.536200 Chemicals 89,867 40,126 76,000 65,000 402.201.537300 Lubricants & Motor Oils 2,970 235 6,000 6,000 402.201.537400 Fuel - Power Plant 413,635 231,717 600,000 600,000 402.201.537500 Purchased Energy 21,426,666 18,362,969 18,500,000 19,000,000 402.201.537900 Fuel 5,549 4,933 5,100 5,100
TOTAL COMMODITIES 22,211,124 18,997,207 19,596,034 20,097,183
402.201.541100 Tags and Taxes 0 262 50 50 402.201.541200 Meal on Duty 788 792 500 500 402.201.541300 Sundry Charges 106 124 4,500 4,500 402.201.541900 Power Plant Emission Fees 1,447 950 1,500 1,500
TOTAL OTHER CHARGES 2,341 2,128 6,550 6,550
402.201.551300 Vehicles/Towed/Mounted Equip 0 27,200 0 0 402.201.551400 Machinery and Equipment 6,550 2,553 59,807 0 402.201.551600 Building and Structural Impr. 0 0 45,000 0 402.201.551700 Grounds Improvements 870 560 0 0 402.201.551800 Infrastructure Improvements 18,594 75,436 25,000 25,000 402.201.551850 SCADA/Plant Controls 472 14,835 20,000 20,000 402.201.552100 Plant Equipment 0 0 60,000 197,000
TOTAL CAPITAL OUTLAY 26,486 120,584 209,807 242,000
GRAND TOTAL 23,081,215 19,995,758 20,712,094 21,324,285

2017 Budget City of Winfield Page 87 ~~~~~~~~~~~~~~~~~~~~~~~~~~~~~~~~~~~~~~~~~~~~~~~~~~~~~~~~~~~~~~~~~~~~~~~~~~~~~~~
~~~~~~~~~~~~~~~~~~~~~~~~~~~~~~~~~~~~~~~~~~~~~~~~~~~~~~~~~~~~~~~~~~~~~~~~~~~~~~~
Electric Distribution 402.206
2017 CAPITAL OUTLAY 402.206 ELECTRIC DISTRIBUTION 552400 Various Meter settings $15,000.00 553500 Various Substation improvements $75,000.00 551300 Substation Truck 1 ton w/ utility bed & crane $70,000.00 522425 2017 Line Clearance projects and Hourly crew $265,000.00 522450 2017 Substation Testing Program $75,000.00 551800 Infrastructure improvements $400,000.00
TOTAL 402.206 ELECTRIC DISTRIBUTION $900,000.00
2014 2015 2016 2017
Expenditures Description Actual Actual Revised Request 402.206.511100 Wages Regular Employees 799,483 803,182 792,472 852,913 402.206.511200 Overtime Wages 28,869 36,673 29,248 30,336 402.206.511300 Wages-Other Employees 7,740 0 10,000 0 402.206.515100 FICA 59,832 61,190 59,895 65,051 402.206.515200 KPERS Contributions 80,083 85,423 86,100 74,851 402.206.515400 Health Insurance 117,000 129,480 139,838 151,025 402.206.515500 Unemployment Insurance 834 2,630 3,244 3,451 402.206.515700 Deferred Compensation Matching 6,166 5,537 6,136 5,096 402.206.515800 Workers Compensation Ins 17,185 14,292 13,605 13,605
TOTAL PERSONAL SERVICES 1,117,192 1,138,407 1,140,538 1,196,328
402.206.521200 Contractual Svcs- Tech/Computer 7,974 7,988 8,000 8,000 402.206.521700 Contractual Svcs-Bldgs/Grounds 926 211 1,000 1,000 402.206.521900 Contractual Svcs-Other 24,561 17,707 19,000 19,000 402.206.522100 Arch/Eng/Planning/Abstract/Appraisal 26,226 0 0 0 402.206.522400 Medical Services 2,081 1,791 2,000 2,000 402.206.522425 Line Clearance 222,882 250,169 295,000 265,000 402.206.522450 Substation Contractual Svcs 101,077 93,648 75,000 75,000 402.206.522475 Distribution Line Inspection 2,924 0 0 0 402.206.522700 Other Professional Services 1,133 914 1,500 2,000 402.206.523100 Advertising Costs 558 102 300 300 402.206.524400 Freight Costs 333 652 600 600 402.206.524600 Travel Expenses 4,459 6,659 4,000 4,000 402.206.524700 Training/Conference Fees 3,598 6,048 9,000 9,000 402.206.525800 Other Fees 600 0 600 600 402.206.527100 Tele. Service & Land Lines 1,872 677 1,500 1,500 402.206.527300 Cellular Telephones 1,827 2,114 1,995 1,995 402.206.528100 Electricity 306 95 200 200 402.206.529100 Equipment Rent 0 0 10,000 10,000
TOTAL CONTRACTUAL SERVICES 403,336 388,775 429,695 400,195
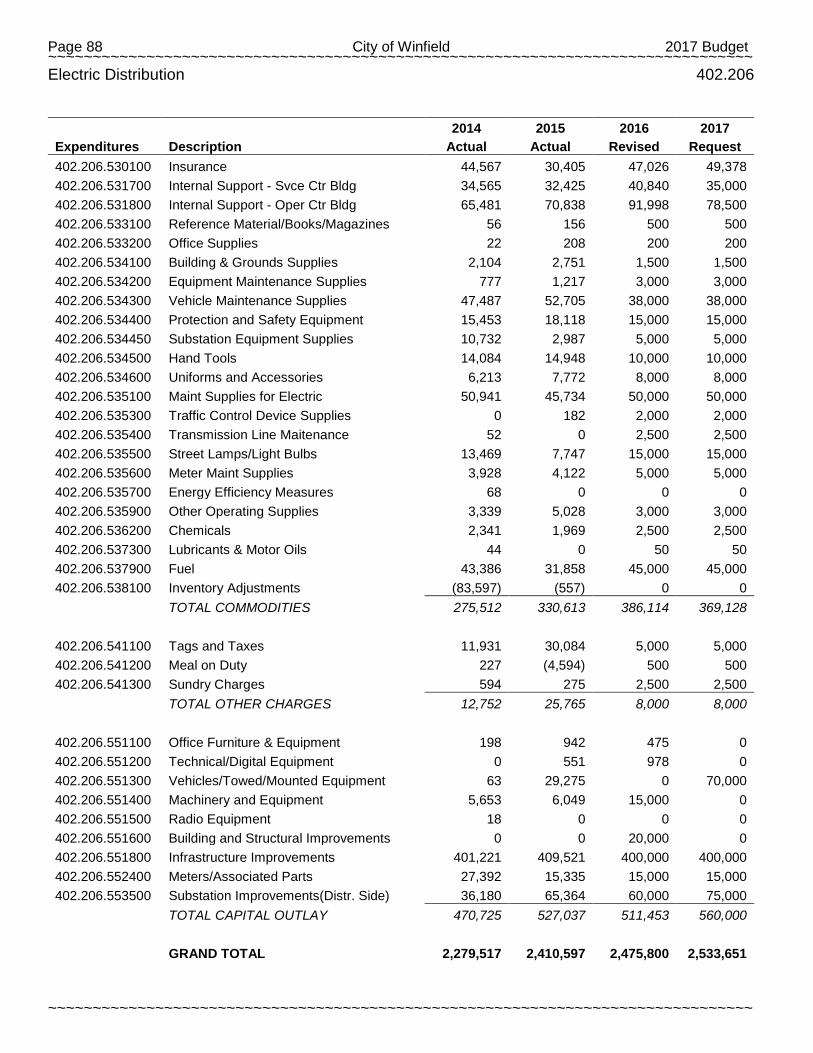
Page 88 City of Winfield 2017 Budget ~~~~~~~~~~~~~~~~~~~~~~~~~~~~~~~~~~~~~~~~~~~~~~~~~~~~~~~~~~~~~~~~~~~~~~~~~~~~~~~
~~~~~~~~~~~~~~~~~~~~~~~~~~~~~~~~~~~~~~~~~~~~~~~~~~~~~~~~~~~~~~~~~~~~~~~~~~~~~~~
Electric Distribution 402.206
2014 2015 2016 2017
Expenditures Description Actual Actual Revised Request 402.206.530100 Insurance 44,567 30,405 47,026 49,378 402.206.531700 Internal Support - Svce Ctr Bldg 34,565 32,425 40,840 35,000 402.206.531800 Internal Support - Oper Ctr Bldg 65,481 70,838 91,998 78,500 402.206.533100 Reference Material/Books/Magazines 56 156 500 500 402.206.533200 Office Supplies 22 208 200 200 402.206.534100 Building & Grounds Supplies 2,104 2,751 1,500 1,500 402.206.534200 Equipment Maintenance Supplies 777 1,217 3,000 3,000 402.206.534300 Vehicle Maintenance Supplies 47,487 52,705 38,000 38,000 402.206.534400 Protection and Safety Equipment 15,453 18,118 15,000 15,000 402.206.534450 Substation Equipment Supplies 10,732 2,987 5,000 5,000 402.206.534500 Hand Tools 14,084 14,948 10,000 10,000 402.206.534600 Uniforms and Accessories 6,213 7,772 8,000 8,000 402.206.535100 Maint Supplies for Electric 50,941 45,734 50,000 50,000 402.206.535300 Traffic Control Device Supplies 0 182 2,000 2,000 402.206.535400 Transmission Line Maitenance 52 0 2,500 2,500 402.206.535500 Street Lamps/Light Bulbs 13,469 7,747 15,000 15,000 402.206.535600 Meter Maint Supplies 3,928 4,122 5,000 5,000 402.206.535700 Energy Efficiency Measures 68 0 0 0 402.206.535900 Other Operating Supplies 3,339 5,028 3,000 3,000 402.206.536200 Chemicals 2,341 1,969 2,500 2,500 402.206.537300 Lubricants & Motor Oils 44 0 50 50 402.206.537900 Fuel 43,386 31,858 45,000 45,000 402.206.538100 Inventory Adjustments (83,597) (557) 0 0
TOTAL COMMODITIES 275,512 330,613 386,114 369,128
402.206.541100 Tags and Taxes 11,931 30,084 5,000 5,000 402.206.541200 Meal on Duty 227 (4,594) 500 500 402.206.541300 Sundry Charges 594 275 2,500 2,500
TOTAL OTHER CHARGES 12,752 25,765 8,000 8,000
402.206.551100 Office Furniture & Equipment 198 942 475 0 402.206.551200 Technical/Digital Equipment 0 551 978 0 402.206.551300 Vehicles/Towed/Mounted Equipment 63 29,275 0 70,000 402.206.551400 Machinery and Equipment 5,653 6,049 15,000 0 402.206.551500 Radio Equipment 18 0 0 0 402.206.551600 Building and Structural Improvements 0 0 20,000 0 402.206.551800 Infrastructure Improvements 401,221 409,521 400,000 400,000 402.206.552400 Meters/Associated Parts 27,392 15,335 15,000 15,000 402.206.553500 Substation Improvements(Distr. Side) 36,180 65,364 60,000 75,000
TOTAL CAPITAL OUTLAY 470,725 527,037 511,453 560,000
GRAND TOTAL 2,279,517 2,410,597 2,475,800 2,533,651
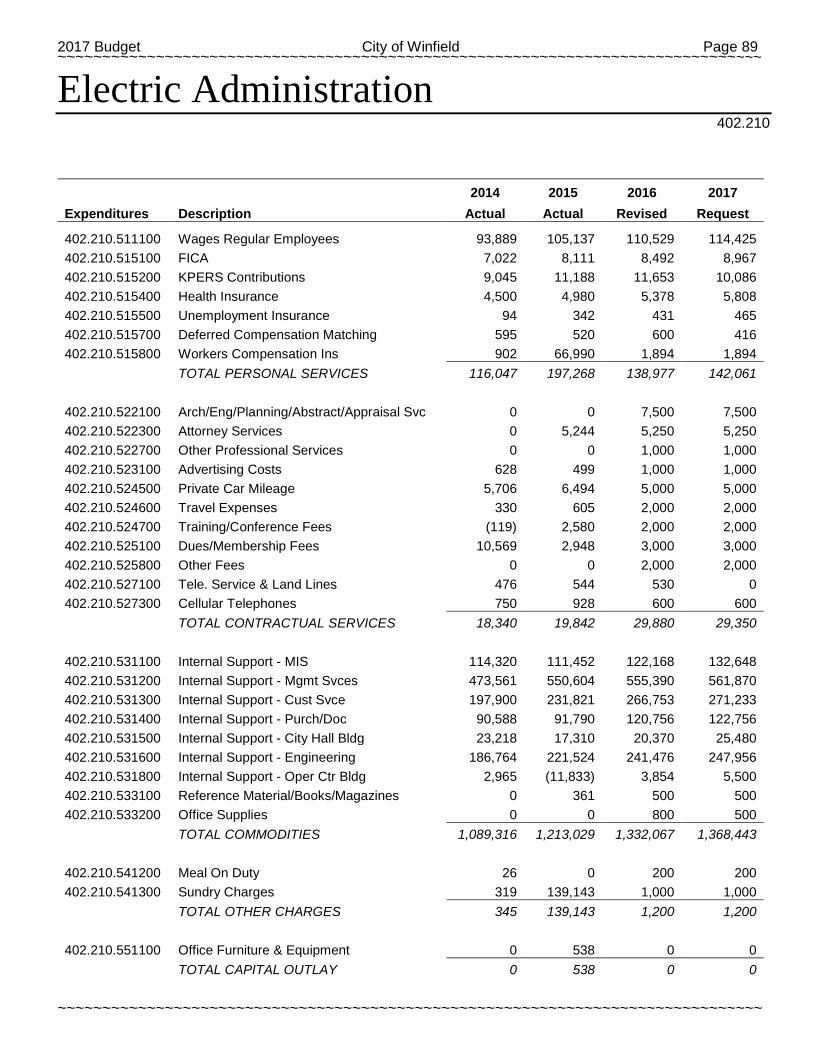
2017 Budget City of Winfield Page 89 ~~~~~~~~~~~~~~~~~~~~~~~~~~~~~~~~~~~~~~~~~~~~~~~~~~~~~~~~~~~~~~~~~~~~~~~~~~~~~~~
~~~~~~~~~~~~~~~~~~~~~~~~~~~~~~~~~~~~~~~~~~~~~~~~~~~~~~~~~~~~~~~~~~~~~~~~~~~~~~~
Electric Administration 402.210
2014 2015 2016 2017
Expenditures Description Actual Actual Revised Request 402.210.511100 Wages Regular Employees 93,889 105,137 110,529 114,425 402.210.515100 FICA 7,022 8,111 8,492 8,967 402.210.515200 KPERS Contributions 9,045 11,188 11,653 10,086 402.210.515400 Health Insurance 4,500 4,980 5,378 5,808 402.210.515500 Unemployment Insurance 94 342 431 465 402.210.515700 Deferred Compensation Matching 595 520 600 416 402.210.515800 Workers Compensation Ins 902 66,990 1,894 1,894
TOTAL PERSONAL SERVICES 116,047 197,268 138,977 142,061
402.210.522100 Arch/Eng/Planning/Abstract/Appraisal Svc 0 0 7,500 7,500 402.210.522300 Attorney Services 0 5,244 5,250 5,250 402.210.522700 Other Professional Services 0 0 1,000 1,000 402.210.523100 Advertising Costs 628 499 1,000 1,000 402.210.524500 Private Car Mileage 5,706 6,494 5,000 5,000 402.210.524600 Travel Expenses 330 605 2,000 2,000 402.210.524700 Training/Conference Fees (119) 2,580 2,000 2,000 402.210.525100 Dues/Membership Fees 10,569 2,948 3,000 3,000 402.210.525800 Other Fees 0 0 2,000 2,000 402.210.527100 Tele. Service & Land Lines 476 544 530 0 402.210.527300 Cellular Telephones 750 928 600 600
TOTAL CONTRACTUAL SERVICES 18,340 19,842 29,880 29,350
402.210.531100 Internal Support - MIS 114,320 111,452 122,168 132,648 402.210.531200 Internal Support - Mgmt Svces 473,561 550,604 555,390 561,870 402.210.531300 Internal Support - Cust Svce 197,900 231,821 266,753 271,233 402.210.531400 Internal Support - Purch/Doc 90,588 91,790 120,756 122,756 402.210.531500 Internal Support - City Hall Bldg 23,218 17,310 20,370 25,480 402.210.531600 Internal Support - Engineering 186,764 221,524 241,476 247,956 402.210.531800 Internal Support - Oper Ctr Bldg 2,965 (11,833) 3,854 5,500 402.210.533100 Reference Material/Books/Magazines 0 361 500 500 402.210.533200 Office Supplies 0 0 800 500
TOTAL COMMODITIES 1,089,316 1,213,029 1,332,067 1,368,443
402.210.541200 Meal On Duty 26 0 200 200 402.210.541300 Sundry Charges 319 139,143 1,000 1,000
TOTAL OTHER CHARGES 345 139,143 1,200 1,200
402.210.551100 Office Furniture & Equipment 0 538 0 0
TOTAL CAPITAL OUTLAY 0 538 0 0
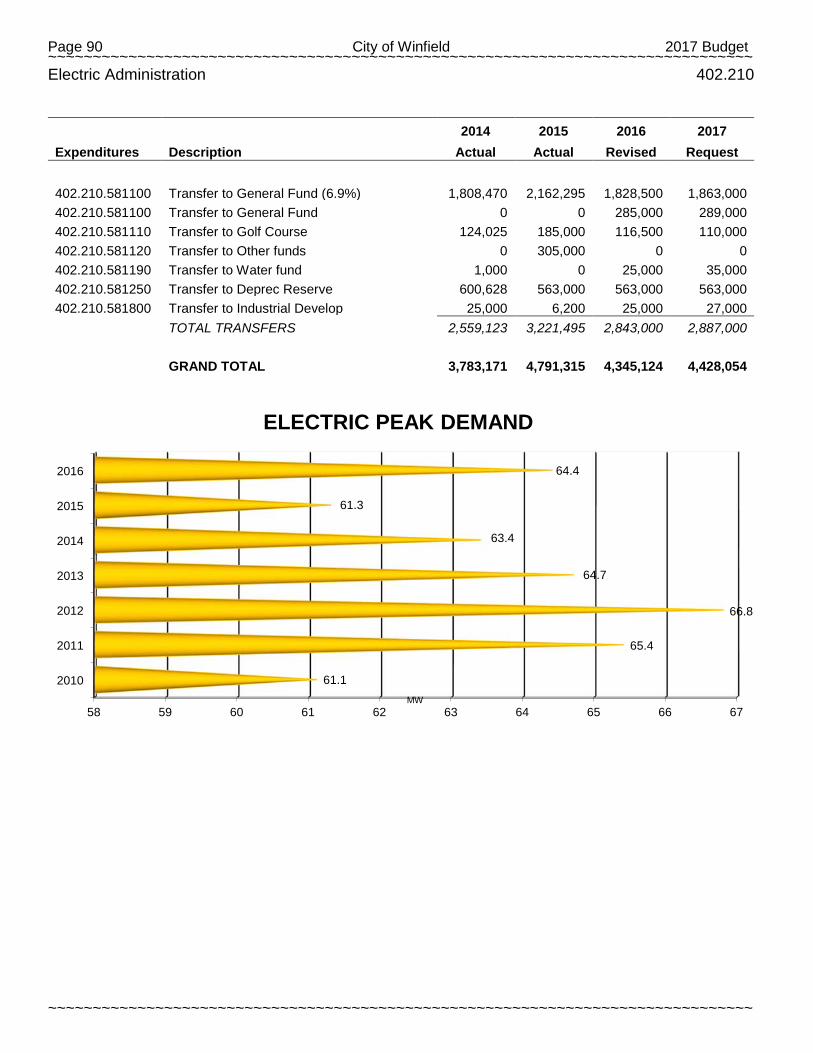
Page 90 City of Winfield 2017 Budget ~~~~~~~~~~~~~~~~~~~~~~~~~~~~~~~~~~~~~~~~~~~~~~~~~~~~~~~~~~~~~~~~~~~~~~~~~~~~~~~
~~~~~~~~~~~~~~~~~~~~~~~~~~~~~~~~~~~~~~~~~~~~~~~~~~~~~~~~~~~~~~~~~~~~~~~~~~~~~~~
Electric Administration 402.210
2014 2015 2016 2017
Expenditures Description Actual Actual Revised Request
402.210.581100 Transfer to General Fund (6.9%) 1,808,470 2,162,295 1,828,500 1,863,000 402.210.581100 Transfer to General Fund 0 0 285,000 289,000 402.210.581110 Transfer to Golf Course 124,025 185,000 116,500 110,000 402.210.581120 Transfer to Other funds 0 305,000 0 0 402.210.581190 Transfer to Water fund 1,000 0 25,000 35,000 402.210.581250 Transfer to Deprec Reserve 600,628 563,000 563,000 563,000 402.210.581800 Transfer to Industrial Develop 25,000 6,200 25,000 27,000
TOTAL TRANSFERS 2,559,123 3,221,495 2,843,000 2,887,000
GRAND TOTAL 3,783,171 4,791,315 4,345,124 4,428,054
58 59 60 61 62 63 64 65 66 67
2010
2011
2012
2013
2014
2015
2016
61.1
65.4
66.8
64.7
63.4
61.3
64.4
MW
ELECTRIC PEAK DEMAND
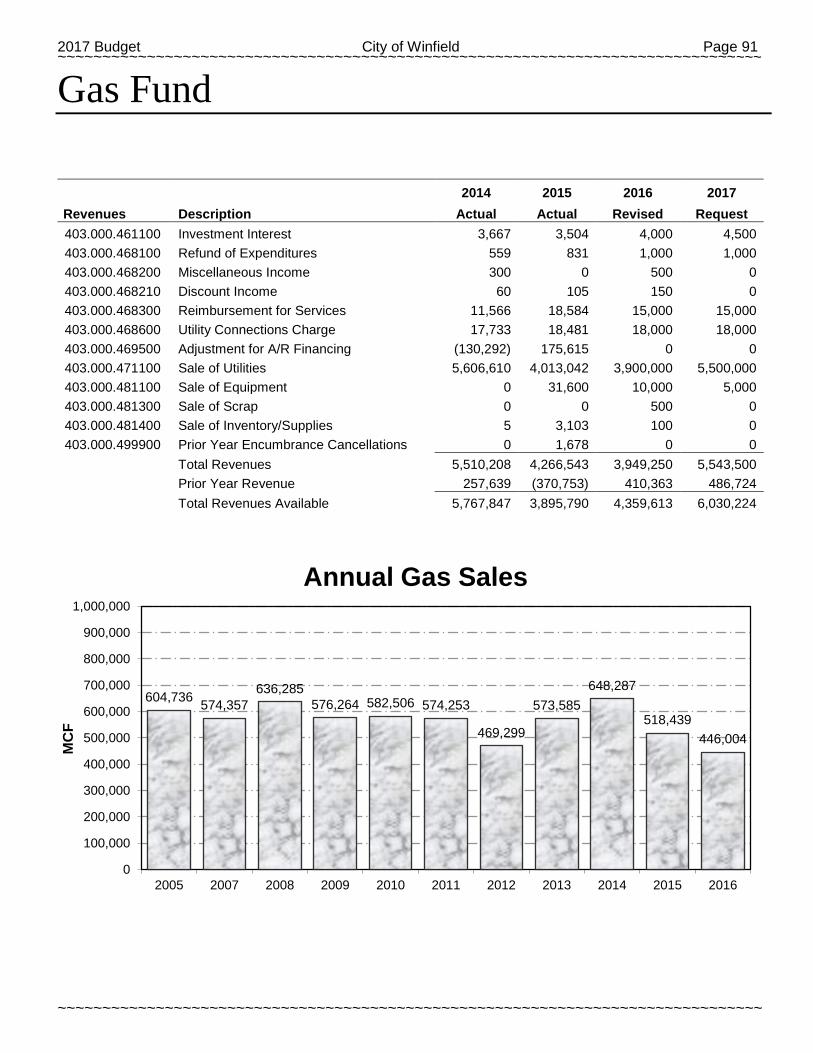
2017 Budget City of Winfield Page 91 ~~~~~~~~~~~~~~~~~~~~~~~~~~~~~~~~~~~~~~~~~~~~~~~~~~~~~~~~~~~~~~~~~~~~~~~~~~~~~~~
~~~~~~~~~~~~~~~~~~~~~~~~~~~~~~~~~~~~~~~~~~~~~~~~~~~~~~~~~~~~~~~~~~~~~~~~~~~~~~~
Gas Fund
2014 2015 2016 2017
Revenues Description Actual Actual Revised Request 403.000.461100 Investment Interest 3,667 3,504 4,000 4,500 403.000.468100 Refund of Expenditures 559 831 1,000 1,000 403.000.468200 Miscellaneous Income 300 0 500 0 403.000.468210 Discount Income 60 105 150 0 403.000.468300 Reimbursement for Services 11,566 18,584 15,000 15,000 403.000.468600 Utility Connections Charge 17,733 18,481 18,000 18,000 403.000.469500 Adjustment for A/R Financing (130,292) 175,615 0 0 403.000.471100 Sale of Utilities 5,606,610 4,013,042 3,900,000 5,500,000 403.000.481100 Sale of Equipment 0 31,600 10,000 5,000 403.000.481300 Sale of Scrap 0 0 500 0 403.000.481400 Sale of Inventory/Supplies 5 3,103 100 0 403.000.499900 Prior Year Encumbrance Cancellations 0 1,678 0 0
Total Revenues 5,510,208 4,266,543 3,949,250 5,543,500
Prior Year Revenue 257,639 (370,753) 410,363 486,724
Total Revenues Available 5,767,847 3,895,790 4,359,613 6,030,224
604,736 574,357 636,285
576,264 582,506 574,253
469,299
573,585 648,287
518,439 446,004
0
100,000
200,000
300,000
400,000
500,000
600,000
700,000
800,000
900,000
1,000,000
2005 2007 2008 2009 2010 2011 2012 2013 2014 2015 2016
MC
F
Annual Gas Sales
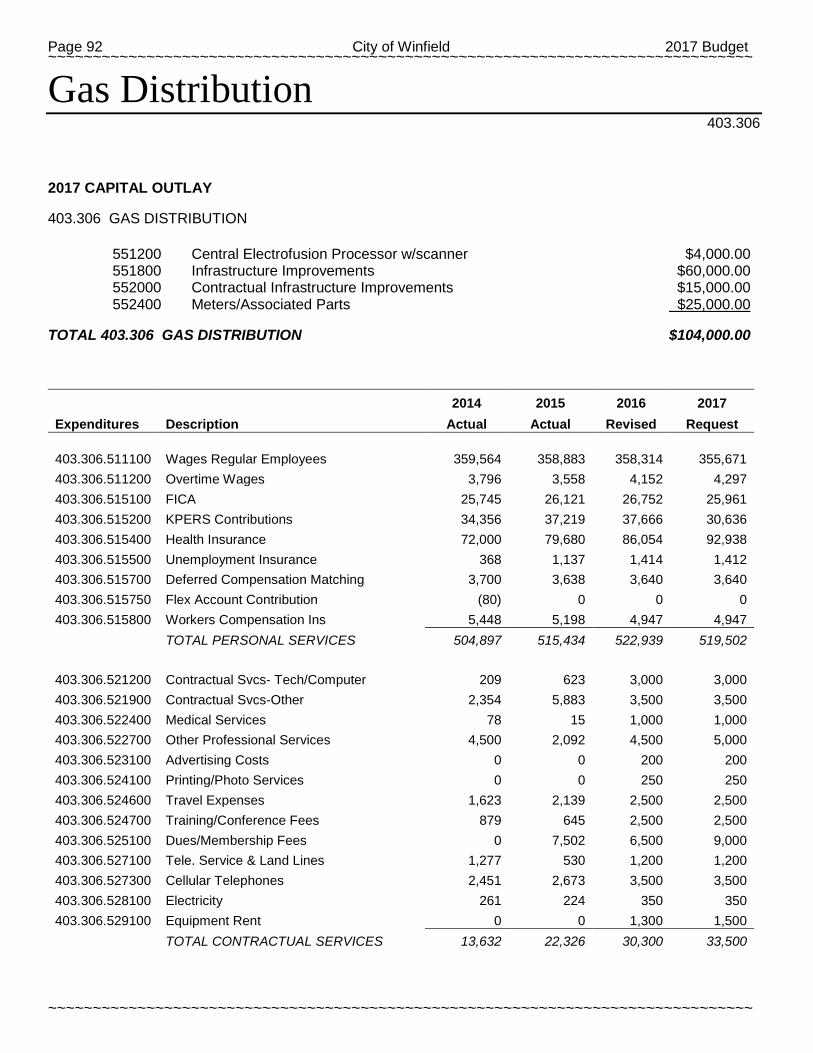
Page 92 City of Winfield 2017 Budget ~~~~~~~~~~~~~~~~~~~~~~~~~~~~~~~~~~~~~~~~~~~~~~~~~~~~~~~~~~~~~~~~~~~~~~~~~~~~~~~
~~~~~~~~~~~~~~~~~~~~~~~~~~~~~~~~~~~~~~~~~~~~~~~~~~~~~~~~~~~~~~~~~~~~~~~~~~~~~~~
Gas Distribution 403.306
2017 CAPITAL OUTLAY
403.306 GAS DISTRIBUTION 551200 Central Electrofusion Processor w/scanner $4,000.00 551800 Infrastructure Improvements $60,000.00 552000 Contractual Infrastructure Improvements $15,000.00 552400 Meters/Associated Parts $25,000.00
TOTAL 403.306 GAS DISTRIBUTION $104,000.00
2014 2015 2016 2017
Expenditures Description Actual Actual Revised Request
403.306.511100 Wages Regular Employees 359,564 358,883 358,314 355,671 403.306.511200 Overtime Wages 3,796 3,558 4,152 4,297 403.306.515100 FICA 25,745 26,121 26,752 25,961 403.306.515200 KPERS Contributions 34,356 37,219 37,666 30,636 403.306.515400 Health Insurance 72,000 79,680 86,054 92,938 403.306.515500 Unemployment Insurance 368 1,137 1,414 1,412 403.306.515700 Deferred Compensation Matching 3,700 3,638 3,640 3,640 403.306.515750 Flex Account Contribution (80) 0 0 0 403.306.515800 Workers Compensation Ins 5,448 5,198 4,947 4,947
TOTAL PERSONAL SERVICES 504,897 515,434 522,939 519,502
403.306.521200 Contractual Svcs- Tech/Computer 209 623 3,000 3,000 403.306.521900 Contractual Svcs-Other 2,354 5,883 3,500 3,500 403.306.522400 Medical Services 78 15 1,000 1,000 403.306.522700 Other Professional Services 4,500 2,092 4,500 5,000 403.306.523100 Advertising Costs 0 0 200 200 403.306.524100 Printing/Photo Services 0 0 250 250 403.306.524600 Travel Expenses 1,623 2,139 2,500 2,500 403.306.524700 Training/Conference Fees 879 645 2,500 2,500 403.306.525100 Dues/Membership Fees 0 7,502 6,500 9,000 403.306.527100 Tele. Service & Land Lines 1,277 530 1,200 1,200 403.306.527300 Cellular Telephones 2,451 2,673 3,500 3,500 403.306.528100 Electricity 261 224 350 350 403.306.529100 Equipment Rent 0 0 1,300 1,500
TOTAL CONTRACTUAL SERVICES 13,632 22,326 30,300 33,500
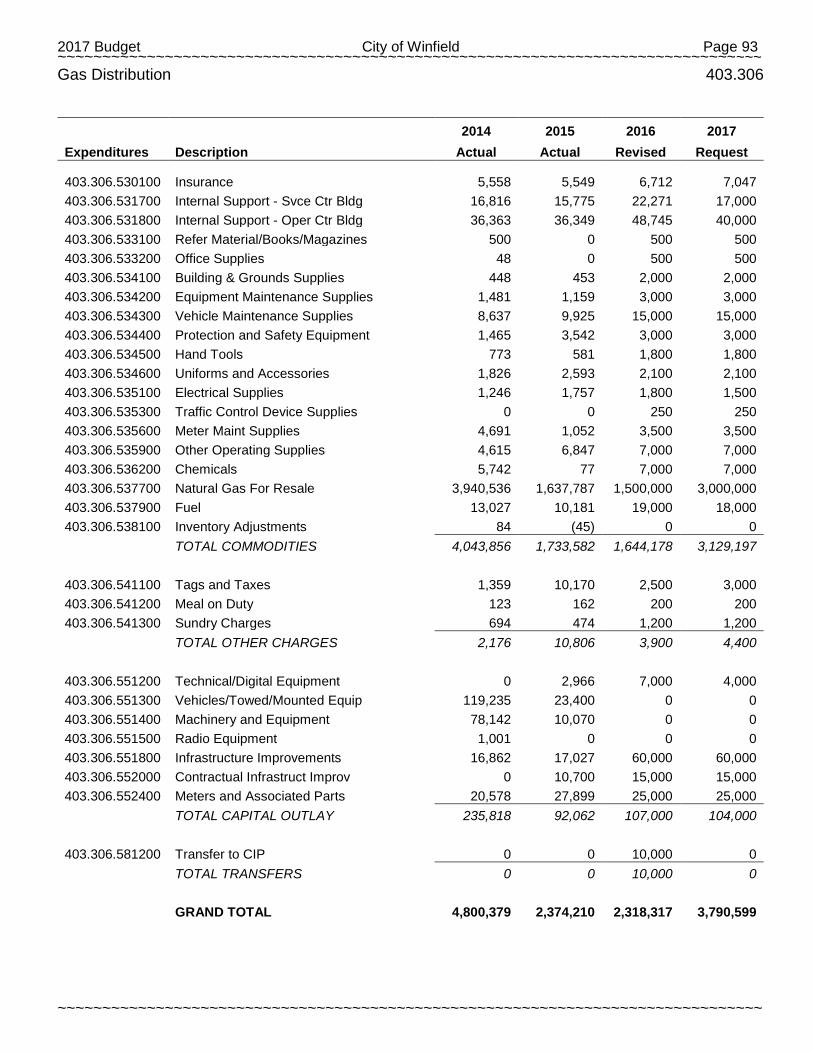
2017 Budget City of Winfield Page 93 ~~~~~~~~~~~~~~~~~~~~~~~~~~~~~~~~~~~~~~~~~~~~~~~~~~~~~~~~~~~~~~~~~~~~~~~~~~~~~~~
~~~~~~~~~~~~~~~~~~~~~~~~~~~~~~~~~~~~~~~~~~~~~~~~~~~~~~~~~~~~~~~~~~~~~~~~~~~~~~~
Gas Distribution 403.306
2014 2015 2016 2017
Expenditures Description Actual Actual Revised Request
403.306.530100 Insurance 5,558 5,549 6,712 7,047 403.306.531700 Internal Support - Svce Ctr Bldg 16,816 15,775 22,271 17,000 403.306.531800 Internal Support - Oper Ctr Bldg 36,363 36,349 48,745 40,000 403.306.533100 Refer Material/Books/Magazines 500 0 500 500 403.306.533200 Office Supplies 48 0 500 500 403.306.534100 Building & Grounds Supplies 448 453 2,000 2,000 403.306.534200 Equipment Maintenance Supplies 1,481 1,159 3,000 3,000 403.306.534300 Vehicle Maintenance Supplies 8,637 9,925 15,000 15,000 403.306.534400 Protection and Safety Equipment 1,465 3,542 3,000 3,000 403.306.534500 Hand Tools 773 581 1,800 1,800 403.306.534600 Uniforms and Accessories 1,826 2,593 2,100 2,100 403.306.535100 Electrical Supplies 1,246 1,757 1,800 1,500 403.306.535300 Traffic Control Device Supplies 0 0 250 250 403.306.535600 Meter Maint Supplies 4,691 1,052 3,500 3,500 403.306.535900 Other Operating Supplies 4,615 6,847 7,000 7,000 403.306.536200 Chemicals 5,742 77 7,000 7,000 403.306.537700 Natural Gas For Resale 3,940,536 1,637,787 1,500,000 3,000,000 403.306.537900 Fuel 13,027 10,181 19,000 18,000 403.306.538100 Inventory Adjustments 84 (45) 0 0
TOTAL COMMODITIES 4,043,856 1,733,582 1,644,178 3,129,197
403.306.541100 Tags and Taxes 1,359 10,170 2,500 3,000 403.306.541200 Meal on Duty 123 162 200 200 403.306.541300 Sundry Charges 694 474 1,200 1,200
TOTAL OTHER CHARGES 2,176 10,806 3,900 4,400
403.306.551200 Technical/Digital Equipment 0 2,966 7,000 4,000 403.306.551300 Vehicles/Towed/Mounted Equip 119,235 23,400 0 0 403.306.551400 Machinery and Equipment 78,142 10,070 0 0 403.306.551500 Radio Equipment 1,001 0 0 0 403.306.551800 Infrastructure Improvements 16,862 17,027 60,000 60,000 403.306.552000 Contractual Infrastruct Improv 0 10,700 15,000 15,000 403.306.552400 Meters and Associated Parts 20,578 27,899 25,000 25,000
TOTAL CAPITAL OUTLAY 235,818 92,062 107,000 104,000
403.306.581200 Transfer to CIP 0 0 10,000 0
TOTAL TRANSFERS 0 0 10,000 0
GRAND TOTAL 4,800,379 2,374,210 2,318,317 3,790,599
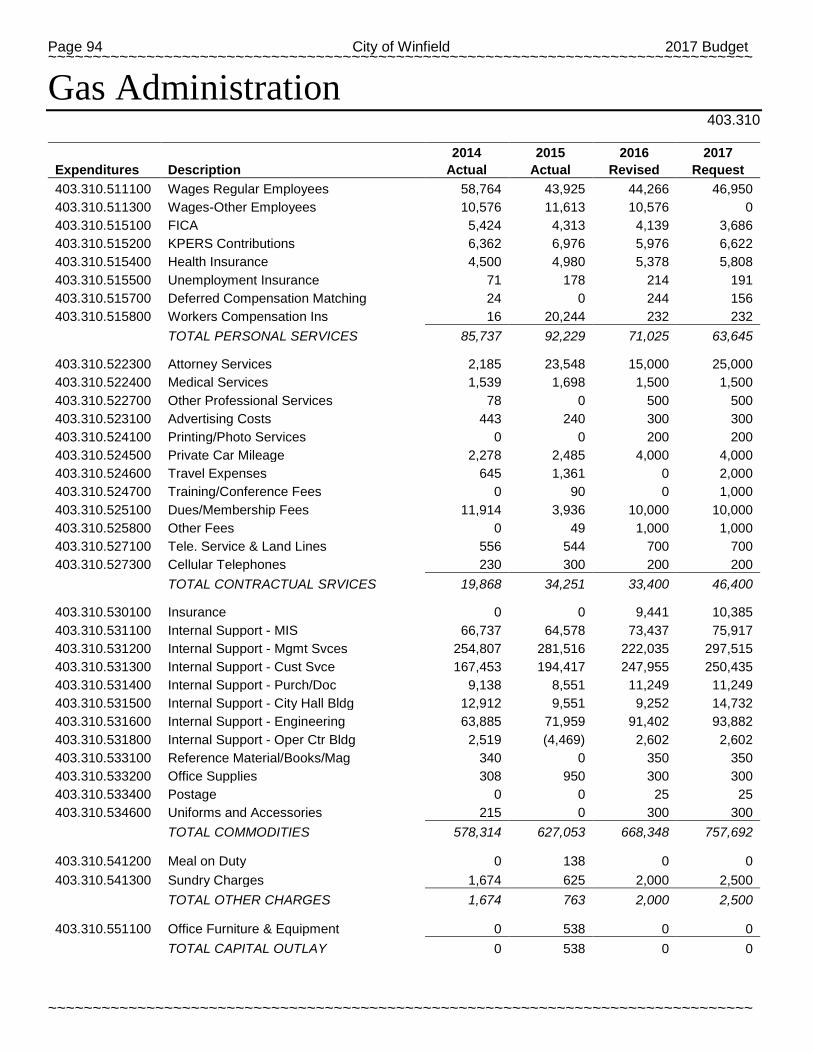
Page 94 City of Winfield 2017 Budget ~~~~~~~~~~~~~~~~~~~~~~~~~~~~~~~~~~~~~~~~~~~~~~~~~~~~~~~~~~~~~~~~~~~~~~~~~~~~~~~
~~~~~~~~~~~~~~~~~~~~~~~~~~~~~~~~~~~~~~~~~~~~~~~~~~~~~~~~~~~~~~~~~~~~~~~~~~~~~~~
Gas Administration 403.310
2014 2015 2016 2017
Expenditures Description Actual Actual Revised Request 403.310.511100 Wages Regular Employees 58,764 43,925 44,266 46,950 403.310.511300 Wages-Other Employees 10,576 11,613 10,576 0 403.310.515100 FICA 5,424 4,313 4,139 3,686 403.310.515200 KPERS Contributions 6,362 6,976 5,976 6,622 403.310.515400 Health Insurance 4,500 4,980 5,378 5,808 403.310.515500 Unemployment Insurance 71 178 214 191 403.310.515700 Deferred Compensation Matching 24 0 244 156 403.310.515800 Workers Compensation Ins 16 20,244 232 232
TOTAL PERSONAL SERVICES 85,737 92,229 71,025 63,645
403.310.522300 Attorney Services 2,185 23,548 15,000 25,000 403.310.522400 Medical Services 1,539 1,698 1,500 1,500 403.310.522700 Other Professional Services 78 0 500 500 403.310.523100 Advertising Costs 443 240 300 300 403.310.524100 Printing/Photo Services 0 0 200 200 403.310.524500 Private Car Mileage 2,278 2,485 4,000 4,000 403.310.524600 Travel Expenses 645 1,361 0 2,000 403.310.524700 Training/Conference Fees 0 90 0 1,000 403.310.525100 Dues/Membership Fees 11,914 3,936 10,000 10,000 403.310.525800 Other Fees 0 49 1,000 1,000 403.310.527100 Tele. Service & Land Lines 556 544 700 700 403.310.527300 Cellular Telephones 230 300 200 200
TOTAL CONTRACTUAL SRVICES 19,868 34,251 33,400 46,400
403.310.530100 Insurance 0 0 9,441 10,385 403.310.531100 Internal Support - MIS 66,737 64,578 73,437 75,917 403.310.531200 Internal Support - Mgmt Svces 254,807 281,516 222,035 297,515 403.310.531300 Internal Support - Cust Svce 167,453 194,417 247,955 250,435 403.310.531400 Internal Support - Purch/Doc 9,138 8,551 11,249 11,249 403.310.531500 Internal Support - City Hall Bldg 12,912 9,551 9,252 14,732 403.310.531600 Internal Support - Engineering 63,885 71,959 91,402 93,882 403.310.531800 Internal Support - Oper Ctr Bldg 2,519 (4,469) 2,602 2,602 403.310.533100 Reference Material/Books/Mag 340 0 350 350 403.310.533200 Office Supplies 308 950 300 300 403.310.533400 Postage 0 0 25 25 403.310.534600 Uniforms and Accessories 215 0 300 300
TOTAL COMMODITIES 578,314 627,053 668,348 757,692
403.310.541200 Meal on Duty 0 138 0 0 403.310.541300 Sundry Charges 1,674 625 2,000 2,500
TOTAL OTHER CHARGES 1,674 763 2,000 2,500
403.310.551100 Office Furniture & Equipment 0 538 0 0
TOTAL CAPITAL OUTLAY 0 538 0 0

2017 Budget City of Winfield Page 95 ~~~~~~~~~~~~~~~~~~~~~~~~~~~~~~~~~~~~~~~~~~~~~~~~~~~~~~~~~~~~~~~~~~~~~~~~~~~~~~~
~~~~~~~~~~~~~~~~~~~~~~~~~~~~~~~~~~~~~~~~~~~~~~~~~~~~~~~~~~~~~~~~~~~~~~~~~~~~~~~
Gas Administration 403.310
2014 2015 2016 2017
Expenditures Description Actual Actual Revised Request
403.310.581100 Transfer to General Fund (5.8%) 525,128 237,383 324,800 319,000 403.310.581100 Transfer to General Fund 0 0 285,000 289,000 403.310.581110 Transfer to Golf Course 82,500 33,000 115,000 112,500 403.310.581120 Transfer to Other Funds 0 15,000 0 0 403.310.581190 Transfer to Water 25,000 71,000 35,000 35,000 403.310.581800 Transfer to Industrial Develop 20,000 0 20,000 22,000
TOTAL TRANSFERS 652,628 356,383 779,800 777,500
GRAND TOTAL 1,338,221 1,111,217 1,554,573 1,647,737
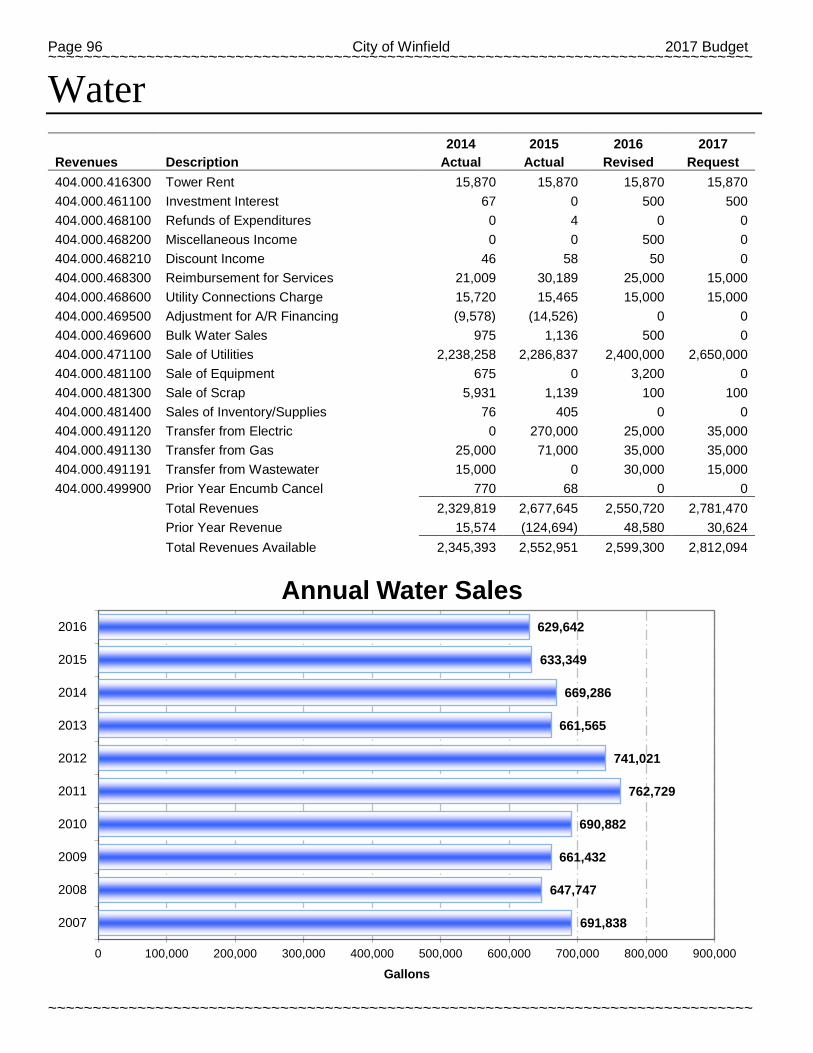
Page 96 City of Winfield 2017 Budget ~~~~~~~~~~~~~~~~~~~~~~~~~~~~~~~~~~~~~~~~~~~~~~~~~~~~~~~~~~~~~~~~~~~~~~~~~~~~~~~
~~~~~~~~~~~~~~~~~~~~~~~~~~~~~~~~~~~~~~~~~~~~~~~~~~~~~~~~~~~~~~~~~~~~~~~~~~~~~~~
Water
2014 2015 2016 2017
Revenues Description Actual Actual Revised Request 404.000.416300 Tower Rent 15,870 15,870 15,870 15,870 404.000.461100 Investment Interest 67 0 500 500 404.000.468100 Refunds of Expenditures 0 4 0 0 404.000.468200 Miscellaneous Income 0 0 500 0 404.000.468210 Discount Income 46 58 50 0 404.000.468300 Reimbursement for Services 21,009 30,189 25,000 15,000 404.000.468600 Utility Connections Charge 15,720 15,465 15,000 15,000 404.000.469500 Adjustment for A/R Financing (9,578) (14,526) 0 0 404.000.469600 Bulk Water Sales 975 1,136 500 0 404.000.471100 Sale of Utilities 2,238,258 2,286,837 2,400,000 2,650,000 404.000.481100 Sale of Equipment 675 0 3,200 0 404.000.481300 Sale of Scrap 5,931 1,139 100 100 404.000.481400 Sales of Inventory/Supplies 76 405 0 0 404.000.491120 Transfer from Electric 0 270,000 25,000 35,000 404.000.491130 Transfer from Gas 25,000 71,000 35,000 35,000 404.000.491191 Transfer from Wastewater 15,000 0 30,000 15,000 404.000.499900 Prior Year Encumb Cancel 770 68 0 0
Total Revenues 2,329,819 2,677,645 2,550,720 2,781,470
Prior Year Revenue 15,574 (124,694) 48,580 30,624
Total Revenues Available 2,345,393 2,552,951 2,599,300 2,812,094
691,838
647,747
661,432
690,882
762,729
741,021
661,565
669,286
633,349
629,642
0 100,000 200,000 300,000 400,000 500,000 600,000 700,000 800,000 900,000
2007
2008
2009
2010
2011
2012
2013
2014
2015
2016
Gallons
Annual Water Sales
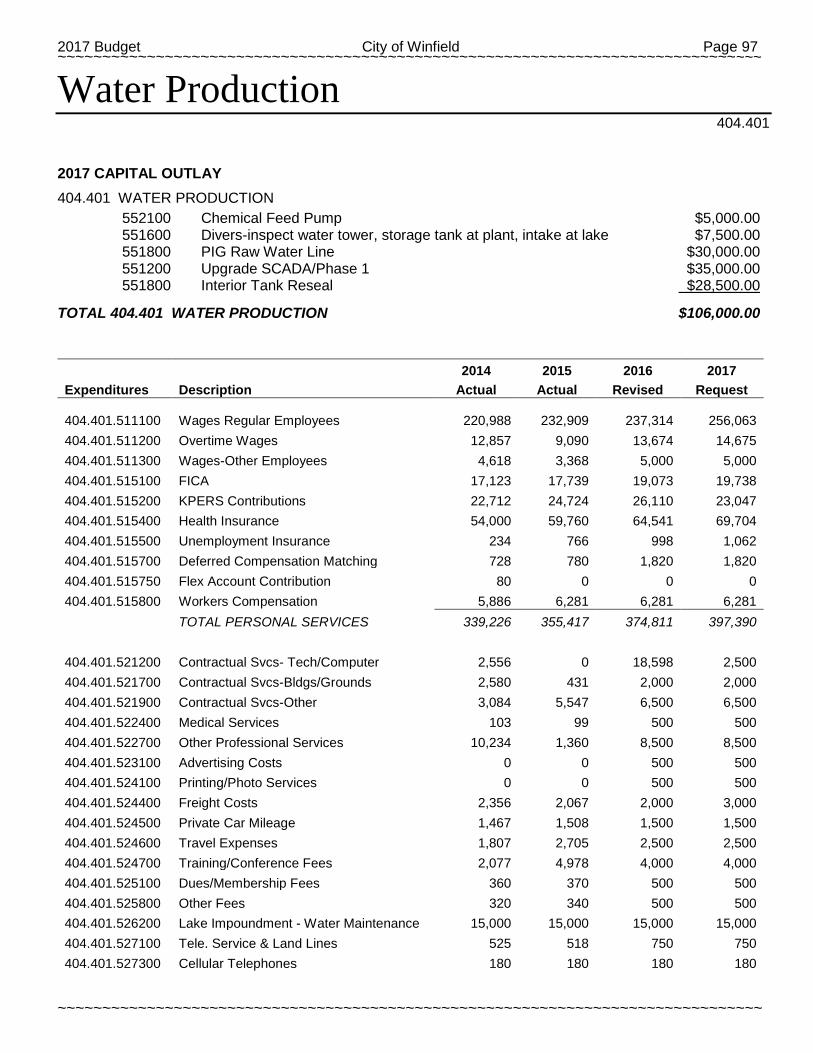
2017 Budget City of Winfield Page 97 ~~~~~~~~~~~~~~~~~~~~~~~~~~~~~~~~~~~~~~~~~~~~~~~~~~~~~~~~~~~~~~~~~~~~~~~~~~~~~~~
~~~~~~~~~~~~~~~~~~~~~~~~~~~~~~~~~~~~~~~~~~~~~~~~~~~~~~~~~~~~~~~~~~~~~~~~~~~~~~~
Water Production 404.401
2017 CAPITAL OUTLAY
404.401 WATER PRODUCTION 552100 Chemical Feed Pump $5,000.00 551600 Divers-inspect water tower, storage tank at plant, intake at lake $7,500.00 551800 PIG Raw Water Line $30,000.00 551200 Upgrade SCADA/Phase 1 $35,000.00 551800 Interior Tank Reseal $28,500.00
TOTAL 404.401 WATER PRODUCTION $106,000.00
2014 2015 2016 2017
Expenditures Description Actual Actual Revised Request
404.401.511100 Wages Regular Employees 220,988 232,909 237,314 256,063 404.401.511200 Overtime Wages 12,857 9,090 13,674 14,675 404.401.511300 Wages-Other Employees 4,618 3,368 5,000 5,000 404.401.515100 FICA 17,123 17,739 19,073 19,738 404.401.515200 KPERS Contributions 22,712 24,724 26,110 23,047 404.401.515400 Health Insurance 54,000 59,760 64,541 69,704 404.401.515500 Unemployment Insurance 234 766 998 1,062 404.401.515700 Deferred Compensation Matching 728 780 1,820 1,820 404.401.515750 Flex Account Contribution 80 0 0 0 404.401.515800 Workers Compensation 5,886 6,281 6,281 6,281
TOTAL PERSONAL SERVICES 339,226 355,417 374,811 397,390
404.401.521200 Contractual Svcs- Tech/Computer 2,556 0 18,598 2,500 404.401.521700 Contractual Svcs-Bldgs/Grounds 2,580 431 2,000 2,000 404.401.521900 Contractual Svcs-Other 3,084 5,547 6,500 6,500 404.401.522400 Medical Services 103 99 500 500 404.401.522700 Other Professional Services 10,234 1,360 8,500 8,500 404.401.523100 Advertising Costs 0 0 500 500 404.401.524100 Printing/Photo Services 0 0 500 500 404.401.524400 Freight Costs 2,356 2,067 2,000 3,000 404.401.524500 Private Car Mileage 1,467 1,508 1,500 1,500 404.401.524600 Travel Expenses 1,807 2,705 2,500 2,500 404.401.524700 Training/Conference Fees 2,077 4,978 4,000 4,000 404.401.525100 Dues/Membership Fees 360 370 500 500 404.401.525800 Other Fees 320 340 500 500 404.401.526200 Lake Impoundment - Water Maintenance 15,000 15,000 15,000 15,000 404.401.527100 Tele. Service & Land Lines 525 518 750 750 404.401.527300 Cellular Telephones 180 180 180 180

Page 98 City of Winfield 2017 Budget ~~~~~~~~~~~~~~~~~~~~~~~~~~~~~~~~~~~~~~~~~~~~~~~~~~~~~~~~~~~~~~~~~~~~~~~~~~~~~~~
~~~~~~~~~~~~~~~~~~~~~~~~~~~~~~~~~~~~~~~~~~~~~~~~~~~~~~~~~~~~~~~~~~~~~~~~~~~~~~~
Water Production 404.401
2014 2015 2016 2017
Expenditures Description Actual Actual Revised Request
404.401.528100 Electricity 155,249 132,073 130,000 130,000 404.401.528200 Natural Gas 5,629 5,256 6,000 6,000 404.401.528500 Refuse 852 781 855 855 404.401.529100 Equipment Rent 8,830 10,479 9,300 15,000
TOTAL CONTRACTUAL SERVICES 213,209 183,692 210,183 200,785
404.401.530100 Insurance 32,069 19,044 24,719 25,955 404.401.531700 Internal Support - Svce Ctr Bldg 1,324 1,242 1,267 1,350 404.401.533100 Reference Material/Books/Magazines 0 0 250 250 404.401.533200 Office Supplies 16 0 100 100 404.401.533400 Postage 24 0 0 0 404.401.533700 Lab/Photo Supplies 3,816 2,872 3,500 3,500 404.401.534100 Building & Grounds Supplies 9,781 8,849 5,000 5,000 404.401.534200 Equipment Maintenance Supplies 18,890 21,991 22,000 32,000 404.401.534300 Vehicle Maintenance Supplies 1,160 619 1,200 1,200 404.401.534400 Protection and Safety Equipment 683 1,488 1,500 1,500 404.401.534500 Hand Tools 181 234 1,200 1,200 404.401.534600 Uniforms and Accessories 1,209 1,021 900 900 404.401.535900 Other Operating Supplies 311 541 1,000 1,000 404.401.536200 Chemicals 121,648 114,479 115,000 120,000 404.401.537300 Lubricants & Motor Oils 5 125 500 500 404.401.537900 Fuel 2,688 2,312 2,800 0
TOTAL COMMODITIES 193,805 174,817 180,936 194,455
404.401.541100 Tags and Taxes 418 0 0 0 404.401.541300 Sundry Charges 185 612 800 800
TOTAL OTHER CHARGES 603 612 800 800
404.401.551200 Technical/Digital Equipment 3,923 3,526 10,000 35,000 404.401.551400 Machinery and Equipment 3,031 0 0 5,000 404.401.551600 Building and Structural Improvements 0 16 0 7,500 404.401.551800 Infrastructure Improvements 1,128 2,489 0 58,500
TOTAL CAPITAL OUTLAY 8,082 6,031 10,000 106,000
GRAND TOTAL 754,925 720,569 776,730 899,430
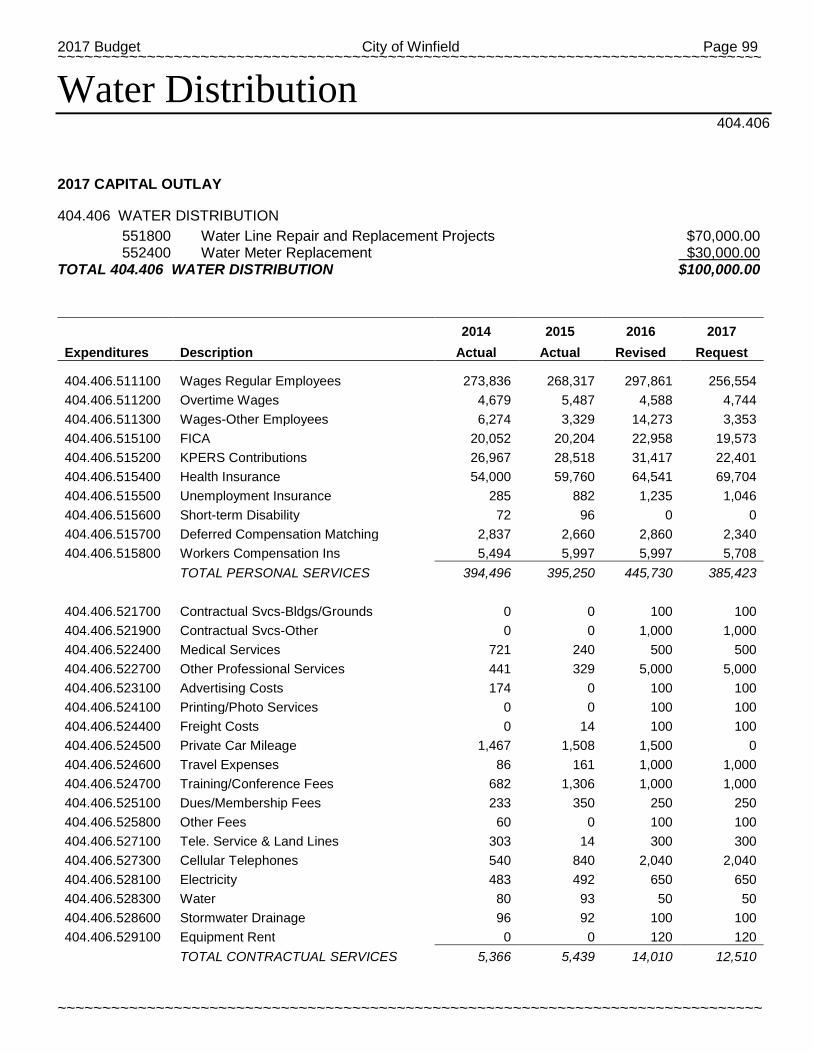
2017 Budget City of Winfield Page 99 ~~~~~~~~~~~~~~~~~~~~~~~~~~~~~~~~~~~~~~~~~~~~~~~~~~~~~~~~~~~~~~~~~~~~~~~~~~~~~~~
~~~~~~~~~~~~~~~~~~~~~~~~~~~~~~~~~~~~~~~~~~~~~~~~~~~~~~~~~~~~~~~~~~~~~~~~~~~~~~~
Water Distribution 404.406
2017 CAPITAL OUTLAY
404.406 WATER DISTRIBUTION 551800 Water Line Repair and Replacement Projects $70,000.00 552400 Water Meter Replacement $30,000.00
TOTAL 404.406 WATER DISTRIBUTION $100,000.00
2014 2015 2016 2017
Expenditures Description Actual Actual Revised Request
404.406.511100 Wages Regular Employees 273,836 268,317 297,861 256,554 404.406.511200 Overtime Wages 4,679 5,487 4,588 4,744 404.406.511300 Wages-Other Employees 6,274 3,329 14,273 3,353 404.406.515100 FICA 20,052 20,204 22,958 19,573 404.406.515200 KPERS Contributions 26,967 28,518 31,417 22,401 404.406.515400 Health Insurance 54,000 59,760 64,541 69,704 404.406.515500 Unemployment Insurance 285 882 1,235 1,046 404.406.515600 Short-term Disability 72 96 0 0 404.406.515700 Deferred Compensation Matching 2,837 2,660 2,860 2,340 404.406.515800 Workers Compensation Ins 5,494 5,997 5,997 5,708
TOTAL PERSONAL SERVICES 394,496 395,250 445,730 385,423
404.406.521700 Contractual Svcs-Bldgs/Grounds 0 0 100 100 404.406.521900 Contractual Svcs-Other 0 0 1,000 1,000 404.406.522400 Medical Services 721 240 500 500 404.406.522700 Other Professional Services 441 329 5,000 5,000 404.406.523100 Advertising Costs 174 0 100 100 404.406.524100 Printing/Photo Services 0 0 100 100 404.406.524400 Freight Costs 0 14 100 100 404.406.524500 Private Car Mileage 1,467 1,508 1,500 0 404.406.524600 Travel Expenses 86 161 1,000 1,000 404.406.524700 Training/Conference Fees 682 1,306 1,000 1,000 404.406.525100 Dues/Membership Fees 233 350 250 250 404.406.525800 Other Fees 60 0 100 100 404.406.527100 Tele. Service & Land Lines 303 14 300 300 404.406.527300 Cellular Telephones 540 840 2,040 2,040 404.406.528100 Electricity 483 492 650 650 404.406.528300 Water 80 93 50 50 404.406.528600 Stormwater Drainage 96 92 100 100 404.406.529100 Equipment Rent 0 0 120 120
TOTAL CONTRACTUAL SERVICES 5,366 5,439 14,010 12,510
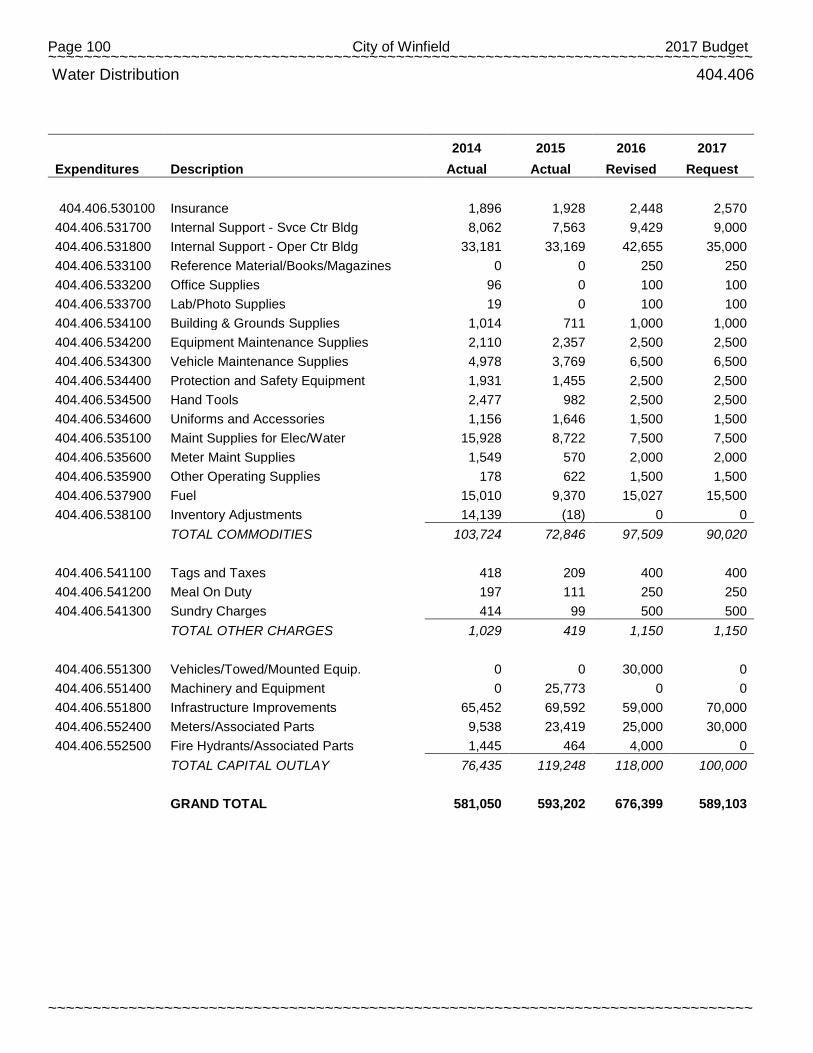
Page 100 City of Winfield 2017 Budget ~~~~~~~~~~~~~~~~~~~~~~~~~~~~~~~~~~~~~~~~~~~~~~~~~~~~~~~~~~~~~~~~~~~~~~~~~~~~~~~
~~~~~~~~~~~~~~~~~~~~~~~~~~~~~~~~~~~~~~~~~~~~~~~~~~~~~~~~~~~~~~~~~~~~~~~~~~~~~~~
Water Distribution 404.406
2014 2015 2016 2017
Expenditures Description Actual Actual Revised Request
404.406.530100 Insurance 1,896 1,928 2,448 2,570 404.406.531700 Internal Support - Svce Ctr Bldg 8,062 7,563 9,429 9,000 404.406.531800 Internal Support - Oper Ctr Bldg 33,181 33,169 42,655 35,000 404.406.533100 Reference Material/Books/Magazines 0 0 250 250 404.406.533200 Office Supplies 96 0 100 100 404.406.533700 Lab/Photo Supplies 19 0 100 100 404.406.534100 Building & Grounds Supplies 1,014 711 1,000 1,000 404.406.534200 Equipment Maintenance Supplies 2,110 2,357 2,500 2,500 404.406.534300 Vehicle Maintenance Supplies 4,978 3,769 6,500 6,500 404.406.534400 Protection and Safety Equipment 1,931 1,455 2,500 2,500 404.406.534500 Hand Tools 2,477 982 2,500 2,500 404.406.534600 Uniforms and Accessories 1,156 1,646 1,500 1,500 404.406.535100 Maint Supplies for Elec/Water 15,928 8,722 7,500 7,500 404.406.535600 Meter Maint Supplies 1,549 570 2,000 2,000 404.406.535900 Other Operating Supplies 178 622 1,500 1,500 404.406.537900 Fuel 15,010 9,370 15,027 15,500 404.406.538100 Inventory Adjustments 14,139 (18) 0 0
TOTAL COMMODITIES 103,724 72,846 97,509 90,020
404.406.541100 Tags and Taxes 418 209 400 400 404.406.541200 Meal On Duty 197 111 250 250 404.406.541300 Sundry Charges 414 99 500 500
TOTAL OTHER CHARGES 1,029 419 1,150 1,150
404.406.551300 Vehicles/Towed/Mounted Equip. 0 0 30,000 0 404.406.551400 Machinery and Equipment 0 25,773 0 0 404.406.551800 Infrastructure Improvements 65,452 69,592 59,000 70,000 404.406.552400 Meters/Associated Parts 9,538 23,419 25,000 30,000 404.406.552500 Fire Hydrants/Associated Parts 1,445 464 4,000 0
TOTAL CAPITAL OUTLAY 76,435 119,248 118,000 100,000
GRAND TOTAL 581,050 593,202 676,399 589,103
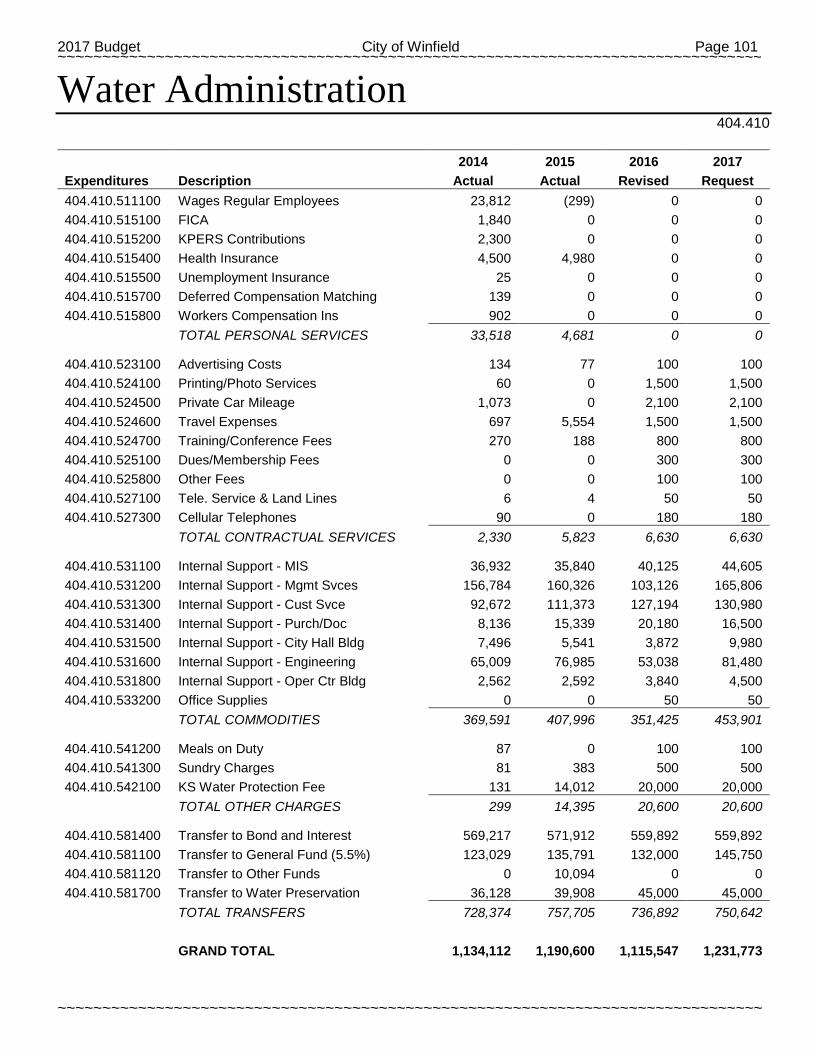
2017 Budget City of Winfield Page 101 ~~~~~~~~~~~~~~~~~~~~~~~~~~~~~~~~~~~~~~~~~~~~~~~~~~~~~~~~~~~~~~~~~~~~~~~~~~~~~~~
~~~~~~~~~~~~~~~~~~~~~~~~~~~~~~~~~~~~~~~~~~~~~~~~~~~~~~~~~~~~~~~~~~~~~~~~~~~~~~~
Water Administration 404.410
2014 2015 2016 2017
Expenditures Description Actual Actual Revised Request 404.410.511100 Wages Regular Employees 23,812 (299) 0 0 404.410.515100 FICA 1,840 0 0 0 404.410.515200 KPERS Contributions 2,300 0 0 0 404.410.515400 Health Insurance 4,500 4,980 0 0 404.410.515500 Unemployment Insurance 25 0 0 0 404.410.515700 Deferred Compensation Matching 139 0 0 0 404.410.515800 Workers Compensation Ins 902 0 0 0
TOTAL PERSONAL SERVICES 33,518 4,681 0 0
404.410.523100 Advertising Costs 134 77 100 100 404.410.524100 Printing/Photo Services 60 0 1,500 1,500 404.410.524500 Private Car Mileage 1,073 0 2,100 2,100 404.410.524600 Travel Expenses 697 5,554 1,500 1,500 404.410.524700 Training/Conference Fees 270 188 800 800 404.410.525100 Dues/Membership Fees 0 0 300 300 404.410.525800 Other Fees 0 0 100 100 404.410.527100 Tele. Service & Land Lines 6 4 50 50 404.410.527300 Cellular Telephones 90 0 180 180
TOTAL CONTRACTUAL SERVICES 2,330 5,823 6,630 6,630
404.410.531100 Internal Support - MIS 36,932 35,840 40,125 44,605 404.410.531200 Internal Support - Mgmt Svces 156,784 160,326 103,126 165,806 404.410.531300 Internal Support - Cust Svce 92,672 111,373 127,194 130,980 404.410.531400 Internal Support - Purch/Doc 8,136 15,339 20,180 16,500 404.410.531500 Internal Support - City Hall Bldg 7,496 5,541 3,872 9,980 404.410.531600 Internal Support - Engineering 65,009 76,985 53,038 81,480 404.410.531800 Internal Support - Oper Ctr Bldg 2,562 2,592 3,840 4,500 404.410.533200 Office Supplies 0 0 50 50
TOTAL COMMODITIES 369,591 407,996 351,425 453,901
404.410.541200 Meals on Duty 87 0 100 100 404.410.541300 Sundry Charges 81 383 500 500 404.410.542100 KS Water Protection Fee 131 14,012 20,000 20,000
TOTAL OTHER CHARGES 299 14,395 20,600 20,600
404.410.581400 Transfer to Bond and Interest 569,217 571,912 559,892 559,892 404.410.581100 Transfer to General Fund (5.5%) 123,029 135,791 132,000 145,750 404.410.581120 Transfer to Other Funds 0 10,094 0 0 404.410.581700 Transfer to Water Preservation 36,128 39,908 45,000 45,000
TOTAL TRANSFERS 728,374 757,705 736,892 750,642
GRAND TOTAL 1,134,112 1,190,600 1,115,547 1,231,773
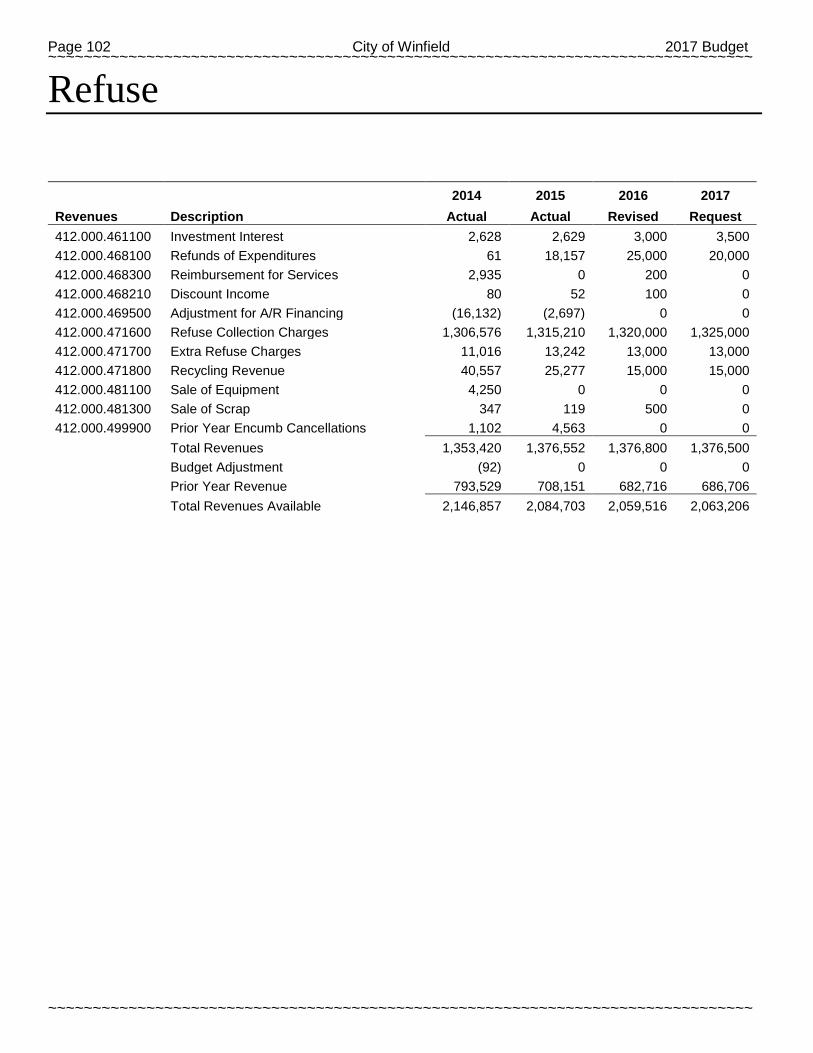
Page 102 City of Winfield 2017 Budget ~~~~~~~~~~~~~~~~~~~~~~~~~~~~~~~~~~~~~~~~~~~~~~~~~~~~~~~~~~~~~~~~~~~~~~~~~~~~~~~
~~~~~~~~~~~~~~~~~~~~~~~~~~~~~~~~~~~~~~~~~~~~~~~~~~~~~~~~~~~~~~~~~~~~~~~~~~~~~~~
Refuse
2014 2015 2016 2017
Revenues Description Actual Actual Revised Request 412.000.461100 Investment Interest 2,628 2,629 3,000 3,500 412.000.468100 Refunds of Expenditures 61 18,157 25,000 20,000 412.000.468300 Reimbursement for Services 2,935 0 200 0 412.000.468210 Discount Income 80 52 100 0 412.000.469500 Adjustment for A/R Financing (16,132) (2,697) 0 0 412.000.471600 Refuse Collection Charges 1,306,576 1,315,210 1,320,000 1,325,000 412.000.471700 Extra Refuse Charges 11,016 13,242 13,000 13,000 412.000.471800 Recycling Revenue 40,557 25,277 15,000 15,000 412.000.481100 Sale of Equipment 4,250 0 0 0 412.000.481300 Sale of Scrap 347 119 500 0 412.000.499900 Prior Year Encumb Cancellations 1,102 4,563 0 0
Total Revenues 1,353,420 1,376,552 1,376,800 1,376,500
Budget Adjustment (92) 0 0 0
Prior Year Revenue 793,529 708,151 682,716 686,706
Total Revenues Available 2,146,857 2,084,703 2,059,516 2,063,206
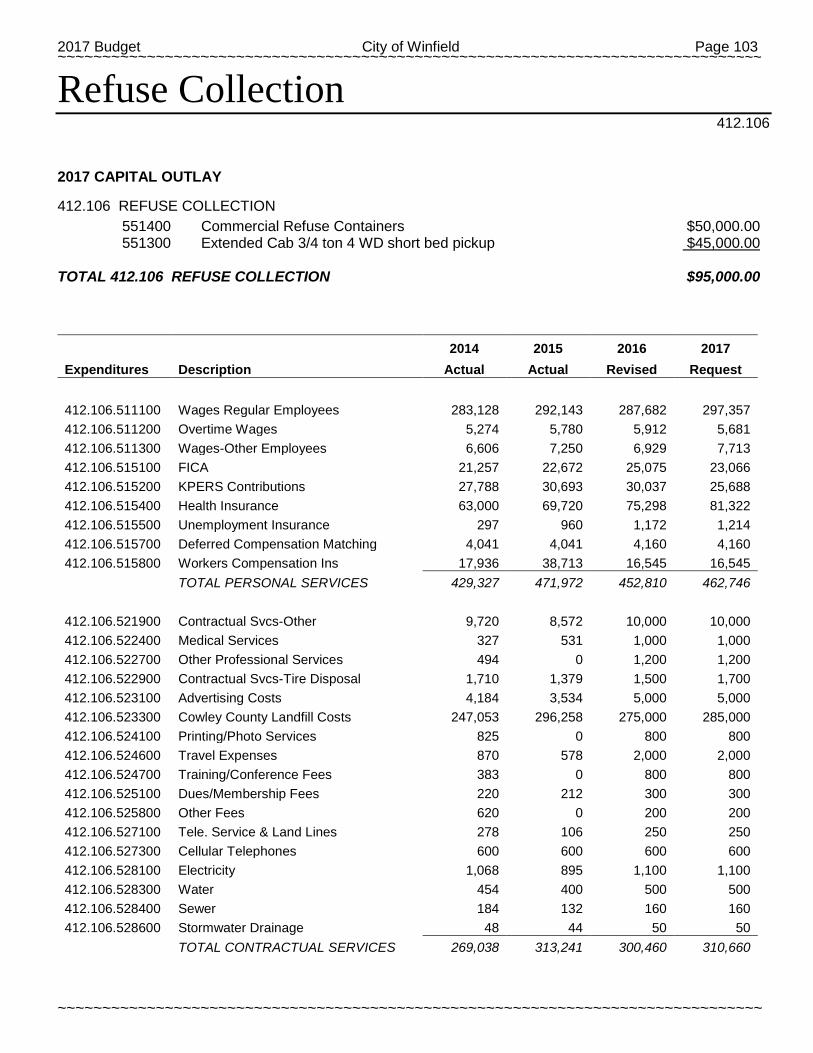
2017 Budget City of Winfield Page 103 ~~~~~~~~~~~~~~~~~~~~~~~~~~~~~~~~~~~~~~~~~~~~~~~~~~~~~~~~~~~~~~~~~~~~~~~~~~~~~~~
~~~~~~~~~~~~~~~~~~~~~~~~~~~~~~~~~~~~~~~~~~~~~~~~~~~~~~~~~~~~~~~~~~~~~~~~~~~~~~~
Refuse Collection 412.106
2017 CAPITAL OUTLAY 412.106 REFUSE COLLECTION 551400 Commercial Refuse Containers $50,000.00 551300 Extended Cab 3/4 ton 4 WD short bed pickup $45,000.00
TOTAL 412.106 REFUSE COLLECTION $95,000.00
2014 2015 2016 2017
Expenditures Description Actual Actual Revised Request
412.106.511100 Wages Regular Employees 283,128 292,143 287,682 297,357 412.106.511200 Overtime Wages 5,274 5,780 5,912 5,681 412.106.511300 Wages-Other Employees 6,606 7,250 6,929 7,713 412.106.515100 FICA 21,257 22,672 25,075 23,066 412.106.515200 KPERS Contributions 27,788 30,693 30,037 25,688 412.106.515400 Health Insurance 63,000 69,720 75,298 81,322 412.106.515500 Unemployment Insurance 297 960 1,172 1,214 412.106.515700 Deferred Compensation Matching 4,041 4,041 4,160 4,160 412.106.515800 Workers Compensation Ins 17,936 38,713 16,545 16,545
TOTAL PERSONAL SERVICES 429,327 471,972 452,810 462,746
412.106.521900 Contractual Svcs-Other 9,720 8,572 10,000 10,000 412.106.522400 Medical Services 327 531 1,000 1,000 412.106.522700 Other Professional Services 494 0 1,200 1,200 412.106.522900 Contractual Svcs-Tire Disposal 1,710 1,379 1,500 1,700 412.106.523100 Advertising Costs 4,184 3,534 5,000 5,000 412.106.523300 Cowley County Landfill Costs 247,053 296,258 275,000 285,000 412.106.524100 Printing/Photo Services 825 0 800 800 412.106.524600 Travel Expenses 870 578 2,000 2,000 412.106.524700 Training/Conference Fees 383 0 800 800 412.106.525100 Dues/Membership Fees 220 212 300 300 412.106.525800 Other Fees 620 0 200 200 412.106.527100 Tele. Service & Land Lines 278 106 250 250 412.106.527300 Cellular Telephones 600 600 600 600 412.106.528100 Electricity 1,068 895 1,100 1,100 412.106.528300 Water 454 400 500 500 412.106.528400 Sewer 184 132 160 160 412.106.528600 Stormwater Drainage 48 44 50 50
TOTAL CONTRACTUAL SERVICES 269,038 313,241 300,460 310,660
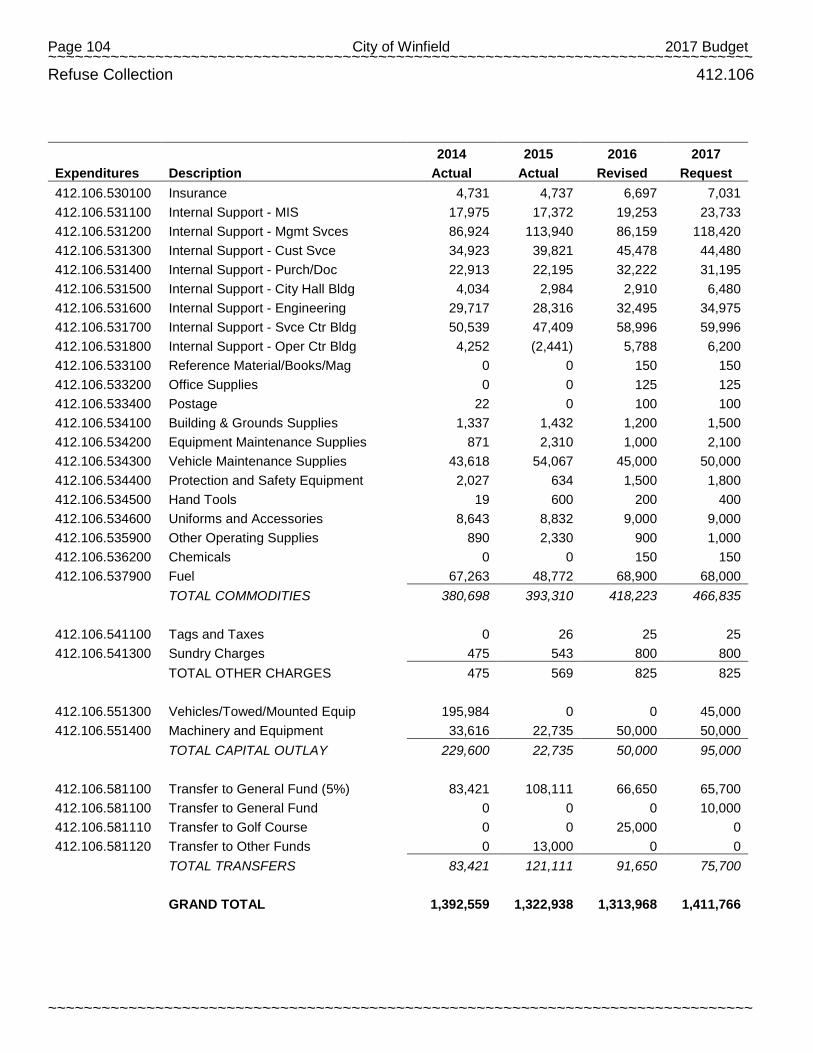
Page 104 City of Winfield 2017 Budget ~~~~~~~~~~~~~~~~~~~~~~~~~~~~~~~~~~~~~~~~~~~~~~~~~~~~~~~~~~~~~~~~~~~~~~~~~~~~~~~
~~~~~~~~~~~~~~~~~~~~~~~~~~~~~~~~~~~~~~~~~~~~~~~~~~~~~~~~~~~~~~~~~~~~~~~~~~~~~~~
Refuse Collection 412.106
2014 2015 2016 2017
Expenditures Description Actual Actual Revised Request 412.106.530100 Insurance 4,731 4,737 6,697 7,031 412.106.531100 Internal Support - MIS 17,975 17,372 19,253 23,733 412.106.531200 Internal Support - Mgmt Svces 86,924 113,940 86,159 118,420 412.106.531300 Internal Support - Cust Svce 34,923 39,821 45,478 44,480 412.106.531400 Internal Support - Purch/Doc 22,913 22,195 32,222 31,195 412.106.531500 Internal Support - City Hall Bldg 4,034 2,984 2,910 6,480 412.106.531600 Internal Support - Engineering 29,717 28,316 32,495 34,975 412.106.531700 Internal Support - Svce Ctr Bldg 50,539 47,409 58,996 59,996 412.106.531800 Internal Support - Oper Ctr Bldg 4,252 (2,441) 5,788 6,200 412.106.533100 Reference Material/Books/Mag 0 0 150 150 412.106.533200 Office Supplies 0 0 125 125 412.106.533400 Postage 22 0 100 100 412.106.534100 Building & Grounds Supplies 1,337 1,432 1,200 1,500 412.106.534200 Equipment Maintenance Supplies 871 2,310 1,000 2,100 412.106.534300 Vehicle Maintenance Supplies 43,618 54,067 45,000 50,000 412.106.534400 Protection and Safety Equipment 2,027 634 1,500 1,800 412.106.534500 Hand Tools 19 600 200 400 412.106.534600 Uniforms and Accessories 8,643 8,832 9,000 9,000 412.106.535900 Other Operating Supplies 890 2,330 900 1,000 412.106.536200 Chemicals 0 0 150 150 412.106.537900 Fuel 67,263 48,772 68,900 68,000
TOTAL COMMODITIES 380,698 393,310 418,223 466,835
412.106.541100 Tags and Taxes 0 26 25 25 412.106.541300 Sundry Charges 475 543 800 800
TOTAL OTHER CHARGES 475 569 825 825
412.106.551300 Vehicles/Towed/Mounted Equip 195,984 0 0 45,000 412.106.551400 Machinery and Equipment 33,616 22,735 50,000 50,000
TOTAL CAPITAL OUTLAY 229,600 22,735 50,000 95,000
412.106.581100 Transfer to General Fund (5%) 83,421 108,111 66,650 65,700 412.106.581100 Transfer to General Fund 0 0 0 10,000 412.106.581110 Transfer to Golf Course 0 0 25,000 0 412.106.581120 Transfer to Other Funds 0 13,000 0 0
TOTAL TRANSFERS 83,421 121,111 91,650 75,700
GRAND TOTAL 1,392,559 1,322,938 1,313,968 1,411,766
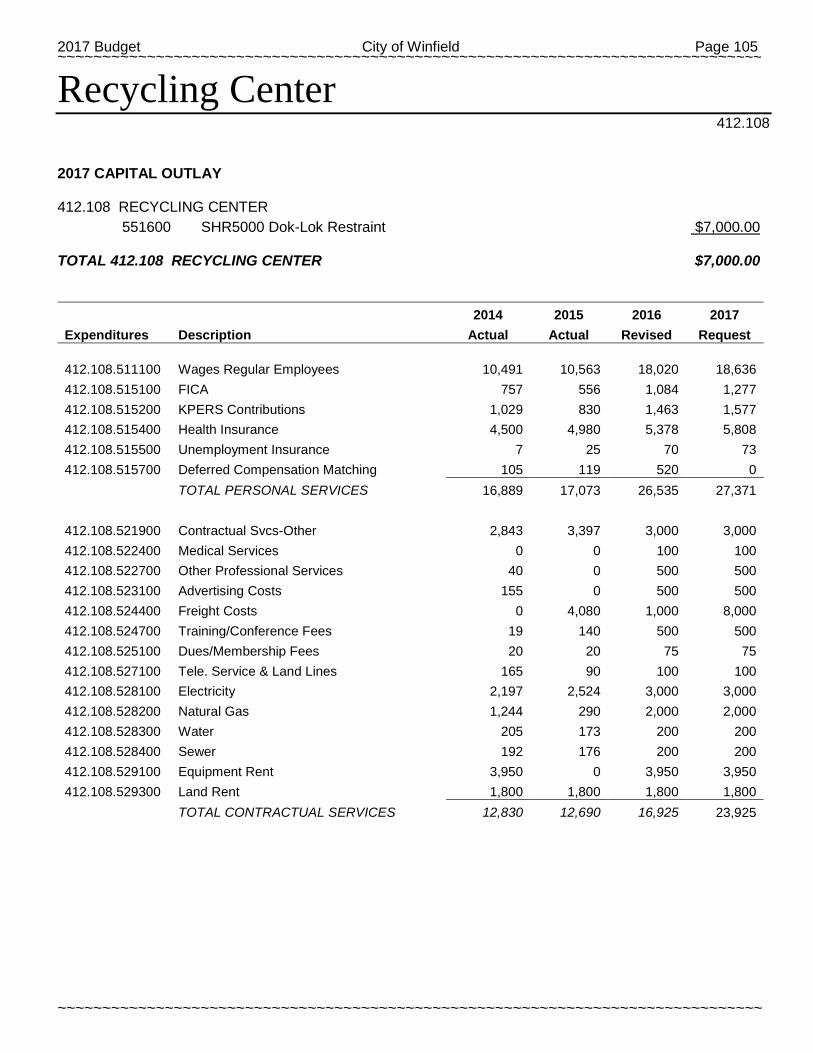
2017 Budget City of Winfield Page 105 ~~~~~~~~~~~~~~~~~~~~~~~~~~~~~~~~~~~~~~~~~~~~~~~~~~~~~~~~~~~~~~~~~~~~~~~~~~~~~~~
~~~~~~~~~~~~~~~~~~~~~~~~~~~~~~~~~~~~~~~~~~~~~~~~~~~~~~~~~~~~~~~~~~~~~~~~~~~~~~~
Recycling Center 412.108
2017 CAPITAL OUTLAY 412.108 RECYCLING CENTER 551600 SHR5000 Dok-Lok Restraint $7,000.00
TOTAL 412.108 RECYCLING CENTER $7,000.00
2014 2015 2016 2017
Expenditures Description Actual Actual Revised Request
412.108.511100 Wages Regular Employees 10,491 10,563 18,020 18,636 412.108.515100 FICA 757 556 1,084 1,277 412.108.515200 KPERS Contributions 1,029 830 1,463 1,577 412.108.515400 Health Insurance 4,500 4,980 5,378 5,808 412.108.515500 Unemployment Insurance 7 25 70 73 412.108.515700 Deferred Compensation Matching 105 119 520 0
TOTAL PERSONAL SERVICES 16,889 17,073 26,535 27,371
412.108.521900 Contractual Svcs-Other 2,843 3,397 3,000 3,000 412.108.522400 Medical Services 0 0 100 100 412.108.522700 Other Professional Services 40 0 500 500 412.108.523100 Advertising Costs 155 0 500 500 412.108.524400 Freight Costs 0 4,080 1,000 8,000 412.108.524700 Training/Conference Fees 19 140 500 500 412.108.525100 Dues/Membership Fees 20 20 75 75 412.108.527100 Tele. Service & Land Lines 165 90 100 100 412.108.528100 Electricity 2,197 2,524 3,000 3,000 412.108.528200 Natural Gas 1,244 290 2,000 2,000 412.108.528300 Water 205 173 200 200 412.108.528400 Sewer 192 176 200 200 412.108.529100 Equipment Rent 3,950 0 3,950 3,950 412.108.529300 Land Rent 1,800 1,800 1,800 1,800
TOTAL CONTRACTUAL SERVICES 12,830 12,690 16,925 23,925
Page 106 City of Winfield 2017 Budget ~~~~~~~~~~~~~~~~~~~~~~~~~~~~~~~~~~~~~~~~~~~~~~~~~~~~~~~~~~~~~~~~~~~~~~~~~~~~~~~
~~~~~~~~~~~~~~~~~~~~~~~~~~~~~~~~~~~~~~~~~~~~~~~~~~~~~~~~~~~~~~~~~~~~~~~~~~~~~~~
Recycling Center 412.108
2014 2015 2016 2017
Expenditures Description Actual Actual Revised Request
412.108.530100 Insurance 1,321 928 1,177 1,236 412.108.531700 Internal Support - Svce Ctr Bldg 6,017 5,644 2,604 2,500 412.108.533200 Office Supplies 932 0 100 100 412.108.534100 Building & Grounds Supplies 980 2,859 700 700 412.108.534200 Equipment Maintenance Supplies 79 2,250 250 250 412.108.534300 Vehicle Maintenance Supplies 4,278 903 1,000 1,000 412.108.534400 Protection and Safety Equipment 296 321 300 300 412.108.534500 Hand Tools 0 0 150 150 412.108.534600 Uniforms and Accessories 1,021 1,325 1,400 1,400 412.108.535900 Other Operating Supplies 151 0 200 200 412.108.536200 Chemicals 0 0 100 100 412.108.537900 Fuel 1,353 60 300 750
TOTAL COMMODITIES 16,428 14,290 8,281 8,686
412.108.541300 Sundry Charges 0 26,318 100 100
TOTAL OTHER CHARGES 0 26,318 100 100
412.108.551400 Machinery and Equipment 0 2,573 0 0 412.108.551600 Building and Structural Improv 0 6,105 7,000 7,000
TOTAL CAPITAL OUTLAY 0 8,678 7,000 7,000
GRAND TOTAL 46,147 79,049 58,841 67,082
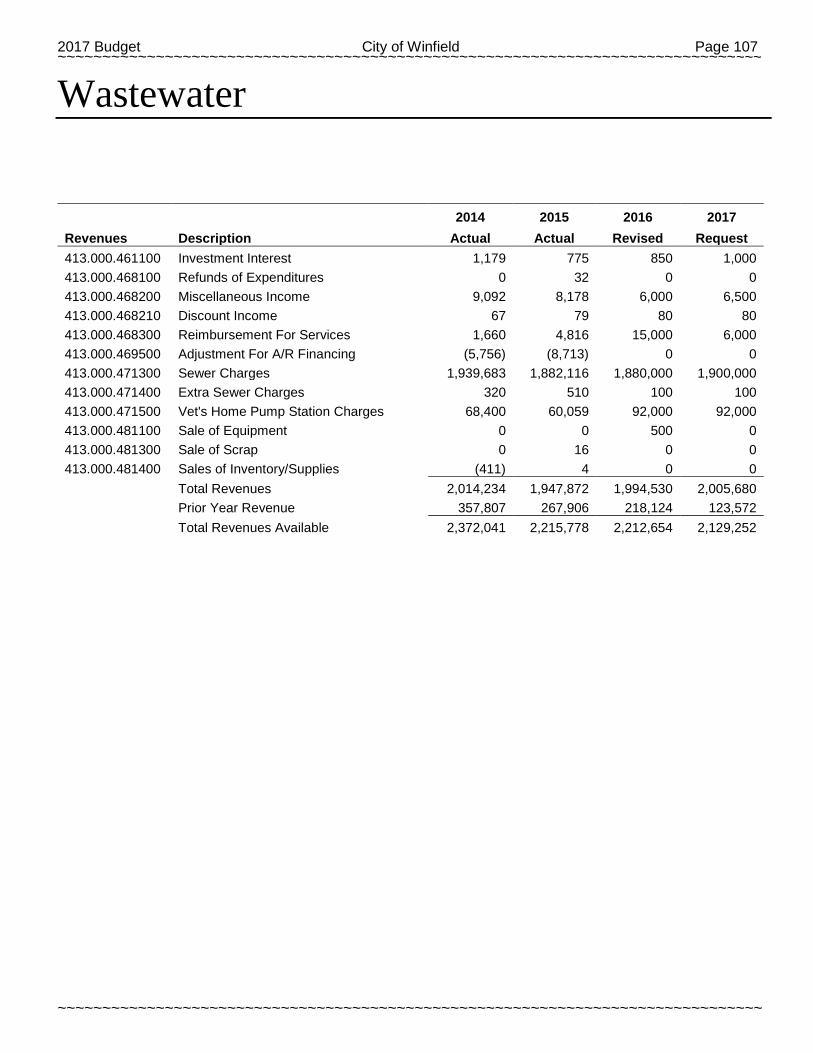
2017 Budget City of Winfield Page 107 ~~~~~~~~~~~~~~~~~~~~~~~~~~~~~~~~~~~~~~~~~~~~~~~~~~~~~~~~~~~~~~~~~~~~~~~~~~~~~~~
~~~~~~~~~~~~~~~~~~~~~~~~~~~~~~~~~~~~~~~~~~~~~~~~~~~~~~~~~~~~~~~~~~~~~~~~~~~~~~~
Wastewater
2014 2015 2016 2017
Revenues Description Actual Actual Revised Request 413.000.461100 Investment Interest 1,179 775 850 1,000 413.000.468100 Refunds of Expenditures 0 32 0 0 413.000.468200 Miscellaneous Income 9,092 8,178 6,000 6,500 413.000.468210 Discount Income 67 79 80 80 413.000.468300 Reimbursement For Services 1,660 4,816 15,000 6,000 413.000.469500 Adjustment For A/R Financing (5,756) (8,713) 0 0 413.000.471300 Sewer Charges 1,939,683 1,882,116 1,880,000 1,900,000 413.000.471400 Extra Sewer Charges 320 510 100 100 413.000.471500 Vet's Home Pump Station Charges 68,400 60,059 92,000 92,000 413.000.481100 Sale of Equipment 0 0 500 0 413.000.481300 Sale of Scrap 0 16 0 0 413.000.481400 Sales of Inventory/Supplies (411) 4 0 0
Total Revenues 2,014,234 1,947,872 1,994,530 2,005,680
Prior Year Revenue 357,807 267,906 218,124 123,572
Total Revenues Available 2,372,041 2,215,778 2,212,654 2,129,252
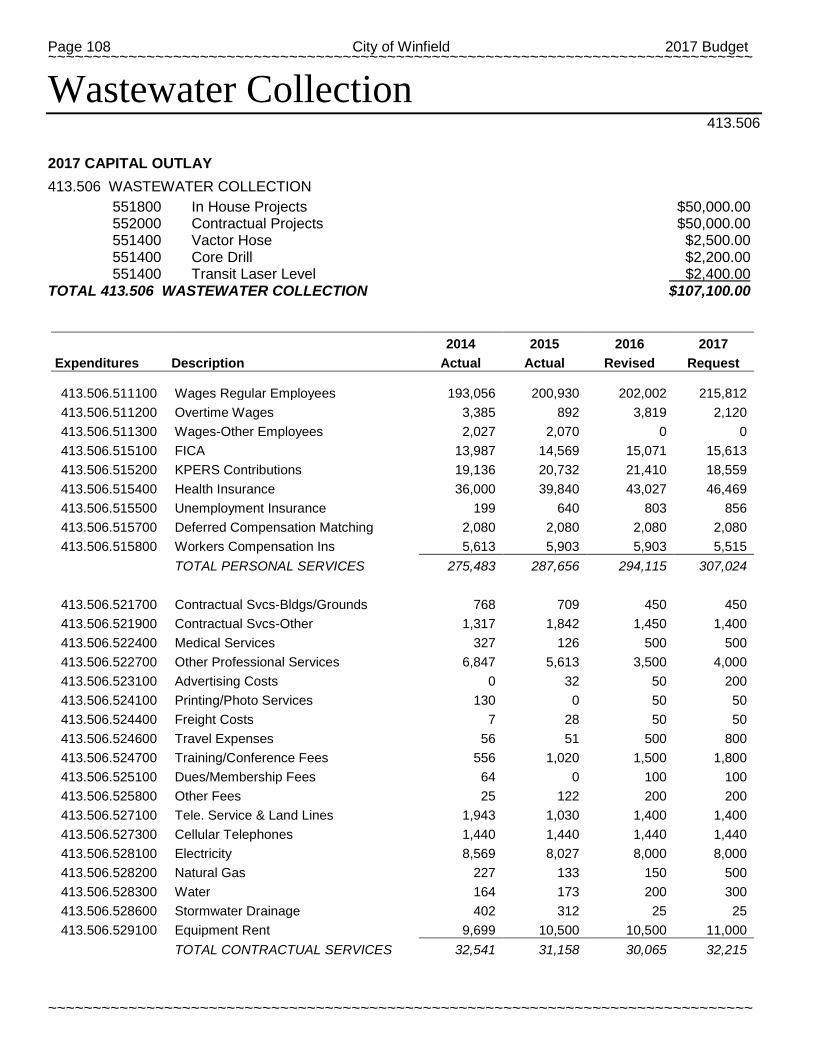
Page 108 City of Winfield 2017 Budget ~~~~~~~~~~~~~~~~~~~~~~~~~~~~~~~~~~~~~~~~~~~~~~~~~~~~~~~~~~~~~~~~~~~~~~~~~~~~~~~
~~~~~~~~~~~~~~~~~~~~~~~~~~~~~~~~~~~~~~~~~~~~~~~~~~~~~~~~~~~~~~~~~~~~~~~~~~~~~~~
Wastewater Collection 413.506
2017 CAPITAL OUTLAY
413.506 WASTEWATER COLLECTION 551800 In House Projects $50,000.00 552000 Contractual Projects $50,000.00 551400 Vactor Hose $2,500.00 551400 Core Drill $2,200.00 551400 Transit Laser Level $2,400.00
TOTAL 413.506 WASTEWATER COLLECTION $107,100.00
2014 2015 2016 2017
Expenditures Description Actual Actual Revised Request
413.506.511100 Wages Regular Employees 193,056 200,930 202,002 215,812 413.506.511200 Overtime Wages 3,385 892 3,819 2,120 413.506.511300 Wages-Other Employees 2,027 2,070 0 0 413.506.515100 FICA 13,987 14,569 15,071 15,613 413.506.515200 KPERS Contributions 19,136 20,732 21,410 18,559 413.506.515400 Health Insurance 36,000 39,840 43,027 46,469 413.506.515500 Unemployment Insurance 199 640 803 856 413.506.515700 Deferred Compensation Matching 2,080 2,080 2,080 2,080 413.506.515800 Workers Compensation Ins 5,613 5,903 5,903 5,515
TOTAL PERSONAL SERVICES 275,483 287,656 294,115 307,024
413.506.521700 Contractual Svcs-Bldgs/Grounds 768 709 450 450 413.506.521900 Contractual Svcs-Other 1,317 1,842 1,450 1,400 413.506.522400 Medical Services 327 126 500 500 413.506.522700 Other Professional Services 6,847 5,613 3,500 4,000 413.506.523100 Advertising Costs 0 32 50 200 413.506.524100 Printing/Photo Services 130 0 50 50 413.506.524400 Freight Costs 7 28 50 50 413.506.524600 Travel Expenses 56 51 500 800 413.506.524700 Training/Conference Fees 556 1,020 1,500 1,800 413.506.525100 Dues/Membership Fees 64 0 100 100 413.506.525800 Other Fees 25 122 200 200 413.506.527100 Tele. Service & Land Lines 1,943 1,030 1,400 1,400 413.506.527300 Cellular Telephones 1,440 1,440 1,440 1,440 413.506.528100 Electricity 8,569 8,027 8,000 8,000 413.506.528200 Natural Gas 227 133 150 500 413.506.528300 Water 164 173 200 300 413.506.528600 Stormwater Drainage 402 312 25 25 413.506.529100 Equipment Rent 9,699 10,500 10,500 11,000
TOTAL CONTRACTUAL SERVICES 32,541 31,158 30,065 32,215
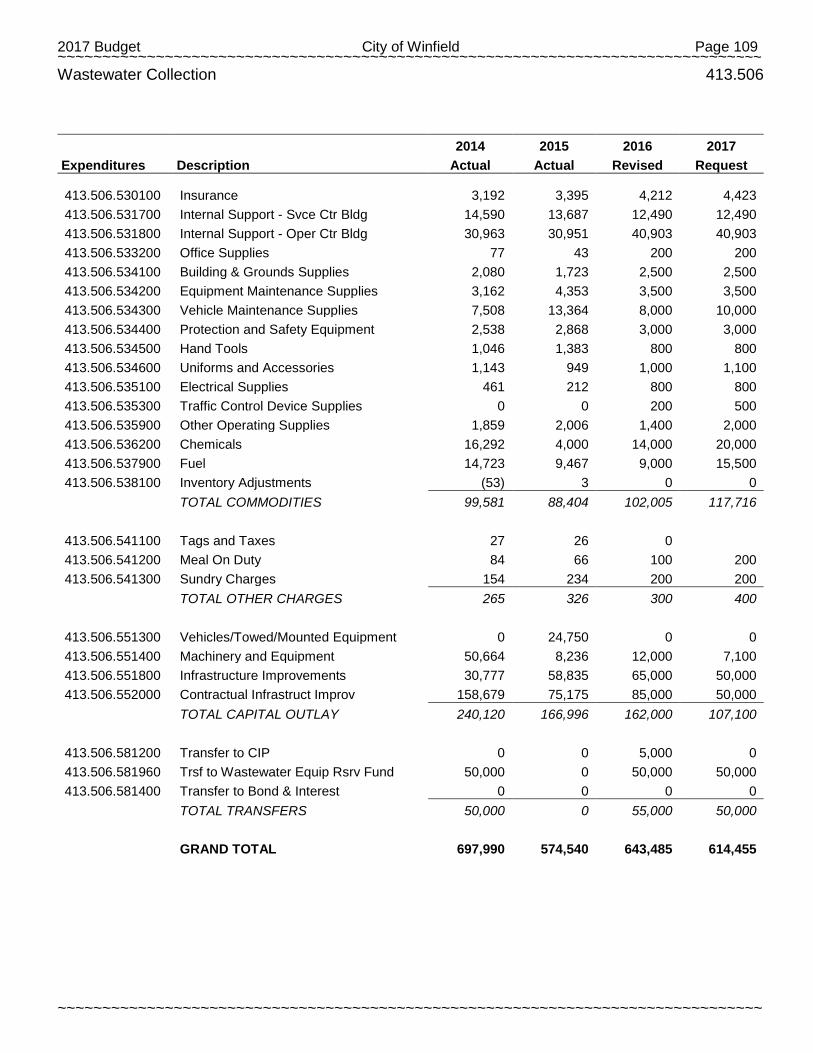
2017 Budget City of Winfield Page 109 ~~~~~~~~~~~~~~~~~~~~~~~~~~~~~~~~~~~~~~~~~~~~~~~~~~~~~~~~~~~~~~~~~~~~~~~~~~~~~~~
~~~~~~~~~~~~~~~~~~~~~~~~~~~~~~~~~~~~~~~~~~~~~~~~~~~~~~~~~~~~~~~~~~~~~~~~~~~~~~~
Wastewater Collection 413.506
2014 2015 2016 2017
Expenditures Description Actual Actual Revised Request
413.506.530100 Insurance 3,192 3,395 4,212 4,423 413.506.531700 Internal Support - Svce Ctr Bldg 14,590 13,687 12,490 12,490 413.506.531800 Internal Support - Oper Ctr Bldg 30,963 30,951 40,903 40,903 413.506.533200 Office Supplies 77 43 200 200 413.506.534100 Building & Grounds Supplies 2,080 1,723 2,500 2,500 413.506.534200 Equipment Maintenance Supplies 3,162 4,353 3,500 3,500 413.506.534300 Vehicle Maintenance Supplies 7,508 13,364 8,000 10,000 413.506.534400 Protection and Safety Equipment 2,538 2,868 3,000 3,000 413.506.534500 Hand Tools 1,046 1,383 800 800 413.506.534600 Uniforms and Accessories 1,143 949 1,000 1,100 413.506.535100 Electrical Supplies 461 212 800 800 413.506.535300 Traffic Control Device Supplies 0 0 200 500 413.506.535900 Other Operating Supplies 1,859 2,006 1,400 2,000 413.506.536200 Chemicals 16,292 4,000 14,000 20,000 413.506.537900 Fuel 14,723 9,467 9,000 15,500 413.506.538100 Inventory Adjustments (53) 3 0 0
TOTAL COMMODITIES 99,581 88,404 102,005 117,716
413.506.541100 Tags and Taxes 27 26 0 413.506.541200 Meal On Duty 84 66 100 200
413.506.541300 Sundry Charges 154 234 200 200
TOTAL OTHER CHARGES 265 326 300 400
413.506.551300 Vehicles/Towed/Mounted Equipment 0 24,750 0 0 413.506.551400 Machinery and Equipment 50,664 8,236 12,000 7,100 413.506.551800 Infrastructure Improvements 30,777 58,835 65,000 50,000 413.506.552000 Contractual Infrastruct Improv 158,679 75,175 85,000 50,000
TOTAL CAPITAL OUTLAY 240,120 166,996 162,000 107,100
413.506.581200 Transfer to CIP 0 0 5,000 0 413.506.581960 Trsf to Wastewater Equip Rsrv Fund 50,000 0 50,000 50,000 413.506.581400 Transfer to Bond & Interest 0 0 0 0
TOTAL TRANSFERS 50,000 0 55,000 50,000
GRAND TOTAL 697,990 574,540 643,485 614,455
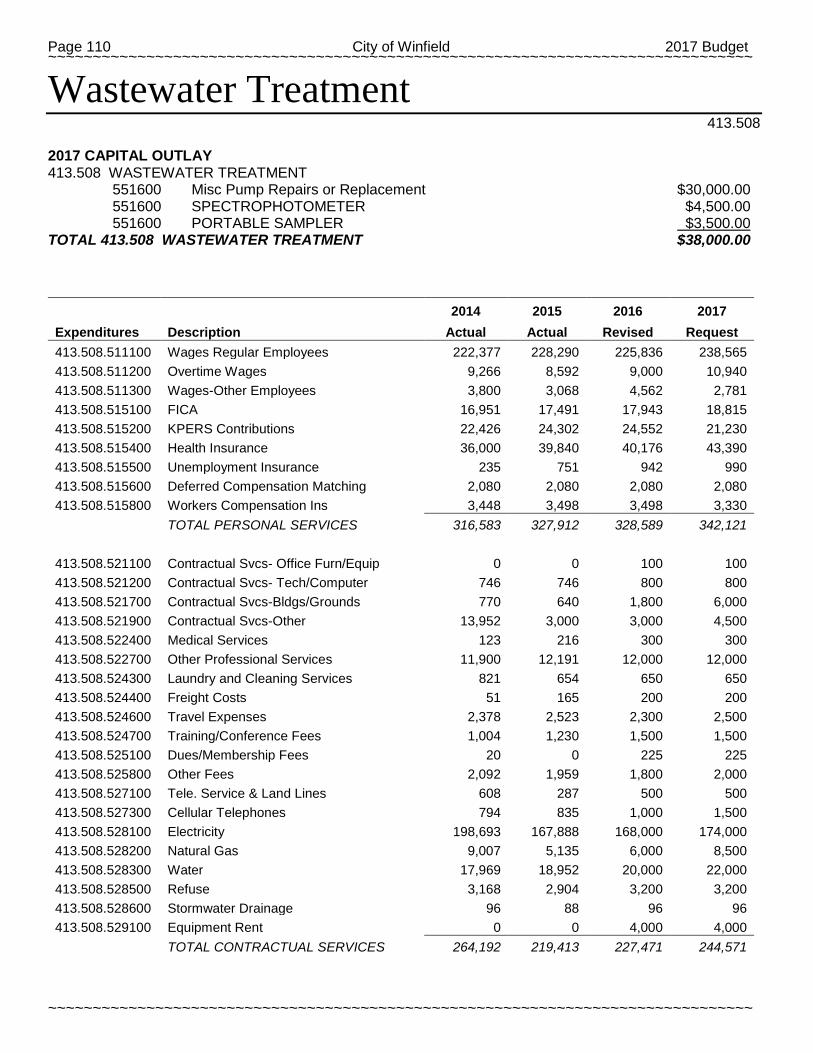
Page 110 City of Winfield 2017 Budget ~~~~~~~~~~~~~~~~~~~~~~~~~~~~~~~~~~~~~~~~~~~~~~~~~~~~~~~~~~~~~~~~~~~~~~~~~~~~~~~
~~~~~~~~~~~~~~~~~~~~~~~~~~~~~~~~~~~~~~~~~~~~~~~~~~~~~~~~~~~~~~~~~~~~~~~~~~~~~~~
Wastewater Treatment 413.508
2017 CAPITAL OUTLAY 413.508 WASTEWATER TREATMENT 551600 Misc Pump Repairs or Replacement $30,000.00 551600 SPECTROPHOTOMETER $4,500.00 551600 PORTABLE SAMPLER $3,500.00
TOTAL 413.508 WASTEWATER TREATMENT $38,000.00
2014 2015 2016 2017
Expenditures Description Actual Actual Revised Request 413.508.511100 Wages Regular Employees 222,377 228,290 225,836 238,565 413.508.511200 Overtime Wages 9,266 8,592 9,000 10,940 413.508.511300 Wages-Other Employees 3,800 3,068 4,562 2,781 413.508.515100 FICA 16,951 17,491 17,943 18,815 413.508.515200 KPERS Contributions 22,426 24,302 24,552 21,230 413.508.515400 Health Insurance 36,000 39,840 40,176 43,390 413.508.515500 Unemployment Insurance 235 751 942 990 413.508.515600 Deferred Compensation Matching 2,080 2,080 2,080 2,080 413.508.515800 Workers Compensation Ins 3,448 3,498 3,498 3,330
TOTAL PERSONAL SERVICES 316,583 327,912 328,589 342,121
413.508.521100 Contractual Svcs- Office Furn/Equip 0 0 100 100 413.508.521200 Contractual Svcs- Tech/Computer 746 746 800 800 413.508.521700 Contractual Svcs-Bldgs/Grounds 770 640 1,800 6,000 413.508.521900 Contractual Svcs-Other 13,952 3,000 3,000 4,500 413.508.522400 Medical Services 123 216 300 300 413.508.522700 Other Professional Services 11,900 12,191 12,000 12,000 413.508.524300 Laundry and Cleaning Services 821 654 650 650 413.508.524400 Freight Costs 51 165 200 200 413.508.524600 Travel Expenses 2,378 2,523 2,300 2,500 413.508.524700 Training/Conference Fees 1,004 1,230 1,500 1,500 413.508.525100 Dues/Membership Fees 20 0 225 225 413.508.525800 Other Fees 2,092 1,959 1,800 2,000 413.508.527100 Tele. Service & Land Lines 608 287 500 500 413.508.527300 Cellular Telephones 794 835 1,000 1,500 413.508.528100 Electricity 198,693 167,888 168,000 174,000 413.508.528200 Natural Gas 9,007 5,135 6,000 8,500 413.508.528300 Water 17,969 18,952 20,000 22,000 413.508.528500 Refuse 3,168 2,904 3,200 3,200 413.508.528600 Stormwater Drainage 96 88 96 96 413.508.529100 Equipment Rent 0 0 4,000 4,000
TOTAL CONTRACTUAL SERVICES 264,192 219,413 227,471 244,571
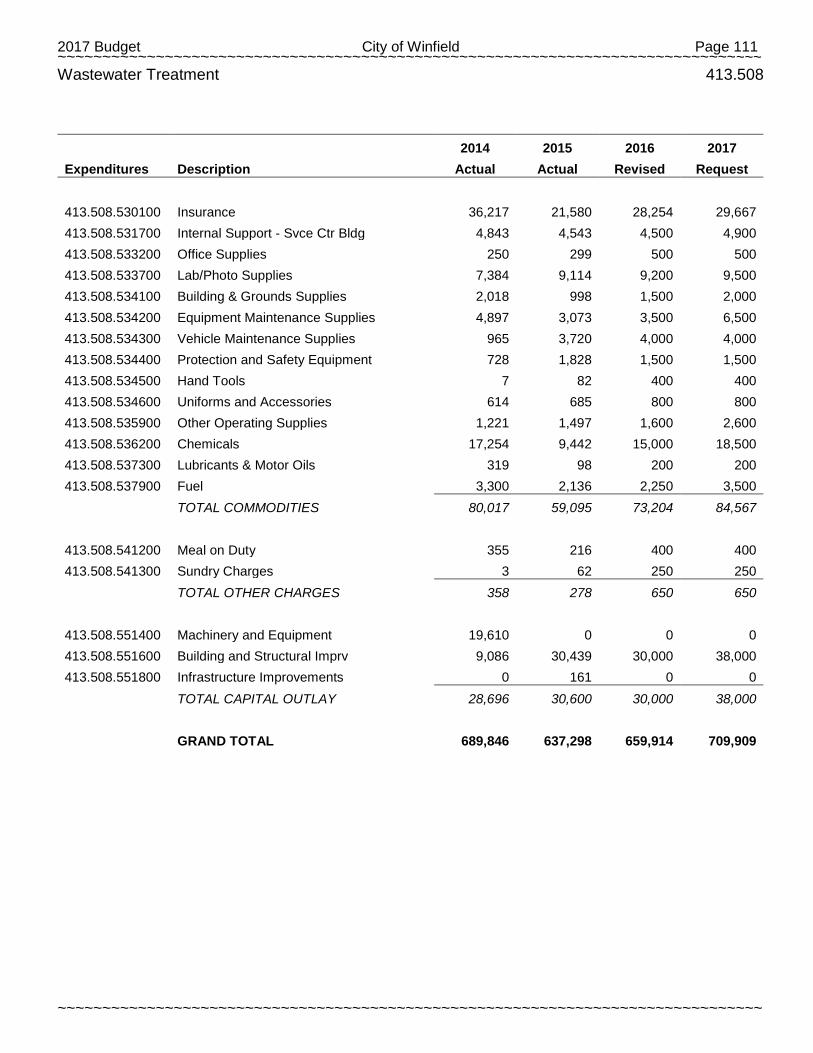
2017 Budget City of Winfield Page 111 ~~~~~~~~~~~~~~~~~~~~~~~~~~~~~~~~~~~~~~~~~~~~~~~~~~~~~~~~~~~~~~~~~~~~~~~~~~~~~~~
~~~~~~~~~~~~~~~~~~~~~~~~~~~~~~~~~~~~~~~~~~~~~~~~~~~~~~~~~~~~~~~~~~~~~~~~~~~~~~~
Wastewater Treatment 413.508
2014 2015 2016 2017
Expenditures Description Actual Actual Revised Request
413.508.530100 Insurance 36,217 21,580 28,254 29,667 413.508.531700 Internal Support - Svce Ctr Bldg 4,843 4,543 4,500 4,900 413.508.533200 Office Supplies 250 299 500 500 413.508.533700 Lab/Photo Supplies 7,384 9,114 9,200 9,500 413.508.534100 Building & Grounds Supplies 2,018 998 1,500 2,000 413.508.534200 Equipment Maintenance Supplies 4,897 3,073 3,500 6,500 413.508.534300 Vehicle Maintenance Supplies 965 3,720 4,000 4,000 413.508.534400 Protection and Safety Equipment 728 1,828 1,500 1,500 413.508.534500 Hand Tools 7 82 400 400 413.508.534600 Uniforms and Accessories 614 685 800 800 413.508.535900 Other Operating Supplies 1,221 1,497 1,600 2,600 413.508.536200 Chemicals 17,254 9,442 15,000 18,500 413.508.537300 Lubricants & Motor Oils 319 98 200 200 413.508.537900 Fuel 3,300 2,136 2,250 3,500
TOTAL COMMODITIES 80,017 59,095 73,204 84,567
413.508.541200 Meal on Duty 355 216 400 400 413.508.541300 Sundry Charges 3 62 250 250
TOTAL OTHER CHARGES 358 278 650 650
413.508.551400 Machinery and Equipment 19,610 0 0 0 413.508.551600 Building and Structural Imprv 9,086 30,439 30,000 38,000 413.508.551800 Infrastructure Improvements 0 161 0 0
TOTAL CAPITAL OUTLAY 28,696 30,600 30,000 38,000
GRAND TOTAL 689,846 637,298 659,914 709,909
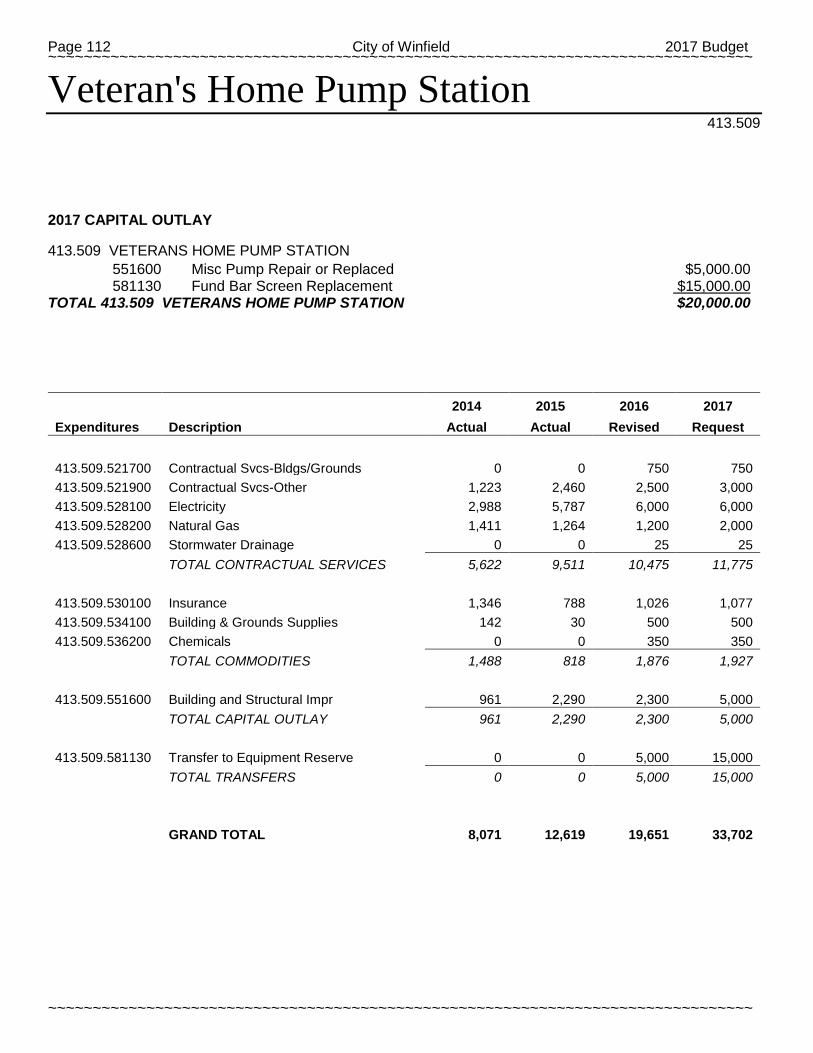
Page 112 City of Winfield 2017 Budget ~~~~~~~~~~~~~~~~~~~~~~~~~~~~~~~~~~~~~~~~~~~~~~~~~~~~~~~~~~~~~~~~~~~~~~~~~~~~~~~
~~~~~~~~~~~~~~~~~~~~~~~~~~~~~~~~~~~~~~~~~~~~~~~~~~~~~~~~~~~~~~~~~~~~~~~~~~~~~~~
Veteran's Home Pump Station 413.509
2017 CAPITAL OUTLAY
413.509 VETERANS HOME PUMP STATION 551600 Misc Pump Repair or Replaced $5,000.00 581130 Fund Bar Screen Replacement $15,000.00
TOTAL 413.509 VETERANS HOME PUMP STATION $20,000.00
2014 2015 2016 2017
Expenditures Description Actual Actual Revised Request
413.509.521700 Contractual Svcs-Bldgs/Grounds 0 0 750 750 413.509.521900 Contractual Svcs-Other 1,223 2,460 2,500 3,000 413.509.528100 Electricity 2,988 5,787 6,000 6,000 413.509.528200 Natural Gas 1,411 1,264 1,200 2,000 413.509.528600 Stormwater Drainage 0 0 25 25
TOTAL CONTRACTUAL SERVICES 5,622 9,511 10,475 11,775
413.509.530100 Insurance 1,346 788 1,026 1,077 413.509.534100 Building & Grounds Supplies 142 30 500 500 413.509.536200 Chemicals 0 0 350 350
TOTAL COMMODITIES 1,488 818 1,876 1,927
413.509.551600 Building and Structural Impr 961 2,290 2,300 5,000
TOTAL CAPITAL OUTLAY 961 2,290 2,300 5,000
413.509.581130 Transfer to Equipment Reserve 0 0 5,000 15,000
TOTAL TRANSFERS 0 0 5,000 15,000
GRAND TOTAL 8,071 12,619 19,651 33,702
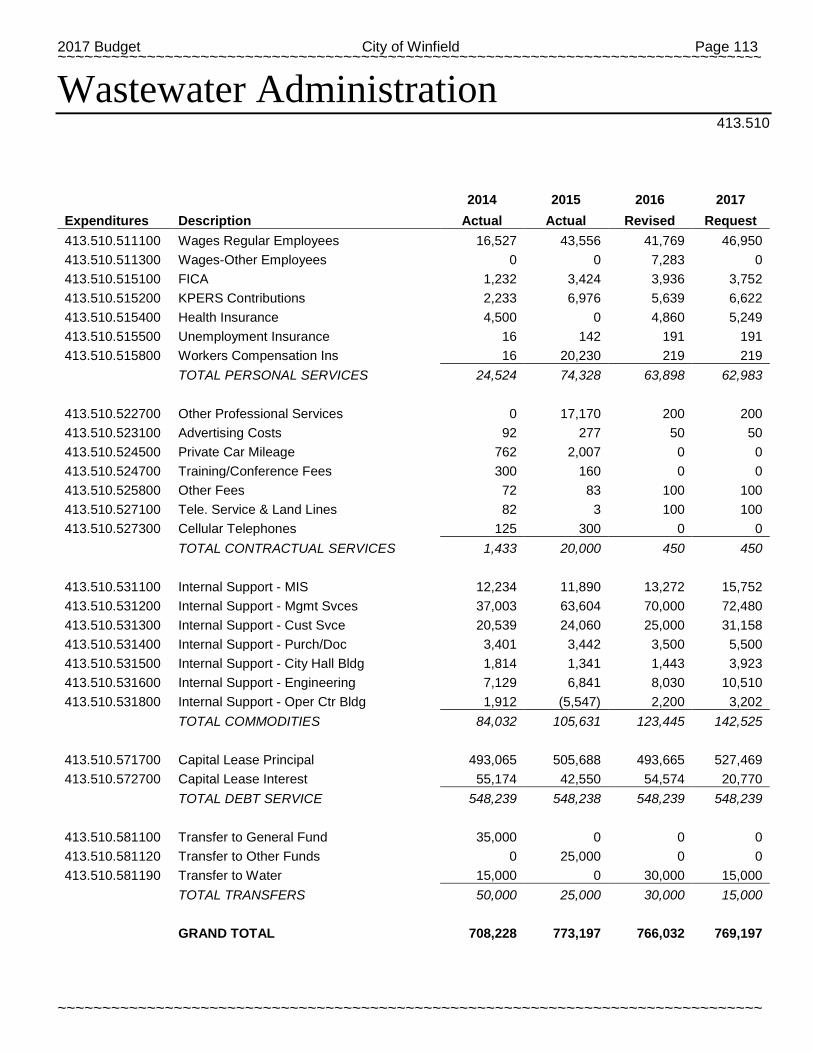
2017 Budget City of Winfield Page 113 ~~~~~~~~~~~~~~~~~~~~~~~~~~~~~~~~~~~~~~~~~~~~~~~~~~~~~~~~~~~~~~~~~~~~~~~~~~~~~~~
~~~~~~~~~~~~~~~~~~~~~~~~~~~~~~~~~~~~~~~~~~~~~~~~~~~~~~~~~~~~~~~~~~~~~~~~~~~~~~~
Wastewater Administration 413.510
2014 2015 2016 2017
Expenditures Description Actual Actual Revised Request 413.510.511100 Wages Regular Employees 16,527 43,556 41,769 46,950 413.510.511300 Wages-Other Employees 0 0 7,283 0 413.510.515100 FICA 1,232 3,424 3,936 3,752 413.510.515200 KPERS Contributions 2,233 6,976 5,639 6,622 413.510.515400 Health Insurance 4,500 0 4,860 5,249 413.510.515500 Unemployment Insurance 16 142 191 191 413.510.515800 Workers Compensation Ins 16 20,230 219 219
TOTAL PERSONAL SERVICES 24,524 74,328 63,898 62,983
413.510.522700 Other Professional Services 0 17,170 200 200 413.510.523100 Advertising Costs 92 277 50 50 413.510.524500 Private Car Mileage 762 2,007 0 0 413.510.524700 Training/Conference Fees 300 160 0 0 413.510.525800 Other Fees 72 83 100 100 413.510.527100 Tele. Service & Land Lines 82 3 100 100 413.510.527300 Cellular Telephones 125 300 0 0
TOTAL CONTRACTUAL SERVICES 1,433 20,000 450 450
413.510.531100 Internal Support - MIS 12,234 11,890 13,272 15,752 413.510.531200 Internal Support - Mgmt Svces 37,003 63,604 70,000 72,480 413.510.531300 Internal Support - Cust Svce 20,539 24,060 25,000 31,158 413.510.531400 Internal Support - Purch/Doc 3,401 3,442 3,500 5,500 413.510.531500 Internal Support - City Hall Bldg 1,814 1,341 1,443 3,923 413.510.531600 Internal Support - Engineering 7,129 6,841 8,030 10,510 413.510.531800 Internal Support - Oper Ctr Bldg 1,912 (5,547) 2,200 3,202
TOTAL COMMODITIES 84,032 105,631 123,445 142,525
413.510.571700 Capital Lease Principal 493,065 505,688 493,665 527,469 413.510.572700 Capital Lease Interest 55,174 42,550 54,574 20,770
TOTAL DEBT SERVICE 548,239 548,238 548,239 548,239
413.510.581100 Transfer to General Fund 35,000 0 0 0 413.510.581120 Transfer to Other Funds 0 25,000 0 0 413.510.581190 Transfer to Water 15,000 0 30,000 15,000
TOTAL TRANSFERS 50,000 25,000 30,000 15,000
GRAND TOTAL 708,228 773,197 766,032 769,197
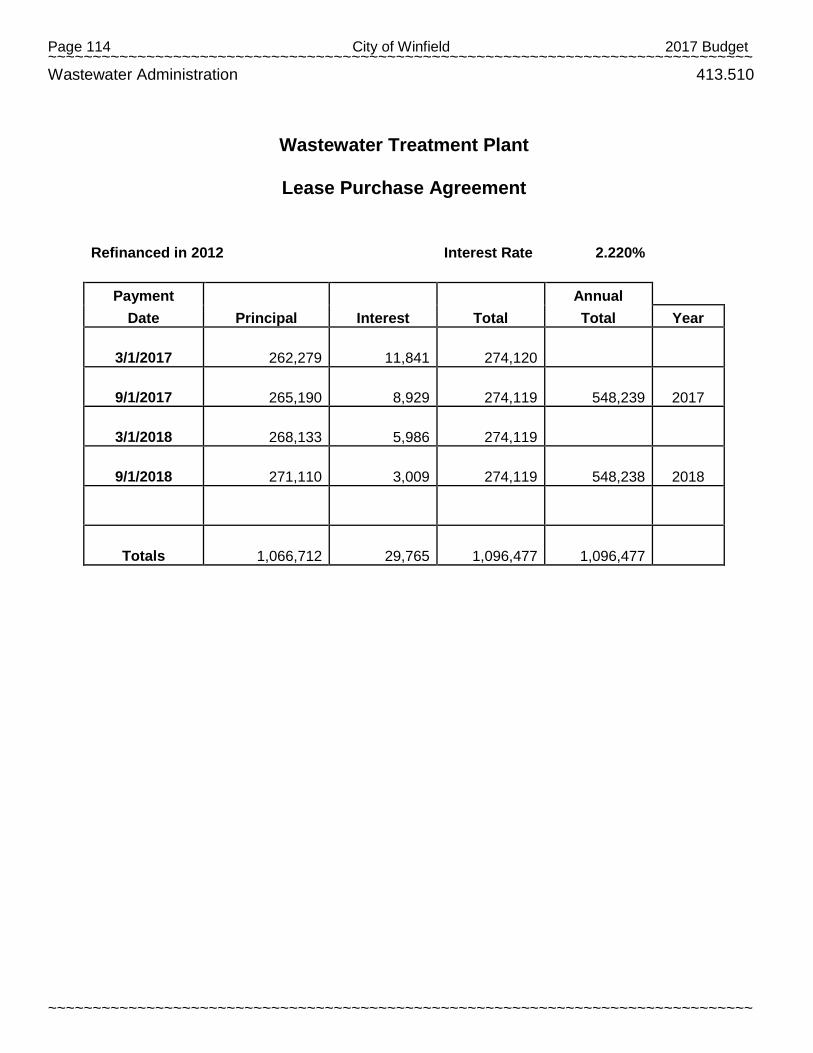
Page 114 City of Winfield 2017 Budget ~~~~~~~~~~~~~~~~~~~~~~~~~~~~~~~~~~~~~~~~~~~~~~~~~~~~~~~~~~~~~~~~~~~~~~~~~~~~~~~
~~~~~~~~~~~~~~~~~~~~~~~~~~~~~~~~~~~~~~~~~~~~~~~~~~~~~~~~~~~~~~~~~~~~~~~~~~~~~~~
Wastewater Administration 413.510
Wastewater Treatment Plant
Lease Purchase Agreement
Refinanced in 2012 Interest Rate 2.220%
Payment Annual Date Principal Interest Total Total Year
3/1/2017 262,279 11,841 274,120
9/1/2017 265,190 8,929 274,119 548,239 2017
3/1/2018 268,133 5,986 274,119
9/1/2018 271,110 3,009 274,119 548,238 2018
Totals 1,066,712 29,765 1,096,477 1,096,477
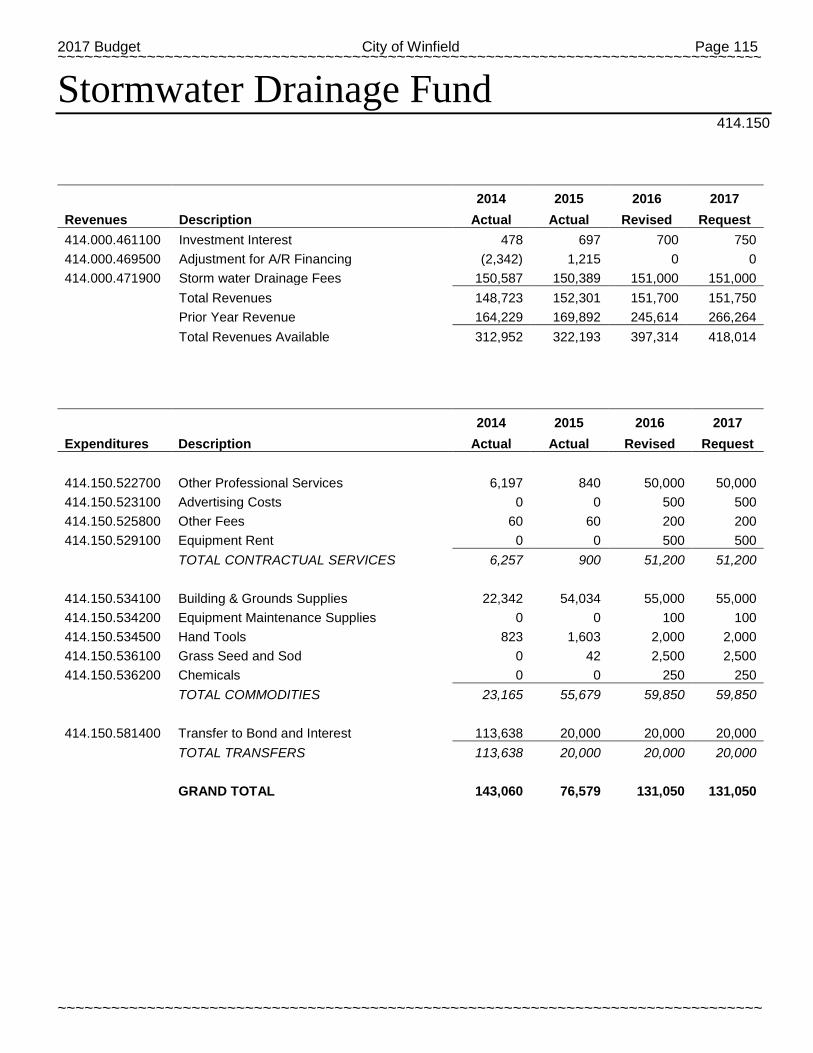
2017 Budget City of Winfield Page 115 ~~~~~~~~~~~~~~~~~~~~~~~~~~~~~~~~~~~~~~~~~~~~~~~~~~~~~~~~~~~~~~~~~~~~~~~~~~~~~~~
~~~~~~~~~~~~~~~~~~~~~~~~~~~~~~~~~~~~~~~~~~~~~~~~~~~~~~~~~~~~~~~~~~~~~~~~~~~~~~~
Stormwater Drainage Fund
414.150
2014 2015 2016 2017
Revenues Description Actual Actual Revised Request 414.000.461100 Investment Interest 478 697 700 750 414.000.469500 Adjustment for A/R Financing (2,342) 1,215 0 0 414.000.471900 Storm water Drainage Fees 150,587 150,389 151,000 151,000
Total Revenues 148,723 152,301 151,700 151,750
Prior Year Revenue 164,229 169,892 245,614 266,264
Total Revenues Available 312,952 322,193 397,314 418,014
2014 2015 2016 2017
Expenditures Description Actual Actual Revised Request
414.150.522700 Other Professional Services 6,197 840 50,000 50,000 414.150.523100 Advertising Costs 0 0 500 500 414.150.525800 Other Fees 60 60 200 200 414.150.529100 Equipment Rent 0 0 500 500
TOTAL CONTRACTUAL SERVICES 6,257 900 51,200 51,200
414.150.534100 Building & Grounds Supplies 22,342 54,034 55,000 55,000 414.150.534200 Equipment Maintenance Supplies 0 0 100 100 414.150.534500 Hand Tools 823 1,603 2,000 2,000 414.150.536100 Grass Seed and Sod 0 42 2,500 2,500 414.150.536200 Chemicals 0 0 250 250
TOTAL COMMODITIES 23,165 55,679 59,850 59,850
414.150.581400 Transfer to Bond and Interest 113,638 20,000 20,000 20,000
TOTAL TRANSFERS 113,638 20,000 20,000 20,000
GRAND TOTAL 143,060 76,579 131,050 131,050
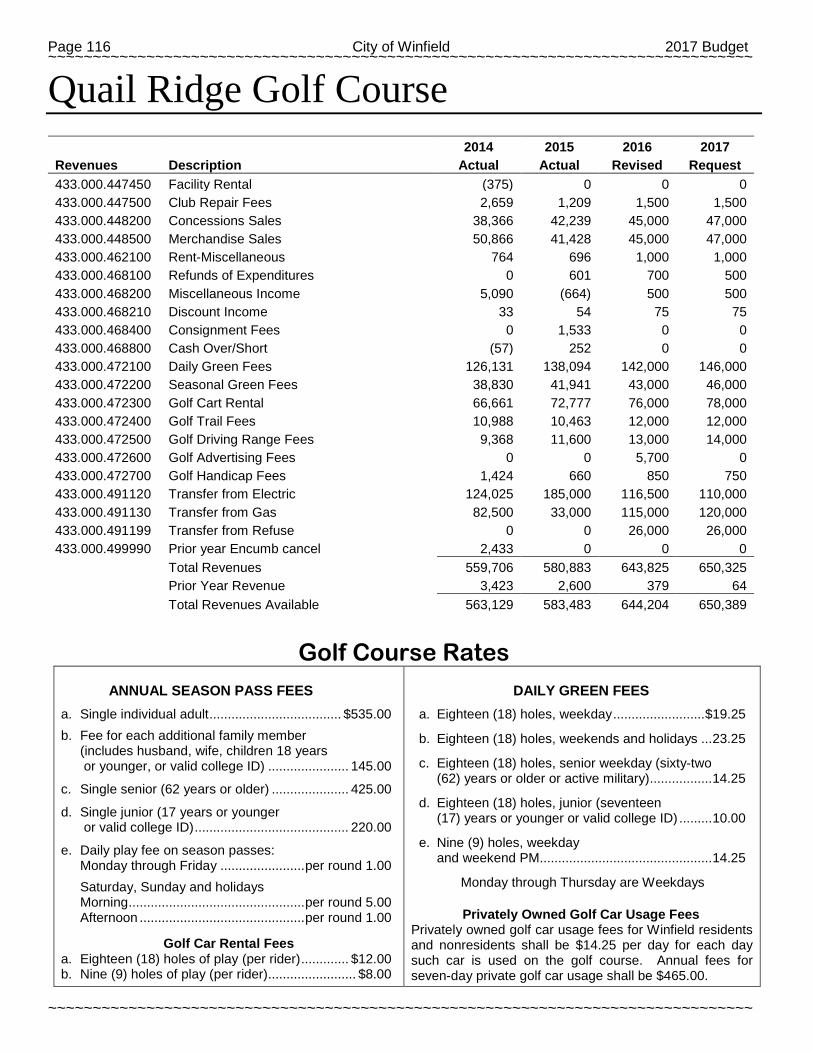
Page 116 City of Winfield 2017 Budget ~~~~~~~~~~~~~~~~~~~~~~~~~~~~~~~~~~~~~~~~~~~~~~~~~~~~~~~~~~~~~~~~~~~~~~~~~~~~~~~
~~~~~~~~~~~~~~~~~~~~~~~~~~~~~~~~~~~~~~~~~~~~~~~~~~~~~~~~~~~~~~~~~~~~~~~~~~~~~~~
Quail Ridge Golf Course
2014 2015 2016 2017
Revenues Description Actual Actual Revised Request 433.000.447450 Facility Rental (375) 0 0 0 433.000.447500 Club Repair Fees 2,659 1,209 1,500 1,500 433.000.448200 Concessions Sales 38,366 42,239 45,000 47,000 433.000.448500 Merchandise Sales 50,866 41,428 45,000 47,000 433.000.462100 Rent-Miscellaneous 764 696 1,000 1,000 433.000.468100 Refunds of Expenditures 0 601 700 500 433.000.468200 Miscellaneous Income 5,090 (664) 500 500 433.000.468210 Discount Income 33 54 75 75 433.000.468400 Consignment Fees 0 1,533 0 0 433.000.468800 Cash Over/Short (57) 252 0 0 433.000.472100 Daily Green Fees 126,131 138,094 142,000 146,000 433.000.472200 Seasonal Green Fees 38,830 41,941 43,000 46,000 433.000.472300 Golf Cart Rental 66,661 72,777 76,000 78,000 433.000.472400 Golf Trail Fees 10,988 10,463 12,000 12,000 433.000.472500 Golf Driving Range Fees 9,368 11,600 13,000 14,000 433.000.472600 Golf Advertising Fees 0 0 5,700 0 433.000.472700 Golf Handicap Fees 1,424 660 850 750 433.000.491120 Transfer from Electric 124,025 185,000 116,500 110,000 433.000.491130 Transfer from Gas 82,500 33,000 115,000 120,000 433.000.491199 Transfer from Refuse 0 0 26,000 26,000 433.000.499990 Prior year Encumb cancel 2,433 0 0 0
Total Revenues 559,706 580,883 643,825 650,325
Prior Year Revenue 3,423 2,600 379 64
Total Revenues Available 563,129 583,483 644,204 650,389
Golf Course Rates ANNUAL SEASON PASS FEES
a. Single individual adult .................................... $535.00
b. Fee for each additional family member (includes husband, wife, children 18 years or younger, or valid college ID) ...................... 145.00
c. Single senior (62 years or older) ..................... 425.00
d. Single junior (17 years or younger or valid college ID) .......................................... 220.00
e. Daily play fee on season passes: Monday through Friday ....................... per round 1.00
Saturday, Sunday and holidays Morning ................................................ per round 5.00 Afternoon ............................................. per round 1.00
Golf Car Rental Fees a. Eighteen (18) holes of play (per rider) ............. $12.00 b. Nine (9) holes of play (per rider)........................ $8.00
DAILY GREEN FEES
a. Eighteen (18) holes, weekday ......................... $19.25
b. Eighteen (18) holes, weekends and holidays ... 23.25
c. Eighteen (18) holes, senior weekday (sixty-two (62) years or older or active military)................. 14.25
d. Eighteen (18) holes, junior (seventeen (17) years or younger or valid college ID) ......... 10.00
e. Nine (9) holes, weekday and weekend PM............................................... 14.25
Monday through Thursday are Weekdays
Privately Owned Golf Car Usage Fees Privately owned golf car usage fees for Winfield residents and nonresidents shall be $14.25 per day for each day such car is used on the golf course. Annual fees for seven-day private golf car usage shall be $465.00.
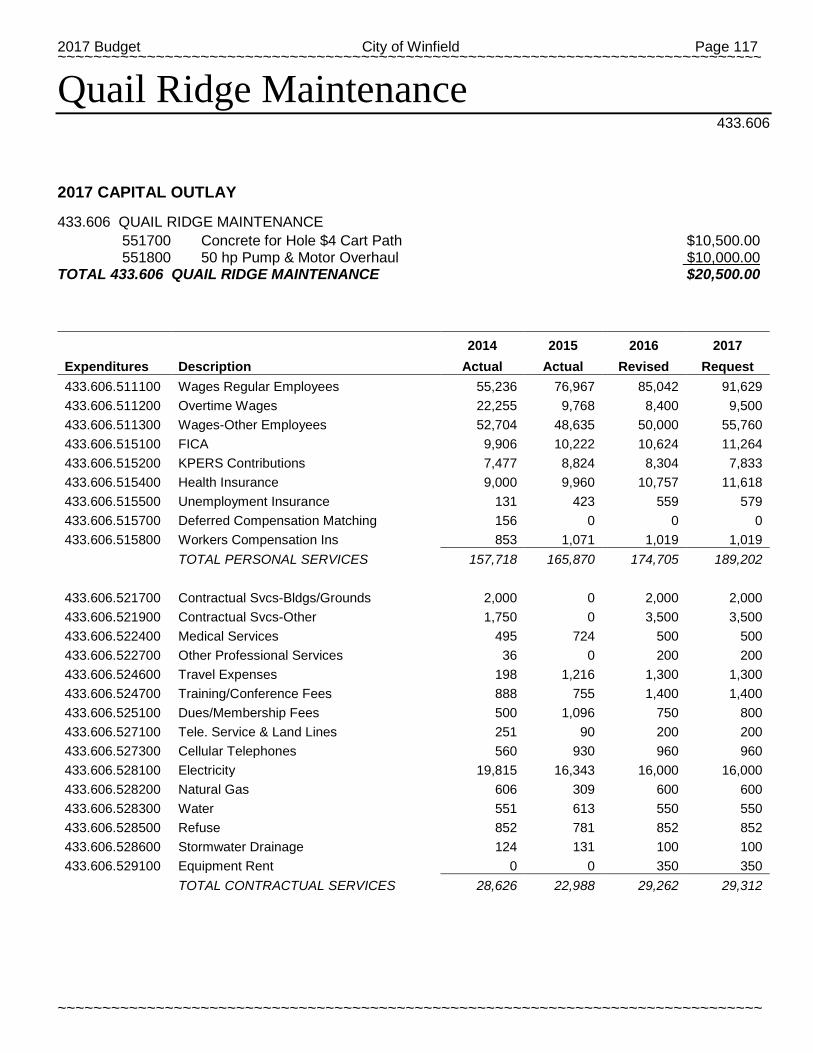
2017 Budget City of Winfield Page 117 ~~~~~~~~~~~~~~~~~~~~~~~~~~~~~~~~~~~~~~~~~~~~~~~~~~~~~~~~~~~~~~~~~~~~~~~~~~~~~~~
~~~~~~~~~~~~~~~~~~~~~~~~~~~~~~~~~~~~~~~~~~~~~~~~~~~~~~~~~~~~~~~~~~~~~~~~~~~~~~~
Quail Ridge Maintenance 433.606
2017 CAPITAL OUTLAY 433.606 QUAIL RIDGE MAINTENANCE 551700 Concrete for Hole $4 Cart Path $10,500.00 551800 50 hp Pump & Motor Overhaul $10,000.00
TOTAL 433.606 QUAIL RIDGE MAINTENANCE $20,500.00
2014 2015 2016 2017
Expenditures Description Actual Actual Revised Request 433.606.511100 Wages Regular Employees 55,236 76,967 85,042 91,629 433.606.511200 Overtime Wages 22,255 9,768 8,400 9,500 433.606.511300 Wages-Other Employees 52,704 48,635 50,000 55,760 433.606.515100 FICA 9,906 10,222 10,624 11,264 433.606.515200 KPERS Contributions 7,477 8,824 8,304 7,833 433.606.515400 Health Insurance 9,000 9,960 10,757 11,618 433.606.515500 Unemployment Insurance 131 423 559 579 433.606.515700 Deferred Compensation Matching 156 0 0 0 433.606.515800 Workers Compensation Ins 853 1,071 1,019 1,019
TOTAL PERSONAL SERVICES 157,718 165,870 174,705 189,202
433.606.521700 Contractual Svcs-Bldgs/Grounds 2,000 0 2,000 2,000 433.606.521900 Contractual Svcs-Other 1,750 0 3,500 3,500 433.606.522400 Medical Services 495 724 500 500 433.606.522700 Other Professional Services 36 0 200 200 433.606.524600 Travel Expenses 198 1,216 1,300 1,300 433.606.524700 Training/Conference Fees 888 755 1,400 1,400 433.606.525100 Dues/Membership Fees 500 1,096 750 800 433.606.527100 Tele. Service & Land Lines 251 90 200 200 433.606.527300 Cellular Telephones 560 930 960 960 433.606.528100 Electricity 19,815 16,343 16,000 16,000 433.606.528200 Natural Gas 606 309 600 600 433.606.528300 Water 551 613 550 550 433.606.528500 Refuse 852 781 852 852 433.606.528600 Stormwater Drainage 124 131 100 100 433.606.529100 Equipment Rent 0 0 350 350
TOTAL CONTRACTUAL SERVICES 28,626 22,988 29,262 29,312
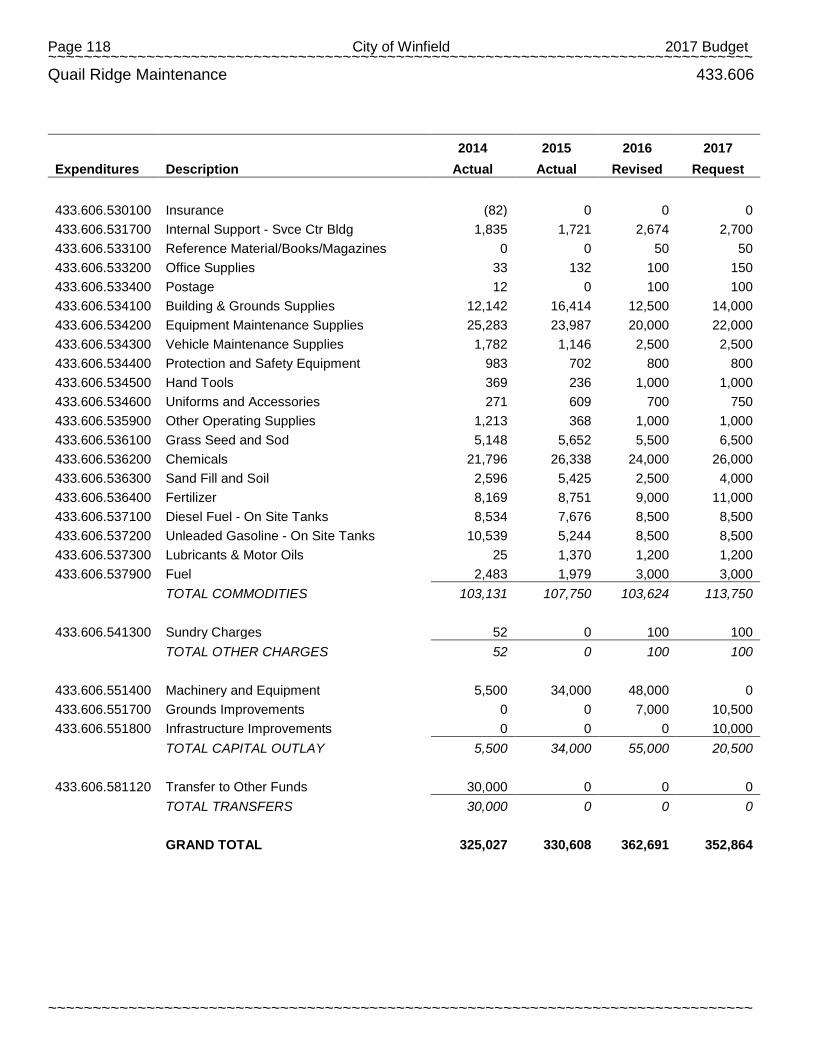
Page 118 City of Winfield 2017 Budget ~~~~~~~~~~~~~~~~~~~~~~~~~~~~~~~~~~~~~~~~~~~~~~~~~~~~~~~~~~~~~~~~~~~~~~~~~~~~~~~
~~~~~~~~~~~~~~~~~~~~~~~~~~~~~~~~~~~~~~~~~~~~~~~~~~~~~~~~~~~~~~~~~~~~~~~~~~~~~~~
Quail Ridge Maintenance 433.606
2014 2015 2016 2017
Expenditures Description Actual Actual Revised Request
433.606.530100 Insurance (82) 0 0 0 433.606.531700 Internal Support - Svce Ctr Bldg 1,835 1,721 2,674 2,700 433.606.533100 Reference Material/Books/Magazines 0 0 50 50 433.606.533200 Office Supplies 33 132 100 150 433.606.533400 Postage 12 0 100 100 433.606.534100 Building & Grounds Supplies 12,142 16,414 12,500 14,000 433.606.534200 Equipment Maintenance Supplies 25,283 23,987 20,000 22,000 433.606.534300 Vehicle Maintenance Supplies 1,782 1,146 2,500 2,500 433.606.534400 Protection and Safety Equipment 983 702 800 800 433.606.534500 Hand Tools 369 236 1,000 1,000 433.606.534600 Uniforms and Accessories 271 609 700 750 433.606.535900 Other Operating Supplies 1,213 368 1,000 1,000 433.606.536100 Grass Seed and Sod 5,148 5,652 5,500 6,500 433.606.536200 Chemicals 21,796 26,338 24,000 26,000 433.606.536300 Sand Fill and Soil 2,596 5,425 2,500 4,000 433.606.536400 Fertilizer 8,169 8,751 9,000 11,000 433.606.537100 Diesel Fuel - On Site Tanks 8,534 7,676 8,500 8,500 433.606.537200 Unleaded Gasoline - On Site Tanks 10,539 5,244 8,500 8,500 433.606.537300 Lubricants & Motor Oils 25 1,370 1,200 1,200 433.606.537900 Fuel 2,483 1,979 3,000 3,000
TOTAL COMMODITIES 103,131 107,750 103,624 113,750
433.606.541300 Sundry Charges 52 0 100 100
TOTAL OTHER CHARGES 52 0 100 100
433.606.551400 Machinery and Equipment 5,500 34,000 48,000 0 433.606.551700 Grounds Improvements 0 0 7,000 10,500 433.606.551800 Infrastructure Improvements 0 0 0 10,000
TOTAL CAPITAL OUTLAY 5,500 34,000 55,000 20,500
433.606.581120 Transfer to Other Funds 30,000 0 0 0
TOTAL TRANSFERS 30,000 0 0 0
GRAND TOTAL 325,027 330,608 362,691 352,864

2017 Budget City of Winfield Page 119 ~~~~~~~~~~~~~~~~~~~~~~~~~~~~~~~~~~~~~~~~~~~~~~~~~~~~~~~~~~~~~~~~~~~~~~~~~~~~~~~
~~~~~~~~~~~~~~~~~~~~~~~~~~~~~~~~~~~~~~~~~~~~~~~~~~~~~~~~~~~~~~~~~~~~~~~~~~~~~~~
Quail Ridge Clubhouse 433.608
2017 CAPITAL OUTLAY
433.608 QUAIL RIDGE CLUBHOUSE 551400 Partial Golf Cart replacement $12,000.00
TOTAL 433.608 QUAIL RIDGE CLUBHOUSE $12,000.00
2014 2015 2016 2017
Expenditures Description Actual Actual Revised Request 433.608.511100 Wages Regular Employees 65,983 48,670 69,043 68,990 433.608.511200 Overtime Wages 22 0 0 0 433.608.511300 Wages-Other Employees 26,935 46,540 27,500 31,145 433.608.515100 FICA 6,843 7,114 7,853 7,624 433.608.515200 KPERS Contributions 6,256 6,830 7,104 3,997 433.608.515400 Health Insurance 9,000 9,960 10,757 11,618 433.608.515500 Unemployment Insurance 91 297 377 391 433.608.515800 Workers Compensation Ins 1,027 787 749 749
TOTAL PERSONAL SERVICES 116,158 120,198 123,383 124,514
433.608.521100 Contrl. Svcs- Office Furn/Eq 0 138 900 900 433.608.521700 Contractual Svcs-Bldgs/Grounds 297 154 1,850 1,900 433.608.521900 Contractual Svcs-Other 16,131 17,166 17,000 19,000 433.608.522400 Medical Services 315 135 300 300 433.608.522700 Other Professional Services 3,555 3,651 4,200 4,200 433.608.522810 Credit Card Fees 5,589 6,059 6,500 6,500 433.608.523100 Advertising Costs 4,345 2,503 7,000 7,000 433.608.524100 Printing/Photo Services 0 0 1,800 1,800 433.608.524600 Travel Expenses 189 58 750 750 433.608.524700 Training/Conference Fees 358 680 700 700 433.608.525100 Dues/Membership Fees 65 20 900 900 433.608.527100 Tele. Service & Land Lines 1,250 2,841 700 700 433.608.527600 Cable TV services 408 0 1,200 1,200 433.608.528100 Electricity 9,086 8,428 8,800 8,800 433.608.528200 Natural Gas 1,233 750 1,000 1,000 433.608.528300 Water 759 900 800 800 433.608.528400 Sewer 1,019 886 900 900 433.608.528500 Refuse 1,428 1,344 1,500 1,500 433.608.528600 Stormwater Drainage 48 44 100 100 433.608.529100 Equipment Rent 6,266 4,171 4,000 6,000
TOTAL CONTRACTUAL SERVICES 52,341 49,928 60,900 64,950
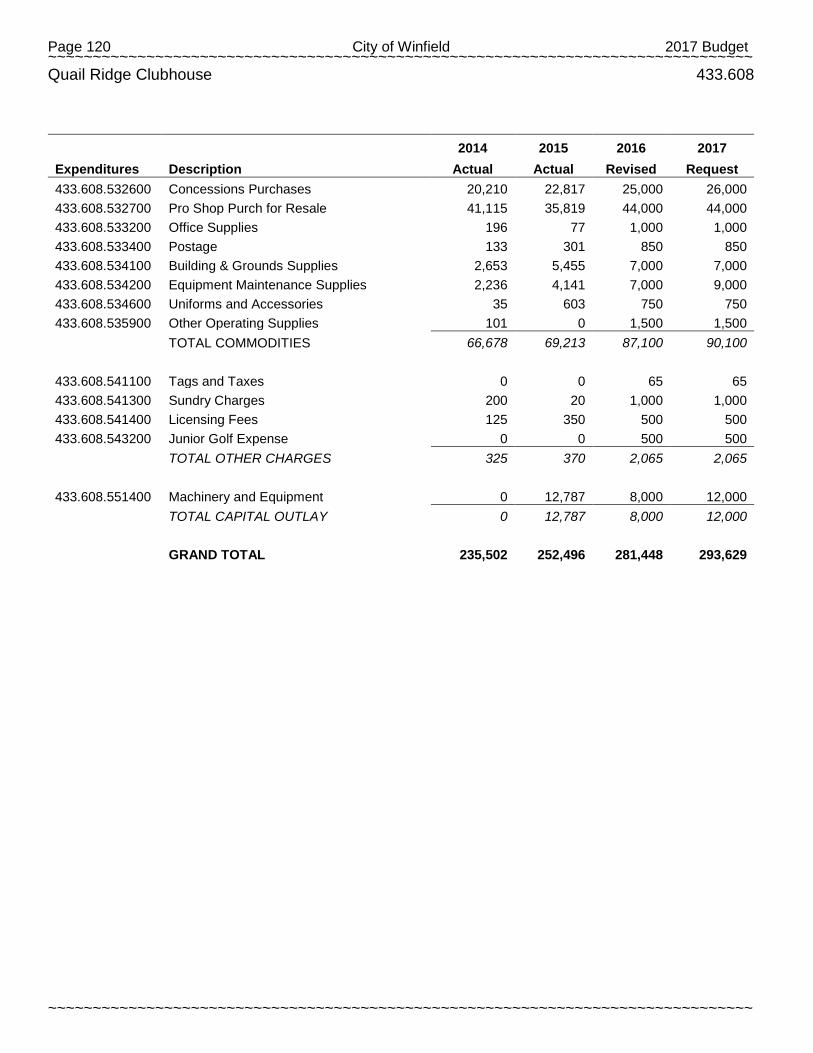
Page 120 City of Winfield 2017 Budget ~~~~~~~~~~~~~~~~~~~~~~~~~~~~~~~~~~~~~~~~~~~~~~~~~~~~~~~~~~~~~~~~~~~~~~~~~~~~~~~
~~~~~~~~~~~~~~~~~~~~~~~~~~~~~~~~~~~~~~~~~~~~~~~~~~~~~~~~~~~~~~~~~~~~~~~~~~~~~~~
Quail Ridge Clubhouse 433.608
2014 2015 2016 2017
Expenditures Description Actual Actual Revised Request 433.608.532600 Concessions Purchases 20,210 22,817 25,000 26,000 433.608.532700 Pro Shop Purch for Resale 41,115 35,819 44,000 44,000 433.608.533200 Office Supplies 196 77 1,000 1,000 433.608.533400 Postage 133 301 850 850 433.608.534100 Building & Grounds Supplies 2,653 5,455 7,000 7,000 433.608.534200 Equipment Maintenance Supplies 2,236 4,141 7,000 9,000 433.608.534600 Uniforms and Accessories 35 603 750 750 433.608.535900 Other Operating Supplies 101 0 1,500 1,500
TOTAL COMMODITIES 66,678 69,213 87,100 90,100
433.608.541100 Tags and Taxes 0 0 65 65 433.608.541300 Sundry Charges 200 20 1,000 1,000 433.608.541400 Licensing Fees 125 350 500 500 433.608.543200 Junior Golf Expense 0 0 500 500
TOTAL OTHER CHARGES 325 370 2,065 2,065
433.608.551400 Machinery and Equipment 0 12,787 8,000 12,000
TOTAL CAPITAL OUTLAY 0 12,787 8,000 12,000
GRAND TOTAL 235,502 252,496 281,448 293,629
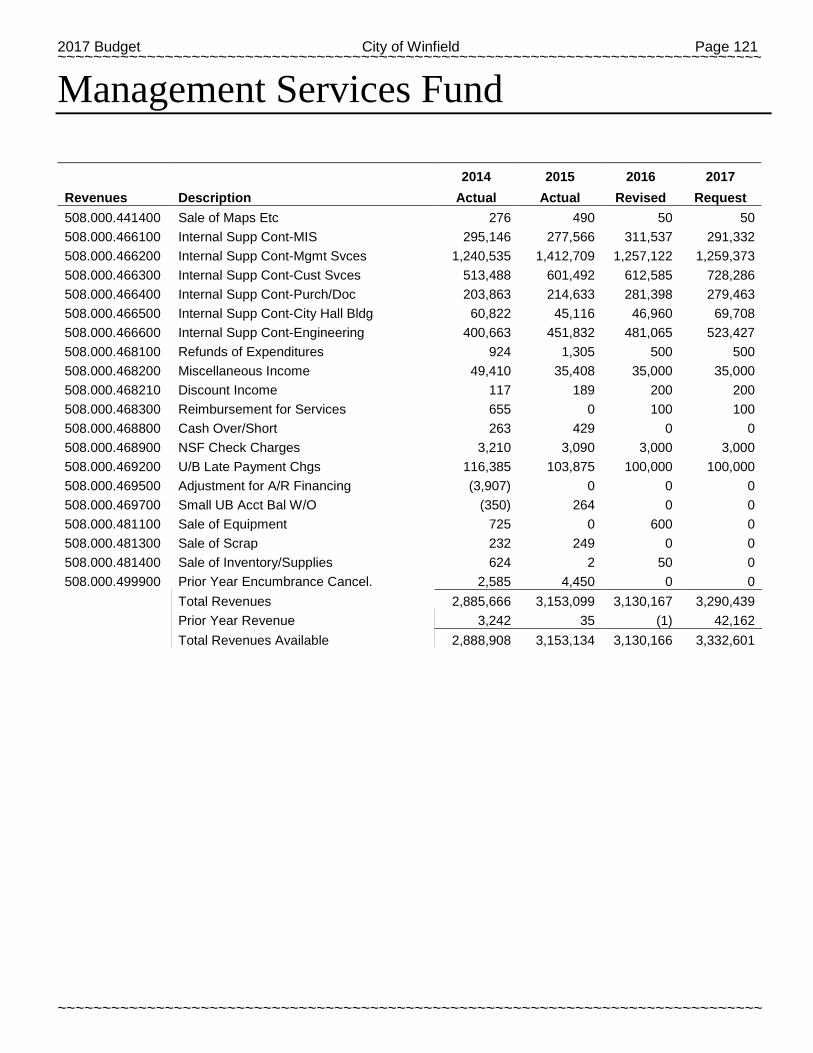
2017 Budget City of Winfield Page 121 ~~~~~~~~~~~~~~~~~~~~~~~~~~~~~~~~~~~~~~~~~~~~~~~~~~~~~~~~~~~~~~~~~~~~~~~~~~~~~~~
~~~~~~~~~~~~~~~~~~~~~~~~~~~~~~~~~~~~~~~~~~~~~~~~~~~~~~~~~~~~~~~~~~~~~~~~~~~~~~~
Management Services Fund
2014 2015 2016 2017
Revenues Description Actual Actual Revised Request 508.000.441400 Sale of Maps Etc 276 490 50 50 508.000.466100 Internal Supp Cont-MIS 295,146 277,566 311,537 291,332 508.000.466200 Internal Supp Cont-Mgmt Svces 1,240,535 1,412,709 1,257,122 1,259,373 508.000.466300 Internal Supp Cont-Cust Svces 513,488 601,492 612,585 728,286 508.000.466400 Internal Supp Cont-Purch/Doc 203,863 214,633 281,398 279,463 508.000.466500 Internal Supp Cont-City Hall Bldg 60,822 45,116 46,960 69,708 508.000.466600 Internal Supp Cont-Engineering 400,663 451,832 481,065 523,427 508.000.468100 Refunds of Expenditures 924 1,305 500 500 508.000.468200 Miscellaneous Income 49,410 35,408 35,000 35,000 508.000.468210 Discount Income 117 189 200 200 508.000.468300 Reimbursement for Services 655 0 100 100 508.000.468800 Cash Over/Short 263 429 0 0 508.000.468900 NSF Check Charges 3,210 3,090 3,000 3,000 508.000.469200 U/B Late Payment Chgs 116,385 103,875 100,000 100,000 508.000.469500 Adjustment for A/R Financing (3,907) 0 0 0 508.000.469700 Small UB Acct Bal W/O (350) 264 0 0 508.000.481100 Sale of Equipment 725 0 600 0 508.000.481300 Sale of Scrap 232 249 0 0 508.000.481400 Sale of Inventory/Supplies 624 2 50 0 508.000.499900 Prior Year Encumbrance Cancel. 2,585 4,450 0 0 Total Revenues 2,885,666 3,153,099 3,130,167 3,290,439 Prior Year Revenue 3,242 35 (1) 42,162 Total Revenues Available 2,888,908 3,153,134 3,130,166 3,332,601
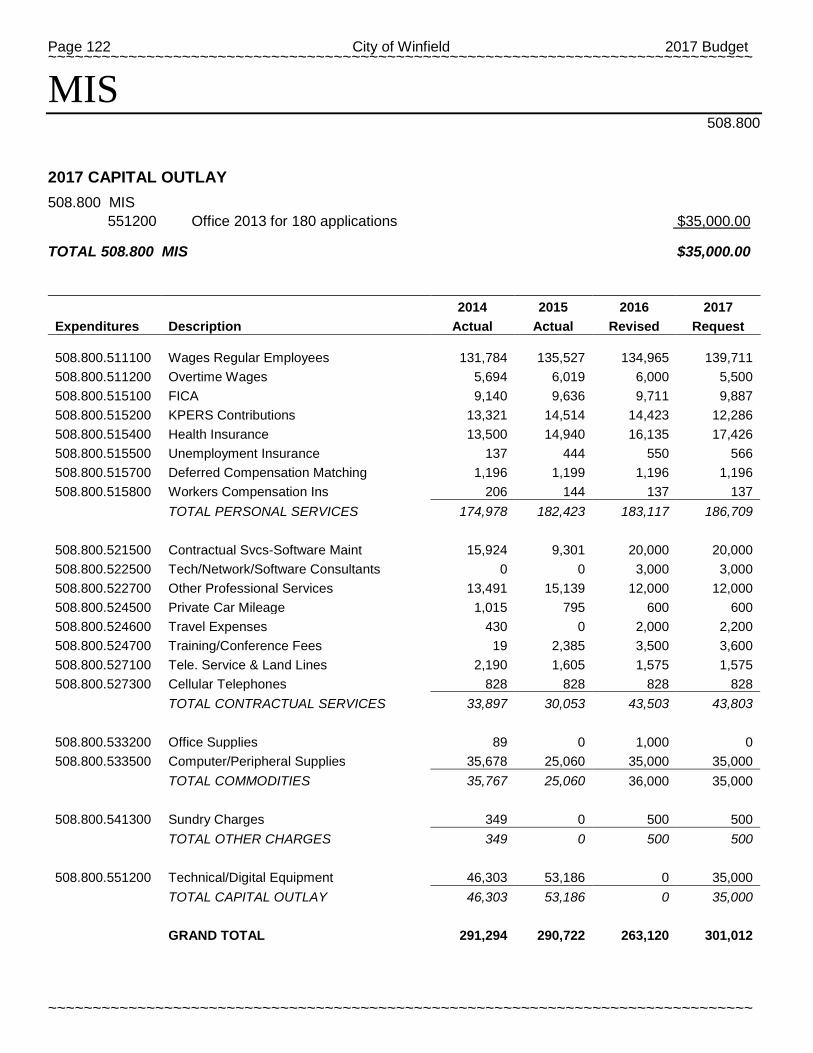
Page 122 City of Winfield 2017 Budget ~~~~~~~~~~~~~~~~~~~~~~~~~~~~~~~~~~~~~~~~~~~~~~~~~~~~~~~~~~~~~~~~~~~~~~~~~~~~~~~
~~~~~~~~~~~~~~~~~~~~~~~~~~~~~~~~~~~~~~~~~~~~~~~~~~~~~~~~~~~~~~~~~~~~~~~~~~~~~~~
MIS 508.800
2017 CAPITAL OUTLAY
508.800 MIS 551200 Office 2013 for 180 applications $35,000.00
TOTAL 508.800 MIS $35,000.00
2014 2015 2016 2017
Expenditures Description Actual Actual Revised Request
508.800.511100 Wages Regular Employees 131,784 135,527 134,965 139,711 508.800.511200 Overtime Wages 5,694 6,019 6,000 5,500 508.800.515100 FICA 9,140 9,636 9,711 9,887 508.800.515200 KPERS Contributions 13,321 14,514 14,423 12,286 508.800.515400 Health Insurance 13,500 14,940 16,135 17,426 508.800.515500 Unemployment Insurance 137 444 550 566 508.800.515700 Deferred Compensation Matching 1,196 1,199 1,196 1,196 508.800.515800 Workers Compensation Ins 206 144 137 137
TOTAL PERSONAL SERVICES 174,978 182,423 183,117 186,709
508.800.521500 Contractual Svcs-Software Maint 15,924 9,301 20,000 20,000 508.800.522500 Tech/Network/Software Consultants 0 0 3,000 3,000 508.800.522700 Other Professional Services 13,491 15,139 12,000 12,000 508.800.524500 Private Car Mileage 1,015 795 600 600 508.800.524600 Travel Expenses 430 0 2,000 2,200 508.800.524700 Training/Conference Fees 19 2,385 3,500 3,600 508.800.527100 Tele. Service & Land Lines 2,190 1,605 1,575 1,575 508.800.527300 Cellular Telephones 828 828 828 828
TOTAL CONTRACTUAL SERVICES 33,897 30,053 43,503 43,803
508.800.533200 Office Supplies 89 0 1,000 0 508.800.533500 Computer/Peripheral Supplies 35,678 25,060 35,000 35,000
TOTAL COMMODITIES 35,767 25,060 36,000 35,000
508.800.541300 Sundry Charges 349 0 500 500
TOTAL OTHER CHARGES 349 0 500 500
508.800.551200 Technical/Digital Equipment 46,303 53,186 0 35,000
TOTAL CAPITAL OUTLAY 46,303 53,186 0 35,000
GRAND TOTAL 291,294 290,722 263,120 301,012
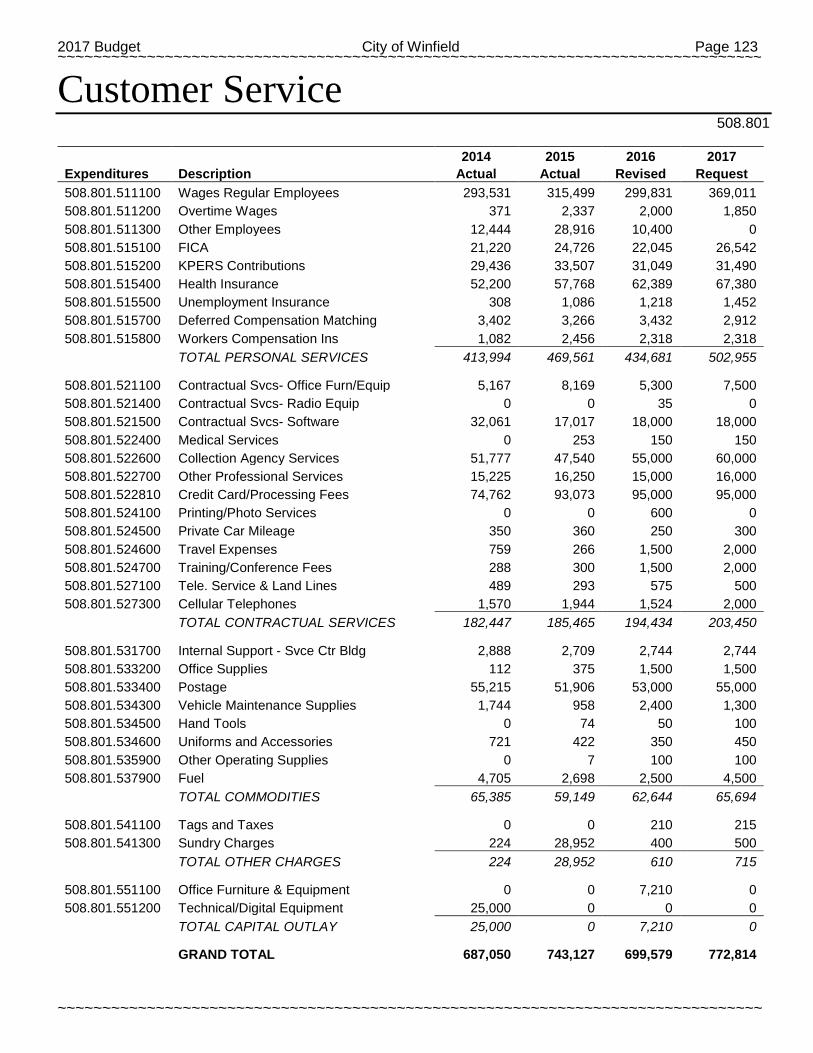
2017 Budget City of Winfield Page 123 ~~~~~~~~~~~~~~~~~~~~~~~~~~~~~~~~~~~~~~~~~~~~~~~~~~~~~~~~~~~~~~~~~~~~~~~~~~~~~~~
~~~~~~~~~~~~~~~~~~~~~~~~~~~~~~~~~~~~~~~~~~~~~~~~~~~~~~~~~~~~~~~~~~~~~~~~~~~~~~~
Customer Service 508.801
2014 2015 2016 2017
Expenditures Description Actual Actual Revised Request 508.801.511100 Wages Regular Employees 293,531 315,499 299,831 369,011 508.801.511200 Overtime Wages 371 2,337 2,000 1,850 508.801.511300 Other Employees 12,444 28,916 10,400 0 508.801.515100 FICA 21,220 24,726 22,045 26,542 508.801.515200 KPERS Contributions 29,436 33,507 31,049 31,490 508.801.515400 Health Insurance 52,200 57,768 62,389 67,380 508.801.515500 Unemployment Insurance 308 1,086 1,218 1,452 508.801.515700 Deferred Compensation Matching 3,402 3,266 3,432 2,912 508.801.515800 Workers Compensation Ins 1,082 2,456 2,318 2,318
TOTAL PERSONAL SERVICES 413,994 469,561 434,681 502,955
508.801.521100 Contractual Svcs- Office Furn/Equip 5,167 8,169 5,300 7,500 508.801.521400 Contractual Svcs- Radio Equip 0 0 35 0 508.801.521500 Contractual Svcs- Software 32,061 17,017 18,000 18,000 508.801.522400 Medical Services 0 253 150 150 508.801.522600 Collection Agency Services 51,777 47,540 55,000 60,000 508.801.522700 Other Professional Services 15,225 16,250 15,000 16,000 508.801.522810 Credit Card/Processing Fees 74,762 93,073 95,000 95,000 508.801.524100 Printing/Photo Services 0 0 600 0 508.801.524500 Private Car Mileage 350 360 250 300 508.801.524600 Travel Expenses 759 266 1,500 2,000 508.801.524700 Training/Conference Fees 288 300 1,500 2,000 508.801.527100 Tele. Service & Land Lines 489 293 575 500 508.801.527300 Cellular Telephones 1,570 1,944 1,524 2,000
TOTAL CONTRACTUAL SERVICES 182,447 185,465 194,434 203,450
508.801.531700 Internal Support - Svce Ctr Bldg 2,888 2,709 2,744 2,744 508.801.533200 Office Supplies 112 375 1,500 1,500 508.801.533400 Postage 55,215 51,906 53,000 55,000 508.801.534300 Vehicle Maintenance Supplies 1,744 958 2,400 1,300 508.801.534500 Hand Tools 0 74 50 100 508.801.534600 Uniforms and Accessories 721 422 350 450 508.801.535900 Other Operating Supplies 0 7 100 100 508.801.537900 Fuel 4,705 2,698 2,500 4,500
TOTAL COMMODITIES 65,385 59,149 62,644 65,694
508.801.541100 Tags and Taxes 0 0 210 215 508.801.541300 Sundry Charges 224 28,952 400 500
TOTAL OTHER CHARGES 224 28,952 610 715
508.801.551100 Office Furniture & Equipment 0 0 7,210 0 508.801.551200 Technical/Digital Equipment 25,000 0 0 0
TOTAL CAPITAL OUTLAY 25,000 0 7,210 0
GRAND TOTAL 687,050 743,127 699,579 772,814
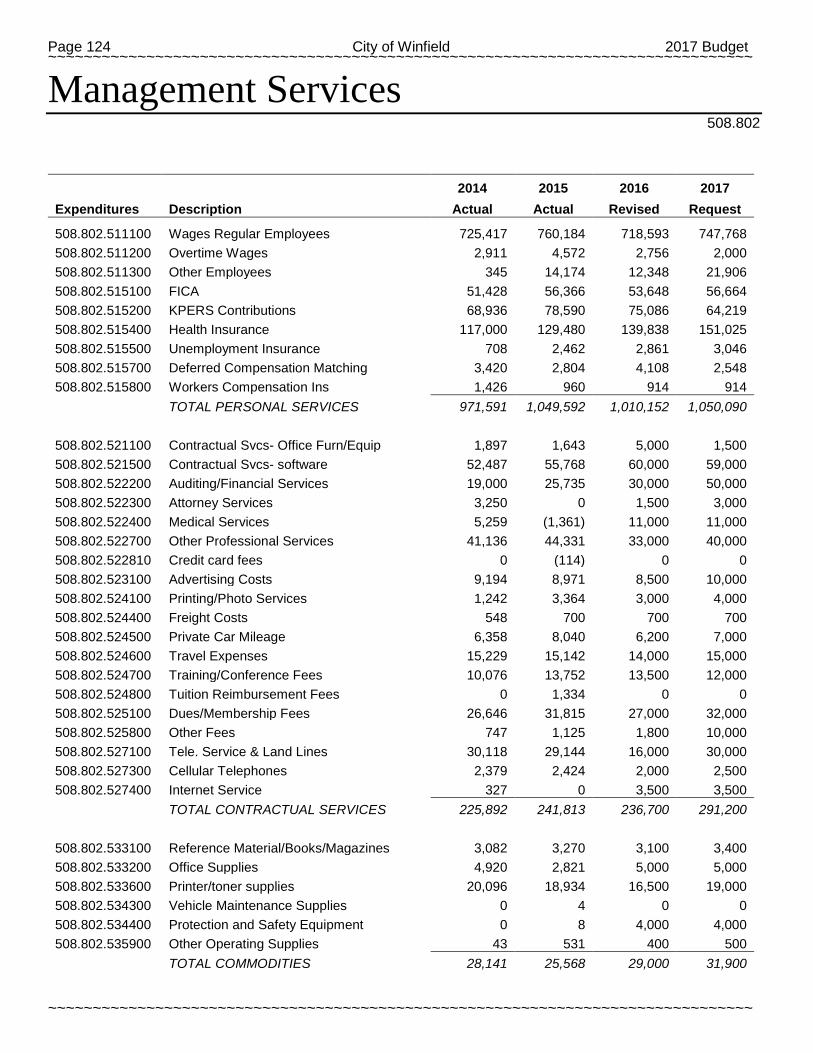
Page 124 City of Winfield 2017 Budget ~~~~~~~~~~~~~~~~~~~~~~~~~~~~~~~~~~~~~~~~~~~~~~~~~~~~~~~~~~~~~~~~~~~~~~~~~~~~~~~
~~~~~~~~~~~~~~~~~~~~~~~~~~~~~~~~~~~~~~~~~~~~~~~~~~~~~~~~~~~~~~~~~~~~~~~~~~~~~~~
Management Services 508.802
2014 2015 2016 2017
Expenditures Description Actual Actual Revised Request
508.802.511100 Wages Regular Employees 725,417 760,184 718,593 747,768 508.802.511200 Overtime Wages 2,911 4,572 2,756 2,000 508.802.511300 Other Employees 345 14,174 12,348 21,906 508.802.515100 FICA 51,428 56,366 53,648 56,664 508.802.515200 KPERS Contributions 68,936 78,590 75,086 64,219 508.802.515400 Health Insurance 117,000 129,480 139,838 151,025 508.802.515500 Unemployment Insurance 708 2,462 2,861 3,046 508.802.515700 Deferred Compensation Matching 3,420 2,804 4,108 2,548 508.802.515800 Workers Compensation Ins 1,426 960 914 914
TOTAL PERSONAL SERVICES 971,591 1,049,592 1,010,152 1,050,090
508.802.521100 Contractual Svcs- Office Furn/Equip 1,897 1,643 5,000 1,500 508.802.521500 Contractual Svcs- software 52,487 55,768 60,000 59,000 508.802.522200 Auditing/Financial Services 19,000 25,735 30,000 50,000 508.802.522300 Attorney Services 3,250 0 1,500 3,000 508.802.522400 Medical Services 5,259 (1,361) 11,000 11,000 508.802.522700 Other Professional Services 41,136 44,331 33,000 40,000 508.802.522810 Credit card fees 0 (114) 0 0 508.802.523100 Advertising Costs 9,194 8,971 8,500 10,000 508.802.524100 Printing/Photo Services 1,242 3,364 3,000 4,000 508.802.524400 Freight Costs 548 700 700 700 508.802.524500 Private Car Mileage 6,358 8,040 6,200 7,000 508.802.524600 Travel Expenses 15,229 15,142 14,000 15,000 508.802.524700 Training/Conference Fees 10,076 13,752 13,500 12,000 508.802.524800 Tuition Reimbursement Fees 0 1,334 0 0 508.802.525100 Dues/Membership Fees 26,646 31,815 27,000 32,000 508.802.525800 Other Fees 747 1,125 1,800 10,000 508.802.527100 Tele. Service & Land Lines 30,118 29,144 16,000 30,000 508.802.527300 Cellular Telephones 2,379 2,424 2,000 2,500 508.802.527400 Internet Service 327 0 3,500 3,500
TOTAL CONTRACTUAL SERVICES 225,892 241,813 236,700 291,200
508.802.533100 Reference Material/Books/Magazines 3,082 3,270 3,100 3,400 508.802.533200 Office Supplies 4,920 2,821 5,000 5,000 508.802.533600 Printer/toner supplies 20,096 18,934 16,500 19,000 508.802.534300 Vehicle Maintenance Supplies 0 4 0 0 508.802.534400 Protection and Safety Equipment 0 8 4,000 4,000 508.802.535900 Other Operating Supplies 43 531 400 500
TOTAL COMMODITIES 28,141 25,568 29,000 31,900

2017 Budget City of Winfield Page 125 ~~~~~~~~~~~~~~~~~~~~~~~~~~~~~~~~~~~~~~~~~~~~~~~~~~~~~~~~~~~~~~~~~~~~~~~~~~~~~~~
~~~~~~~~~~~~~~~~~~~~~~~~~~~~~~~~~~~~~~~~~~~~~~~~~~~~~~~~~~~~~~~~~~~~~~~~~~~~~~~
Management Services 508.802
2014 2015 2016 2017
Expenditures Description Actual Actual Revised Request
508.802.541300 Sundry Charges 24,659 20,809 15,000 18,000 508.802.541900 Power Plant Emission Fees 580
508.802.542000 Safety Committee 0 681 10,000 10,000 508.802.549900 Contingencies 0 0 1,000 1,000
TOTAL OTHER CHARGES 25,239 21,490 26,000 29,000
508.802.551100 Office Furniture & Equipment 0 0 12,500 0 508.802.551200 Technical/Digital Equipment 8,250 0 0 0
TOTAL CAPITAL OUTLAY 8,250 0 12,500 0
GRAND TOTAL 1,259,112 1,338,463 1,314,352 1,402,190
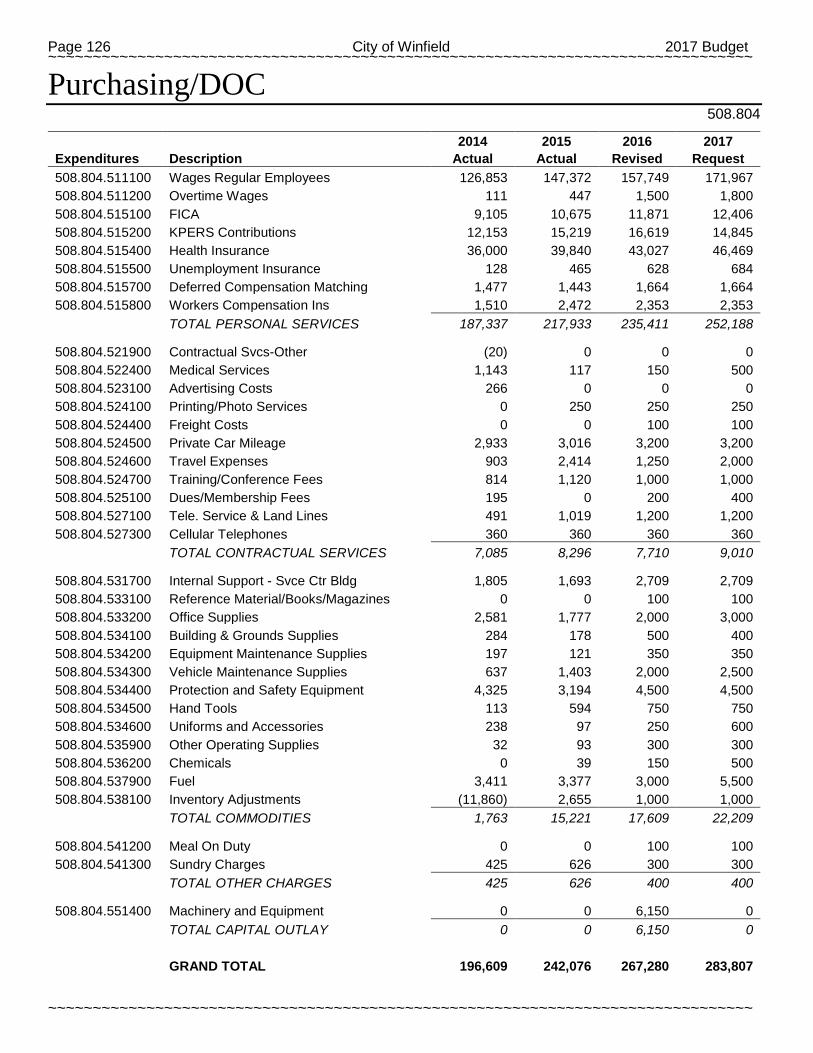
Page 126 City of Winfield 2017 Budget ~~~~~~~~~~~~~~~~~~~~~~~~~~~~~~~~~~~~~~~~~~~~~~~~~~~~~~~~~~~~~~~~~~~~~~~~~~~~~~~
~~~~~~~~~~~~~~~~~~~~~~~~~~~~~~~~~~~~~~~~~~~~~~~~~~~~~~~~~~~~~~~~~~~~~~~~~~~~~~~
Purchasing/DOC 508.804
2014 2015 2016 2017
Expenditures Description Actual Actual Revised Request 508.804.511100 Wages Regular Employees 126,853 147,372 157,749 171,967 508.804.511200 Overtime Wages 111 447 1,500 1,800 508.804.515100 FICA 9,105 10,675 11,871 12,406 508.804.515200 KPERS Contributions 12,153 15,219 16,619 14,845 508.804.515400 Health Insurance 36,000 39,840 43,027 46,469 508.804.515500 Unemployment Insurance 128 465 628 684 508.804.515700 Deferred Compensation Matching 1,477 1,443 1,664 1,664 508.804.515800 Workers Compensation Ins 1,510 2,472 2,353 2,353
TOTAL PERSONAL SERVICES 187,337 217,933 235,411 252,188
508.804.521900 Contractual Svcs-Other (20) 0 0 0 508.804.522400 Medical Services 1,143 117 150 500 508.804.523100 Advertising Costs 266 0 0 0 508.804.524100 Printing/Photo Services 0 250 250 250 508.804.524400 Freight Costs 0 0 100 100 508.804.524500 Private Car Mileage 2,933 3,016 3,200 3,200 508.804.524600 Travel Expenses 903 2,414 1,250 2,000 508.804.524700 Training/Conference Fees 814 1,120 1,000 1,000 508.804.525100 Dues/Membership Fees 195 0 200 400 508.804.527100 Tele. Service & Land Lines 491 1,019 1,200 1,200 508.804.527300 Cellular Telephones 360 360 360 360
TOTAL CONTRACTUAL SERVICES 7,085 8,296 7,710 9,010
508.804.531700 Internal Support - Svce Ctr Bldg 1,805 1,693 2,709 2,709 508.804.533100 Reference Material/Books/Magazines 0 0 100 100 508.804.533200 Office Supplies 2,581 1,777 2,000 3,000 508.804.534100 Building & Grounds Supplies 284 178 500 400 508.804.534200 Equipment Maintenance Supplies 197 121 350 350 508.804.534300 Vehicle Maintenance Supplies 637 1,403 2,000 2,500 508.804.534400 Protection and Safety Equipment 4,325 3,194 4,500 4,500 508.804.534500 Hand Tools 113 594 750 750 508.804.534600 Uniforms and Accessories 238 97 250 600 508.804.535900 Other Operating Supplies 32 93 300 300 508.804.536200 Chemicals 0 39 150 500 508.804.537900 Fuel 3,411 3,377 3,000 5,500 508.804.538100 Inventory Adjustments (11,860) 2,655 1,000 1,000
TOTAL COMMODITIES 1,763 15,221 17,609 22,209
508.804.541200 Meal On Duty 0 0 100 100 508.804.541300 Sundry Charges 425 626 300 300
TOTAL OTHER CHARGES 425 626 400 400
508.804.551400 Machinery and Equipment 0 0 6,150 0
TOTAL CAPITAL OUTLAY 0 0 6,150 0
GRAND TOTAL 196,609 242,076 267,280 283,807
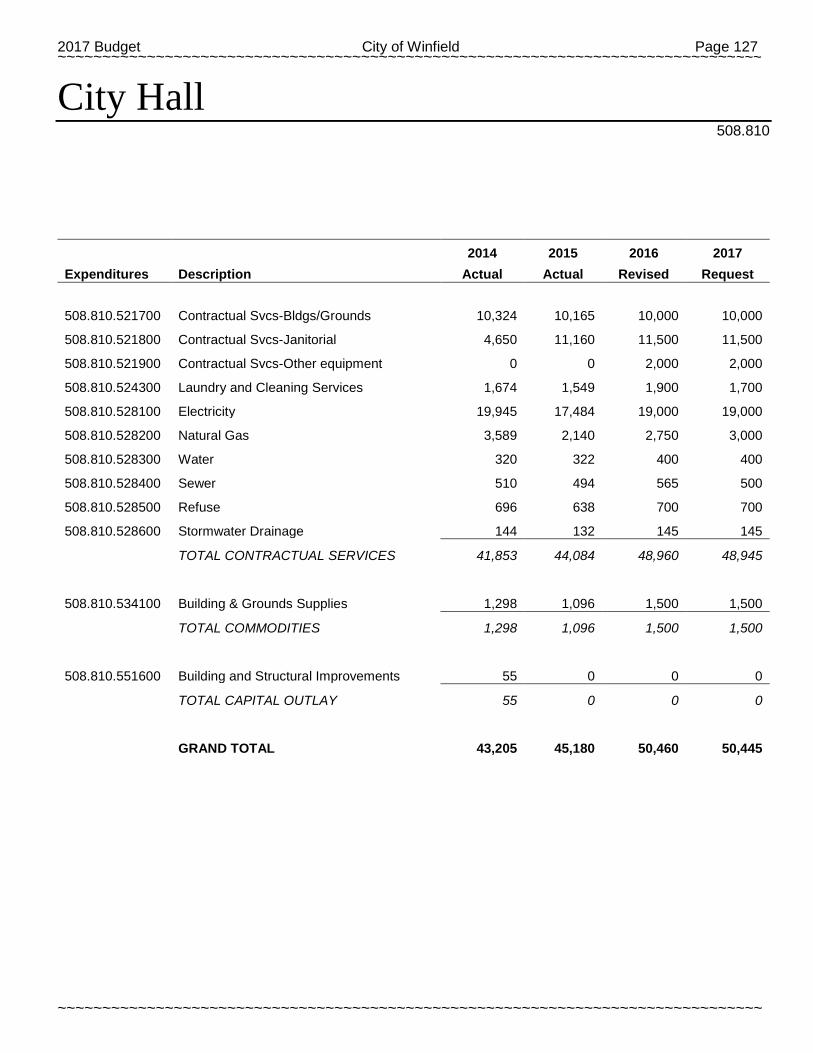
2017 Budget City of Winfield Page 127 ~~~~~~~~~~~~~~~~~~~~~~~~~~~~~~~~~~~~~~~~~~~~~~~~~~~~~~~~~~~~~~~~~~~~~~~~~~~~~~~
~~~~~~~~~~~~~~~~~~~~~~~~~~~~~~~~~~~~~~~~~~~~~~~~~~~~~~~~~~~~~~~~~~~~~~~~~~~~~~~
City Hall 508.810
2014 2015 2016 2017
Expenditures Description Actual Actual Revised Request
508.810.521700 Contractual Svcs-Bldgs/Grounds 10,324 10,165 10,000 10,000
508.810.521800 Contractual Svcs-Janitorial 4,650 11,160 11,500 11,500
508.810.521900 Contractual Svcs-Other equipment 0 0 2,000 2,000
508.810.524300 Laundry and Cleaning Services 1,674 1,549 1,900 1,700
508.810.528100 Electricity 19,945 17,484 19,000 19,000
508.810.528200 Natural Gas 3,589 2,140 2,750 3,000
508.810.528300 Water 320 322 400 400
508.810.528400 Sewer 510 494 565 500
508.810.528500 Refuse 696 638 700 700
508.810.528600 Stormwater Drainage 144 132 145 145
TOTAL CONTRACTUAL SERVICES 41,853 44,084 48,960 48,945
508.810.534100 Building & Grounds Supplies 1,298 1,096 1,500 1,500
TOTAL COMMODITIES 1,298 1,096 1,500 1,500
508.810.551600 Building and Structural Improvements 55 0 0 0
TOTAL CAPITAL OUTLAY 55 0 0 0
GRAND TOTAL 43,205 45,180 50,460 50,445

Page 128 City of Winfield 2017 Budget ~~~~~~~~~~~~~~~~~~~~~~~~~~~~~~~~~~~~~~~~~~~~~~~~~~~~~~~~~~~~~~~~~~~~~~~~~~~~~~~
~~~~~~~~~~~~~~~~~~~~~~~~~~~~~~~~~~~~~~~~~~~~~~~~~~~~~~~~~~~~~~~~~~~~~~~~~~~~~~~
Engineering 508.818
2017 CAPITAL OUTLAY
508.818 ENGINEERING 551200 Misc. Technical Equipment $5,000.00
TOTAL 508.818 ENGINEERING $5,000.00
2014 2015 2016 2017
Expenditures Description Actual Actual Revised Request
508.818.511100 Wages Regular Employees 261,666 279,054 291,369 319,530 508.818.511200 Overtime Wages 165 34 92 95 508.818.511300 Wages-Other Employees 3,648 3,688 3,648 3,229 508.818.515100 FICA 19,073 20,660 21,947 23,947 508.818.515200 KPERS Contributions 24,650 28,958 30,616 27,477 508.818.515400 Health Insurance 45,000 49,800 53,784 58,087 508.818.515500 Unemployment Insurance 264 895 1,151 1,279 508.818.515700 Deferred Compensation Matching 1,146 1,560 1,560 1,560 508.818.515800 Workers Compensation Ins 2,454 2,805 2,629 2,629
TOTAL PERSONAL SERVICES 358,066 387,454 406,796 437,833
508.818.521200 Contractual Svcs- Tech/Computer 800 889 2,000 2,700 508.818.521500 Contractual Svcs-Software Maint 27,737 47,740 48,100 48,100 508.818.521900 Contractual Svcs-Other 0 155 1,000 1,500 508.818.522100 Arch/Eng/Planning/Abstract/Appraisal Svc 0 0 200 200 508.818.522400 Medical Services 286 413 50 300 508.818.522700 Other Professional Services 40 0 250 750 508.818.523100 Advertising Costs 355 594 400 500 508.818.524100 Printing/Photo Services 0 310 300 300 508.818.524400 Freight Costs 20 62 50 50 508.818.524500 Private Car Mileage 4,086 4,202 4,600 4,600 508.818.524600 Travel Expenses 6,950 5,104 6,500 7,000 508.818.524700 Training/Conference Fees 830 1,335 1,500 1,500 508.818.525100 Dues/Membership Fees 632 498 550 600 508.818.527100 Tele. Service & Land Lines 842 482 1,000 800 508.818.527300 Cellular Telephones 960 960 960 960
TOTAL CONTRACTUAL SERVICES 43,538 62,744 67,460 69,860
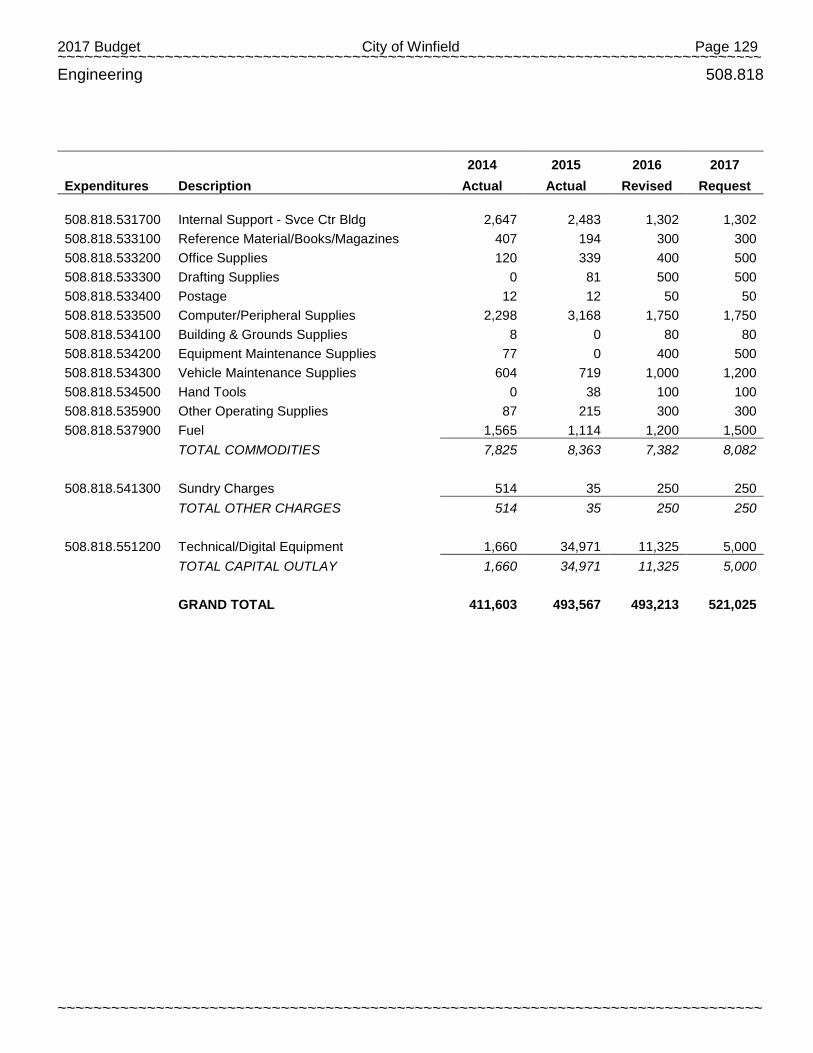
2017 Budget City of Winfield Page 129 ~~~~~~~~~~~~~~~~~~~~~~~~~~~~~~~~~~~~~~~~~~~~~~~~~~~~~~~~~~~~~~~~~~~~~~~~~~~~~~~
~~~~~~~~~~~~~~~~~~~~~~~~~~~~~~~~~~~~~~~~~~~~~~~~~~~~~~~~~~~~~~~~~~~~~~~~~~~~~~~
Engineering 508.818
2014 2015 2016 2017
Expenditures Description Actual Actual Revised Request
508.818.531700 Internal Support - Svce Ctr Bldg 2,647 2,483 1,302 1,302 508.818.533100 Reference Material/Books/Magazines 407 194 300 300 508.818.533200 Office Supplies 120 339 400 500 508.818.533300 Drafting Supplies 0 81 500 500 508.818.533400 Postage 12 12 50 50 508.818.533500 Computer/Peripheral Supplies 2,298 3,168 1,750 1,750 508.818.534100 Building & Grounds Supplies 8 0 80 80 508.818.534200 Equipment Maintenance Supplies 77 0 400 500 508.818.534300 Vehicle Maintenance Supplies 604 719 1,000 1,200 508.818.534500 Hand Tools 0 38 100 100 508.818.535900 Other Operating Supplies 87 215 300 300 508.818.537900 Fuel 1,565 1,114 1,200 1,500
TOTAL COMMODITIES 7,825 8,363 7,382 8,082
508.818.541300 Sundry Charges 514 35 250 250
TOTAL OTHER CHARGES 514 35 250 250
508.818.551200 Technical/Digital Equipment 1,660 34,971 11,325 5,000
TOTAL CAPITAL OUTLAY 1,660 34,971 11,325 5,000
GRAND TOTAL 411,603 493,567 493,213 521,025
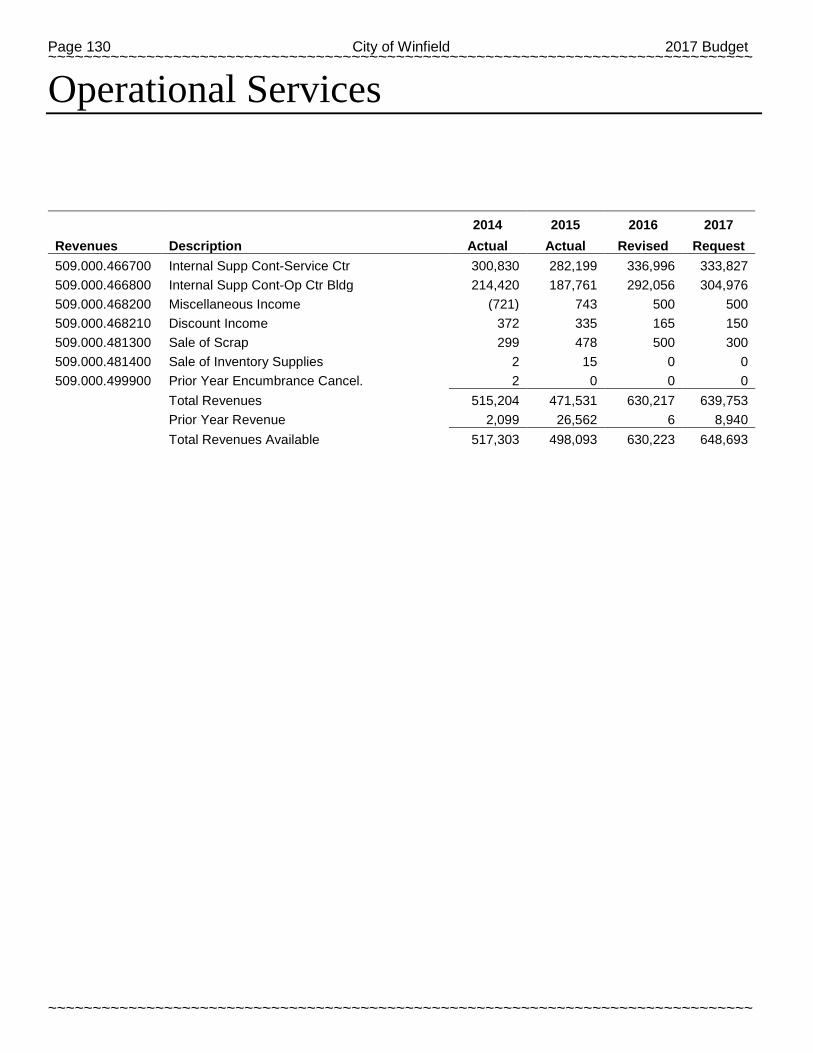
Page 130 City of Winfield 2017 Budget ~~~~~~~~~~~~~~~~~~~~~~~~~~~~~~~~~~~~~~~~~~~~~~~~~~~~~~~~~~~~~~~~~~~~~~~~~~~~~~~
~~~~~~~~~~~~~~~~~~~~~~~~~~~~~~~~~~~~~~~~~~~~~~~~~~~~~~~~~~~~~~~~~~~~~~~~~~~~~~~
Operational Services
2014 2015 2016 2017
Revenues Description Actual Actual Revised Request 509.000.466700 Internal Supp Cont-Service Ctr 300,830 282,199 336,996 333,827 509.000.466800 Internal Supp Cont-Op Ctr Bldg 214,420 187,761 292,056 304,976 509.000.468200 Miscellaneous Income (721) 743 500 500 509.000.468210 Discount Income 372 335 165 150 509.000.481300 Sale of Scrap 299 478 500 300 509.000.481400 Sale of Inventory Supplies 2 15 0 0 509.000.499900 Prior Year Encumbrance Cancel. 2 0 0 0
Total Revenues 515,204 471,531 630,217 639,753
Prior Year Revenue 2,099 26,562 6 8,940
Total Revenues Available 517,303 498,093 630,223 648,693

2017 Budget City of Winfield Page 131 ~~~~~~~~~~~~~~~~~~~~~~~~~~~~~~~~~~~~~~~~~~~~~~~~~~~~~~~~~~~~~~~~~~~~~~~~~~~~~~~
~~~~~~~~~~~~~~~~~~~~~~~~~~~~~~~~~~~~~~~~~~~~~~~~~~~~~~~~~~~~~~~~~~~~~~~~~~~~~~~
Fleet Services 509.830
2014 2015 2016 2017 Expenditures Description Actual Actual Revised Request 509.830.511100 Wages Regular Employees 155,645 158,180 159,118 164,611 509.830.511200 Overtime Wages 1,337 900 864 896 509.830.515100 FICA 10,638 11,319 11,687 11,955 509.830.515200 KPERS Contributions 15,280 16,349 16,638 14,093 509.830.515400 Health Insurance 27,000 29,880 32,270 34,852 509.830.515500 Unemployment Insurance 157 499 624 650 509.830.515700 Deferred Compensation Matching 520 520 1,560 1,560 509.830.515800 Workers Compensation Ins 2,893 2,670 2,542 2,542
TOTAL PERSONAL SERVICES 213,470 220,317 225,303 231,159
509.830.521100 Contractual Svcs- Office Furn/Equip 0 0 150 150 509.830.521400 Contractual Svcs- Radio Equip 0 0 300 300 509.830.521500 Contractual Svcs-Software Main 1,500 2,865 3,500 3,500 509.830.521700 Contractual Svcs-Bldgs/Grounds 2,773 1,509 2,000 2,500 509.830.521900 Contractual Svcs-Other 255 70 500 500 509.830.522400 Medical Services 360 33 400 400 509.830.522700 Other Professional Services 0 0 100 100 509.830.522900 Contractual Svcs-Tire Disposal 738 528 850 850 509.830.524100 Printing/Photo Services 100 315 100 100 509.830.524300 Laundry and Cleaning Services 6,615 8,750 7,500 7,500 509.830.524400 Freight Costs 16 76 100 100 509.830.524600 Travel Expenses 168 8 1,200 1,200 509.830.524700 Training/Conference Fees 1,500 492 1,500 2,500 509.830.525800 Other Fees 0 65 0 0 509.830.527100 Tele. Service & Land Lines 516 1,529 1,600 1,600 509.830.527300 Cellular Telephones 1,080 1,080 1,100 1,100 509.830.528100 Electricity 12,382 10,619 12,000 13,000 509.830.528200 Natural Gas 3,247 1,609 2,000 4,000 509.830.528300 Water 316 351 500 500 509.830.528400 Sewer 246 211 350 350 509.830.528500 Refuse 2,256 2,068 2,256 2,500 509.830.528600 Stormwater Drainage 48 44 48 48
TOTAL CONTRACTUAL SERVICES 34,116 32,222 38,054 42,798
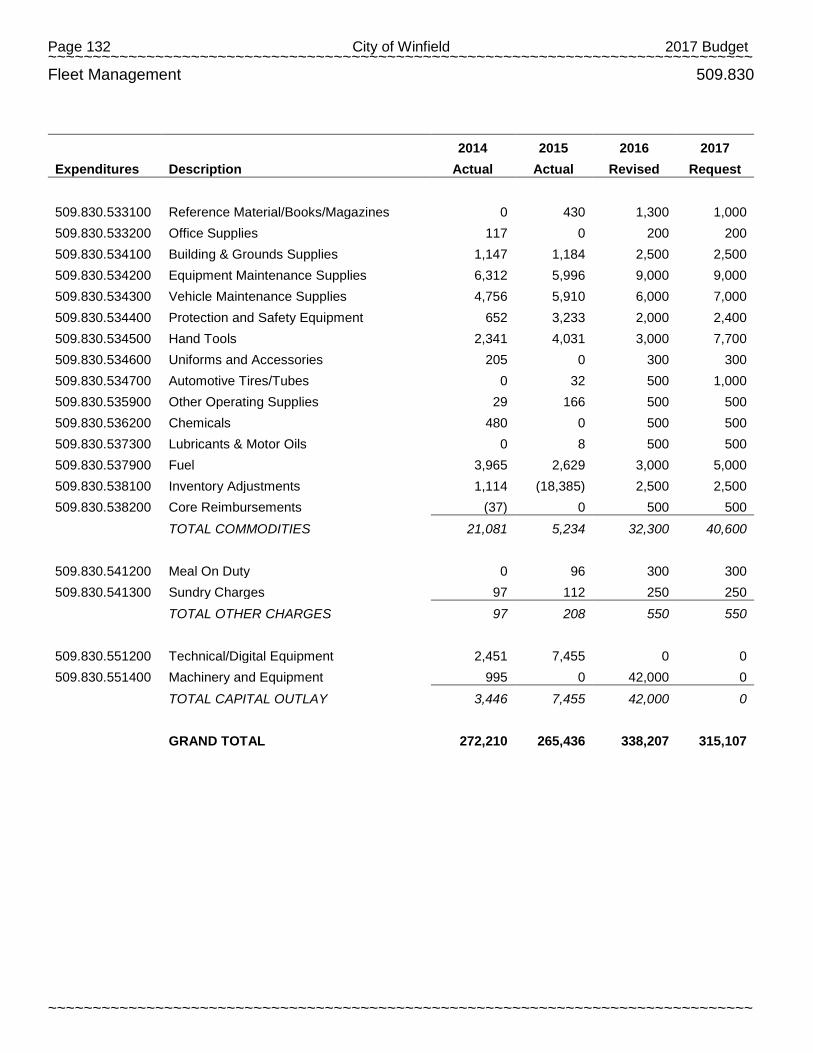
Page 132 City of Winfield 2017 Budget ~~~~~~~~~~~~~~~~~~~~~~~~~~~~~~~~~~~~~~~~~~~~~~~~~~~~~~~~~~~~~~~~~~~~~~~~~~~~~~~
~~~~~~~~~~~~~~~~~~~~~~~~~~~~~~~~~~~~~~~~~~~~~~~~~~~~~~~~~~~~~~~~~~~~~~~~~~~~~~~
Fleet Management 509.830
2014 2015 2016 2017
Expenditures Description Actual Actual Revised Request
509.830.533100 Reference Material/Books/Magazines 0 430 1,300 1,000 509.830.533200 Office Supplies 117 0 200 200 509.830.534100 Building & Grounds Supplies 1,147 1,184 2,500 2,500 509.830.534200 Equipment Maintenance Supplies 6,312 5,996 9,000 9,000 509.830.534300 Vehicle Maintenance Supplies 4,756 5,910 6,000 7,000 509.830.534400 Protection and Safety Equipment 652 3,233 2,000 2,400 509.830.534500 Hand Tools 2,341 4,031 3,000 7,700 509.830.534600 Uniforms and Accessories 205 0 300 300 509.830.534700 Automotive Tires/Tubes 0 32 500 1,000 509.830.535900 Other Operating Supplies 29 166 500 500 509.830.536200 Chemicals 480 0 500 500 509.830.537300 Lubricants & Motor Oils 0 8 500 500 509.830.537900 Fuel 3,965 2,629 3,000 5,000 509.830.538100 Inventory Adjustments 1,114 (18,385) 2,500 2,500 509.830.538200 Core Reimbursements (37) 0 500 500
TOTAL COMMODITIES 21,081 5,234 32,300 40,600
509.830.541200 Meal On Duty 0 96 300 300 509.830.541300 Sundry Charges 97 112 250 250
TOTAL OTHER CHARGES 97 208 550 550
509.830.551200 Technical/Digital Equipment 2,451 7,455 0 0 509.830.551400 Machinery and Equipment 995 0 42,000 0
TOTAL CAPITAL OUTLAY 3,446 7,455 42,000 0
GRAND TOTAL 272,210 265,436 338,207 315,107
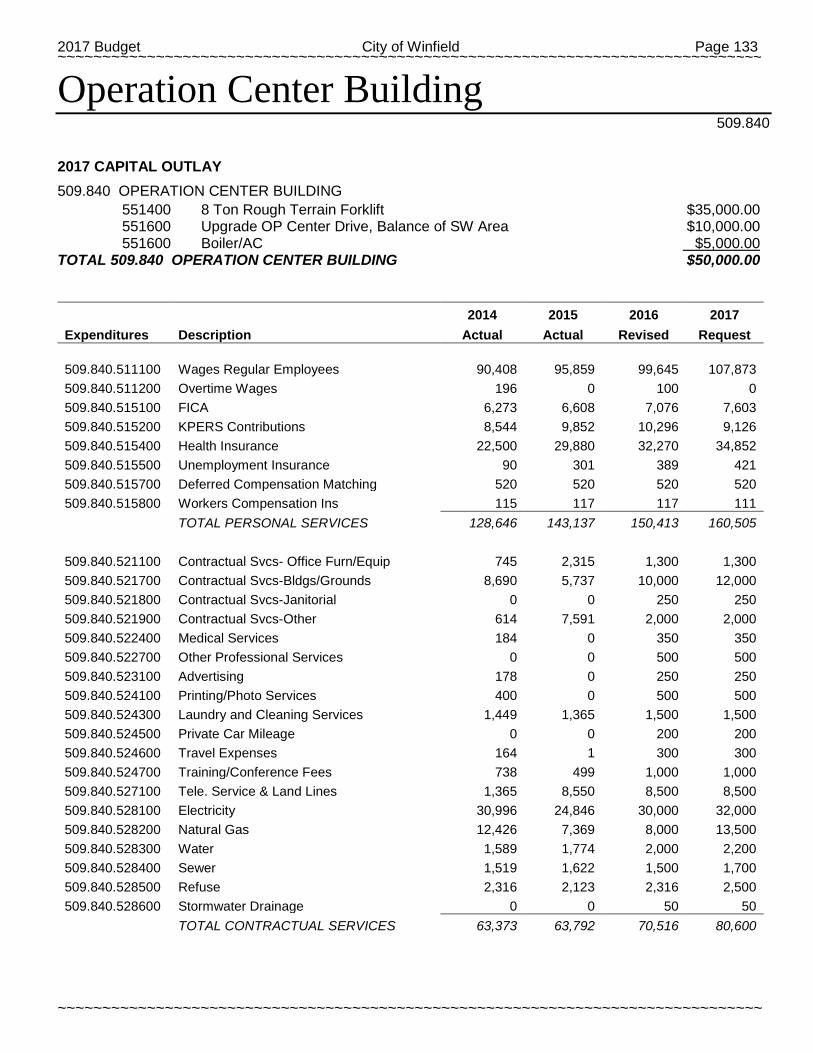
2017 Budget City of Winfield Page 133 ~~~~~~~~~~~~~~~~~~~~~~~~~~~~~~~~~~~~~~~~~~~~~~~~~~~~~~~~~~~~~~~~~~~~~~~~~~~~~~~
~~~~~~~~~~~~~~~~~~~~~~~~~~~~~~~~~~~~~~~~~~~~~~~~~~~~~~~~~~~~~~~~~~~~~~~~~~~~~~~
Operation Center Building 509.840
2017 CAPITAL OUTLAY
509.840 OPERATION CENTER BUILDING 551400 8 Ton Rough Terrain Forklift $35,000.00 551600 Upgrade OP Center Drive, Balance of SW Area $10,000.00 551600 Boiler/AC $5,000.00
TOTAL 509.840 OPERATION CENTER BUILDING $50,000.00
2014 2015 2016 2017
Expenditures Description Actual Actual Revised Request
509.840.511100 Wages Regular Employees 90,408 95,859 99,645 107,873 509.840.511200 Overtime Wages 196 0 100 0 509.840.515100 FICA 6,273 6,608 7,076 7,603 509.840.515200 KPERS Contributions 8,544 9,852 10,296 9,126 509.840.515400 Health Insurance 22,500 29,880 32,270 34,852 509.840.515500 Unemployment Insurance 90 301 389 421 509.840.515700 Deferred Compensation Matching 520 520 520 520 509.840.515800 Workers Compensation Ins 115 117 117 111
TOTAL PERSONAL SERVICES 128,646 143,137 150,413 160,505
509.840.521100 Contractual Svcs- Office Furn/Equip 745 2,315 1,300 1,300 509.840.521700 Contractual Svcs-Bldgs/Grounds 8,690 5,737 10,000 12,000 509.840.521800 Contractual Svcs-Janitorial 0 0 250 250 509.840.521900 Contractual Svcs-Other 614 7,591 2,000 2,000 509.840.522400 Medical Services 184 0 350 350 509.840.522700 Other Professional Services 0 0 500 500 509.840.523100 Advertising 178 0 250 250 509.840.524100 Printing/Photo Services 400 0 500 500 509.840.524300 Laundry and Cleaning Services 1,449 1,365 1,500 1,500 509.840.524500 Private Car Mileage 0 0 200 200 509.840.524600 Travel Expenses 164 1 300 300 509.840.524700 Training/Conference Fees 738 499 1,000 1,000 509.840.527100 Tele. Service & Land Lines 1,365 8,550 8,500 8,500 509.840.528100 Electricity 30,996 24,846 30,000 32,000 509.840.528200 Natural Gas 12,426 7,369 8,000 13,500 509.840.528300 Water 1,589 1,774 2,000 2,200 509.840.528400 Sewer 1,519 1,622 1,500 1,700 509.840.528500 Refuse 2,316 2,123 2,316 2,500 509.840.528600 Stormwater Drainage 0 0 50 50
TOTAL CONTRACTUAL SERVICES 63,373 63,792 70,516 80,600
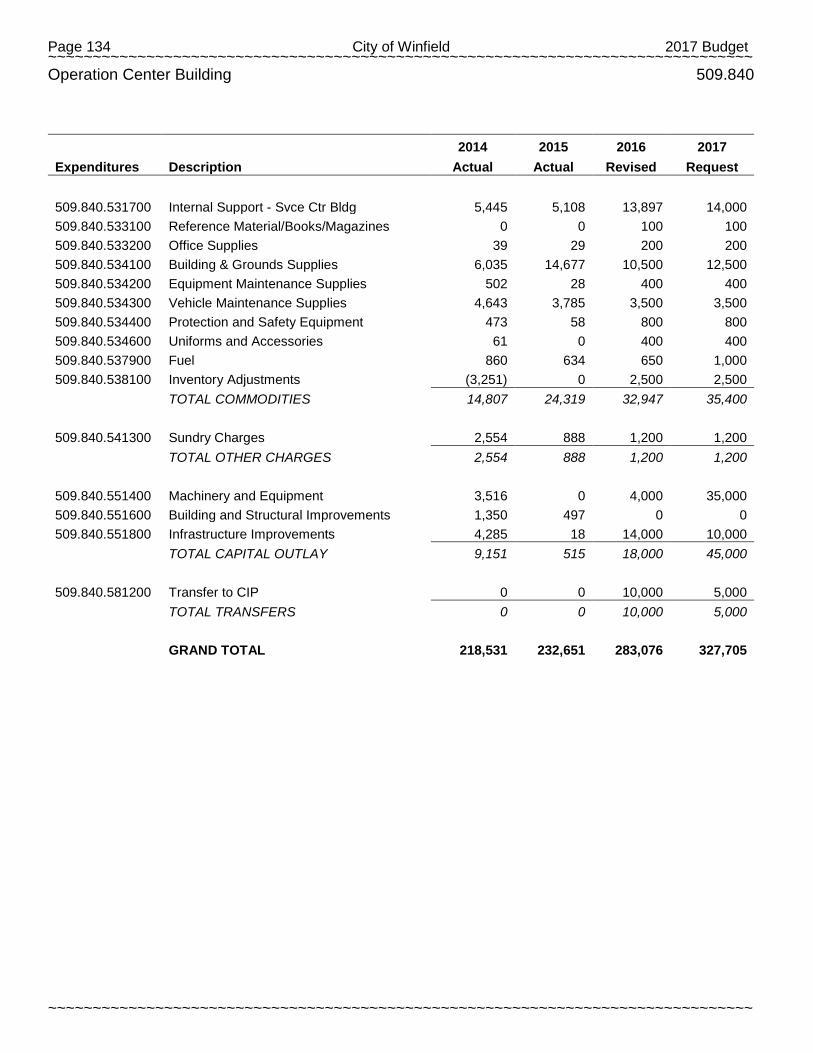
Page 134 City of Winfield 2017 Budget ~~~~~~~~~~~~~~~~~~~~~~~~~~~~~~~~~~~~~~~~~~~~~~~~~~~~~~~~~~~~~~~~~~~~~~~~~~~~~~~
~~~~~~~~~~~~~~~~~~~~~~~~~~~~~~~~~~~~~~~~~~~~~~~~~~~~~~~~~~~~~~~~~~~~~~~~~~~~~~~
Operation Center Building 509.840
2014 2015 2016 2017
Expenditures Description Actual Actual Revised Request
509.840.531700 Internal Support - Svce Ctr Bldg 5,445 5,108 13,897 14,000 509.840.533100 Reference Material/Books/Magazines 0 0 100 100 509.840.533200 Office Supplies 39 29 200 200 509.840.534100 Building & Grounds Supplies 6,035 14,677 10,500 12,500 509.840.534200 Equipment Maintenance Supplies 502 28 400 400 509.840.534300 Vehicle Maintenance Supplies 4,643 3,785 3,500 3,500 509.840.534400 Protection and Safety Equipment 473 58 800 800 509.840.534600 Uniforms and Accessories 61 0 400 400 509.840.537900 Fuel 860 634 650 1,000 509.840.538100 Inventory Adjustments (3,251) 0 2,500 2,500
TOTAL COMMODITIES 14,807 24,319 32,947 35,400
509.840.541300 Sundry Charges 2,554 888 1,200 1,200
TOTAL OTHER CHARGES 2,554 888 1,200 1,200
509.840.551400 Machinery and Equipment 3,516 0 4,000 35,000 509.840.551600 Building and Structural Improvements 1,350 497 0 0 509.840.551800 Infrastructure Improvements 4,285 18 14,000 10,000
TOTAL CAPITAL OUTLAY 9,151 515 18,000 45,000
509.840.581200 Transfer to CIP 0 0 10,000 5,000
TOTAL TRANSFERS 0 0 10,000 5,000
GRAND TOTAL 218,531 232,651 283,076 327,705