Budget Priorities Statement - Tax...
71
1 Australian Council of Social Service Budget Priorities Statement 2016 - 17
Transcript of Budget Priorities Statement - Tax...

1
Australian Council
of Social Service
Budget Priorities Statement
2016 - 17

2
First published in 2016 by the
Australian Council of Social Service
Locked Bag 4777
Strawberry Hills, NSW, 2012 Australia
Email: [email protected]
Website: www.acoss.org.au
ISSN: 1326 7124
ISBN: 978 0 85871 027 6
© Australian Council of Social Service
This publication is copyright. Apart from fair dealing for the purpose of private study, research,
criticism, or review, as permitted under the Copyright Act, no part may be reproduced by any process
without written permission. Enquiries should be addressed to the Publications Officer, Australian
Council of Social Service. Copies are available from the address above.
Front cover image © istockphoto/acosspublications
Who we are
ACOSS is the peak body of the community services and welfare sector and the national voice for the
needs of people affected by poverty and inequality.
Our vision is for a fair, inclusive and sustainable Australia where all individuals and communities can
participate in and benefit from social and economic life.
What we do
ACOSS leads and supports initiatives within the community services and welfare sector and acts as
an independent non-party political voice.
By drawing on the direct experiences of people affected by poverty and inequality and the expertise
of its diverse member base, ACOSS develops and promotes socially and economically responsible
public policy and action by government, community and business.

3
Contents
Overview: a balanced approach to fiscal sustainability .................................................................................... 5
The economic and fiscal outlook .................................................................................................................... 10
Overview of recommendations ...................................................................................................................... 10
Securing the revenue we need to meet the community’s needs .................................................................... 16
1.1 Investment income ............................................................................................................................ 17 1.2 Retirement incomes .......................................................................................................................... 19 1.3 Other proposals to strengthen the personal income tax base .......................................................... 27 1.4 Taxation of charities .......................................................................................................................... 30
2 Increasing participation and reducing poverty for people of working age ............................................ 31
2.1 Working age payments ...................................................................................................................... 31 2.2 Employment services ......................................................................................................................... 36
3 Reducing child poverty: family payments reform ................................................................................. 41
3.1 A fairer reform agenda ...................................................................................................................... 43
4 Improving access to affordable housing ................................................................................................ 45
4.1 Set affordable housing targets .......................................................................................................... 46 4.2 Improve the adequacy of existing housing and homelessness funding agreements ........................ 47 4.3 Establish an Affordable Housing Growth Fund .................................................................................. 48 4.4 Create a new affordable rental private investment scheme ........................................................ 48 4.5 Reform housing taxation ................................................................................................................... 49 4.6 Increase financial assistance to low income renters ......................................................................... 50 4.7 Improve our funding and policy response to homelessness services ............................................... 51
5 Health ................................................................................................................................................... 54
5.1 Invest in prevention ........................................................................................................................... 55 5.2 Redirect existing expenditure including on the Private Health Insurance Rebate towards greater
population health outcomes ............................................................................................................. 55 5.3 Support transparent, accountable universal healthcare ................................................................... 56 5.4 Ensure affordable, timely access to basic oral health ....................................................................... 57
6 Education and early childhood services ................................................................................................ 59
6.1 All children should have access to at least 2 days of care per week ................................................. 61 6.2 Beyond a universal base, fee assistance should be effectively targeted ........................................... 61 6.3 Establish an Aboriginal and Torres Strait Islander community based program within the new Child
Care Safety Net .................................................................................................................................. 62 6.4 Ensure that low income families who are not in paid work are, at a minimum, no worse off ......... 63
7 Supporting effective and innovative community services ..................................................................... 65
7.1 Providing adequate and stable funding streams to support effective services ................................ 65 7.2 Ensuring competition policy reform delivers improved service access and quality .......................... 66 7.3 Social innovation ............................................................................................................................... 67 7.4 Support for charities to diversify funding .......................................................................................... 68

4
Table of abbreviations
ACOSS Australian Council of Social Service
ATO Australian Taxation Office
CGT Capital Gains Tax
CHP Community housing providers
COAG Council of Australian Governments
CPI Consumer Price Index
CRA Commonwealth Rent Assistance
DGR Deductible Gift Recipient
DSP Disability Support Pension
EMSN Extended Medicare Safety Net
FTB Family Tax Benefit
GDP Gross Domestic Product
GFC Global Financial Crisis
MYEFO Mid-Year Economic and Fiscal Outlook
NAHA National Affordable Housing Agreement
NRAS National Rental Affordability Scheme
NCOA National Commission of Audit
NPAH National Partnership Agreement on Homelessness
PBS Pharmaceutical Benefits Scheme
PC Productivity Commission
PHI Private Health Insurance
SNAICC Secretariat of National Aboriginal and Islander Child Care
SAPTO Senior Australians and Pensioners Tax Offset
SPP Special Purpose Payment

5
Australia is a comparatively low taxing and low spending country, with the most tightly
targeted income support system in the OECD. We are facing a medium term budget
challenge, which must be addressed in a way that supports both economic growth and
equity and gives people confidence that funding for vital services is secure into the
future. This requires action to reform wasteful or poorly targeted tax and direct
expenditures, investment to address gaps in the safety net and a fiscal commitment
to fund health, education and social services through and beyond the forward
estimates.
The 2016-17 Budget will be the first budget handed down by the current Treasurer
under the leadership of the Prime Minister Turnbull. It will take place in a federal
election year, in the context of major reform processes of taxation and federation
arrangements and against the backdrop of a broader debate about economic reform.
Key stakeholders have worked hard to build some common ground in this debate,
including on the need to achieve structural budget balance progressively through a
staged reform process over a ten year period. Business, union and community groups
have also agreed that this should be achieved through a combination of tax and
expenditure reforms, while creating space to address some serious holes in the social
safety net including an increase to the unemployment benefit.
At the same time, there is a growing disconnect between the dominant political
narrative about the challenges we face as a nation and what the community actually
wants from our leaders. As Ipsos research found in 2015, the public is
yearning for leaders with long-term vision and plans to address the social and
economic issues and invest in future. Blame for economic woes
has been attributed to short-term thinking, corporate greed and political and
economic mismanagement . 1
Reflecting deep-seated concern at the emergence of the community
wants governments to plan for our future. Meanwhile, job security and
underemployment feature among p biggest worries, especially for young
families with large mortgages, people approaching retirement age and those living in
rural areas where employment options are particularly limited.
1 Ipsos (2015) perspectives on social Mind and Mood Report, http://www.acoss.org.au/wp-content/uploads/2015/06/Ipsos-ACOSS-Report_Final.pdf
6
To set a path to achieve budget balance fairly, in the 2016-17 Budget the Government
should:
1. Set a path towards structural reform of the tax system that delivers increased
revenue fairly and efficiently, supports economic growth and encourages
investment in productive economic activity. This must include major reforms to
superannuation and housing tax concessions to ensure these concessions fulfil
a legitimate purpose;
2. Invest in the capacity, health and wellbeing of people who are unemployed by
delivering a modest increase to the unemployment benefit. This should be
complemented by investment in effective programs to equip people who are
unemployed long term to return to paid work;
3. Invest in a new national affordable housing strategy through a capital injection,
creation of a new rental investment incentive, establishment of a new financing
mechanism to attract institutional investment at scale, a boost to Rent
Assistance and appropriate indexation of housing and homelessness funding.
Action to relieve housing stress cannot be deferred for another year;
4. Redirect wasteful expenditure in the health system to improve the quality and
accessibility of health services, including oral and preventive health services,
for people on low incomes; and, finally
5. Abandon proposed cuts to income support that would adversely affect people
on low and moderate incomes, which have not yet passed the Parliament.
These have now been on the budget books for two years, undermining budget
transparency, and include:
a) Reducing Family Tax Benefit Part B to single parent families and
abolishing end of year supplements, without offsetting measures;
b) Freezing family payment rates;
c) Change to the age of eligibility for the Newstart Allowance, which would
require unemployed young people to survive on the lower youth payment
for longer;
d) The introduction of waiting periods to access income support;
e) And a range of other measures.2
2 Including freezing the free area for allowances which will reduce incomes and incentives for those
working part-time; and abolishing the Pensioner Education Supplement, which will result in income
losses of $36 for eligible recipients, including many single parents.

7
The first two budgets under the Coalition Government have aggressively pursued
expenditure savings while deferring major reform of the tax system. With the
exception of some appropriate retargeting of assistance which ACOSS has supported
(e.g. the reforms to the Age Pension assets test), the overall impact of this approach
has been to impose the burden of budget restraint on those who can least afford it
people on low to moderate incomes who rely on government payments and supports.
Our analysis estimates $15 billion over four years in cuts to basic services and
supports over the last two budgets, in addition to the projected loss of $80 billion in
Commonwealth funding to the states and territories for health and schools over a
decade. We cannot risk any further undermining of our social protection system
without increasing poverty, social exclusion, community division, inequality, and
poorer population health outcomes.
The continuation of an unbalanced approach to fiscal repair which relies exclusively
on spending cuts would be economically, socially and politically irresponsible. With
our spending already so tightly targeted to people on lower incomes, such an approach
will only further hurt the people whom we should be supporting to improve their living
standards.
ACOSS believes that the case for tax reform is compelling and has worked actively
with diverse stakeholders and with government to build momentum for reform and to
identify shared goals. We believe that reform must be structural and must grow the
revenue base fairly, steadily and efficiently. It must focus on major tax concessions
which have unintended or inequitable impacts including superannuation and housing
investment concessions. We would however be very concerned by the announcement
of a reform package which reduced the overall progressivity of the tax system (for
example through a tax mix switch from personal income taxes towards consumption
taxes), relied on compensation to cure inequities in the package, or which failed to
grow the revenue we need to adequately fund health, education and social service
costs.
Together with our state and territory counterparts, we have developed a proposal for
coordinated tax and federation reform to strengthen the Commonwealth/State
revenue base and introduce greater certainty for people about the level of service
access they can expect to receive into the future3. This would be achieved through the
development of community service guarantees in major areas of shared government
responsibility, for example health, housing, disability and early childhood education
3 ACOSS and the State and Territory Councils of Social Service (2015): Fit for purpose: a federation that guarantees the services people need Available: http://www.acoss.org.au/wp-content/uploads/2015/10/COSS-
federation-framework_FINAL.pdf
8
and care. Community service guarantees would specify a set of services that are
available to those who need them, regardless of income or where they live. The
Commonwealth Government would be responsible for ensuring that guarantees and
related outcomes are achieved, while State and Territory Governments would be
responsible for planning and delivery of the services. Costs would be shared according
to a formula set in legislation and would be properly indexed to reflect projected
increases in future costs. In return for these funding guarantees, State and Territory
Governments would be required to provide services in a cost effective way, for
example through investment in prevention and health promotion and reform of
funding to hospitals to increase cost efficiency.
Coordinated reform in this way would help to build public confidence that increases in
public revenue would be directed to fund essential community services, and that this
funding would be prevented from being readily taken away in future. The Government
should ensure that, in moving to develop a tax reform package, it provides certainty
for the community about future health, education and social service funding
arrangements through such a guarantee. We propose a fairer way to finance future
guaranteed increases in health funding as the population ages by tightening the tax
treatment of superannuation fund earnings to increase the proportion of those over
65 years paying income tax (currently less than 20%) when they can afford to do so. A
secure retirement is as much about access to affordable health care as it is about
adequate income.
We support the appropriate targeting of government assistance and have
demonstrated our readiness to endorse reforms that reduce expenditure on particular
social programs or payments where we felt this could be better spent. To this end, we
supported reforms to the pension assets test and the abolition of the Seniors
Supplement to reduce assistance to older people with greater means. We backed the
tightening of the Family Tax Benefit Part B income test under the previous
Government from $150,000 to $100,000 and have indicated support for further
reforms to family payments to more effectively direct assistance to families on the
lowest incomes (e.g. through reduced assistance to couples with older children under
Part B and the gradual phase out of supplements in order to boost payments for single
parents and families with older children). We also advocate for a reduction in the level
of child care subsidy paid to higher income households with a view to diverting funds
towards families struggling with the costs of care or otherwise disadvantaged (for
example, in a remote area).
However, there is a limit to how much more tightly we can target assistance in a system
that is already more tightly targeted than almost every other OECD country and has
9
the lowest unemployment payment. Expenditures on social security payments are
lower than comparable countries: in 2012, they were 8.6% of Gross Domestic Product
(GDP) compared with an OECD average of 12.4%.4 Despite assertions that expenditures
on working age payments are a growing pressure on the Federal Budget, the facts are
that there has been a long term decline in reliance on working age payments, falling
from nearly one in four in 1996 to less than one in five in 2014.5 In 2014-15, working age
payments such as Newstart Allowance, Disability Pensions and Parenting Payment
made up just 30% of social security expenses.6 As a result of these factors and the
efforts made by the previous and current Government to reduce social security
expenditures, there is now limited scope for further tightening of eligibility for
assistance. To date, there has been little attempt by governments to direct the savings
gained from tightening access to payments to those areas where it is most needed. This
budget must mark a departure from this approach by returning some of the savings
recouped to address the gaps in the social safety net, starting with an increase to the
unemployment payment.
Through the National Reform Summit, business, community and union groups,
including ACOSS, have agreed, as an overarching fiscal goal, that the budget should
be progressively returned to structural balance over ten years through a staged
reform process. The groups have also agreed on a number of fundamental fiscal policy
principles, including that:
Governments have a key role to play in delivering quality services, a social
security safety net and economic and social infrastructure essential for
economic growth;
All expenditure programs, including direct and tax expenditures, should be
subject to rigorous evaluation to ensure efficiency and effectiveness over time;
Where major spending program redesign is undertaken, it should seek to
improve service quality and equitable access, not just efficiency;
Income support payments should be targeted to those who most need them and
gaps in the safety net closed, such as by improving the adequacy of income
support for unemployed people, affordable housing for people on the lowest
incomes and services to people with a disability;
4 OECD Social expenditure data base. See http://www.oecd.org/social/expenditure.htm. 5 Inside Story, 26 November 2015. Available at:
http://insidestory.org.au/is-welfare-sustainable 6 Australian Treasury (2015): Budget Paper 1 2015-16 Commonwealth of Australia available at:
http://www.budget.gov.au/2015-16/content/bp1/html/bp1_bs5-01.htm. Total social security expenses includes
family payments.

10
People on low incomes or who are otherwise vulnerable should be protected
from the impacts of fiscal reform.7
We encourage the Government to build on these foundations in developing its fiscal
strategy for the next financial year and beyond.
The economic and fiscal outlook
While GDP is expected to grow over the coming years, growth expectations were
revised down in MYEFO to 3%. Unemployment is forecast to fall slightly over the
forward estimates, from 6% in 2015-16 to 5.5% in 2018-19 but will remain fairly high.
Wages growth, which has been slow, is projected to be moderate (up slightly from
2.5% in 2015-16 to 3% in 2018-19).
The estimated 2016-17 Budget cash deficit is $33.7 billion.8 Spending as a proportion
of GDP is projected to be down over the forward estimates, but revenue is also
projected to decline due to falling commodity prices, weaker wage and population
growth and weaker equity markets.
Overview of recommendations
We propose that modest additional expenditures of the order of $3.5 billion ($6 billion
in 2017-18) in key priority areas be funded by savings measures, worth an estimated
$4 billion ($9.5 billion in 2017-18).9
Most of our revenue measures would not take effect until at least 2017-18, when the
deficit would be reduced by approximately $4 billion. Our proposals would set the
budget on a sustainable trajectory, with the impact of taxation changes growing in
value over time and steadily eroding the budget deficit. This approach is consistent
with the two stage reform approach agreed by business, union and community groups
with a two year planning and an eight year transition phase. Strengthening
economically efficient tax bases and promoting stronger investment will help make
room for necessary future expenditures in such areas as health, aged care and
disability services as the population ages. Importantly, fiscal rules must be flexible
enough to enable the reallocation of spending between portfolios where there is a
pressing imperative to do so and this is in the national interest. The reallocation of
resources to reduce poverty nationally is such a case.
7
Chamber of Commerce and Industry, the Australian Council of Trade Unions, the Australian Council of Social
Service, the Australian Industry Group, the Australian Youth Affairs Coalition, the Business Council of Australia,
COTA, Seniors Australia, 8 MYEFO 2015-16, Table 1.1, at: http://budget.gov.au/2015-16/content/myefo/html/01_part_1-01.htm. 9 All costings are estimates and intended as a guide only.
11
Proposed new expenditures include the following key recommendations (for full list,
see table 1):
Increase allowance payments, including the unemployment payment, by $53
per week for single people (costing $1400 million in 2016-17; $1600 million in
2017-18);
Index allowance payments annually to wages (costing $60 million in 2016-17;
$100 million in 2017-18);
Establish an Affordable Housing Growth Fund (costing $750 million in 2016-17;
$1000 million in 2017-18);
Increase the maximum rate of Rent Assistance by 30% (costing $750 million in
2016-17; $770 million in 2017-18);
Increase investment in community services to previous funding levels and index
community services funding to wage movements ($370 million in 2016-17;
$2213 million in 2017-18); and
Extend DGR status to a wider range of charities to support funding
diversification ($700 million in 2016-17; $800 million in 2017-18).
Reallocation of existing expenditure is proposed in a number of areas to improve
targeting and/or impact. A number of these proposals are revenue neutral, while
others would involve some new investment, but with additional costs offset by savings.
Recommendations include:
Redirecting funds for ineffective employment programs, especially Work for
the Dole, to more effective and flexible employment assistance;
Restructuring the family payments system to better target assistance and
reduce child poverty through the gradual phase out of end of year supplements
(and redirection of savings from legislated changes to Part B for couples),
offsetting losses for low income families through indexation of Family Tax
Benefit (FTB) Part A to wages, the introduction of a new middle benchmark for
Part A and a new Sole Parent Supplement paid at a higher rate than the current
Part B payment;
Redirecting part of the savings achieved through reform of housing tax
concessions to fund a rental investment incentive for new housing stock, paid
at a higher rate for affordable dwellings;
Redirecting health expenditure through the removal of the Private Health
Insurance Rebate and the Extended Medicare Safety Net to public hospitals and
community based services and increased investment in preventive and dental
health care services;

12
Retargeting investment in early childhood education and care by reducing the
subsidy rate and cap for higher income households, to ensure that low income
families can access a minimum of 2 days of education and care per week
(regardless of activity) and to fund an Aboriginal and Torres Strait Islander
community based program;
Simplify and better target concessions for superannuation contributions
through the creation of a two-tier annual rebate paid into the fund, that is
capped at a contribution level sufficient to support (along with the Age Pension)
an acceptable retirement income for a typical worker (revenue neutral).
Revenue and savings measures include the following key recommendations (for full
list, see table 1):
Abolish certain Capital Gains Tax concessions for small business assets (saving
$0 in 2016-17; $1000 million in 2017-18);
Tax superannuation fund earnings more consistently (saving $0 in 2016-17;
$1300 in 2017-18);
Restrict the Seniors and Pensioners Tax Offset (SAPTO) to pensioners (saving
$200 million in 2016-17; $200 million in 2017-18);
Increase the superannuation preservation age to align it with the Age Pension
age (savings beyond the forward estimates);
Remove grandfathering arrangements for concessions for non-
superannuation termination payments and unused leave ($400 million in 2016-
17; $500 million in 2017-18);
Curb the use of private trusts to avoid personal income tax (saving $0 in 2016-
17; $1500 million in 2017-18); and
Curb the use of private companies to avoid personal income tax (saving $0 in
2016-17; $1000 million in 2017-18).
Finally, the 2016-17 Budget should include an analysis of the impact of budget
measures on different households. Prior to 2014, the budget papers included budget
outcomes tables showing the distributional impact of budget measures on real
disposable incomes. These tables were not published in the 2014-15 or 2015-16
budgets, resulting in a loss of transparency. The budget papers should include an
analysis of budget impacts by reference to income quintile, household type (e.g. couple
household with children, single parent with children, single person etc), gender and
key population groups (people with disability, Aboriginal and Torres Strait Islander
people etc). This would be an important step in improving budget transparency and
government accountability for budget impacts on individuals and families.

13
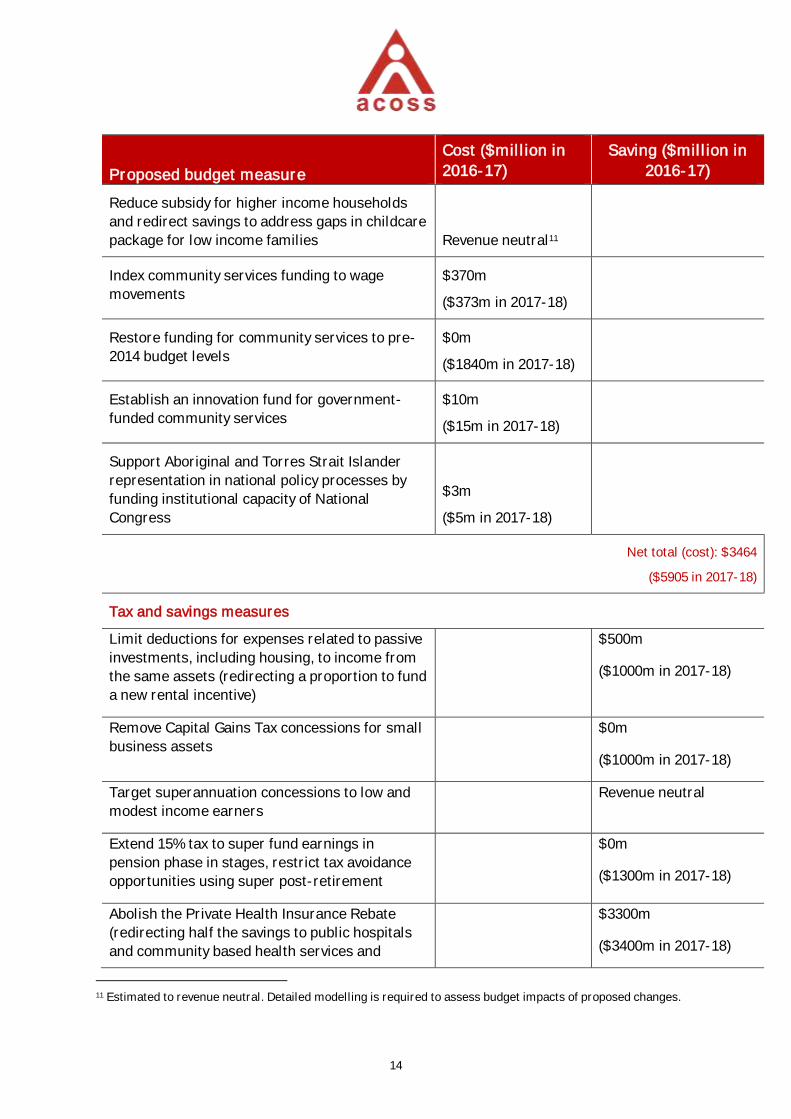
Table 1: Summary of recommendations
Proposed budget measure
Cost ($million in
2016-17)
Saving ($million in
2016-17)
Expenditure measures
Strengthen flexible investment in people
unemployed long term by redirecting resources
from Work for the Dole and the Job Commitment
Bonus
$80m
($130m in 2017-18)
Increase allowance payments by $53 per week $1400m
($1600m in 2017-18)
Index allowance payments to wages $60m
($100m in 2017-18)
Establish an independent commission to advise
Government on payment rates
$5m
($7m in 2017-18)
Reform family payments to reduce child poverty
and better target to need Revenue neutral 10
Establish an Affordable Housing Growth Fund $750m
($1000m in 2017-18)
Establish a housing finance intermediary $20m
($35m in 2017-18)
Increase Commonwealth Rent Assistance by
30%
$750m
($770m in 2017-18)
Index the National Partnership Agreement on
Homelessness
$3m
($3m in 2017-18)
Improve adequacy of indexation of the National
Affordable Housing Agreement
$13m
($27m in 2017-18)
10 Estimated to revenue neutral. Detailed modelling is required to assess budget impacts of proposed changes.
14
Proposed budget measure
Cost ($million in
2016-17)
Saving ($million in
2016-17)
Reduce subsidy for higher income households
and redirect savings to address gaps in childcare
package for low income families Revenue neutral11
Index community services funding to wage
movements
$370m
($373m in 2017-18)
Restore funding for community services to pre-
2014 budget levels
$0m
($1840m in 2017-18)
Establish an innovation fund for government-
funded community services
$10m
($15m in 2017-18)
Support Aboriginal and Torres Strait Islander
representation in national policy processes by
funding institutional capacity of National
Congress
$3m
($5m in 2017-18)
Net total (cost): $3464
($5905 in 2017-18)
Tax and savings measures
Limit deductions for expenses related to passive
investments, including housing, to income from
the same assets (redirecting a proportion to fund
a new rental incentive)
$500m
($1000m in 2017-18)
Remove Capital Gains Tax concessions for small
business assets
$0m
($1000m in 2017-18)
Target superannuation concessions to low and
modest income earners
Revenue neutral
Extend 15% tax to super fund earnings in
pension phase in stages, restrict tax avoidance
opportunities using super post-retirement
$0m
($1300m in 2017-18)
Abolish the Private Health Insurance Rebate
(redirecting half the savings to public hospitals
and community based health services and
$3300m
($3400m in 2017-18)
11 Estimated to revenue neutral. Detailed modelling is required to assess budget impacts of proposed changes.

15
Proposed budget measure
Cost ($million in
2016-17)
Saving ($million in
2016-17)
delivering additional investment in preventive
and dental health services)
Restrict Senior Australians and Pensioners Tax
Offset (SAPTO) to pensioners
$200m
($200m in 2017-18)
Increase the superannuation preservation age
over time
$0m
($0m in 2017-18)12
Remove grandfathering arrangements for
concessions for non-superannuation termination
payments and unused leave
$400m
($500m in 2017-18)
Curb the use of private trusts to avoid personal
income tax
$0m
($1500m in 2017-18)
Curb the use of private companies to avoid
personal income tax
$0m
($1000m in 2017-18)
Extend Deductible Gift Recipient status $700m
($800m in 2017-18)
Abolish the Extended Medicare Safety Net
$410m
($420m in 2017-18)
Net total (savings): $4110 million
($9520 million in 2017-18)
TOTAL COST $3464million
($5905 million in 2017-18)
TOTAL SAVINGS $4110 million
($9520 million in 2017-18)
NET TOTAL (Saving) $646 million ($3615 million in 2017-18)
12 Impact beyond forward estimates.
16
Australia is the sixth lowest taxing country of 34 OECD countries, ahead of only Mexico,
Chile, the United States Switzerland and Korea.13 In the year of the Global Financial
Crisis (GFC), tax revenue fell by 2% of GDP. Eight years later, it is still 1.4% of GDP
less than its pre-GFC level of 23.7% of GDP.14 The main reason for this very slow
revenue recovery is that the mining boom has subsided and has not been replaced by
new drivers of economic growth. This is the main reason that the budget is now in
deficit, together with the impacts of a range of generous tax breaks, rebates and
spending measures introduced during the boom years, particularly by the previous
Coalition government.
It is clear that both Federal and State tax revenues will have to increase in future years
to help restore public budgets and meet the cost of services for an ageing population,
including funding growing areas of priority expenditure such as the National Disability
Insurance Scheme and needs based schools funding. This should be done in a way
that minimises any harm to equity or economic development. Income tax bracket
creep cannot do all the work to restore public revenue. On the other hand, we cannot
afford a repeat of the eight successive income tax cuts that seriously eroded income
tax revenues during the 2000s. Income taxes are the fairest way to raise public
revenue and governments should strengthen that tax base, not undermine it. This can
be achieved by removing or reducing the impact of the most poorly designed,
inefficient and inequitable tax shelters.
loopholes, this means that higher tax rates are required to raise the same amount of
revenue. This is inefficient as well as inequitable. There is a case for taxing investment
income at lower rates than income from paid work on economic efficiency grounds
given that capital is more mobile and sensitive to tax levels. It is vital, however, to
ensure that taxes on different investment incomes are as consistent as possible.
Otherwise, the tax system will distort economic decision-making in ways that are
13 OECD, Revenue Statistics, OECD Member Countries: Comparative Tables. Available at:
https://stats.oecd.org/Index.aspx?DataSetCode=REV Data for 2013. 14 http://www.budget.gov.au/2015-16/content/myefo/download/MYEFO_2015-16_Final.pdf

17
1.1 Investment income
A good example of the impact of these distortions is the 50% discount on tax rates for
capital gains received by individuals and trusts. Treasury estimates that the lost
revenue from this tax break costs $6 billion per annum. This encourages excessive
speculative investment in property and other assets yielding capital gains and it is one
of the reasons for the steep inflation in home prices we have experienced since the
late 1990s. The concessional treatment of capital gains compared with other
investment income (such as interest and active business income) diverts investment
from other purposes as well as fuelling boom and bust cycles in the economy. The
concessional tax treatment of capital gains also overwhelmingly benefits the top 20%
of taxpayers, who receive two-thirds of all capital gains.
This tax distortion is exacerbated by the unlimited deductions for losses on
investments in property and other assets yielding capital gains such as shares,
agricultural schemes, and collectables. Australia is unusually generous in placing few
investment for a number of years to maximise deductions against their other income.
These deductions (including interest on loans) are poorly matched with income from
the investment, which mainly takes the form of capital gains. The deductions are
marginal
tax rate, but income from these investments mainly takes the form of capital gains
which are only taxed at half that rate, and often years later when the asset is sold. The
result is an even stronger tax bias in favour of debt-financed investment in property
shares and other assets.
Negative gearing is discussed further in Chapter 4 (Housing). Our proposal is to
quarantine deductions for expenses relating to passive investment in housing, shares,
collectables and similar assets purchased after 1 January 2017 to offset income
received from those assets, including capital gains realised on their subsequent sale.
be claimed under the present rules. Part of the revenue saved from this reform would
be used to introduce an investment incentive (tax offset) for new housing dwellings
whose construction costs fall below a (relatively high) value. The incentive would be
paid at a substantially higher rate (either as a tax offset or direct payment) for the
construction of new dwellings used to provide affordable housing (where rents are
held at least 20% below market rents). This tax offset or payment would be available
for a maximum of ten years following construction. These new investment incentives
18
would form part of a wider set of affordable housing policies discussed in Chapter 4.
Unlike negative gearing they should strengthen investment in new housing stock and
could support institutional investment in rental housing. As part of the broader
affordable housing strategy in Chapter 4, targets should be set for the share of
housing attracting the incentive that is affordable. The impact of the incentive on rental
housing investment, especially affordable housing, should be reviewed within three
years of its implementation.
To reduce the distortion of investment decisions by the 50% tax discount for capital
gains, the Henry Report recommended a common (lower) tax discount for most major
forms of investment income apart from superannuation and owner occupied housing.
This would increase tax rates on capital gains and reduce those applying to other
investment incomes such as bank interest and housing rents. This proposal has merit
but is best introduced as part of a wider reform of the tax system. A sensible place to
begin reform of the tax treatment of capital gains in this budget is to reduce the
additional concessions that apply to capital gains realised on the sale of certain small
business assets. The current 50% tax discount is doubled in many cases, and there
avoid paying Capital Gains Tax (CGT) altogether, an outcome that is inequitable and
hard to justify.
The original purpose of the additional small business concessions was to enable small
business owners to use the sale of their business assets to fund their retirement.
However this is a risky approach to retirement saving and these special tax breaks
encourage over-investment in business assets as against other strategies to improve
business profitability and to save for retirement. Small business owners should be
encouraged to save for their retirement through superannuation rather than by
avoiding tax on capital gains.
The integrity of the CGT system would also be strengthened by our recommendations
to reduce opportunities for the avoidance of CGT by shifting assets into self-managed
superannuation funds, discussed below.
Recommendation 1: Deductions for expenses for investments in assets such as
property and shares should be limited and the existing tax concessions for
residential property investment replaced by a new rental housing investment
incentive.
19
(1) Income tax deductions for expenses (such as interest payments on debt)
relating to passive investments in such assets yielding capital gains (such as
housing, shares and collectables) should be limited to income received from
those assets, including capital gains realised on subsequent sale. This should
apply to all new investments of this type entered into after 1 January 2017.
(2) Part of the revenue saved from this measure should be used to introduce a two-
tier rental housing investment incentive paid as an annual tax offset for a fixed
period of ten years in respect of new dwellings or improvements for residential
rental purposes, below a fixed construction cost. A substantially higher rate
s part of a
wider package of incentives to support investment in affordable housing.
Saving: $500 million ($1,000 million in 2017-18)
Recommendation 2: Certain CGT concessions for small business assets should
be removed.
The following tax concessions for capital gains from the disposal of small business
assets should be abolished from 1 July 2017:
The additional 50% discount for these capital gains;
The exemption for gains on assets held for over 15 years; and
The exemption for gains used for retirement purposes.
Saving: $0 ($1,000 million 2017-18)
1.2 Retirement incomes
The current set of retirement and age-based tax concessions are not fit for purpose.
Along with the Age Pension and essential services such as health and aged care, their
purpose should be to enable people to achieve an acceptable living standard in
retirement. Instead, they have become a wealth and estate management tool for
higher income earners, who do not need additional public support for their retirement,
and are unlikely to rely on an Age Pension in any event. This is undermining the
personal income tax base for older people at a time when expenditures on health and
aged care for an ageing population are projected to increase strongly. At the same
time, the majority of wage earners are short changed by the present superannuation
system, often paying more tax on their superannuation contributions than they would

20
on their wages. This problem will soon be exacerbated by the removal of the Low
Income Superannuation Contribution.
Superannuation tax concessions are the largest component of tax expenditures,
totalling $30 billion in 2015-16, broadly equivalent to the cost of the Age Pension.15 Tax
concessions for contributions are poorly targeted, saving high income earners over 30
cents in tax per dollar contributed by their employers while low income earners
typically pay 15 cents in the dollar more in tax than they would on their wages. Far
from alleviating budget pressures as the population ages, current superannuation tax
expenditure settings are contributing to our budget problems. Some 30% of the value
of superannuation tax breaks goes to the top 10% of income earners and only 20% are
received by the bottom 50% of income earners.16 Men in the top 10% of the wage
distribution receive more from government in superannuation tax exemptions than
they would if they received the full Age Pension.17 For a system that was at least partly
intended to relieve government reliance on public funding as the population ages, this
is a poor public policy outcome.
The unfair and complex system of tax concessions for superannuation contributions
(including the deduction for contributions by self-employed people and the co-
contribution) should be replaced with a simpler taxation structure in which
contributions are ta
superannuation rebate is paid into their superannuation account. Tax would be
deducted by employers from the contributions they forward to superannuation funds
and the rebate would be paid by the Australian Taxation Office (ATO) into the fund at
the end of the tax year.
-20-
to a low level of annual contributions, plus a 20% rebate up to an annual concessional
contributions cap of $20,000.
The purpose of the 100% (dollar for dollar) component of the proposed rebate is to
boost superannuation savings for people on very low incomes, especially women in
low paid part time jobs. This 100% component would be paid in respect of all annual
contributions up to a low cap, for example $500 which is close to the minimum annual
employer contribution required under the superannuation guarantee.
15 Australian Treasury (2015): Mid-Year Economic and Fiscal Outlook (MYEFO), Commonwealth of Australia.
Available: http://www.budget.gov.au/2015-16/content/myefo/download/MYEFO_2015-16_Final.pdf 16 Treasury (2013) Highlights of Treasury paper presented to Superannuation Roundtable in April 2012,
Commonwealth of Australia. 17 Ibid.

21
The purpose of the 20% rebate for contributions above this (low) level is to support
compulsory saving for retirement and encourage voluntary saving to achieve an
acceptable standard of living in retirement. The 20% rebate would be capped at a
lower level than the current concessional cap ($30,000 to $35,000) - for example
$20,000. This level of annual contributions should be sufficient, over a typical career,
to enable a fulltime employee on the median wage to attain an adequate retirement
income, taking account of Age Pension entitlements. As the Grattan Institute has
shown, contributions above this level (around one-quarter of average fulltime
earnings) are usually made by people with high incomes, or as part of a tax avoidance
strategy post-retirement (discussed below).18
The proposed rebate would simplify the system and make tax support more visible to
encourage retirement saving. Although it would not be income-tested, it would greatly
improve equity in superannuation. It is consistent with the superannuation reform
disposable incomes. It would leave the majority of superannuation fund members (up
to annual incomes of around $150,000 where contributions are below $20,000) better
off in retirement, while curbing concessions for the top 10% or so of taxpayers.
The annual contributions cap would be adjusted to ensure that the replacement of
existing tax concessions for contributions with the new rebate is revenue neutral (so
the $20,000 figure is illustrative).
To limit tax concessions for superannuation fund earnings and benefits for people
-concessional contributions
should no longer be allowed to accumulate the annual cap over a three year period.
Higher contributions caps for older workers and lifetime contribution caps may appear
to be fair at face value but in overall terms they mainly benefit people on the highest
incomes, who have the greatest capacity to take advantage of these concessions. They
are also contrary to the purpose of superannuation which is to support long term
Retirement-related tax concessions are seriously undermining the personal income
tax base among older people. As the population ages, governments will face
increasing and legitimate demands on health and aged care services. However, less
than 20% of individuals over the age of 64 pay any income tax, despite increases in the
incomes of this age cohort from employment, investments and superannuation. This
18
22
2014 Budget decision to cut the indexation of health funding for the States (reducing
er people are increasingly worried that
health and aged care services may be not available to them when they are needed. We
need serious policy changes to equitably and sustainably meet the health, aged care
and other needs of an ageing population without imposing unaffordable user charges
or co-payments for universal services.
The fairest way to pay for the increasing cost of these services is through the personal
income tax system so that people contribute according to their ability to pay. We
propose that the income tax be strengthened in three ways for this purpose, and that
the revenue savings be earmarked (though, as with the Medicare Levy, not strictly
hypothecated), to restore sustainable funding for health and aged care:
By restricting SAPTO to pensioners;
By taxing superannuation fund earnings (but not benefits) at the same 15% rate
The 2% Medicare Levy is levied on much the same basis as personal income tax. This
means that individuals can avoid contributing to the cost of essential health care
services using tax shelters such as capital gains, salary sacrifice arrangements,
negative gearing, and private companies or trusts. As an alternative to increasing the
propose that these forms of tax-sheltered income be included in the base. This is
similar to the current treatment of tax shelters in some social security income tests.
Ideally, these tax shelters would be comprehensively reformed, but broadening the
base of the Medicare Levy in this way would be a first step in that direction.
SAPTO is one cause of revenue erosion. What began as a rebate to prevent maximum
rate pensioners from having to pay tax has become a general tax free threshold of
$32,000 for singles and $58,000 for a couple over 64 years in addition to any tax free
superannuation payments. This is 50% higher than the effective tax free thresholds
for people of working age. It cannot be justified on work incentive grounds since
additional tax breaks for older workers are as likely to encourage them to retire later
(because they can reach their retirement income target sooner) as to remain in paid
work for longer.
ways in which well-off individuals can legally avoid paying income tax once they reach
55 years or over. When taxes on most superannuation benefits for people over 60 years
were abolished in 2006, during the boom era, this was not accompanied by the removal

23
of the tax free status of fund earnings for funds paying a retirement pension. As a
other investment income though their superannuation accounts and reduce their
effective tax rate on at least part of that income to zero or 15%. They can do so without
actually saving more for retirement. Superannuation in the retirement phase has
become a tax avoidance tool rather than a retirement income system. The use of this
churning strategy to avoid personal income should be curbed by subtracting any
benefit payments from annual contributions attracting tax concessions so that only
net contributions are taxed at the concessional rate.
People can also avoid paying tax on capital gains accrued through their working lives
by keeping assets in a self-managed superannuation fund until they reach the age of
, including
capital gains, are normally tax free. Similarly, they can avoid paying tax above 30% on
income from assets held in a private company and then pay zero tax on such income
once they reach 60 years.
Individuals can readily avoid the existing 17% tax on superannuation assets passed to
their estate by shifting superannuation assets from concessional to non-concessional
accounts. In this way, superannuation has become an estate management tool as well
as a tax avoidance tool.
A key flaw in the tax treatment of superannuation in retirement is the artificial
-retirement) in which fund earnings
-retirement) in which they are tax free.
This distinction is artificial, because individuals can contribute to superannuation and
be paid a superannuation pension at the same time.
The Henry Report recommended that fund earnings be taxed at the same rate in both
phases, though at less than 15%. Given the fiscal challenges facing this and future
governments as the population ages, and the fact that taxes on superannuation
benefits have been abolished, there is a strong case for applying the standard 15% tax
rate to fund earnings in both phases. This simple change would greatly improve the
integrity of the income tax system for older people and raise revenue for health and
aged care services. In addition, steps should be taken to ensure that accrued capital
gains from assets held in self-managed funds are properly taxed in retirement, and
cannot be avoided. The purpose of superannuation is to improve retirement incomes,
not those of adult children.
24
To keep the economy growing and fund essential services as the population ages, it is
vital that more mature age people retire later, and retire gradually by working on a
part-time or temporary basis after leaving their fulltime jobs. An important policy
change to encourage people to do so is to raise the preservation age for access to
superannuation from 55 years so that it eventually meets the forecast Age Pension
age of 67 years (with exemptions for particular groups). A lower qualifying age for
superannuation than for the Age Pension cannot be justified.
The preservation age should continue to rise beyond the legislated age of 60, at one
year per annum from 2025, until it reaches age 67 in 2032. Such a policy would be
much fairer and cause less hardship than an increase in the pension age, since most
people who rely mainly on social security in mature age are those who have little
choice but to retire at 67 or earlier such as people with disabilities or caring
responsibilities, and Aboriginal and Torres Strait Island people who have a much lower
life expectancy.
A higher preservation age is likely to have a substantial impact on the workforce
participation decisions of those who do have a choice to retire later (mainly people on
higher incomes). Even if the immediate effect on their disposable incomes is not
substantial (given that most baby boomers currently have low superannuation
balances), it would send a strong signal to employers and employees that people are
generally expected to work until at least 67 years.
Although this reform would not begin to affect access to superannuation until 2025 (by
which time we expect typical retirement ages will have increased significantly), early
access arrangements should be established for individuals who have little choice but
to retire sooner due to disabilities or caring roles. Options include allowing access
from age 60 (the preservation age that will apply when the proposed reform
commences in 2025) for people whose impairments or caring roles would ordinarily
qualify them for certain social security payments (whether or not they actually receive
a Disability Support Pension or Carer Payment), or by allowing withdrawals earlier
than the preservation age for any purpose up to modest annual and lifetime limits. If
implemented in conjunction with an increase in the level of compulsory saving this
should have no adverse impact on living standards in retirement, and in any event
many people on low incomes have as much need to draw upon their savings (for
example due to unemployment, or to meet child rearing costs) during working life as
they do after retirement. Account should be taken of the lower life expectancy of
Aboriginal and Torres Strait Islander peoples.
25
Recommendation 3: Simplify concessions for superannuation contributions
(1) All tax concessions for superannuation contributions should be replaced in a
revenue neutral way by a two-tier annual rebate paid into the fund, that is
capped at a contribution level sufficient to support (along with the Age Pension)
an acceptable retirement income for a typical worker.
-20-
- 100 cents per dollar contributed from any source up to $500 (indexed to
movements in average fulltime earnings), to support retirement saving
by low paid part-time workers and replace the superannuation co-
contribution;
- Plus 20 cents per additional dollar contributed from any source up
$20,000 indexed to movements in average fulltime earnings (less than
the present concessional contribution caps of $30,000 and $35,000).
(3) The rebate should be reduced to the extent that an individual withdraws funds
from their superannuation account in the same year as they make a
contribution, so that only net additions to savings attract a tax concession.
(4) The annual non-concessional contributions cap should be reduced from six
times to three times the concessional cap, and the ability to contribute up to
ibutions within the cap in a single year should be removed.
Cost: Revenue neutral
Recommendation 4: Superannuation fund earnings should be taxed more
consistently to help pay for health and aged care services:
(1) The 15% tax on fund earnings in the accumulation phase should extend to the
pension phase over a five year period from July 2017 (with a 3% increase each
year).
(2) This tax should be offset by a 15% rebate (minus any imputation credits) for
taxpayers over the preservation age whose income (including Age Pension,
(taking account of the proposed adjustments to the SAPTO). The rebate would
be calculated each year by the ATO and deposited into a superannuation fund
chosen by the taxpayer.
26
(3) Ensure that capital gains accrued during working life are taxed appropriately
when assets held within self-managed superannuation funds are disposed, or
on retirement.
(4) Ensure that transfers from superannuation accounts to the estates of deceased
fund members (apart from spouses and dependent children) are taxed at the
statutory rate (17%).
(5) Revenue collected from these measures (which would rise substantially in later
years) should be earmarked (along with the Medicare Levy) for public
expenditure on health and aged care services.
Saving: $0 ($1,300 million in 2017-18)
Recommendation 5: Restrict SAPTO to pensioners
SAPTO should be restricted to individuals entitled to a social security pension, and
redesigned to exclude income within the pe
Saving: $200 million ($200 million in 2017-18)
Recommendation 6: Increase the preservation age so that it corresponds to the
Age Pension access age by 2027.
The preservation age should be progressively raised from 60 years (the present
legislated target) to 67 years by 2032, subject to (and conditional upon) the following
exceptions:
(1) Allow continued access to superannuation from 60 years for individuals who
are unable to continue in paid work due to disabilities, poor health or caring
roles. This may include those whose impairments or caring roles would
ordinarily qualify them for certain social security payments (such as the
Disability Support Pension or Carer Payment).
(2) Alternately, if superannuation guarantee contributions are increased above
9.5%, allow all superannuation fund members, after at least five years of
saving, to withdraw a modest proportion of their superannuation balance for
any purpose, within lifetime limits, before they reach the preservation age.
27
(3) In raising the preservation age, make allowance for the lower life expectancy
of Aboriginal and Torres Strait Islander peoples.
Saving: $0 million ($0 million in 2016-17)19
1.3 Other proposals to strengthen the personal income tax
base
The House of Representatives Taxation Committee recently recommended that the
Government give Treasury an ongoing mandate to conduct prioritised reviews of tax
expenditures and publish the results.20 If the Government subjected tax expenditures
to the same rigorous budget scrutiny as direct expenditures, it could save billions of
dollars every year. Large tax expenditures have risen by $22 billion in the last two
years and now amount to 7.8% of GDP.21
Revenue savings from the handful of major tax expenditures could save at least as
much as is achieved through regular reviews of a much larger number of smaller
direct expenditures. For these reasons, the OECD has suggested that tax expenditures
that are comparable with direct expenditures should be included within any public
expenditur
auspices:
expenditures should either be included in the total expenditure cap that is set
every year during budg
expenditures in the annual budget process. They should be reviewed by the
financial staff of spending ministers and the budget bureau in the same way as 22
Tax expenditures that are poorly targeted or difficult to justify include:
19 The Productivity Commission estimated if the preservation was increased to 65 by 2043, workforce participation
among older workers would rise by around 2 percentage points in 2055 and revenue and expenditure savings of
the order of $7 billion would accrue in that year. See Productivity Commission (2015):
post- 20 Standing Committee on Tax and Revenue (2015): The Tax Expenditures Statement, Nov 2015. Available:
http://www.aph.gov.au/Parliamentary_Business/Committees/House/Tax_and_Revenue/Tax_Expenditures/Repor
t 21 Ibid. 22 OECD (2004) Best practice guidelines: off budget and tax expenditures. GOV/PGC/SBO(2004)6 at 4.
28
SAPTO, discussed above;
The Private Health Insurance (PHI) Rebate23; and
non-
superannuation termination payments and unused leave entitlements, apart
from bone-fide redundancy payments.
While the above tax expenditures are an intentional part of the taxation system,
unintended tax shelters also undermine the integrity of the tax system. For example,
relatively well-off individuals can avoid personal income tax by diverting and
discretionary trusts and private companies, or combinations of the two.
Private trusts (especially discretionary trusts) can be used to avoid income tax by
splitting income with a family member, delaying or avoiding payment of CGT, and by
passing on the benefits of investment tax breaks from the trust to its beneficiaries
(unlike the tax treatment of companies). Although the intention of the current tax
policy is that any income that is not taxed in the hands of beneficiaries is instead taxed
Wicke
assets or income more difficult to trace. Private trusts are much more widely used
than in the past both for investment and active business purposes. The number of
private trusts grew by 50% from 470,000 to 713,000 over the decade to 2012.24 A major
reason for this is their use to avoid income tax.
The Review of Business Taxation (Ralph Review)25 recommended that private trusts be
taxed as companies to improve consistency in the tax treatment of different entities.
This would also curb tax avoidance through private trusts by imposing a 30%
withholding tax on income received by the trust, by requiring the actual distribution of
income not retained in the trust to beneficiaries as shareholders, and by denying them
the other hand, it would enable high income earners to exploit the gap between the
company tax rate and higher personal tax rates by retaining income in the company,
so this weakness in the tax treatment of private companies would have to be resolved.
23 This rebate is mainly paid as a direct grant, though some claim it as a tax offset. Proposed changes to the
rebate are discussed further in Chapter 4. 24 Australian Taxation Office (2012): Taxation Statistics, Commonwealth of Australia. (2012-13), Trusts, table 1.
Available: https://data.gov.au/dataset/taxation-statistics-2012-13/resource/79aeec03-7596-47f8-86db-
b02ca6496699 25 Review of Business Taxation (1999): A Tax System Redesigned: More certain, equitable and durable. Available:
http://www.rbt.treasury.gov.au/
29
We propose that private trusts (both fixed and discretionary) be taxed as companies,
subject to exemptions along the lines recommended in the Ralph Review, including
complying superannuation funds and disability trusts.
private company should be curbed by taxing retained earnings (minus a reinvestment
allowance) in private companies at the top marginal tax plus Medicare Levy. This tax
treatment would also apply to private trusts taxed as companies under the change
proposed above. Where the owner of the private company would ordinarily face a lower
personal tax rate than 30%, they could distribute company income to themselves in
the form of dividends or higher wages.
Recommendation 7: Tax expenditures should be intensively reviewed each year
by the Treasury and Expenditure Review Committee and poorly targeted tax
expenditures should be reduced or abolished:
(1) From 1 July 2015 the following tax concessions should be removed or tightened:
The Private Health Insurance Rebate should be abolished 26
-
superannuation termination payments and unused leave (apart from bone-fide
redundancy payments) should be removed.
(2) The Government should identify those tax expenditures that have a similar
character to direct expenditures, attribute them to the relevant expenditure
Departments, and include them in an annual Expenditure Review process through a
Saving: $400 million ($500 million in 2017-18)
Recommendation 8: The use of private trusts to avoid personal income tax should
be curbed:
From 1 July 2017, private trusts (both discretionary and fixed) should be taxed as
companies (consistent with Recommendation 9 below). This would not apply to
collective investment vehicles or certain categories of excluded trusts including
complying superannuation funds, disability trusts, and trusts established pursuant to
court orders.
Saving: $0 ($1,500 million in 2017-18)
26 The savings in direct expenses arising from this measure are costed in Chapter 5.
30
Recommendation 9: The use of private companies to avoid personal income tax
should be curbed.
From 1 July 2017, income retained in private companies, apart from a reinvestment
allowance comprising a fixed proportion of the assets of the company, should be taxed
at the top marginal rate of personal income tax plus Medicare Levy.
Saving: $0 ($1,000 million in 2016-17)
1.4 Taxation of charities
The tax treatment of charitable organisations is inequitable and inconsistent. While
others with similar public benefits and charitable purposes do not. For example,
charities which advocate policies to government to reduce homelessness do not
generally have gift deductibility while those that provide services directly to homeless
people do. Both serve an important charitable purpose: the provision of shelter for
homeless people.
Recommendation 10: Extend DGR recipient status to a wider range of charities
Extend deductible gift recipient status to those charities whose dominant purpose is
altruistic and for the public benefit.
Cost: $700 million ($800 million in 2017-18)

31
2
2.1 Working age payments
Expenditure on working age payments comprises around 30% of expenditure on
government payments. Reliance on these payments has been declining over the last
20 years. Recent policy changes have increased the barriers to people accessing
higher pension payments. As a result of changes to eligibility for the Disability Support
Pension (DSP), for example, there has been drop in successful claims from 53% in
2011 to 33% in 2014.27 This has translated to an overall reduction in the number of
people receiving the DSP, both in absolute terms and as a proportion of the working
age population. The result is that many people facing significant barriers to work, for
example due to disability or caring responsibilities, are now forced to rely on the lower
$37 per day Newstart Allowance, most for more than a year.
In addition to the changes to the DSP, there have been numerous policy changes over
the last decade which have tightened access to payments or reduced working age
payment rates including: moving many single parents from pension to allowance
payments, the abolition of the Income Support Bonus, and proposals (so far
unlegislated) to introduce waiting periods for young people to access benefits, lift the
Newstart access age, freeze allowance free areas and abolish the Pensioner
Education Supplement. Further cuts would be economically and socially harmful.
Instead, the 2016-17 Budget should deliver a long-overdue increase to the
unemployment payment, which is currently well below the poverty line, and begin a
process of structural reform of the payments system for people of working age.
Increase allowance payments rates and improve indexation to alleviate poverty
The real value of the unemployment payment has not increased since 1994 when it
was increased by $2.95 or 2%.28 Today, it provides a single person who is out of work
with just $37 per day to meet basic living costs, in addition to any housing assistance.
unemployment payment is the lowest unemployment benefit in the OECD.
27 The Auditor-General, Qualifying for the Disability Support Pension, Commonwealth of Australia 2016. 28 Commonwealth of Australia, page 519.
32
Far from tiding people over during short periods of unemployment as originally
intended, 70% of those relying on unemployment payments must do so for more than
a year.29
Households relying on the Newstart Allowance are at high risk of poverty (55%).30
Together with people receiving Parenting Payment and DSP, those receiving the
Newstart and Youth Allowance consistently rank highly among people experiencing
financial hardship and deprivation.31 In light of this, there is now broad support for an
increase to the payment, including most recently from the coalition of union, business
and community groups involved in the National Reform Summit.
People relying on allowance payments have been repeatedly excluded from payment
increases (e.g. the $32 per week boost to pensions in 2009) and their payments are
indexed at a lower rate than pensions (to the Consumer Price Index (CPI) rather than
wages). As a result of these payment anomalies, the gap between pensions and
allowances is large and growing: currently $172 for Newstart and $218 for the Youth
Allowance.
This is problematic for a number of reasons. The Reference Group on Welfare Reform
highlighted the need to address the growing gap between allowances and pensions,
system. 32 The payment gap also discourages many
people on pensions such as the DSP from seeking employment, in case they lose the
pension and are transferred to the lower payments. Further, it leads to sudden
payment losses for some recipients despite there being no change circumstances. For
example, many single parents experience a sharp decline in their income once their
youngest child turns 8 years and the parent is transferred to Newstart Allowance,
despite the fact that the costs of raising a child increase with age. The gap between
pensions and allowance also flows through to supplementary payments, which are
lower for those on allowances. For example, pensioners receive the Pension
Supplement, which replaced a range of other supplements and is currently $32 a week
for single pensioners as well as a $7 per week energy supplement, while single people
29 Department of Social Services (2015) Labour Market and Related Payments, October 2015. Available:
https://www.dss.gov.au/labour-market-and-related-payments-monthly-profile-publication/labour-market-and-
related-payments-october-2015 30 ACOSS (2014) Poverty in Australia Available:
http://acoss.org.au/images/uploads/ACOSS_Poverty_in_Australia_2014.pdf 31ACOSS (2012) Missing out: Material deprivation and income support payments. Available at:
http://www.acoss.org.au/wp-content/uploads/2015/06/Missing_Out_2012_ACOSS.pdf 32 Reference Group on Welfare Reform (2015): A New System for Better Employment and Social Outcomes,
Report of the Reference Group on Welfare Reform to the Minister for Social Services, February 2015 at 47.
33
receiving the Newstart Allowance receive only the energy supplement, paid at a lower
rate of $4 per week.
Allowance payments are only indexed to CPI whereas pensions are currently indexed
to both consumer price movements and Male Total Average Weekly Earnings.
Indexation to both consumer prices and wages is essential to ensure that people who
rely on income support do not fall behind the living standards of the rest of the
community, as is the experience of people on Newstart and other allowances.
The previous government legislated a small increase in allowance payments in the
form of an Income Support Bonus, worth the equivalent of $4 a week. This was the
first real increase in these payments for 20 years. The Bonus is now to be phased out
at the end of this year (2016), an extraordinary decision we call on the Government to
either reverse or redirect the expenditure savings to deliver lasting improvements
payment adequacy by indexation allowances to movements in wages as well as the
CPI.
The Henry Report on the tax transfer system recommended that the single rate of
allowance payments be benchmarked to two-thirds of the partnered rate, as was
implemented for single pensioners in 2009. This would currently require a $53 per
week rise in the single rate of Newstart Allowance, which should also extend to other
allowances such as Austudy and Abstudy payments and the Youth Allowance for those
aged over 17 years living away from their parents. Payments for sole parents on
Newstart Allowance should also increase accordingly.
As the Henry Report noted, there is room to increase these payments without
significantly weakening work incentives. A single adult on Newstart Allowance who
obtains a fulltime job at the minimum wage would more than double their disposable
income.33 This payment increase would have a substantial and immediate effect on
reducing poverty, including among sole parent families affected by payment cuts in
2013 (which would be fully restored for the poorest of those families by a combination
of the Newstart Allowance and FTB increases proposed here).
Begin a process of structural reform of the payments system
A number of reviews of social security payments have been undertaken in recent
years, including the Harmer Review of pension payments, a Senate inquiry into the
adequacy of allowance payments, the Henry Review of the Tax Transfer system and
33 Based on a current minimum wage of $656.90 per week. See: https://www.fairwork.gov.au/how-we-will-
help/templates-and-guides/fact-sheets/minimum-workplace-entitlements/minimum-wages.

34
most recently the Welfare Reform Reference Group review led by Mr Patrick McClure.
These reviews have built a solid evidence base in favour of structural reform of the
system and have highlighted the need to address the payment gap as a priority in the
reform process.
We urge the government to take steps to achieve a more streamlined and equitable
payments system in which payment rates are determined by reference to living costs,
rather than capacity to work.
The present division between working age pensions and allowances should be
replaced by a base rate payment that is adequate to meet basic minimum living
expenses and supplements to meet additional costs faced by substantial minorities of
people on income support, including rent payments, the extra costs faced by people
with disability and their carers, the extra costs of raising a child alone, and the costs
of any job search and training requirements. The base rate payment would be
substantially higher than Newstart Allowance. Activity requirements (where
but maximum payment levels would not.
This reform would reduce the most severe poverty. If carefully crafted it could remove
inequities in payment levels without leaving any group worse off financially.
Importantly, it would smooth transitions from income support to employment and
greatly simplify the system because people would no longer have to move from higher
to lower payments as they move closer to paid employment.
payments be introduced between allowance and pension levels for groups who are not
expected to participate fulltime in the paid workforce such as many people with
disabilities. This proposal cuts both ways. It is likely that if it were implemented many
people who will receive social security in the future would receive increased payments
while many others would receive reduced income support an unacceptable outcome.
While successive welfare reviews have contributed to our stock of knowledge of the
circumstances of people who rely on income support, the options for payment reform
and the trade-offs involved, they have all been one-off reviews, and repeated
recommendations to improve the adequacy of allowance payments have to date been
ignored by governments. To achieve more rigour in the setting of payment levels, an
independent commission should be established that reports regularly to the
Government and Parliament on the adequacy of all social security payments,
appropriate relativities between them, and indexation arrangements. The commission
would also consider the impact of its recommendation on employment incentives and
35
budgetary costs. We do not currently propose that the Commission set payment levels
but that this remain a decision of Government.
Roll back ineffective income management programs
A concerning aspect of the social security system is the recent implementation of
income management, which has operated in Australia since 2007 in a number of
different locations and forms. Income management quarantines a proportion of a
access, so that funds can only be accessed, for example, via a specific card (e.g., the
Basics Card), or on approved items or at specific locations. Its objectives have
variously been to reduce expenditure on alcohol and gambling, end welfare
dependency, fos
priority needs. Beyond some limited success where people have entered into a
scheme voluntarily, there is no evidence of widespread or long term benefit from
income management. ACOSS considers that income management is poor policy
because it is not well targeted, is not cost effective, and has been found to have
detrimental effects
removal of financial management responsibility.
The costs of income management vary between $2,000 and $13,000 per person across
the various programs and locations. The 2015-16 budget provided an additional $146
million to continue income management for a further two years to the end of the next
financial year (2016-17). ACOSS recommends that funds currently allocated to
compulsory income management schemes around the country (including New Income
Management in the Northern Territory and the Place Based Trials) could be better
spent. We recommend the phasing out of current compulsory schemes over a 12
month period. Where the individuals and communities affected seek to continue some
form of income management, they should be replaced by opt-in schemes designed in
consultation with the communities, and supported by other necessary interventions
and supports, such as drug and alcohol counselling, financial counselling and
employment pathway planning.
Recommendation 11: Increase Allowance payments for single people by $53 per
week
(1) Allowance payments for single people (other than those on youth and student
payments) should be increased by $53 per week and benchmarked to 66.3% of
the combined married couple rate of allowances (a higher rate in the case of
36
sole parents) as is the case for pension payments. This applies to people on
Newstart Allowance, Widow Allowance, Sickness Allowance, Special Benefit
and Crisis Payment.
(2) Allowance payments for single people on youth and student payments (Austudy
Payment, Abstudy Payment and Youth Allowance) who are either over 24 years
of age or 18-24 years and living away from the parental home should also be
increased by $53 per week and benchmarking of those payments to 66.3% of the
married rate should be phased in.
Cost: $1400 million ($1,600 million in 2017-2018)
Recommendation 12: Index Allowance payments annually to movements in
earnings
From July 2016, allowance payments for people aged 17 to Age Pension age, and those
annually to movements in wages as well as to movements in prices.
Cost: $60 million ($100 million in 2016-17)
Recommendation 13: Establish a social security commission to advise the
Government and Parliament on a regular basis on the adequacy of social security
payments
A social security commission should be established as a statutory authority to advise
the Government and Parliament on a regular basis on the financial needs of people
relying on social security payments, appropriate relativities between them, and the
budgetary costs and implications for employment incentives of policy options to
improve payment adequacy.
Cost: $5 million ($7 million in 2017-18)
2.2 Employment services
At 5.8% in December 2015, the unemployment rate remains high. While the total
number of people who are unemployed is low by OECD standards, 70% of people
receiving the unemployment payment in Australia are unemployed long term (over 12
months) and many face major barriers to work. Once people are unemployed long
term, their future job prospects progressively diminish. As a result, even a temporary
37
weakness in the labour market can have long lasting and harsh economic and social
are typically modest, even a ten percentage point improvement over the short to
medium term can, if sustained, substantially reduce long term unemployment. This
leads to savings in income support, higher tax revenues, and reduced needs for
services such as health care as people who would otherwise be excluded from the
labour market find employment. Reducing prolonged unemployment is the most
important task of our employment services system and should be a core focus of
Government investment and policy at this point in our economic recovery.
The Government recently reformed the mainstream employment services system,
replacing the previous Job Services Australia with the new Job Active system. Many of
the changes introduced are welcome including a greater emphasis on payment for
employment outcomes and less administrative burden for providers. The key
weakness of the new system is the lack of flexible investment to help people who are
experiencing or who are at risk of long term unemployment overcome barriers to
employment. Under Job Active, providers receive annual service fees of $510 per
annum (or $638 per annum for with regional loading) to assist the most disadvantaged
people (those in Stream C) and a one-off up-
to invest in work experience and training. Unlike the previous system, this fund is not
replenished on an annual basis once an individual becomes unemployed long term,
except to fund very specific investments such as Work for the Dole and wage subsidies.
In this sense, the greater flexibility of the new system is illusory because flexibility and
innovation require investment and not only in forms of assistance determined in
advance by government. While higher outcome payments give providers more scope
(and incentive) to invest in people unemployed long term, a typical outcome payment
for 6 months is just $5500. If an effective work experience, training or other program
ospects by 10%, then a provider who invests more
an average of $550 in a long term unemployed person would not benefit financially
from their investment. The likely outcome of the new model is that people unemployed
long term, and those at risk of it, continue to receive employment assistance that is
neither specifically tailored to their individual needs nor adequately funded.
This is exacerbated by the requirement that most unemployed people participate in a
single program, Work for the Dole, for six months of every year. Participation in work
released in June 2014 shows that only 19% of participants in Work for the Dole were

38
employed three months later.34 An evaluation of t
Work for the Dole, Mandatory Work Activity, found that participation in that program
had no statistically significant effect on employment.35 The main drawback of work for
benefits schemes is that the work experience participants receive is usually well
removed from paid employment opportunities. If it is regular productive employment,
then the participants should be paid the legal wage. To invest in this program on a
large scale is therefore an inefficient use of public resources. Further, it is not
reasonable to require people to undertake a program that will not improve their job
prospects, especially where it involves working for less than the minimum wage as
From 1 July 2015 Work for the Dole requirements for people (mostly Aboriginal and
Torres Strait Islander people) living in remote areas have been expanded, at an
additional cost of $95 million over 4 years and with a further $1.5 billion redirected
from other purposes. The Community Development Program requires all adults
between 18 and 49 who are receiving income support to participate in Work for the
Dole 5 days a week for a total of 25 hours. This reduces the flexibility available to job
service providers to assist people with other support, including targeted training and
work experience linked to real employment outcomes. Funds currently allocated to
Work for the Dole in remote communities should be allocated to a flexible and locally
driven Aboriginal and Torres Strait Islander community development employment
program which accommodates the diverse training and job search needs of individual
job seekers and recognises differences between communities.
If the resources devoted to Work for the Dole including establishment fees ($64,000
one-off payment), service fees ($380,000 per annum); and the placement fees ($220
per placement) paid to Work for the Dole Coordinators, along with the $1000 to $3500
placement fees paid to JobActive providers - were instead made available to providers
to invest in substantial help such as work experience and training providers how to
best meets the needs of each individual, employment assistance would be more cost
effective.
In contrast to Work for the Dole, programs which connect unemployed people with
regular jobs are relatively effective. The Wage Connect wage subsidy scheme has
achieved promising results, with 47% of the 8084 participants who completed the
subsidy ended. The scheme, which provides a subsidy roughly equal to Newstart
34 DEEWR (2014): Labour market assistance outcomes, June 2014. 35 Feargal McGuinness, House of Commons Library (2014): Work Experience Schemes, 27 June 2014.

39
Allowance to employers to offer paid work experience to very long term unemployed
people
to test
to the wage subsidies program in the 2015-16 budget to merge the multiple programs
targeting different groups of people into a single program. It is important that rates of
access to the program are monitored to ensure that it is offered to all groups who
would benefit from it.
To increase the flexibility of employment assistance for people who are disadvantaged
in the labour market, restrictions on access to vocational and other training should be
removed. If training is restricted to preparation for a specific job, then opportunities
for many people whose skills are narrow or out of date to improve their employability
would be arbitrarily restricted. Governments have invested for many years in
vocational education and training and basic education because these qualifications
unemployed and low-skilled should not be denied these opportunities. Instead,
training should be better linked to employment by strengthening the role for
employers in the job services system.
A close working relationship between employment services providers, training
organisations and employers is essential to improve the employment prospects of
people disadvantaged in the labour market. As with the previous Job Services System,
Job Active continues to throw up a number of hurdles to such cooperation. These
include competition among individual providers (which means that employers are
often approached by many different providers when they would prefer to establish a
lasting relationship with one), the limited resources available to providers to invest in
the work required to establish these relationships in the first place (for which they
cannot use Employment Fund credits), and a reward structure that emphasises quick
outcomes. In collaboration with the Business Council of Australia and the Australian
Council of Trade Unions, ACOSS has identified these barriers to a partnership
approach to employment services, and advanced a set of recommendations to address
them including: national and regional employment brokers, the establishment of local
networks or boards of employers, training and employment service providers,
rewards for employment outcomes lasting one year, and allowing providers to use
Employment Fund resources to finance the preparatory work required to establish
formal partnerships with employers.36
36 ACOSS, Business Council of Australia and Australian Council of Trade Unions, Partnerships to secure jobs for disadvantaged jobseekers
40
Recommendation 14: Strengthen flexible investment for people unemployed long
term within the employment services system by redirecting resources to the
Employment Fund and easing restrictions on the purposes for which they can be
used.
1) Funds earmarked for Work for the Dole in the Job Active System (including for
Work for the Dole Coordinators) should be reallocated into the Employment
Fund to assist individuals who are unemployed long term with work experience,
training and other assistance that improves their job prospects. (Saving =$150
million in 2016-17, $150 million in 2017-18).
2) The Job Commitment Bonus program should be abolished and the savings
diverted to the Employment Fund. (Saving = $70 million in 2016-17, $70 million
in 2016-17)
3) Credits should be made to the Employment Fund in respect of each jobseeker
at the commencement of 12 months of long term unemployment, equivalent to
those made at the commencement of the unemployment spell. (Cost: $300
million in 2016-17, $350 million in 2017-18)
4) Employment Fund credits should be available for training whether or not this is
linke -
schemes, that is, a formal agreement with an employer to supply them with
workers drawn from people who are either unemployed long term or classified
within Streams B or C, and to mentor and train those workers for positions with
the employer.
5) The Work for the Dole Supplement ($10.40 per week) should be indexed
annually to movements in the CPI. Work for the Dole participants should not be
required to work for less than an appropriate legal wage beyond the 4 week
limit37 that currently applies to unpaid work experience placements.
Cost: $80 million ($130 million in 2017-18)
37 See Australian Government, Guide to Social Security Law, Version 1.208. Available at:
http://guides.dss.gov.au/guide-social-security-law/3/2/9/120/
41
3
ct against child
poverty, by supplementing the incomes of parents on low or modest incomes. It is
intended to cover the extra costs of children (e.g. food, housing, clothing) but not the
additional costs of childcare. The current system was established by the Hawke
Government and strongly supported throughout the Howard Government era.
The Federal Government proposed changes to the family payment system in the 2014-
15 Budget but was unable to secure the passage of legislation through the Parliament.
It argued that the changes, which would have reduced payments to many families,
were necessary to pay for the additional costs of the proposed new childcare package
(see Chapter 6). With support from the Opposition, legislation was passed in on 30
November 2015 to limit FTB Part B to couple families with children under 12 years
delivering savings of $525 million over the forward estimates. This will take effect on
Parliament and include:
Rapidly phasing out end of year FTB Part A and B supplements (currently
$726.35 per child for Part A and $354.05 per family for Part B) by reducing them
in two steps over two years (between 2016-2018). This would deliver savings of
$4 billion over the forward estimates.
Replacing the current rate of FTB Part B for single parents under 60 years with
older children (between 12 and 16 years) with a lower payment (of $1000.10,
down from $2737.50 per annum) and increase Part B for families with a
youngest child under 1 year by $1000.10 per annum. The combined effect of
these changes is a saving of $781 million over the forward estimates. This will
leave a gap for children between 16-18 years, previously covered by Part B if at
school and not receiving Youth Allowance.
Increasing FTB Part A by $5 per week for each child up to age 19 years, which
would cost an additional $584.2 million over the forward estimates.
The unlegislated changes would deliver savings to Government of $4.26 billion over
the forward estimates, and result in severe cuts to payments for low income families.
While we believe the legislated changes to Part B for couples with older children were
justified given the purpose of Part B (to support one parent to stay home to care for a
child), our support was conditional upon the reinvestment of savings to improve living
standards for low income families.

42
The remaining unlegislated reforms do not have a legitimate policy objective. They will
affect those on the lowest incomes the most, including single parent and low income
couple households. ACOSS has long advocated for reform of the family payments
system but is deeply concerned that the proposed reforms will cause serious financial
harm to many low income and vulnerable families, including single parent families
who have already experienced a number of cuts to payments in the last decade and
are at high risk of poverty.
Analysis of the changes to family payments proposed shows that, when all of the
changes have come into effect in 2018:
A sole parent (under 60) with one child over 13 years will lose roughly $2500
per year and a sole parent with two children will lose roughly $3000 per year
($48 per week and $58 per week respectively);38
A low income, single income couple family with one child over 13 will lose $3500
and with two children will lose $4000 per year ($67 per week and $77 per week
respectively);39
Most families with children under 13 will be worse off due to the loss of
supplements. The Part A supplement is $730 per year per child and will be
partly offset by the Part A increase of $262 per annum (resulting in a loss of
$468). The Part B supplement is $354 per family. A dual income family with one
primary school aged child will be $468 a week or $9 a week worse off. A single
income family with a child under 13 years will be $822 a year worse off, or $16
a week.
It is estimated that 136,000 single parents with older children will be adversely
affected by the changes to Part B alone40, and 76,000 couple families will lose the Part
B payment entirely when the changes come into effect, some of who are already on
very low incomes.41 The numbers affected and the extent of the income losses mean
that the changes are likely to lead to an increase in child poverty, noting child poverty
is already concentrated in single parent families. There are already about 600,000
children living below the poverty line in Australia.
The changes do little to address the major structural flaws in the family payments
38
The Conversation, 22 October 2015 at: https://theconversation.com/family-tax-benefit-savings-trimmed-but-
families-with-teenagers-hit-hardest-49496. 39 Ibid. 40 Evidence provided by the Department of Social Services to Senate Estimates. Note that the small minority of
single parents over 60 will now be exempted from this change. Social Services transcript available at:
http://www.aph.gov.au/Parliamentary_Business/Senate_Estimates/clacctte/estimates/sup1516/index. 41 Ibid.

43
system. They will mean that assistance will decrease as children get older, despite
children becoming more expensive. They will do nothing to arrest the decline in the
value of the payments by reference to community living standards, resulting from the
decision by the previous Labor Government to reduce indexation to prices only (not
wages). The small boost to Part A ($5 a week) will not offset the losses resulting from
the withdrawal of the end of year supplements and the cuts to Part B. ACOSS is also
concerned that the IT interface between the Department of Social Services and the
Australian Tax Office is not yet advanced enough to prevent over and underpayments,
which end of year supplements were designed to address. We advocate for a much
more gradual withdrawal of the supplements to begin only once the IT system is up to
the task and the adequacy of payments levels have been addressed (including to
Newstart, upon which the lowest income families rely, and family payments
themselves, including improving indexation. See details below).
3.1 A fairer reform agenda
ACOSS supports the need for reform of the family payments system to achieve the
following objectives:
1. To reduce child poverty in Australia and ensure all children have an acceptable
standard of living;
2. To provide a stable and adequate foundation for the family payment system into
the future, by benchmarking payments to the costs of children as they grow
older, and indexing them to movements in community living standards not just
to consumer prices;
3. To encourage paid workforce participation for those who have capacity to work
by removing barriers or disincentives.
While some aspects of the family payments system work well, other parts of the
system are poorly designed, especially:
The steady decline in the value of maximum payments compared with
community living standards (and compared with pension rates for adults), since
indexation was reduced from linking to wage movements down to CPI in 2009
(Part A and B);
The lack of a clear rationale for the maximum rates of payment for children of
different ages and from different family types (Part A and B);
Inadequate support for the costs of older teenage children, which are much
more expensive (Part A);
44
Inadequate support for single parents with the extra costs of raising a child
alone (the Part B payment for single parents, which was originally intended to
fulfill this purpose, drastically reduces once the youngest child turns 5 despite
increasing household costs).
The following set of recommendations is designed to address these problems, reduce
child poverty and support increased workforce participation. This package of changes
is intended as an alternative to the cuts proposed currently before the Senate. Our
support for savings components of the package (the gradual phasing out of
supplements and legislated changes to Part B for couples with older children, already
passed is contingent on the adoption of the spending measures proposed below, which
would improve the adequacy of payments for families on the lowest incomes, including
single parent families.
Recommendation 15: Reform family payments to better target assistance and
reduce child poverty
The following changes are proposed as a package of reforms.
Index family payments to wage movements as well as to CPI: Restore
previous benchmarking of maximum rates of family payments to pension rates,
which were based on the age of each child.
FTB Part A for children of primary
school age and increase rates for older children42: This would increase the
FTB Part A rate for families with children over 5 years by $30 per week.
Replace FTB Part B for single parent families with a Sole Parent
Supplement: The supplement should be set at the level of the current Part B
payment for younger child, so that payments to single parent families no longer
fall when the youngest child reaches 6 years. This would provide an increase to
affected single parent families) of $23 per week.
Gradually phase out FTB Part A and B end of year supplements: Roll
supplements into base payment from 1 July 2017 and gradually withdraw.
Cost: $Revenue neutral43
42 Previous benchmarks were 16.6% of the couple pension rate for each child under 13 years and 21.6% for each
older child. 43 This is an estimate only. Detailed modelling is required to assess the budget impact of this proposal.
45
4 44
High housing costs are the biggest source of financial stress in many households,
particularly those on low incomes.
The majority of those in housing stress are in private rental. Nationally, four in five
private rental households in the lowest 20% of incomes are in unaffordable housing
situations (paying more than 30% of income in rent). Additionally, more than 30% of
the second lowest quintile is also experiencing housing stress. 45 Home purchase
prices continue to rise nationally. They have been rising faster in our two major cities
(Sydney and Melbourne) which, between them, house 40% of the population. Average
Australian house prices are approximately 4-5 times the average annual household
earnings.46
Australia has a shortfall of housing supply, estimated by the most recent reputable
assessment as over 500,000 rental dwellings which are both affordable and available
to the lowest income households.47
One result of these pressures is that many people become, or remain homeless due
to a lack of affordable housing. More than 105,000 people were counted as homeless
on census night in 2011, an increase from just over 89,000 in 2006.48 This figure was
probably a significant underestimation at the time, and has likely increased since
2011. The Australian Institute of Health and Welfare reported that 255,500 people
sought help from specialist homelessness services during 2014-15 with 329 people
unable to be assisted each day.49 Funding to homelessness services is inadequate to
44 This chapter draws on the joint policy paper, An affordable housing reform agenda: Goals and recommendations for reform, developed by ACOSS, the Community Housing Federation of Australia (now the
Community Housing Industry Association), Homelessness Australia, National Shelter and the National
Association of Tenants Organisations published in March 2015, available at: http://www.acoss.org.au/wp-
content/uploads/2015/06/Joint_housing_paper_March_2015_final.pdf.
45 Kath Hulse, Margaret Reynolds and Judith Yates (2014): Changes in the supply of affordable housing in the private rental sector for lower income households, 2006-2011, AHURI 46 Ryan Fox and Richard Finlay (2012): Dwelling prices and household income, Reserve Bank of Australia Bulletin,
December Quarter 2012, available at: http://www.rba.gov.au/publications/bulletin/2012/dec/pdf/bu-1212-2.pdf. 47 National Housing Supply Council (2013): State of Supply Report 2012. The actual figure is 539,000. The figure of
539,000 is arrived at as follows: In 2009-10 there were 857,000 renter households in the bottom 40% of the
income distribution, and 1,256,000 dwellings rented at an affordable price for these households. However,
937,000 of these dwellings were rented by households in higher income groups, leaving only 319,000 available for
rent by low income households a shortfall of 539,000. 48 Australian Bureau of Statistics (2011): Estimating Homelessness 2011, p5 49 Australian Institute of Health and Welfare (2015): Specialist Homelessness Services 2014-15, available at:
http://www.aihw.gov.au/homelessness/specialist-homelessness-services-2014-15/.

46
At the time of writing, reviews of federalism and tax reform are underway and an
affordable housing working group, involving the Departments of Social Services and
Treasury, as well as various state governments has just been announced. It is
understood that these processes will inform future Commonwealth-State funding and
service delivery arrangements.
ACOSS advocates for the development of a National Affordable Housing Strategy
which is underpinned by specific targets. The absence of any national policy about one
of the most important issues affecting the community, and the economy is dereliction
in political responsibility. The proposed National Strategy should include:
reform of housing taxation;
direct investment in the growth of affordable housing stock and incentives for
private sector and institutional investment in affordable housing;
an increase in financial support to low income renters; and
sustained and adequate support for homelessness services.
The Commonwealth has significant scope to influence the direction of housing
reforms through conditions, including through Council of Australian Governments
(COAG) negotiations and conditions of national partnership agreements. There is a
dire need for a national effort to improve rental standards and tenancy regulation
across the country.
4.1 Set affordable housing targets
In order to drive an affordable housing reform agenda, it is recommended that the
Federal Government adopt clear targets to increase the supply of affordable housing
and reduce homelessness as follows:
Halve homelessness by 2020 (to 50,000 people experiencing homelessness on
any given night and 125,000 persons requiring specialist homelessness
services each year);
Halve the shortfall in housing supply available and affordable to the bottom 40%
of household incomes by 2025; and
Meet the shortfall in housing supply available and affordable to the bottom 40%
of household by 2035, thereby ending homelessness caused by lack of housing.
At least 50% of new affordable housing stock should be allocated for those in the
bottom 20% of household incomes. Affordable new housing stock should meet
accessibility and energy efficiency standards.

47
4.2 Improve the adequacy of existing housing and
homelessness funding agreements
Housing programs are currently funded through the National Affordable Housing
Agreement (NAHA) and related Special Purpose and National Partnership payments.
The National Special Purpose Payment (SPP) (which delivers funded agreed under the
NAHA) is the major funding mechanism for affordable housing programs. The NAHA
funding includes funding for homelessness services (estimated at approximately $250
million) with the balance spent on housing. The agreement is ongoing, with $1.3 billion
allocated in 2016-17.
The future of the NAHA or replacement national agreement is likely to be determined
by the current review of the federation. A future agreement must ensure significantly
improved transparency and accountability, with more stringent reporting
requirements about outcomes. With the abolition of the COAG Reform Council, there
are unresolved questions about how monitoring of the agreement and its outcomes
will be conducted. While the development of a future agreement may take some time,
steps must be taken in the interim to improve accountability under current funding
arrangements.
Funding under the SPP is currently indexed to a growth factor of 1.5% in 2016-17.50
We recommend that a future agreement ensure a more appropriate basis for
indexation, informed by the application of funds under the agreement, by reference to
relevant cost drivers (e.g. the building construction index, house price index, wage
price index). As an interim measure, and in light of the long term erosion of affordable
housing funding, we recommend indexation to CPI or wage price indexation,
whichever is higher.
Funding for Aboriginal and Torres Strait Islander housing is currently provided under
the National Partnership Agreement for Remote Indigenous Housing, a 10 year
agreement due to expire in 2018. The Agreement was designed to reduce
overcrowding, increase housing supply, improve the condition of existing housing and
improve the management of rental housing. Given the persistent housing affordability
and overcrowding challenges experienced by Aboriginal and Torres Strait Islander
communities, we urge the Commonwealth, States and the Northern Territory to
negotiate adequate and sustainable funding arrangements extending beyond 2018 for
Aboriginal and Torres Strait Islander housing. This should extend beyond remote
50 Commonwealth of Australia (2015): Budget 2015-16: Budget Paper No. 3 at: http://www.budget.gov.au/2015-
16/content/bp3/html/bp3_03_part_2f.htm. The growth factor is the wage cost index 1, comprising a safety net
wage adjustment weighted by 75 per cent and the all groups Consumer Price Index weighted by 25 per cent.

48
communities, recognising the importance of Aboriginal community controlled housing
in regional and urbans areas. Governments should provide certainty for affected
communities well in advance of the expiry of the current agreement.
4.3 Establish an Affordable Housing Growth Fund
To meet shortfalls identified by the National Housing Supply Council of at least 500,000
properties available and affordable to the bottom 40%51 will require an investment mix
over 20 years of more than $150 billion. Governments cannot be expected to meet that
target alone but must develop incentives to attract it from institutional and private
sources.
The Government should establish an Affordable Housing Growth Fund to increase the
supply of affordable housing through government investment. The fund should be
strictly designated for expanding the stock of affordable housing by providing
direct capital funding to State and Territory Governments. Program guidelines
should enable housing providers to draw on a range of affordable housing
programs to deliver maximum affordability and provide mixed tenure
developments. Funding in the first year should be delivered through a revived
Social Housing Initiative National Partnership Payment to the states and
territories for capital funding of social housing stock, until the current federation
review and future funding arrangements are determined.
4.4 Create a new affordable rental private investment
scheme
The Federal Government has a vital role to play in unlocking private finance in
affordable rental housing at scale through the establishment of a national incentive
and finance scheme.
With the discontinuation of the National Rental Affordability Scheme in the 2014-15
budget, there is a significant gap in current policy and funding arrangements. State
and Territory Governments are unlikely to be able to achieve the scale required
without support from the Federal Government. For example, it is reported the WA
Government has taken market soundings on the potential for launching a
successful housing bond initiative (or similar mechanism) that indicate the need for a
51 National Housing Supply Council, Op.Cit.

49
national scheme to meet investor requirements for scale, and regularity and diversity
of investment opportunities. Schemes should be designed to enable investors to use
a combination of different incentives to maximise growth in affordable housing stock.
Housing supply bonds have been successful overseas in financing affordable housing
and could play an important role in attracting new forms of private investment at scale
in Australia. The model proposed by the Australian Housing and Urban Research
Institute would involve a combination of government funding and private bond finance
indirectly subsidised through tax incentives and government guarantees.52 The costs
of establishing such a scheme here have been estimated at $25 million in the first year
($145 million over four years), which could raise approximately $2 billion in bonds and
generate more than 7200 new dwellings, in addition to the costs of setting up a housing
finance intermediary. While making a long term commitment, it may be desirable to
stage the development of such a model, with the establishment of the financial
intermediary and a modest bond issue, backed by a guarantee, used initially to
promote market responses.
The newly established affordable housing working group should engage with experts
to develop the financial architecture to attract institutional investment in affordable
private rental stock at scale, as part of a broader national affordable housing strategy.
4.5 Reform housing taxation
Tax concessions for housing purposes are, at least in theory, designed to improve
housing affordability. In practice they often have the opposite effect, inflating home
prices and rents by encouraging over-investment in existing housing stock.
times the benefits to the top 20% of households (around $3,800 a year) than they do to
the lowest 20% (around $364 a year).53 Moreover, over 90% of investment in negatively
geared housing stock applies to existing properties, thereby inflating housing costs
and fuelling speculative booms in the housing market. This tax concession also skews
investment in housing towards individual investors (rather than institutions) and
towards investments yielding capital gains (rather than a stable rental income
stream).
52 AHURI (2014): How might bond finance expand affordable housing in Australia?, Issue 173, June 2014. 53 Yates, J. (2009) Tax expenditures and housing AHURI, Melbourne.

50
Deductions for expenses relating to passive investment in housing, shares,
collectables and similar assets purchased after 1 January 2017 should be quarantined
to offset income received from those assets, including capital gains realised on their
subsequent sale. This is a first step to improving housing market outcomes and
reducing the fiscal and social cost of this tax break. The proposed policy change would
have a gradual impact on housing investment, as it would not apply to assets
purchased before budget night 2016.
As discussed in the tax chapter, part of the revenue savings from this change should
be used to introduce a more effective incentive for new investment in dwelling
construction for rent. This investment incentive would be paid a lower rate (in
proportion to construction costs) for any new construction of a rental dwelling up to a
certain cost (to exclude luxury d
rental dwellings, defined as housing where rents are held at least 20% below market
values for up to ten years. Both incentives would apply for up to ten years following
construction. The lower investment allowance would be paid as an annual tax offset
while the higher one could be paid either in that form or as a direct payment to the
institutional investors as well as individuals, noting that the form of the incentive
would need to be tailored to meet the needs of institutional investors. They would apply
regardless of the number of investment dwellings constructed in a given year.
In this way the purpose of rental investment incentives would shift decisively from
assisting investors to avoid income tax by speculating in existing real property towards
directly encouraging new investment in affordable rental housing.
4.6 Increase financial assistance to low income renters
Commonwealth Rent Assistance (CRA) provides important assistance to low income
residents of private housing but has failed to keep pace with steep rental inflation,
leaving many struggling to cope with high private rental costs. The Reference Group
on Welfare Reform recommended that the levels and indexation of CRA be reviewed
review should be undertaken in 2016 as a matter of high priority. In the meantime, the
maximum rate of CRA should be increased by 30% to provide immediate relief to
renters on low incomes.
The National Commission of Audit (NCOA) report and the Reference Group on Welfare
51
public housing tenants and reform rent setting policies. The NCOA indicated support
for the replacement of direct Commonwealth Government investment in housing
(including via the NAHA and National Rental Affordability Scheme (NRAS)) with
expanded eligibility for CRA. While consideration should be given to reform of CRA it
should not be seen as a substitute for Commonwealth investment in the growth of
affordable housing stock, but as a complement to supply side investment.
In projecting future expenditure on CRA, the Commonwealth should also take account
of the impacts of public housing transfers, with governments having agreed on a target
of 35% of social housing to be controlled by community housing providers (CHPs). If
this target is met in the next 4 years, it will increase the cost of CRA over the forward
estimates by an estimated $500 million. 54 In addition to offering the high quality
services for which CHPs are recognised, such transfers will enable them to raise
private finance for both modernising retained social housing and, where appropriate,
leveraging its land value and redevelopment potential to create additional supply.
4.7 Improve our funding and policy response to homelessness
services
Homelessness remains a serious social problem in Australia. Additional investment
in homelessness services under the previous Government achieved a reduction in the
number of rough sleepers, but with a growth in the number of people living in
overcrowded dwellings, overall homelessness figures have remained the same.
Further, an increasing number of older people are experiencing homelessness.55
Homelessness services in Australia are funded through the NAHA (as noted above,
approximately $250 million is allocated to homelessness services) and the National
Partnership Agreement on Homelessness (NPAH). The NPAH was extended again in
Commonwealth- 56 This was welcome but questions remain
about the future adequacy and security of funding. The rollover in 2014 reduced the
54 Calculated on the basis of the transfer of a further 80,000 dwellings, using cost estimates in Pawson, H.,
Milligan, V., Wiesel, I. and Hulse, K. (2013), Public housing transfers: past, present and prospective, Final Report
no. 215 AHURI Melbourne in Tables 7 and 8. 55 Council to Homeless Person (2011): Submission to Inquiry into the opportunities for participation of Victorian seniors. 56 The Hon Scott Morrison MP, Media Release sness with a
http://www.formerministers.dss.gov.au/15931/coalition-reverses-labors-funding-cuts-on-homelessness-with-
230-million-commitment-prioritising-victims-of-domestic-violence/.
52
quantum of funding by $44 million, by discontinuing funding for capital and research.
This reduction was carried over in the last rollover. The reduced amount is not
indexed, which means that funding is declining in real terms from year to year.
A future funding agreement should include an emphasis on the prevention of
homelessness, including through addressing early life trauma, and adequately fund
effective supported housing models and the capital costs of service interventions.
Stable, long term funding for research evaluation should also be secured in the
negotiation of a future long term agreement to enable the collection of baseline data
and ongoing monitoring of impacts. In the interim, the current homelessness
agreement should at least be adequately indexed to prevent further erosion of
funding.
Recommendation 16: Establish a long term Affordable Housing Growth
Fund
An Affordable Housing Growth Fund should be established with a commitment of
$750 million in the first year, growing to $10 billion over 10 years.
Cost: $750 million in 2016-17 ($1000 million in 2017-
2018)
Recommendation 17: Establish a housing finance intermediary to underpin a
future rental investment scheme
The Government should establish the financial architecture to attract institutional
investment in affordable private rental stock at scale.
Cost: $20 million ($35 million in 2017-18)
Recommendation 18: Review Commonwealth Rent Assistance and
increase the maximum rate of CRA
CRA should be reviewed to ensure that it best meets the needs of people who are
on low incomes. As a first step, the maximum rate of CRA should be increased from
1 June 2016 by 30% (approximately $22 per week) for low income households
currently receiving the highest rate of CRA.
53
Cost: $750 million in 2016-17 ($770 million in 2016-
17)57
Recommendation 19: Index the National Partnership Agreement on
Homelessness
That the Commonwealth reinstate capital and research funding under the NPAH
and index the Agreement to the CPI or the Wage Price Index, whichever is higher.
Cost: $3 million in 2015-16 ($3 million in 2016-17)58
Recommendation 20: Improve the adequacy of NAHA indexation
As an interim measure, until a new national housing agreement is developed,
index funding under the National Affordable Housing SPP to a growth factor linked
to the CPI, with the relevant proportion which funds staff indexed to wages.
Cost: $13 million 2015-16 ($27 million 2016-17)
57 Calculated using Stinmod and indexed to growth in CRA expenditure. 58 This calculation is based on the funding for 2016-17 indexed to the wage price index at 2.75%.
54
5
The Federal Government, in partnership with states and territories, has a fundamental
responsibility to ensure that health services across the continuum are available to the
people that need them and that particular at-risk groups in the community are
provided with the services they need to live healthy and productive lives. Universal
healthcare is the most effective, efficient and equitable way to ensure the delivery of
adequate health services to the Australian public.
Health is a driver of expenditure growth for the Commonwealth budget over the next
20 years. Importantly, the projected growth in expenditure in this area is due in part
to the costs associated with preventable chronic diseases and population ageing, with
consequential increases in health and other services costs (alongside the projected
growth in spending on age pensions). This trend is a general one across comparative
economies: OECD projections anticipate an increase in average public health and long
term care expenditures from 6.2% to at least 8% of GDP from 2010 to 2030.59
The other major driver of costs is the Private Health Insurance Rebate (discussed
further below).
While public health spending was reduced in many countries after 2009 to consolidate
public budgets in the wake of the global financial crisis, it had been rising consistently
in proportion to GDP before then and appears to be resuming its upward path in
comparative countries.60
the public health share of GDP from rising. Therefore the pressure on the Federal
Budget in health should be focused not on cutting expenditure, but on a far better
distribution of that expenditure, to ensure it achieves value for money in health
outcomes and an effective, accessible and affordable health system.
There is no doubt that health care could be provided more cost effectively in Australia.
Holding hospitals to account for the costs of procedures would also be likely to reduce
the wide disparity in those costs from state to state and from one hospital to the next.61
59
2013, http://www.oecd.org/economy/health-spending.pdf. 60 - http://www.economist.com/news/finance-
and-economics/21672340-new-study-suggests-current-hiatus-spending-will-be-temporary-
pause?fsrc=scn/tw/te/pe/ed/thepausebeforefastforward. 61 -
http://grattan.edu.au/report/controlling-costly-care-a-billion-dollar-hospital-opportunity/.

55
But much bigger savings would likely arise from a shift towards greater investment in
effective preventive and population health strategies.
5.1 Invest in prevention
Too much of our public health spend is directed towards tertiary or hospital services,
with inadequate investment in preventive health initiatives. In essence, we fail to
prevent a whole range of conditions, like chronic diseases, that significantly inhibit
health system. Stronger investment in preventive health care and supporting people
to adopt healthier lifestyles would save significant future health care costs. 62 For
example, the Victorian Government estimates that savings of over $1 billion a year
could be made by better managing chronic illness to avoid hospital visits.
5.2 Redirect existing expenditure including on the Private
Health Insurance Rebate towards greater population health
outcomes
Current health expenditure should be better directed towards achieving population
health outcomes. We propose the redirection of current funding to the Private Health
Insurance Rebate and the Extended Medicare Safety Net to public hospitals,
community based services and to address existing gaps in the health system.
The Private Health Insurance (PHI) Rebate has failed in its promise to increase private
health insurance take-up and take pressure off public hospitals, yet the cost of the
rebate is significant within the Federal Budget overall. As the Minister for Health, the
Hon. Sussan Ley MP, has acknowledged there is widespread public unhappiness with
the value for money people are receiving from their current private health cover.63 We
urge the Government to review the cost of the PHI rebate against the value it achieves
both for the Government and for individuals; and to recognise that redistributing the
62 For a strong rationale for preventive services, see for example Australian Government (2010) Taking
, Commonwealth of Australia,
Canberra. 63 Responding to munity attitudes to private health
insurance in December 40,000 Australians have their say on private health
December 2015, http://www.health.gov.au/internet/ministers/publishing.nsf/Content/health-mediarel-yr2015-
ley151205.htm.
56
expenditure from the PHI rebate could make a significant impact in preventive
community based services.
We have similar concerns about the lack of value achieved by the Extended Medicare
Safety Net (EMSN). Given the risk of increasing out-of-pocket costs for healthcare
consumers, particularly those who are economically disadvantaged, it may seem
counter-productive to be arguing to abolish a safety net. However this safety net does
not appear to have assisted in reducing out-of-pocket costs for consumers at all, and
may in fact have increased the costs of particular medical procedures.64
An independent review of the EMSN found it accounted for 3% of total Medicare
spending, but that EMSN expenditure was growing at more than twice the rate of total
Medicare spending.65 At the same time, while capping of some items under the EMSN
led to a decline in provider fees for some services (such as out of hospital services
with fees charged at the median and above), out-of-pocket costs for other services
had increased, including services below the median fee (where out-of-pocket
expenses increased by at least $100); and some services appeared to have returned
to their pre-EMSN levels.66 Moreover the benefits of EMSN were inequitable: while it
did make services more affordable for some (for example people using assisted
reproductive technology services and patients with complex conditions such as
cancer), it had little impact on affordability of services for those living in more remote
or in lower socioeconomic areas.
5.3 Support transparent, accountable universal healthcare
ACOSS continues to argue strongly for universal coverage of essential health services
for the whole community; and for measures to improve the accessibility of those
services for people and communities that are currently poorly served. As well as being
more effective in reducing the health burden of the country, this approach enables the
64 Introduced by the Australian Government in 2004 to provide financial relief for families and singles who incur
high health-related out of pocket (OOP) costs, the EMSN provides benefits in addition to the standard Medicare
rebate for Medicare services provided out of hospital to those who qualify. Families and singles qualify for EMSN
benefits once they have accumulated a given threshold in OOP costs for out of hospital services during the
calendar year. After the threshold is reached, the EMSN pays 80% of all OOP costs for out of hospital Medicare-
related services for the remainder of the calendar year (CHERE 2011). 65 CHERE (2011) Extended Medicare Safety Net Review of Capping Arrangements, University of Technology
Sydney,
http://www.health.gov.au/internet/main/publishing.nsf/Content/2011_Review_Extended_Medicare_Safety_Net/$
File/Final%20Report%20-%20Review%20of%20EMSN%20benefit%20capping%20June%202011.pdf. 66 Ibid.
57
health system to respond to the needs of the community and works to eliminate the
current social gradient of health. ACOSS believes that a significant proportion of
essential health services should continue to be delivered through Medicare.
Funding arrangements between the states and territories should:
reflect appropriate indexing;
be based on evidence and agreement on adequacy of funding; and
focus on performance and improvement of health outcomes across the
community.
Health funding should also support the core principles of transparency and
accountability to ensure communities are able to understand and inform the funding
and program decisions intended to support them. Government and taxpayer
expenditure on health is significant and there needs to be an appropriate level of
accountability and transparency within the health system. Healthcare services should
be respected as a community asset and vested interests should not be able to access
public funds to provide healthcare services without adequate accountability back to
Government and community.
5.4 Ensure affordable, timely access to basic oral health
Alongside basic, effective, community based health services, ACOSS has advocated
strongly for reform to ensure that low income households have access to affordable
dental services. Reforms to improve the national provision of and access to oral health
services are particularly urgent at a time when we are seeing high levels of
preventable dental decay in children.67 While we welcomed the reinstatement of the
funding from the National Partnership Agreement for adult public dental services in
2015, we are disturbed by the continuing effort to derive (ultimately minimal) savings
from a much-needed and poorly funded program. Public dental services are a critical
plank in the effort to reduce preventable and persistent health conditions and have a
l as their health.
Recommendation 21: Sustain investment in effective preventive health
mechanisms.
67 AIHW (2011) Dental decay among Australian children, 3 August http://www.aihw.gov.au/publication-
detail/?id=10737419604.
58
Investment in preventive health programs should be increased through savings
derived from ineffective expenditure. Growth should be maintained based on projected
growth in population needs and rigorous, population-based evidence about
effectiveness in community based services.
Costing: $130 million in 2016-17 ($150 million in 2017-18)
Recommendation 22: Remove the 30% Private Health Insurance Rebate from 1
July 2016.
The rebate has not reduced pressure on public hospitals and should be removed, with
approximately half its savings redirected to public hospitals and community based
services and to fund preventive and dental health recommendations.
Saving: $3,300 million in 2016-17 (3,400 million in 2017-18)68
Recommendation 23: Abolish the Extended Medicare Safety Net
The EMSN should be abolished due to its role in inflating prices, with its savings
redirected to public hospitals and community based services.
Saving: $410 million in 2016-17 ($420 million in 2017-18)69
Recommendation 24: Increase investment in affordable, accessible dental care
for children and adults.
Ensure access to basic, preventive dental care through the public health system for
children and adults, funded through the redirection of savings from abolishing the
Private Health Insurance Rebate.
Costing: $1,000 million 2016-17 ($1,200 million in 2017-18)
68 Commonwealth of Australia (2015) Budget Paper 1 at 5-23, http://www.budget.gov.au/2015-
16/content/bp1/download/Budget_Paper_No_1.pdf. 69 Estimate based on CHERE 2011, the last published findings from an independent review of EMSN.

59
6
Evidence shows that a well-
productivity and social wellbeing. Access to high quality early childhood education and
schooling, including in areas such as school attendance, completion rates,
behavioural outcomes in class and interest and motivation.70 In addition to providing
an important educational foundation for children, access to affordable, flexible care
for children strengthens
Despite these benefits, significant numbers of children and young people, particularly
from low income households and disadvantaged communities, are not currently
accessing early childhood education services.
A package of early childhood education and care reforms formed a centrepiece of the
2015-16 budget. The package (as revised in November) will deliver additional
investment of $3.2 billion over the forward estimates. It includes the following
elements:
A new streamlined child care subsidy which will replace the Child Care Benefit
(CCB), Child Care Rebate (CCR) and JETCCFA from 1 July 2017 which will meet:
o 85% of the benchmarked costs of care for families under $65,700 per
annum;
o 50% of the benchmarked costs of care for families on incomes of
between $170,000 and $250,000 tapering down to 20% of costs for
families on more than $340,000 per annum (with a fee cap of $10,000
for those on incomes upwards of $185,000);
A new requirement that parents participate in at least 4 hours of recognised
activity per week to be eligible for more than 12 hours per week of subsidy
(down from current eligibility for 24 hours per week without activity
requirements). Some exemptions apply (e.g. for grandparent carers);
The creation of four activity tiers linked to parental activity, with those
participating in less than 4 hours per week of approved activity only eligible for
subsidised care if deemed to be low income, in which they are eligible for 12
hours of subsidy per week;
The creation of three programs to provide additional assistance for
70 -primary education on primary school
. Journal of Public Economics, 93(1-2), 219-234; Queensland Department of Education, Training and
Employment (2013) Evaluation of the Early Years Centre initiative Summary Report.

60
disadvantaged or special needs children, replacing existing programs; and
The replacement of the current Budget Based Funding program, which
some other
services) with mainstream, user pays models, with limited transitional support
for affected services.
ACOSS welcomes increased investment in early childhood education and care, and
supports reform to simplify the child care payments system including moving to a
single subsidy payment. However, we strongly oppose the linking of child care funding
to proposed cuts to family payments. ACOSS recommends that funding for child care
investment be secured from general revenue. oposals for
reform of family payments, see Chapter 3.
Revisions to the child care package in November resulted in budget savings of $1.9
billion over the forward estimates compared to the original package. This includes the
tightening of income tests, a reduction in the size of the nanny trial and the abolition
of the top up assistance for high fee services (together delivering a $400 million saving
to Government over the forward estimates), in addition to $500 million saved through
a downward revision of program costs71 and $930.6 million in savings from changes to
Family Day Care compliance arrangements. ACOSS believes that these savings should
be redirected in the May 2016 Budget to address gaps in the new childcare package
as detailed below.
We have been unable to model the budget impacts of the proposed changes outlined
below, in part because of the very limited information released by the Government
about the distributional impacts of its policy package and the respective costs of
various components of the policy. We note that, to date, modelling released by the
Government has been limited to cameos only, which have included the interaction with
family payment cuts. We urge the Government to release detailed modelling of the
distributional impacts of its policy changes, including changes to the activity test and
the budget impact of various components of the package.
71 MYEFO states that this is “largely reflecting a higher than expected proportion of child care fee assistance payments being made in arrears”.

61
6.1 All children should have access to at least 2 days of care
per week
Under the current system, families are entitled to a minimum of 24 hours per week of
subsidised care and more than 24 hours if they are engaging in at least 15 hours per
week of approved activities. Under the proposed new rules, as noted above, families
engaging in less than 4 hours of week of approved activity will only eligible for just 12
hours a week of subsidised care, halving their entitlement. This shift to impose more
stringent activity requirements is at odds with moves in comparative countries to
increase access to free childcare, for all children. For example, the UK Government
currently provides access to 2 days free childcare for children aged 3+ years
regardless of parental activity, with both major parties pledging to increase access to
at least 25 hours per week.
ACOSS recommends that all families should be able to access a minimum of two days
of early childhood education and care, regardless of activity level to ensure children
in families without paid work have access to sufficient quality care. Longer-term, we
recommend that this form one of a number of community service guarantees as part
of a broader tax and federation reform agenda, as noted above.
6.2 Beyond a universal base, fee assistance should be
effectively targeted
of the child care system which recommended that families on low incomes receive a
higher subsidy (85-90% of benchmarked costs for families under approximately
$60,000) with a linear taper down to a universal base subsidy of 20% -30% for higher
income families (above $250,000). 72
adopts an 85% subsidy rate or families on less than $65,000 per year, but then adopts
a two-step taper: to a 50% subsidy for families on incomes of $170,000-$250,000, then
down to 20% for families
package would also increase the fee cap for high income families, from $7500 to
$10,000 per annum. The relative generosity at the higher end has increased the overall
costs of the package, which the Government is now seeking to pay for through cuts to
family payments. It has also made for a more complex system.
72 from 30% in its Draft Report.
62
ACOSS believes that the level of childcare subsidy should be appropriately targeted to
those who struggle with childcare costs, while still providing a universal base
payment. We recommend that the maximum subsidy of 85% for families on low and
but that the two-step taper be replaced by base rate of 30% for families on $250,000
per annum or above. We also recommend the subsidy cap for higher income families
be maintained at its current level ($7500) and indexed73, rather than increasing it to
should be able
to adjust their subsidy rate to ensure they maintain access to subsidy all year if they
are likely to hit the cap.
These changes would ensure that resources are available to address the gaps in the
child care system for low income and developmentally vulnerable children.
6.3 Establish an Aboriginal and Torres Strait Islander
community based program within the new Child Care
Safety Net
The existing Budget Based Funding program is proposed to be abolished under the
proposed reforms. The program currently funds 303 services across Australia, most
of which are Aboriginal and Torres Strait Islander focused. From 1 July 2017 these
services will have to operate on the mainstream, fee-based, Childcare Subsidy. ACOSS
is concerned about the viability of this funding model for Aboriginal and Torres Strait
Islander services and families. We are also concerned that the reform package fails
to deliver investment in the creation of additional Aboriginal and Torres Strait Islander
child care services, despite the Productivity Commission report highlighting that an
additional 15,000 ECEC places would be needed to close the gap in Aboriginal and 74
We support the Secretariat of National Aboriginal and Islander Child Care (SNAICC)
recommendation to establish an Aboriginal and Torres Strait Islander community
based program within the new Child Care Safety Net. SNAICC proposes that the
program would:
have an integrated funded formula that provides services with the flexibility to
respond to child and family needs where a user pays model is insufficient; and
73 Indexation of the cap was frozen in 2011 for 3 years. Indexation should be to movements in child care prices. 74 Productivity Commission, Childcare and Early Childhood Learning, Report No. 73, October 2014 at page 525.
63
from the mainstream subsidy and fees based on 3-year applications.
6.4 Ensure that low income families who are not in paid work
are, at a minimum, no worse off
Under the proposed new childcare package, additional fee assistance will be available
for some parents on income support who are seeking to transition to work through
the Additional Child Care Subsidy which will replace the existing JETCCFA program.
The impact of this change on very low income families is difficult to determine. We
repeat our call for the release of detailed modelling of the distributional impacts of
the proposed policy changes and seek assurances from Government that affected low
income families will not be worse off as a result of the proposed changes, including
single parent families who are beneficiaries of the current scheme.
Recommendation 25: Redirect savings from tightening of income test and caps
for higher income households to address improve access for children in low
income families
1) Replace the proposed three tiered subsidy with a simpler and more sustainable
two tiered model (a linear taper), with a maximum subsidy of 85% for families
on less than $65,700 tapering to a base subsidy of 30% for households on more
than $250,000 per annum75.
2) Reduce the subsidy cap for higher income households from $10,000 to $7500
per annum, and resume indexation.
3) Provide a minimum of two full days (20-24 hours) of subsidised early childhood
education and care per week for all families, regardless of activity. Activity
requirements should apply only to families seeking care for more than two days
per week.76
75 The Productivity Commission estimated the cost of tapering to a base rate of 30% (instead of 20%) at
approximately $185 million per annum, compared to its alternative model, but these costs would be offset by the
removal of the proposed mid-tier 50% subsidy rate for families on $170,000-$250,000. See Productivity
Commission, Childcare an Early Childhood Learning, Inquiry Report Volume 2, No. 73, 2014 at Figure 16.15. 76 The Productivity Commission estimated the cost of removing the activity test altogether as more than $1 billion
per year, while the cost of removing the test for those on Parenting Payment and increasing the minimum weekly
entitlement to 20 hours per week was estimated as approximately $250 million per annum. See Productivity
Commission, Childcare an Early Childhood Learning, Inquiry Report Volume 2, No. 73, 2014 at Figure 16.15.

64
4) Establish an Aboriginal and Torres Strait Islander community based program
within the new Child Care Safety Net.77
Cost: Revenue neutral78
77 Estimated cost of $100 million per annum. 78 The new system is due to start on 1 July 2017. It is proposed that any additional costs not met by the changes to
income tests and subsidy rates would be covered through the redirection of savings committed in MYEFO.
Detailed modelling is required to assess the net impact of the changes.
65
7
The community services sector plays a vital role in our society and economy, yet has
been subjected to savage cuts through the last two Federal Budgets. Community
organisations deliver a broad range of services in communities around the country
including health and aged care, housing and homelessness, early childhood, disability,
legal, financially counselling, alcohol and drug services. These services form the
backbone of many communities, and provide essential support to many people who
are on low incomes or are otherwise disadvantaged.
7.1 Providing adequate and stable funding streams to support
effective services
Like many other social programs and supports, community services have experienced
major funding cuts in the last two budgets. The impact of these cuts continues to
ricochet across the country almost two years later, with an estimated value of $1.5
billion and rising. Cuts implemented to date or forthcoming include:
treatment programs, policy and advocacy capacity (2015 Budget over 4 years).
$500 million from Aboriginal and Torres Strait Islander programs (Department
of Prime Minister and Cabinet, 2014 Budget over 4 years).
$270 million from Social Services (2014 Budget over 4 years).
Millions cut across the community legal sector plus a further 30% cut ($12
million) to take effect from 2017.
Key groups experiencing poverty and inequality have been particularly impacted
through these funding cuts, including young people, people with disabilities and
people experiencing homelessness.
In addition to the devastating impact of the cuts outlined above, the prolonged
uncertainty associated with these funding decisions has wrought havoc in critical
areas of social infrastructure. Funding cuts were first introduced, then some partially
reversed, and still others rolled into new funding allocations and models of delivery.
As recently as December 2015 community workers continued to face uncertain
employment and job losses as programs ceased and organisations closed. Impacts on

66
people and communities include reduced access to services and increased
disadvantage. Particular uncertainty or erosion of capacity in policy advice,
representation and advocacy have exacerbated this impact, for example where peak
bodies have lost core funding and, in several cases, closed.
Restoration of funds cut in previous budgets would do little at this point for the people
who have gone without services in the interim, nor the organisations that have closed
and workers that have lost jobs. Moreover, the quantum of past funding has often been
arbitrary at best, grossly inadequate at worst. This Federal Budget should make
provision for, at a minimum, a restoration of the pre-existing funding levels for
community services, commencing from 1 July 2017, in order to fund
recommendations arising from a comprehensive mapping of service needs,
conducted in open with the community sector and the public.
To inform future funding of community services, the Government should immediately
commence work collaboratively with the community to determine together where
needs lie and how best to meet them. Following such a mapping process, new
investment in the outer years needs to support the full breadth of the community
ation by and of
people experiencing poverty and inequality. Future service agreements and contracts
should include provision for reasonable compensation to providers for the costs
imposed by changes in government policy that affect the delivery of the contracted
service, for example, changes to eligibility rules, the scope of the service being
provided, or reporting requirements, as recommended by the Productivity
Commission in its Report on the contribution of the not-for-profit sector (rec 8.1).79
This mapping should incorporate the specific and varied contribution of community
service organisations beyond service delivery, including policy advice, representation
and advocacy. In addition, we continue to argue for support for institutional capacity
for the voices of Aboriginal and Torres Strait Islander communities to be heard in
policy processes and national decision-making.
7.2 Ensuring competition policy reform delivers improved
service access and quality
79 Productivity Commission (2010) Contribution of the not-for-profit sector,
http://www.pc.gov.au/inquiries/completed/not-for-profit.

67
Decisions about the future of social services funding will take place in the context of a
broader discussion about the role of competition and contestability in human services.
In its response to the Competition Policy Review, the Commonwealth included a
commitment to establish an Australian Council for Competition Policy; and a proposed
reference to the Productivity Commission (PC) to explore how innovative funding and
delivery of human services, reduction of waste and high quality service provision can
be applied in practice to the human services sector.80 Efficiency and effectiveness
should be key outcomes of human service delivery, but they must be achieved
simultaneously. Efficiencies derived from delivering services that are less effective is
no efficiency at all. We must learn from the historic failure of markets to improve
efficiency without eroding service effectiveness; and the similar failure of markets to
meet the various needs of people affected particularly by poverty and inequality.
Effective policy reform will require strong community and community sector
involvement, including but not limited to direct representation of non-profit human
service and social policy experts on the Australian Council for Competition Policy and
as advisors to any PC reference. Undoubtedly the PC has much to contribute in any
new reference. However there are a range of outstanding Commission
recommendations whose implementation would fill a key evidence gap in the current
reform agenda: for example better mechanisms for measuring effectiveness would
enable us to measure the extent to which existing efforts to expand competition or
contestability in human services have improved outcomes for people and communities
(see for example recommendations 5.1 to 5.4 of PC 2010).81 We continue to call for the
collection of reliable data about impacts and effectiveness, and for access to those
data by communities and the organisations that support them, to inform effective
delivery of services and to better meet the needs of service clients and consumers.
7.3 Social innovation
Further gains can be made in the effectiveness of services by stimulating social
innovation in the community sector. Collaboration remains key here, whether it is
challenges; or through place-based approaches that build capacity for diverse
responses to the myriad needs and different contexts across the country. At a time
80 Australian Government (2015) Government Response to the Competition Policy Review at pp 34 and 2
respectively. Available: http://treasury.gov.au/harperreview. 81 Productivity Commission (2010) Contribution of the not-for-profit sector Available:
http://www.pc.gov.au/inquiries/completed/not-for-profit.
68
when the Commonwealth government is calling for innovative leaders across the
economic contribution place it at the
forefront of the innovation agenda. Again, this is not new terrain for community
organisations and we call for the implementation of a further PC recommendation in
this respect:
All programs (of over $10 million) delivering community services through not-
for-profit organisations should set aside a small proportion of the program
budget to a program-
recommendation of 1% of program funding). The fund should support trials of
new approaches to service delivery, including evaluation of their cost-
effectiveness (rec 9.5).82
Importantly, effective innovation requires the integration of emerging practices into
core work: it requires resources not just to trial and experiment, but to implement and
sustain good practices identified.
7.4 Support for charities to diversify funding
The Government has a stated agenda to promote philanthropy and support
organisations to diversity their funding base, yet the inequitable access to DGR for
many charities flies in the face of this objective. For example, small organisations who
can struggle to access support from philanthropic and other non-government sources
are less likely to have DGR status than others in the sector.83 The current disparate
access also constrains innovation, capacity development and the independence that
comes from diverse sources of funding. This recommendation has been supported by
a range of reviews over time.84 For more details, see Chapter 1.
82 Productivity Commission (2010) Op.Cit. 83 ACNC (2015) Australian Charities Report 2014, Australian Charities and Not-for-profits Commission,
http://www.acnc.gov.au/ACNC/Pblctns/Rpts/CharityReport2014/ACNC/Publications/Reports/CharityReport2014.
aspx. 84 For example PC 2010 (Op.Cit); Charitable Definitions Inquiry (2001),
http://www.treasury.gov.au/ConsultationsandReviews/Reviews/2001/Charities-Definition-Inquiry; and Not-for-
profit sector tax concession working group (2013) Fairer, simpler and more effective tax concessions for the not‑for‑profit sector, http://www.treasury.gov.au/~/media/Treasury/Access%20to%20Information/Disclosure%20Log/2014/1447/Down
loads/PDF/NFP%20Sector%20WG%20Final%20Report.ashx
69
Recommendation 26: Index community services funding to wage movements
Ensure funding for the delivery of community services includes adequate price
indexation tied to the Wage Price Index.
Costing: $370 million 2016-17 ($373 million 2017-2018)
Recommendation 27: Provision for restored funding levels to pre-Federal Budget
2014 levels, commencing from 1 July 2017
Provision for minimum anticipated funding required to fund community services to
adequate levels, arising from comprehensive mapping of service gaps
Costing: $0 million 2016-17 ($1,840 million 2017-2018)
Recommendation 28: Ensure direct representation of non-profit community
services in competition reforms
Any Government-established bodies to explore further competition policy reforms
should include representation from community based charitable and non-profit
services, including but not limited to the proposed Australian Council for Competition
Policy.
Costing: revenue neutral
Recommendation 29: Establish an innovation fund for government-funded
community services
All programs delivering community services through not-for-profit organisations
should set aside 1% of their program budget to a program-related social innovation
fund, supporting trials of new approaches to service delivery, including evaluation of
their cost-effectiveness.
Costing: $10 million 2016-17 ($15 million 2017-2018)85
85 This costing is indicative only.

70
Recommendation 30: Provide core funding for the institutional capacity of
Aboriginal and Torres Strait Islander representation in policy making and
national decision-making.
Costing: $3 million in 2016-2017) ($3.5 million in 2017-18)86
86 s First Peoples.

Australian Council of Social Service
www.acoss.org.au
@ACOSS