Profitability and Financial Performance Indicators in U.S ...
Upload
mark-slyterCategory
view
14download
0
How well do hospitals budget operating results? The relationship between budget variances and operating margin
A dissertation by Mark Slyter

HOW WELL DO HOSPITALS BUDGET OPERATING RESULTS? THE RELATIONSHIP BETWEEN BUDGET VARIANCES
AND OPERATING MARGIN
by
MARK F. SLYTER
S. ROBERT HERNANDEZ, COMMITTEE CHAIR NANCY M. BORKOWSKI
LARRY R. HEARLD DEAN G. SMITH
A DISSERTATION
Submitted to the graduate faculty of The University of Alabama at Birmingham, in partial fulfillment of the requirements for the degree of
Doctor of Science in Health Services Administration
BIRMINGHAM, ALABAMA
2016

ProQuest Number:
All rights reserved
INFORMATION TO ALL USERSThe quality of this reproduction is dependent upon the quality of the copy submitted.
In the unlikely event that the author did not send a complete manuscriptand there are missing pages, these will be noted. Also, if material had to be removed,
a note will indicate the deletion.
ProQuest
Published by ProQuest LLC ( ). Copyright of the Dissertation is held by the Author.
All rights reserved.This work is protected against unauthorized copying under Title 17, United States Code
Microform Edition © ProQuest LLC.
ProQuest LLC.789 East Eisenhower Parkway
P.O. Box 1346Ann Arbor, MI 48106 - 1346
10246287
10246287
2016

Copyright by Mark. F. Slyter
2016

iii
HOW WELL DO HOSPITALS BUDGET OPERATING RESULTS? THE RELATIONSHIP BETWEEN BUDGET VARIANCES
AND OPERATING MARGIN
MARK F. SLYTER
DOCTOR OF SCIENCE IN HEALTH SERVICES ADMINISTRATION
ABSTRACT
There is a near-universal assumption in both practice and literature that greater
accuracy and management to the budget improves profitability (Libby & Lindsay, 2010;
Umapathy, 1987). Prior to this study, this assumption has gone untested and we know
little about the wisdom of such an assumption.
The results of this study indicate greater accuracy in forecasting and/or tighter
management to the budget, or favorably exceeding it, leads to improved profitability.
More specifically, smaller unfavorable budget variances are associated with greater
operating margins while greater favorable budget variances are associated with greater
operating margins. A single standard deviation reduction in unfavorable revenue and
expense increases operating margin by 5.2% and 6.3%, respectively. An equivalent
favorable deviation in revenue and expense increases operating margin by 3.2% and
2.7%, respectively. Managers can improve hospitals’ operating margins by first
prioritizing the reduction and/or eliminating unfavorable variances, and second increasing
favorable variances.
Keywords: hospital, budget, variances, profitability, financial performance, multiple
linear regression

iv
DEDICATION
This dissertation is dedicated to my mother, Hazel Holt Slyter, who provided
consistent and positive reinforcement and encouragement as well as to my wife, Lisa
Slyter, and children, Catherine, Emma and Christian, for their patience and support in
attaining my life goal of a doctoral degree.

v
ACKNOWLEDGEMENTS
Sincere appreciation to the faculty and staff of the University of Alabama at
Birmingham School of Health Professions for their assistance and direction. Special
thanks to my dissertation committee Bob Hernandez, Nancy Borkowski, Larry Hearld,
and Dean Smith.
vi
TABLE OF CONTENTS
Page
ABSTRACT ................................................................................................................... iii
DEDICATION ............................................................................................................... iv
ACKNOWLEDGEMENTS ........................................................................................... v
LIST OF TABLES ......................................................................................................... viii
LIST OF FIGURES ....................................................................................................... ix
CHAPTER
1 INTRODUCTION ................................................................................................... 1
Significance of Study ................................................................................... 6 Research Question and Hypotheses ............................................................. 8 Plan of Work ................................................................................................ 8
2 LITERATURE REVIEW ........................................................................................ 10
The Purpose of Budgeting and Its Potential Influence on Performance ...... 10 Planning ................................................................................................. 12 Coordination .......................................................................................... 14 Oversight ................................................................................................ 15 Motivation .............................................................................................. 16 Motivation and the Expectancy Theory ................................................. 17
Criticisms of Budgeting ............................................................................... 19 The Relationship of Hospital Characteristics to Performance ..................... 21 Control Theory ............................................................................................. 25
3 RESEARCH METHODOLOGY............................................................................. 30
Data Sources and Collections ...................................................................... 30 Measures ...................................................................................................... 31 Research Question and Hypothesis .............................................................. 31 Data Preparation........................................................................................... 32 Data Analysis ............................................................................................... 37

vii
4 RESULTS AND FINDINGS ................................................................................... 46
Descriptive Statistics .................................................................................... 46 Research Question and Hypotheses ............................................................. 50
Page
5 SUMMARY AND CONCLUSIONS ...................................................................... 63
Purpose of Study: Research Question and Hypotheses ............................... 63 Discussion and Findings .............................................................................. 64 Limitations ................................................................................................... 66 Recommendation for Future Research ......................................................... 66 Final Conclusions......................................................................................... 68
6 LIST OF REFERENCES ......................................................................................... 69
7 APPENDIX .............................................................................................................. 89
A Hospitals and Hospital Characteristics ........................................................ 89
B Quartile and Boundary Statistics (Dataset) .................................................. 95
C Descriptive Statistics (Dataset) .................................................................... 98
D University of Alabama at Birmingham Institutional Review Board
Letter of Approval........................................................................................ 101
viii
LIST OF TABLES
Table Page
1 Examples of Value Rewards both Positive and Negative ........................................ 17
2 Hospital Characteristics ........................................................................................... 30
3 Selected Independent and Dependent Variables ...................................................... 31
4 Hospital Characteristics ........................................................................................... 46
5 Descriptive Statistics of Dataset .............................................................................. 47
6 Descriptive Statistics of Regression Analysis (Models A, B, C, and D) ................. 48
7 Descriptive Statistics of Regression Analysis (Model E: Full Model) .................... 49
8 Descriptive Statistics: Favorability Case Count ...................................................... 50
9 ANOVA* Revenue (A), Expense (B), Volume (C), Combined (D), and Full (E) ... 52
10 Model Summary Rev. (A), Exp. (B), Vol. (C), Combined (D), and Full (E) .......... 53
11 Coefficients* Rev. (A), Exp. (B), Vol. (C), and Combined (D) ............................... 55
12 Coefficients* Full (E) Model .................................................................................... 56
13 Model Summary Stepwise Regression Models 1-9 ................................................. 59
14 Coefficients* Stepwise Model 9 ............................................................................... 60
15 Excluded Variables* Stepwise Model 9 ................................................................... 60

ix
LIST OF FIGURES
Figure Page
1 Hospital closures in the United States, 1987-2012 .................................................. 4
2 Hospital mergers in the United States, 1998-2014 .................................................. 6
3 Components of the budgeting process ..................................................................... 11
4 Traditional annual budgeting process ...................................................................... 21
5 Control theory and budgets ...................................................................................... 27
6 Variance formulas for independent variables (X) .................................................... 32
7 Favorable/unfavorable variance formulas for independent variables (X) ............... 33
8 Favorable/unfavorable dummy variable formulas ................................................... 34
9 Favorable/unfavorable budget variance interaction formulas .................................. 34
10 Operating margin formula ........................................................................................ 35
11 Outlier formulas for lower and upper bounds .......................................................... 35
12 Hospital characteristics dummy variable formulas .................................................. 36
13 Time dummy variable formulas ............................................................................... 36
14 Multiple linear regression models for revenue (A), expense (B), volume (C),
combined (D), and full model (E) ............................................................................ 38
15 Multiple linear regression equations ........................................................................ 42
16 Favorable and unfavorable budget variance impact on operating margin ............... 58
1
Chapter 1
Introduction
Health care costs too much. This is an ever increasing sentiment in the United
States, and there is certainly evidence to support this opinion. Federal spending is
increasing faster than tax revenues and elevating the national debt issues. An
overwhelming majority of federal spending is comprised of entitlements, specifically–
Medicare, Medicaid, and Social Security. The largest entitlement, Medicare and
Medicaid, is a primary driver of federal debt because these health care costs are
disproportionately rising faster than other segments of government spending. Legislators
in the United States are responding with extensive reforms to lower payment rates for
providers.
As the largest recipient of government provider payments, hospitals are the target
of significant payment reductions (Medicare Payment Advisory Commission, 2012).
Payment reductions are occurring at a time when hospitals are experiencing declining
operating margins with the current median margins at only 3% (American Hospital
Association, 2013). The decline in hospital margins is expected to continue with
reductions in Medicare, disproportionate share, and other payments scheduled in the
Patient Protection and Affordable Care Act (ACA) (Steingart & Smith, 2014). The
Congressional Budget Office and Joint Committee on Taxation (2012) report estimates
hospital reimbursements would be reduced by $260 billion from 2013-2022. In this
health reform environment, hospitals have only a few response options–lower the cost of

2
service, discontinue the service, close or sell the hospital, or change the service by
altering the care delivery model.
There is extensive evidence to support hospital capacity to lower costs for
services without compromising quality. Eliminating waste and inefficiency are some of
the most cited opportunities for hospitals in reducing the cost of care (Delaune & Everett,
2008; Institute of Medicine, 2001; Kelley, 2009; Smith, Saunders, Stuckhardt, &
McGinnis, 2013). Berwick, a leading champion of reducing inefficiencies, estimated that
waste exceeds 20% of total health care expenditures in just six areas: (a) overtreatment,
(b) failures of care coordination, (c) failures in execution of care processes, (d)
administrative complexity, (e) pricing failures, and (f) fraud and abuse (Berwick &
Hackbarth, 2012).
These findings are consistent with an earlier study by Zuckerman, Hadley, and
Iezzoni (1994) which identified inefficiency opportunities specific to hospitals. The
opportunity to lower costs is also supported by The Dartmouth Institute research related
to variations in care. Fisher et al. (2003a) found regional Medicare spending differences
were largely explained by the practice patterns of inpatient and specialist physicians.
These higher spending differences did not correlate to improved quality, access, health
outcomes, or satisfaction with care (Fisher et al., 2003a, 2003b).
To pursue lower cost strategies, many hospitals are adopting “break-even on
Medicare” budget plans that establish stepwise reductions in cost structure (Alkire, 2014;
Herman, 2012; Minich-Pourshadi, 2011). In general, these strategies are focused on
reducing the annual growth rate in expenses over the next five or more years from
roughly 5% down to 1-2% per year (Kerns, Koppenheffer, & Drayton, 2013). Over time,

3
these strategies are intended to achieve a cost structure that is at or below hospital
Medicare payments. These strategies emphasize the importance of setting and achieving
performance measures that build upon successive improvements targeted in a hospital’s
budget.
Eliminating services or closing a hospital as a response to health reform is an
option that several hospitals have selected during periods of transition. Hospitals
regularly limit or discontinue underperforming services to balance their budgets. For
example, Hsia, Kellermann, and Shen (2011) explored the decline of hospital emergency
departments from 1990 to 2009 due to low profit margins, competition, change in
ownership, and designation as the safety-net provider.
These closures can be disruptive, but they pale in comparison to the closure of a
hospital that impacts access to services and jobs as well as the overall economy of a
community. For most communities, hospitals provide an essential economic base
accounting for 15% to 20% of employment and income (Doeksen, Johnson, &
Willoughby, 1997). Furthermore, hospitals are frequently an economic asset in attracting
business and industry to a community.
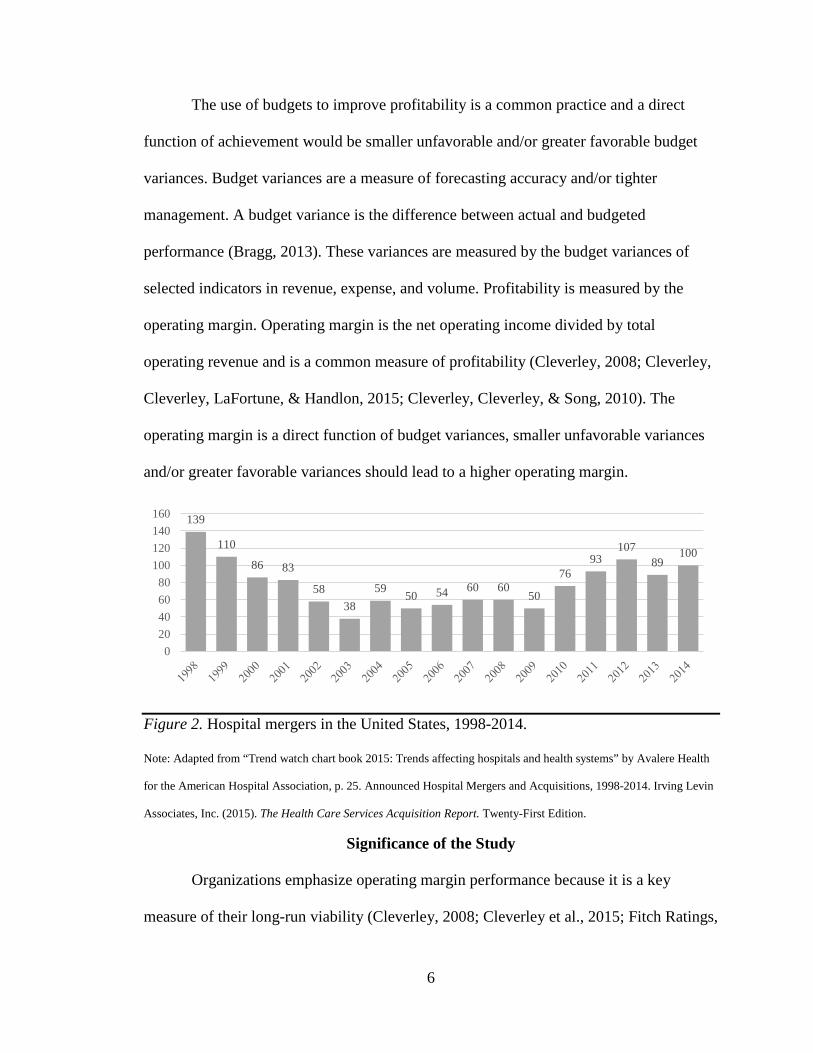
Hospital closures accelerate following periods of rapid payment change (see
Figure 1). In the late 1980s hospital closures spiked after the introduction of the
Prospective Payment System in 1983 (Office of Inspector General, 2002). The trend
subsided until the late 1990s when hospital closures rose sharply in the three years
following the Budget Reconciliation Act of 1997 (Office of Inspector General, 2003a,
2003b). The ACA of 2010 (Office of the Legislative Counsel, 2010) is another significant
payment reform with the potential to escalate the number of hospital closures once again.

4
Figure 1. Hospital closures in the United States, 1987-2012.
Note: Adapted from “Hospital Closure, 2000” by Office of Inspector General, p. 5. Hospital Closure, 1987-1999.
Adapted from “A data book: Health care spending and the Medicare program” by Medicare Payment Advisory
Commission, p. 53. Annual changes in number of acute care hospitals participating in the Medicare program, 2000–
2012. Adapted U.S. Government works no permission required under U.S. Code Title 17 § 105.
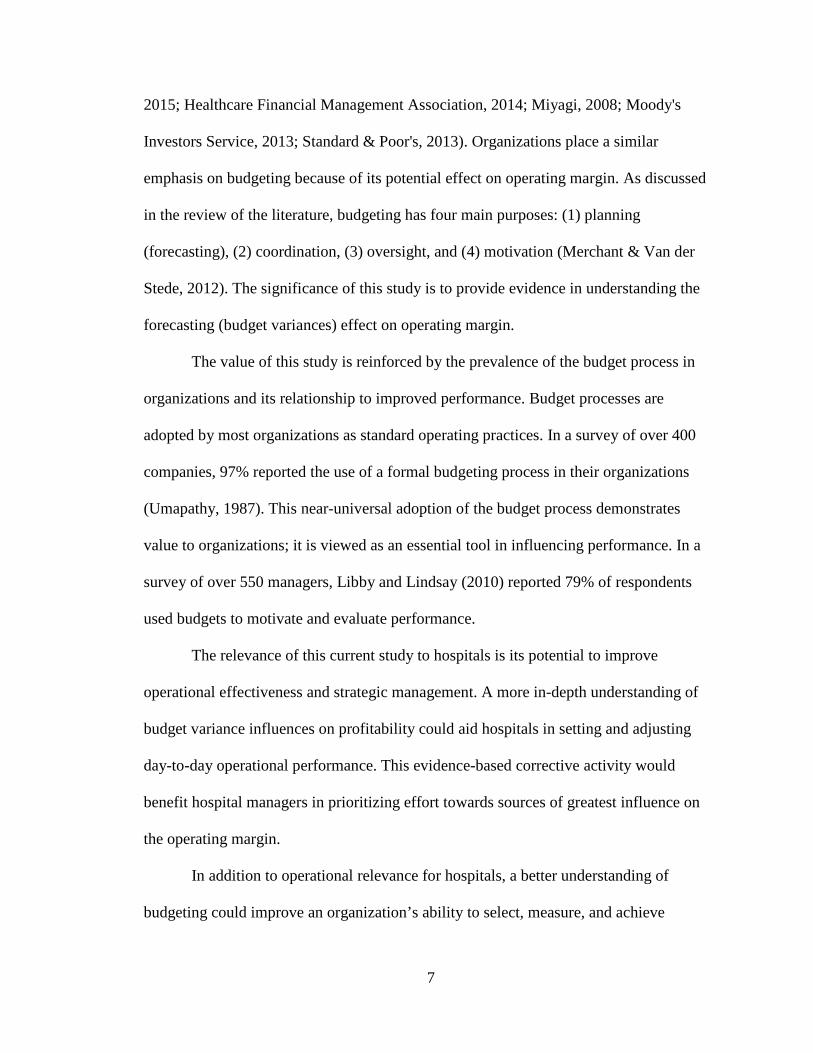
A related exit strategy to closure is selling the hospital. The merger and
acquisition activity in the hospital sector mirrors closure trends with financial pressures
typically triggering the pursuit of this strategy (see Figure 2). Hospitals contend these
mergers add value through enhanced efficiency, leverage, and purchasing power as well
as reduction in duplication, excess capacity, transaction, and infrastructure costs.
Although this rationale continues to influence hospital consolidation decisions, the
current drive for size and scale is strategic, it positions the hospital for the shift from
volume to value payment arrangements (Molpus & Elek, 2010). Currently, merger and
acquisition decisions for hospitals center on transforming the care delivering model,
securing covered lives, managing population health, and mitigating risk.
An alternative to cost reduction, closing, or selling strategies in response to health
reform is for a hospital to transform its own health care delivery model. A generally
accepted description of the desired transformation is defined by the Institute for
69
8876
56 5750
42
16
37 37 38 43
64 6963
3446
63
32 28 28 2430
512 17
0102030405060708090
100

5
Healthcare Improvement’s Triple Aim dimensions–improving the patient experience,
improving the health of the population, and reducing per capita cost of health care
(Stiefel & Nolan, 2012). This model is driven by the Centers for Medicare & Medicaid
Services (CMS) through its numerous demonstration projects (Centers for Medicare &
Medicaid Services, 2015).
Additionally, private businesses are collaborating in this transformation effort to
make care more accessible. Two of the most notable examples of these private
consortium efforts are the Health Care Transformation Task Force (2015) and the Health
Transformation Alliance (2016). The Health Care Transformation Task Force (HCTTF)
is a group of businesses that bring together patients, payers, providers and purchasers to
achieve sweeping transformation. As proposed, between 2015 and 2020, each business in
the HCTTF consortium commits to attaining 75% of its care through a value-based
payment arrangement. In a similar emphasis on value, the Health Transformation
Alliance (HTA) has goals to improve health care benefits and outcomes for its
employees. Transformational examples of public and private sector organizations are
clear indications that health care delivery is changing, and hospitals will need to change
in similar ways to respond to the market.
The ability of hospitals to respond to payment reductions and delivery system
changes can be measured through budget performance. Hospitals plan responses and
program these into the capital and operational budgets. Although payers and trade
associations have annual financial performance data for hospitals these surveys do not
capture budget information. Due to this lack of information, there is a gap in studies that
describe the relationship between budget variances and profitability.
6
The use of budgets to improve profitability is a common practice and a direct
function of achievement would be smaller unfavorable and/or greater favorable budget
variances. Budget variances are a measure of forecasting accuracy and/or tighter
management. A budget variance is the difference between actual and budgeted
performance (Bragg, 2013). These variances are measured by the budget variances of
selected indicators in revenue, expense, and volume. Profitability is measured by the
operating margin. Operating margin is the net operating income divided by total
operating revenue and is a common measure of profitability (Cleverley, 2008; Cleverley,
Cleverley, LaFortune, & Handlon, 2015; Cleverley, Cleverley, & Song, 2010). The
operating margin is a direct function of budget variances, smaller unfavorable variances
and/or greater favorable variances should lead to a higher operating margin.
Figure 2. Hospital mergers in the United States, 1998-2014.
Note: Adapted from “Trend watch chart book 2015: Trends affecting hospitals and health systems” by Avalere Health
for the American Hospital Association, p. 25. Announced Hospital Mergers and Acquisitions, 1998-2014. Irving Levin
Associates, Inc. (2015). The Health Care Services Acquisition Report. Twenty-First Edition.
Significance of the Study
Organizations emphasize operating margin performance because it is a key
measure of their long-run viability (Cleverley, 2008; Cleverley et al., 2015; Fitch Ratings,
139
110
86 83
5838
59 50 54 60 6050
7693
10789
100
020406080
100120140160
7
2015; Healthcare Financial Management Association, 2014; Miyagi, 2008; Moody's
Investors Service, 2013; Standard & Poor's, 2013). Organizations place a similar
emphasis on budgeting because of its potential effect on operating margin. As discussed
in the review of the literature, budgeting has four main purposes: (1) planning
(forecasting), (2) coordination, (3) oversight, and (4) motivation (Merchant & Van der
Stede, 2012). The significance of this study is to provide evidence in understanding the
forecasting (budget variances) effect on operating margin.
The value of this study is reinforced by the prevalence of the budget process in
organizations and its relationship to improved performance. Budget processes are
adopted by most organizations as standard operating practices. In a survey of over 400
companies, 97% reported the use of a formal budgeting process in their organizations
(Umapathy, 1987). This near-universal adoption of the budget process demonstrates
value to organizations; it is viewed as an essential tool in influencing performance. In a
survey of over 550 managers, Libby and Lindsay (2010) reported 79% of respondents
used budgets to motivate and evaluate performance.
The relevance of this current study to hospitals is its potential to improve
operational effectiveness and strategic management. A more in-depth understanding of
budget variance influences on profitability could aid hospitals in setting and adjusting
day-to-day operational performance. This evidence-based corrective activity would
benefit hospital managers in prioritizing effort towards sources of greatest influence on
the operating margin.
In addition to operational relevance for hospitals, a better understanding of
budgeting could improve an organization’s ability to select, measure, and achieve
8
strategies. Budgets are a quantitative reflection of the strategies or expectations hospitals
set in response to the market. The evolving health care environment is placing greater
emphasis on strategy for hospitals. Porter and Lee (2015) suggested that this stress is
relatively foreign to a sector that equates strategy to good operational performance. As
operational effectiveness and strategy assumes greater importance for hospitals so too
does an understanding of the measures of success recognized in the budget.
Research Question and Hypotheses
The purpose of this study was to examine the relationship between hospital
budget variances and profitability. Specifically, this study examined the following
research question and three hypotheses for hospitals:
Are smaller budget variances (more accurate forecasting and/or tighter management)
associated with greater operating margins?
1. H1: Smaller budget variances are associated with greater operating margins.
2. H2: Smaller unfavorable budget variances are associated with greater operating
margins.
3. H3: Greater favorable budget variances are associated with greater operating margins.
Plan of Work
Following the study introduction in Chapter 1, Chapter 2 provides a review of the
research literature on budgeting and its relationship to performance. Evidence is
examined regarding the organizational rationale for using budgets and the ways in which
the budgeting process is associated with performance. Chapter 2 concludes with a review

9
of Control Theory, which illustrates why budgets have an effect on financial
performance.
Chapter 3 describes the research design used in the study and discusses the study
hypotheses. The methodology includes a description of the sample, variables, and
analysis. Chapter 4 presents the results of the hypotheses tested. Chapter 5 provides a
discussion and interpretation of study findings and notes study limitations. This final
chapter also outlines practical recommendations for hospital managers and potential
opportunities for future research.

10
Chapter 2
Literature Review
A review of the literature associated with budgeting and its relationship to
performance provides context and insights. Therefore, this literature review considers the
following areas: (1) the purpose of budgeting and its potential influence on performance,
(2) the relationship of hospital characteristics to performance, and (3) a theory to explain
the association between budgeting and performance.
The Purpose of Budgeting and Its Potential Influence on Performance
Budgeting is a component of management control systems (MCS) research. First
defined by Anthony (1965), management control is “the process by which managers
ensure that resources are obtained and used effectively and efficiently in the
accomplishment of the organization’s objectives” (p. 17). This definition identifies a
fundamental reason that organizations budget–to provide managers a process of influence
on performance and a tool to achieve organizational plans. Organizations that maintain
appropriate controls are likely to favorably influence performance toward plan objectives,
“regardless of whether these objectives are to maximize shareholder returns, heal the
sick, or educate the young” (Merchant & Otley, 2006, p. 785)
The purpose of budgeting extends beyond management control as this activity
intertwines with every step in the traditional annual budgeting process (see Figure 3).
Ronen and Livingstone (1975) emphasized that the functions of budgeting span across
planning, control, and motivation. The budgeting process begins with planning, and these
decisions feed the management control process. Anthony and Young (2003) identified
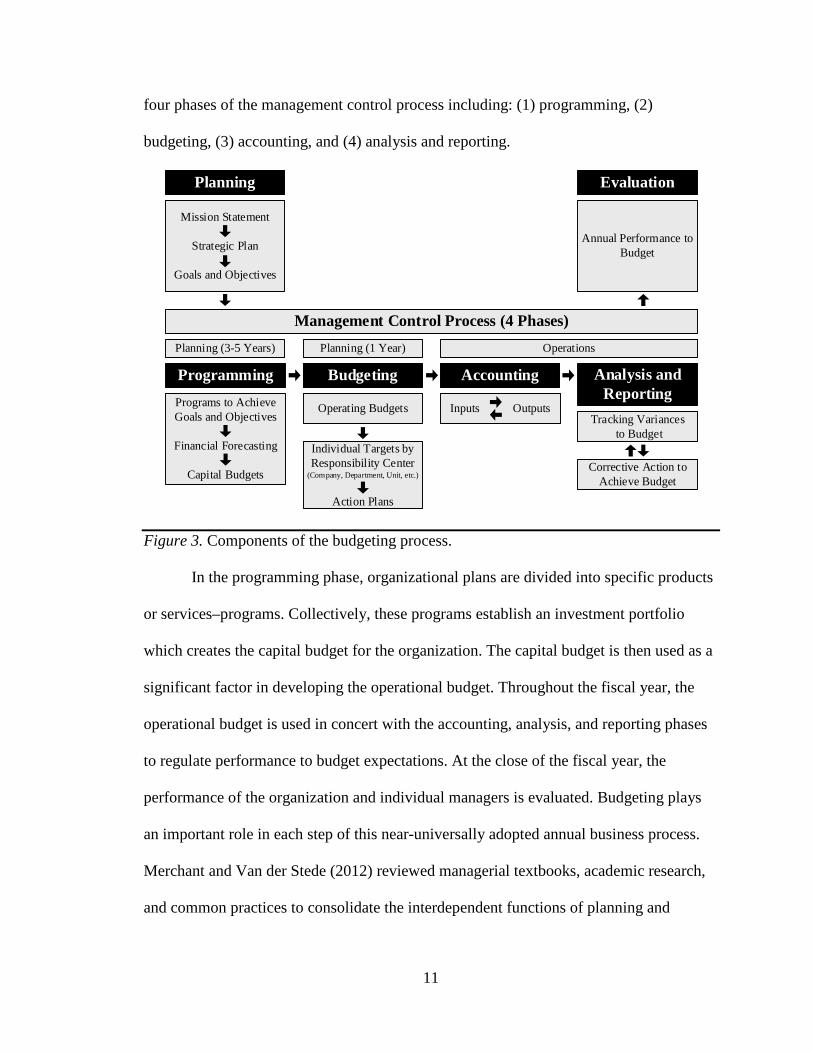
11
four phases of the management control process including: (1) programming, (2)
budgeting, (3) accounting, and (4) analysis and reporting.
Mission Statement
Strategic Plan
Goals and Objectives
Budgeting
Operating BudgetsTracking Variances
to Budget
Annual Performance to Budget
Planning Evaluation
ProgrammingPrograms to Achieve Goals and Objectives
Financial Forecasting
Capital Budgets
Individual Targets by Responsibility Center
(Company, Department, Unit, etc.)
Action Plans
Analysis and Reporting
Accounting
Operations
Management Control Process (4 Phases)
Inputs Outputs
Planning (3-5 Years)
Corrective Action to Achieve Budget
Planning (1 Year)
Figure 3. Components of the budgeting process.
In the programming phase, organizational plans are divided into specific products
or services–programs. Collectively, these programs establish an investment portfolio
which creates the capital budget for the organization. The capital budget is then used as a
significant factor in developing the operational budget. Throughout the fiscal year, the
operational budget is used in concert with the accounting, analysis, and reporting phases
to regulate performance to budget expectations. At the close of the fiscal year, the
performance of the organization and individual managers is evaluated. Budgeting plays
an important role in each step of this near-universally adopted annual business process.
Merchant and Van der Stede (2012) reviewed managerial textbooks, academic research,
and common practices to consolidate the interdependent functions of planning and

12
budgeting into four main purposes: (1) planning, (2) coordination, (3) oversight, and (4)
motivation.
Planning. Budgeting has a complementary role in planning; planning positions
organizations for the future while budgeting measures the performance to the plan
(Gapenski, 2011). Budgets play an important role in translating planning strategies into
measurable expectations for managers (Merchant, 1981; Simons, 2013). While there is a
functional purpose of budgets in planning, there remains scarce research studies
concerning the relationship between these two activities.
Langfield-Smith (1997) reviewed management control systems (MCS) and
strategy and concluded that knowledge in this relationship was limited to nine empirical
studies (Daniel & Reitsperger, 1992; Daniel & Reitsperger, 1991; Govindarajan, 1988;
Govindarajan & Fisher, 1990; Govindarajan & Gupta, 1992; Khandwalla, 1972;
Merchant, 1985b; Miller & Friesen, 1982; Simons, 1987) and eight case studies (Archer
& Otley, 1991; Dent, 1991; Knights & Willmott, 1993; Roberts, 1990; Simons, 1987,
1990, 1991, 1994). Additionally, these studies had a narrow focus in examining
situational influences on the type of control systems (e.g., budgets, auditing, incentives)
best suited for particular strategies (prospector or defender).
A common conclusion in these studies was MCS does play a supportive role in
strategy implementation and influences strategic formulation, implementation, and
change (Langfield-Smith, 1997). The situational influences in this type of contingency
research are limited by the assumption in the existence of a single best way to manage or
organize.

13
Beyond the situational influences of strategy on MCS, there are a few examples of
the relationship of MCS on strategy, such as the effectiveness of MCS activities leading
up to selecting a strategy (Mintzberg, 1978; Mintzberg & Waters, 1985) or the absence of
controls in establishing their strategies in many organizations (Goold & Quinn, 1990). A
reason for the limitations in planning and MCS research is the differing view of the scope
of these controls.
The seminal work of Anthony (1965) in MCS established a practicing definition
which did not include strategic planning and therefore arbitrarily narrowed the early
research in this area. As previously mentioned, Anthony and Young (2003) described
strategy formulation as a separate planning function outside of MCS but included
programming that contains the planning components of forecasting and capital budgeting.
Goold and Quinn (1990) viewed planning strategy as another control activity in a
system that is focused on longer-term goals. Merchant and Van der Stede (2012),
however, viewed planning and MCS as separate but interconnected activities. Whether
MCS is perceived as a separate or inclusive part of planning, researchers have
consistently recognized that budgets serve a role in the preparation and measurement of
strategic goals.
Emmanuel, Otley, and Merchant (1990) regarded financial forecasting as an
element of budgeting and an essential component of the planning process. Many research
studies examine financial forecasting as it relates to the accuracy of analysts predicting
future earnings. Evidence is building to support the idea that select factors (e.g., past
performance, experience, resources, portfolio complexity, forecast period) are positively
associated with forecast accuracy (Brown, 2001; Clement, 1999; Sinha, Brown, & Das,

14
1997; Stickel, 1992); contradicting early findings that did not control for these
differences (Brown & Rozeff, 1980; Butler & Lang, 1991; O'Brien, 1990; Richards,
1976). These studies are limited to factors associated with forecast accuracy and do not
address the research question in this study: Are smaller budget variances (e.g., forecast
accuracy) associated with greater operating margins (e.g., higher earnings)?
Coordination. Budgets are used to coordinate and communicate activity in an
organization. The financial strategies and goals of the organization are communicated
down to management control units or responsibility centers in the budget (Cleverley et
al., 2010). Concurrently, frontline leaders are communicating up the chain of command
the constraints, resources, and risks as well as other information to validate and modify
the top-down budget expectations (Merchant & Van der Stede, 2012).
Hopwood (1976) described this vertical, bidirectional communication as one of
the most important benefits of the budgeting process. The vertical sharing of information
suggests a relationship to budget participation, organizational commitment, and job
performance (Parker & Kyj, 2006). Communication also occurs laterally to various
divisions, businesses, and functional areas to align budget expectations across the
organization.
For example, the finance and operational departments cross reference and align
their budgeted volume targets with the marketing department. Emmanuel et al. (1990)
identified the importance of budgets in coordinating the interrelated and aggregate
activities of the various responsibility centers as well as heightening the visibility of top
priorities within the organization.

15
Oversight. The most fundamental purpose of budgeting is its oversight controls.
These controls focus on the basic accounting function of budgets that set estimates and
establish financial expectations over a specified period of time. Budgeted financial
expectations serve as an essential management control process (Hansen, Otley, & Van
der Stede, 2003) and remain a universally adopted business practice (Ekholm & Wallin,
2000; Hansen & Van der Stede, 2004; Libby & Lindsay, 2010; Otley, 1999; Umapathy,
1987).
All four phases of management control have an oversight role in budgeting
(Anthony & Young, 2003). In the programming phase, capital investment and other
resource allocation techniques are designated and layered into respective department
budgets (Merchant & Van der Stede, 2012). The adjustment of this planned capital spend
based on deviations to the operational budget is the primary oversight function in the
programming phase. Beyond capital spending adjustments, the oversight activity in
budgeting is concentrated with the phases of budgeting, accounting, analysis, and
reporting.
In the budgeting phase, organizations typically set the budget to cover the
forthcoming year. Cleverley et al. (2010) succinctly defined a budget as “a quantitative
expression of a plan of action” (p. 356). Anthony and Young (2003) added to this
definition: “formulated within a ceiling of estimated available resources” (p. 487). As
outlined in the coordination role, the budget is then translated to the various responsibility
centers and respective managers.
The dissemination of accountability serves as a formal authorization to define a
manager’s discretion in controlling production and spending as well as his or her overall

16
scope of responsibility (Emmanuel et al., 1990). With regard to budgetary motivation, the
tiered goal application from the organizational level down to the individual level has an
effect on performance (Baum, Locke, & Smith, 2001; Latham & Locke, 1975; Locke &
Latham, 2002; Martocchio & Frink, 1994; Rodgers & Hunter, 1991).
The accounting, analysis, and reporting phases of budgetary oversight serve as the
attention-directing function to alert managers of a deviation and the specific areas to
focus on to better understand the variation (Simon, 1954). The accounting function
supplies the actual performance by recording inputs and outputs. Actual performance is
then compared to the budget and prior year in the analysis and reporting phases. During
this phase, variances are reviewed and managers begin to problem solve in earnest by
identifying issues and courses of action and weighing the economic consequences of
these actions (Simon, 1954).
Motivation. As a MCS, budgets are a tool in the process of influencing behavior
(Flamholtz, Das, & Tsui, 1985). Budgets were naturally adopted for evaluation because
they provided a commonly available standard of measurement against actual performance
(Hansen et al., 2003). Adoption of budgets as the predominant standard for evaluation
was reinforced by shareholders’ desire to connect performance measures to return on
investment (Otley, 1999). Budgets easily link individual and firm performances and
provide management teams compensation to track more consistently with organizational
profitability (Merchant & Van der Stede, 2012).
Based on this connection, budgets quantify desired returns while measuring both
unit and manager performance against these expected targets (Brownell & Dunk, 1991).
If targets are attached to a valued reward (see Table 1) then a manager’s motivation is

17
enhanced and he or she is more likely to achieve the budget (Argyris, 1952). The budget-
incentive combination serves to attract attention in an effort-directing role as well as to
motivate with an effort-inducing purpose (Merchant & Van der Stede, 2012).
Table 1 Examples of Value Rewards both Positive and Negative
(Merchant, 1998)
Due to this accessible and measurable connection to desired outcomes, the use of
budgets in performance evaluations is a common practice (Merchant, 1981). Numerous
studies and accounting texts also support the connection between achievement of budget
targets and a monetary reward in performance evaluation (Atkinson, Banker, Kaplan, &
Young, 1995; Govindarajan, 1988; Gupta, 1987; Horngren, Bhimani, Datar, & Foster,
2002; Porter, 1980; Simons, 1987; Zimmerman & Yahya-Zadeh, 2011). However, the
effect of monetary incentives on budget performance is dependent on skill, complexity,
goals, and rewards (Bonner & Sprinkle, 2002).
Motivation and the Expectancy Theory. Vroom’s (1964) expectancy theory of
motivation is often used to describe budgetary motivation. The theory suggests that goals
are effective in motivating individuals if they have (1) a positive correlation between
Positive Rewards Negative Rewards
Monetary Nonmonetary Salary Increases Bonuses Stock Options Restricted stock Paid time off Prizes (e.g., Trips) Perquisites
(e.g., Country Club membership)
Promotion Titles Elevated decision-making Job assignments Office assignments Reserved parking Autonomy Power Recognition Praise Job Security
Absence of positive reward No increase in salary Loss of bonus Loss of job Loss of autonomy No promotion Demotion Chastisement Public humiliation

18
effort and performance–that is reasonably attainable; (2) a positive relationship between
performance and a valued reward; (3) a valued reward that satisfies a need; and (4) a
desire that exceeds the required effort. All of these elements are dependent on how
deeply the employee values the reward (valence), how competent and capable the
employee feels about achieving the goal (expectancy), and the level of trust the employee
has in receiving the reward if the goal is achieved (instrumentality).
Ronen and Livingstone (1975) examined the expectancy theory more specifically
related to budgets and identified five assumptions in the research literature: (1) budgets
should be reasonably attainable (Bayton, 1943; Becker & Green, 1962; Cherrington &
Cherrington, 1973; Child & Whiting, 1949; Hofstede, 1968; Lewin, Dembo, Festinger, &
Sears, 1944; Stedry, 1959); (2) budgets should include participation between manager
and superior (Becker & Green, 1962; Caplan, 1966; Cherrington & Cherrington, 1973;
Coch & French, 1948; Kay, French, & Meyer, 1962; Leavitt, Pondy, & Boje, 1964;
Lewin, 1936; Lewin et al., 1944; Vroom, 1964; Welsch, 1976); (3) budgets emphasize
management by exception with attention drawn to unfavorable deviations as opposed to
favorable variations (Birnberg & Nath, 1967; Cherrington & Cherrington, 1973; Sayles &
Chandler, 1971; Vroom, 1964); (4) budgets require an appropriate level of controllability
where the manager has the competency, capability and authority to make decisions and
execute them (Feather, 1967; Vroom & Maier, 1961) dependent on variables in their
personality (Lefcourt, 1965; Rotter, Liverant, & Crowne, 1961; Sutcliffe, 1956); and (5)
budgets are well-suited for evaluating performance because they are limited to
quantitative, monetary measures.

19
Rockness (1977) reinforced these five assumptions and added that budgets need
to be reasonably difficult, predictably tied to the reward, and used in conjunction with
regular feedback of the results. Additional studies have supported the value of difficult
but achievable budget targets in achieving favorable performance (Hirst & Lowy, 1990;
Merchant & Manzoni, 1989; Wentzel, 2002). In the absence of achievable targets, setting
high budget goals has had an adverse effect on performance (Kenis, 1979).
In the research literature, the evaluation of a manager’s performance in achieving
an assigned budget is often based on the following three key constructs: budget use,
budget emphasis, and budget participation (Sivabalan, Booth, Malmi, & Brown, 2009).
Budget use focuses on evaluations as the primary purpose for budgeting (Abernethy &
Stoelwinder, 1991; Swieringa & Moncur, 1975). Budget emphasis research has resolved
initial conflicting results to demonstrate the manager’s attention and collaboration on the
budget improves achievement of these targets (Brownell & Dunk, 1991; Brownell &
Hirst, 1986; Hopwood, 1972; Otley, 1978; Van der Stede, 2001). Finally, budget
participation between the manager and supervisor is evident when setting expectations
supports the positive effect on job performance (Argyris, 1952; Becker & Green, 1962;
Brownell, 1982; Merchant, 1981; Nouri & Parker, 1998; Shields & Shields, 1998).
Researchers have noted that intervening variables, such as motivation and role ambiguity,
need further study to explain conflicting results (Bryan & Locke, 1967; Stedry, 1959).
Criticisms of Budgeting
Budget slack, commonly referred to as sandbagging or padding the budget, is one
of several issues that challenges the effectiveness of a traditional annual budgeting
process. Budget slack introduces contradictory evidence to refute the use of difficult

20
targets, supervisor attention, and budget participation (Dunk, 1993; Fisher, Maines,
Peffer, & Sprinkle, 2002; Merchant, 1985a; Schiff & Lewin, 1970). Budget slack is an
inherent enticement for managers at all levels to understate budgets in order to maximize
their individual reward (Horngren et al., 2002; Jensen, 2001, 2003). Although moderating
strategies demonstrate an ability to lessen the effect of budget slack (Waller, 1988;
Weitzman, 1976; Young & Lewis, 1995), few organizations employ these strategies in
practice (Atkinson et al., 1995; Waller, 1994).
In addition to the issue of budget slack, Hope and Fraser (2013) cited three main
dysfunctions to the annual budgeting process: (1) budgeting is cumbersome and
expensive; (2) budgeting is antiquated and does not take advantage of real-time
capabilities of today’s technology; and (3) fixed targets in budgeting only lead to
incremental improvements and incentives to ‘game the numbers’ for personal gain.
Additional criticisms reference annual budgets as time-consuming, rigid, and strategically
stifling which frequently lead to an appropriations mentality–spend the annual budget
allocations in full otherwise next year’s budget could be reduced (Gurton, 1999; Hope &
Fraser, 1999, 2003; Schmidt, 1992).
Activities in the planning, programming, budgeting, accounting, analysis,
reporting, and evaluation phases often overlap (see Figure 4) as the organization prepares
future expectations for the coming year (planning, programming, and budgeting);
manages the current year (accounting, analysis, and reporting); and evaluates the
performance of the prior year (evaluation). This future, current, and prior fiscal year
overlap of activities places organizations in a perpetual budgeting process. Each phase
contributes to the prolonged process. The planning and programming phase involves

21
analysis, pro forma development, investment priorities, and other activities often
involving shareholder or organizational governance boards. Typically, several months are
needed to translate the plan and program into a capital and operating budget. The
operations phase is typically managed over a 12 month period known as the fiscal year.
Finally, the evaluation phase takes a few months to audit fiscal year ending performance,
evaluate individual leader performance, and award incentives.
Plan & Program(3 months)
Operations (Accounting, Analysis and Reporting)(12 months)
Evaluation(2 months)
Budgeting(3 months)
1 2 3 4 5 6 7 8 9 10 11 12Traditional Annual Budget Cycle (12 month recurring cycle)
Figure 4. Traditional annual budgeting cycle.
To varying degrees, practitioners and academics recognize the limitations of
annual budgets, but few businesses have abandoned this practice. However, many
companies are supplementing their annual budgeting process with rolling forecasts,
benchmark modeling, balanced scorecards, and other more dynamic methods and tools
(Arterian, 1998; Ekholm & Wallin, 2000).
The Relationship of Hospital Characteristics to Performance
Hospital characteristics have the potential to influence budget variances, but there
is no evidence to support or refute an association. In the absence of this information,
hospital characteristics and performance studies are reviewed because of the
interconnectivity of budgets to performance (Otley, 1999). The relationship of hospital
22
characteristics to performance in the literature focuses on ownership, system
membership, size (number of beds), and location (urban or rural).
Hospital ownership and performance is often examined in relation to the property
rights theory, which suggests a connection between the owner or decision maker and the
economic behavior and outcome (Kim & Mahoney, 2005). Conversely, Becker and Sloan
(1985) found negligible differences in efficiency between for-profit, not-for-profit, and
government hospitals once factors other than ownership were held constant. Additionally,
for-profit and not-for-profit hospitals have similar after-tax profit margins and
proportions of care for Medicare, Medicaid, and charity care (Becker & Sloan, 1985;
Gapenski, Vogel, & Langland-Orban, 1993; Sloan & Vraciu, 1983; Younis, Younies, &
Okojie, 2006).
Other researchers, however, reported that for-profit hospitals were more profitable
than not-for-profit hospitals (Herzlinger & Krasker, 1986; Sear, 1991) particularly in
rural settings (Ferrier & Valdmanis, 1996; Younis, 2012; Younis, Rice, & Barkoulas,
2001). This detected difference could be a result of lower levels of community benefit
provided by for-profit hospitals (Arrington & Haddock, 1990; Fitzgerald & Jacobsen,
1987).
Evidence is mounting to suggest that for-profit hospitals operate at a lower cost
than other types of hospitals with the same or better quality performance (Jiang,
Friedman, & Begun, 2006; McKay & Deily, 2005). For-profit hospitals frequently elect
to provide a higher mix of profitable medical services and are more responsive to changes
in profitability (Horwitz, 2005). Additionally, financial performance has been found to
23
improve in hospital conversions to for-profit status with no differences in quality and
charity care (Joynt, Orav, & Jha, 2014).
In a comparison study of hospital ownership to cost and quality in a select group
of common conditions for Medicare patients, Sloan, Picone, Taylor, and Chou (2001)
discovered that for-profit hospitals received higher payments with no appreciable
difference in outcomes. Similarly, Renn, Schramm, Watt, and Derzon (1985) indicated
that for-profit hospitals used significantly higher charges to achieve more favorable profit
margins with no discernable difference in efficiency compared to other types of hospitals.
Financial pressures in the hospital industry can drive membership into a larger
health care system. This follows the economic theory that states that as an organization
increases in size, the potential increases for efficiencies are sought through economies of
scale, market leverage, and spreading of risk. Testing this theory to enhance hospital
financial performance is a central theme of studies related to system membership.
Contrary to the perceived benefit of an affiliation strategy, the evidence does not
support a favorable relationship between system membership and improved profitability
(Becker & Sloan, 1985; Carey, 2003; Clement et al., 1997; Gapenski et al., 1993;
Tennyson & Fottler, 2000). The exception to this finding can be seen when system
membership includes higher pricing which result in greater profits (Cleverley, 1992;
Joynt et al., 2014; Levitz & Brooke, 1985; Manheim, Shortell, & McFall, 1989; Renn et
al., 1985; Sloan et al., 2001).
Another area of research in system membership suggests no cost efficiency
benefits associated with membership (Becker & Sloan, 1985; Cleverley, 1992; Coyne,
1982; Levitz & Brooke, 1985; Renn et al., 1985). There is evidence, however, that when
24
combining measures of cost and quality, system membership does improve performance
(Jiang et al., 2006; McKay & Deily, 2005) particularly for rural hospitals (Broyles,
Brandt, & Biard‐Holmes, 1998).
In most studies, the size of a hospital is measured simplistically as the number of
staffed or licensed beds. Although less prevalent, these studies mirror the economic
theory research previously assessed in system membership. The size of a hospital has a
weak negative influence on profitability (Gapenski et al., 1993), which is consistent with
conclusions by Younis et al. (2006) that hospitals greater than 100 beds were less
profitable than smaller hospitals based on less managed care and competition in rural
settings. Younis (2012) further identified the size and profitability relationship as
nonlinear with higher profits in hospitals with 50 to 400 beds and lower margins in
hospitals with less than 50 and greater than 400 beds.
Posnett (1999) found a similar nonlinear relationship between size and economies
of scale where increases in the number of beds and economies of scale were realized for
small hospitals (less than 200 beds), flattened for mid-sized hospitals (200 to 400 beds),
and declined for large hospitals (over 400 beds). Other size to economies of scale studies
demonstrated a limited relationship ranging from weak (Berry, 1967, 1974; Carr &
Feldstein, 1967; Evans, 1971; Lave & Lave, 1970) to no association (Francisco, 1970;
Gapenski et al., 1993).
Studies assessing location relationships to performance typically focus on urban
versus rural settings. A majority of this research relates to the previously discussed
relationship to the size of the hospital and the economic viability of rural hospitals
(Moscovice, 1989). As compared to urban hospitals, rural hospitals experienced lower

25
profits, lower occupancy rates, higher labor ratios, and slower growth rates (Younis,
2012). These results suggest two distinctly different populations and explains why studies
in this area often focus on the implications of policy concessions for rural hospitals
(Moscovice & Stensland, 2002).
One policy that is often studied is the 1997 Balanced Budget Act’s creation of the
critical access hospitals designation and its implications to rural communities. Li,
Schneider, and Ward (2009) found conversion to a critical access status significantly
increased a hospital’s operating revenues, expenses, and margins. These favorable policy
interventions helped curb the increasing trend of rural hospital closures (Office of
Inspector General, 2003a; Poley & Ricketts, 2001), but the current needs are once again
escalating as costs outpace the implementation of reimbursement reforms (Ellison, 2015;
NRHA, 2013).
The two previous sections of this literature review focused on the budgeting
relationship to performance and the influence of hospital characteristics. In this next
section, the attention shifts from identifying how previous research studies fit into the
existing body of knowledge to a theoretical framework that could explain the association
between budgeting and performance. This framework is grounded in Control Theory
which is generally attributed to the work of Wiener (1948).
Control Theory
This review of literature highlights the difficulty faced by hospitals in improving
financial performance. However, the hospital industry has historically adapted to
payment challenges such as the introduction of Medicare and Medicaid in 1967,
diagnosis-related groups (DRGs) prospective payment system in 1983, managed care

26
proliferation in the 1980s, and the Balanced Budget Act of 1997 (Whetsell, 1999). A key
response by hospitals to each of these payment disruptions was to reset their targets and
implement strategies measured against new norms. Budgets quantify these adjusted
expectations and serve as a reference within a management control system. Control
theory examines these self-regulating systems and provides an appropriate theoretical
framework for the relationship between budget variances and operating margin.
Control theory incorporates a feedback loop as an essential component to drive
action (Carver & Scheier, 1982; Wiener, 1948). The purpose of this feedback loop is to
minimize deviations from the target or referent standard. To minimize deviations, Klein
(1989) identified four critical elements in the feedback loop: (1) a referent standard, (2) a
sensor, (3) a comparator, and (4) an effector. These elements are often compared to a
thermostat regulating temperature to achieve a desired climate.
In a similar manner, the feedback loop of a budget control system functions to
achieve the desired organizational results (see Figure 5). The budget target is set as a
referent standard or desired state. The individual’s sense of his or her actual performance
or present state is measured by a sensor such as an interpretation of a financial report.
The perception of the present state (e.g., financial report) is compared to the desired state
(e.g., budget). If there is a perceived discrepancy between the present and desired states
an action is performed with the intent of reducing the discrepancy. The budget control
loop is closed with regular monitoring by the sensor and ongoing discrepancy
adjustments by the effector.
Carver and Scheier (1981) identified two primary elements of human behavior
within control theory, cognitive and affective elements. The cognitive element describes

27
individuals’ evaluation of their perceived performance against the referent or goal
standard. To assess performance, humans need to know the performance discrepancy and
its impact to the individual, the organization, and other stakeholders (Fellenz, 1997). The
affective element relates to an individual’s actions or behavioral modifications in
resolving any perceived discrepancy between his or her actual and desired performance.
Both of these elements play important roles in the budget control process.
Figure 5. Control theory and budgets.
Note: Adapted from “An integrated control theory model of work motivation” by Klein (1989, p. 151). The simple
feedback loop. Academy of Management does not require permission for dissertation not sold for commercial
distribution and/or monetary gain.
One of the most cited criticisms of control theory is its mechanistic application to
human behavior. Humans are conceptual not mechanical decision makers who take a host
of tangible and intangible factors into consideration before acting on an identified
discrepancy (Locke, 1991). Combining factors guides decision making in terms of how
an individual will or will not act to a given variance. A potential bridge to this criticism
could include a more micro-level theory of goal setting.
Sensor
INPUT ActualPerformance
Comparator
Actual Budget
Effector
OUTPUT Action forRemediation
Variance to Budget
Referent Standard
Budget Target (goal)
Perceptual Signal Error Signal
Reference Signal
SystemEnvironment

28
As a complement for human behavior deficiencies in control theory, a goal setting
theory by Locke and Latham (1990, 2002) asserts that performance improves when
setting specific, difficult goals such as a budget (Chow, 1983; Hirst & Lowy, 1990;
Rockness, 1977; Stedry & Kay, 1966). Evidence supports the favorable relationship
between setting goals and improving performance (Locke & Latham, 1990, 2002; Locke,
Shaw, Saari, & Latham, 1981).
The goal setting theory is consistent with the fundamental incentive of business,
to remain viable, and in most cases, maximize profit (Alchian, 1950; Demsetz, 1983).
These goals are quantified in the budget and become the measurement standard for the
organization; budget goals are then translated to the business units and managers. A
manager’s ability to achieve the budget becomes the primary incentive for performance
(Merchant & Manzoni, 1989).
Managers who achieve the budget enhance their opportunities for advancement,
bonuses, and higher salaries. In contrast, managers who fail to achieve the budget face
negative repercussions which could ultimately lead to job loss. As a standard for
incentives, the budget is a powerful motivator on performance. The relationship between
motivation and performance has strong support in the research literature with roots that
stem from the work of Porter and Lawler (1968).
The goal setting theory incorporates measures of expectancy. As reviewed in the
motivational studies related to budgeting, Vroom (1964) introduced the expectancy
theory which states, “people choose the option (course of action) they believe will result
in the greatest benefit to them, provided there is a good chance they actually can attain
the benefit” (Smith & Hitt, 2005, p. 36). In weighing expected value, people are

29
motivated by difficult goals if they are achievable (Merchant & Manzoni, 1989).
Cherrington and Cherrington (1973) supported the expectancy theory related to budgeting
and suggested that an appropriate reward for high budget participation improved
performance and job satisfaction.
The manager-subordinate relationship is also a significant factor in budget
performance. The balance theory by Heider (1946) suggests “people strive to achieve
balanced sentiments in their interactions with others” (Miles, 2012, p. 66). That is to say,
there is a desire to align one’s self with others who share similar attitudes. When this is
not possible it creates dissonance, tension, and an elevated potential for conflict in a
relationship.
If an unbalanced relationship exists for either the manager or subordinate then
there is a natural desire to remedy the situation. Heider (1958) offered two simple
remedies for unbalance: (1) change your perception and valuation, or (2) leave the
relationship. This is challenging in practice for the manager-subordinate relationship
which, if not remedied, will negatively affect budget performance and job satisfaction
(Brownell, 1982).
For this current investigation, control theory was tested by measuring hospital
budget variances (referent standard) association with operating margins (sensor–actual
performance). The assumption was that smaller budget variances would be associated
with improved operating margins.

30
Chapter 3
Research Methodology
This study focused on acute care hospitals submitting budget and year end audited
financial reports to the Washington State Department of Health (DOH) Hospital and
Patient Data Section (HPDS) of the Center for Health Statistics (CHS). Hospitals in the
state of Washington have a unique requirement to submit both budget and year end
reports for the purpose of understanding trends and guiding leaders in making more
informed public health and policy decisions. From 1987 to 2013, the HPDS was
comprised of 115 acute care hospitals represented in one or more years as well as hospital
characteristics of ownership, system membership, bed size, and urban or rural locations
(see Table 2).
Table 2 Hospital Characteristics
Data Sources and Collection
This study utilized a longitudinal dataset for the years 1987-2013 (27 years). The
dataset was constructed from the Washington State Department of Health’s Hospital and
Patient Data Section (DOH/HPDS) of the Center for Health Statistics (Huyck, 2013).
DOH/HPDS applied a standard data collection process using generally accepted
accounting principles. The Washington State Department of Health (1990) Accounting
Categories N % Categories N % Categories N % Categories N %Non-Profit 57 49.6 System 44 38.3 > 300 18 15.7 Urban 64 55.7For Profit 9 7.8 Stand Alone 71 61.7 300-101 37 32.2 Rural 51 44.3Government 49 42.6 Total 115 100.0 100-26 40 34.8 Total 115 100.0
Total 115 100.0 ≤ 25 20 17.4Total 115 100.0
System Membership Urban or RuralOwnership Bed Size

31
and Reporting Manual for Hospitals provides uniform accounting and reporting standards
based on the Audits of Providers of Health Care Services, July 1990, of the American
Institute of Certified Public Accountants. In accordance to these standards, Washington
hospitals summit required data to DOH/HPDS using department-supplied electronic
forms for both budget and year end reporting.
Measures
In addition to the four hospital characteristics, the database consists of over 60
financial (income statement) and utilization input measures such as number of
employees, admissions, patient days, and births (see Appendix B for a full list of data
elements). These metrics were narrowed in the study to common industry measures for
revenue, expense, and volume (see Table 3).
Table 3 Selected Independent and Dependent Variables
Research Question and Hypotheses
The measures of the study were prepared to examine the relationship between
hospital budget variances (revenue, expense, and volume) and profitability (operating
margin). Specifically, this study examined the following research question and three
hypotheses for hospitals:
Are smaller budget variances (more accurate forecasting and/or tighter management)
associated with greater operating margins?
Independent Variables Dependent Variable Variance actual to budget in: 1. Total Operating Revenue per Adjusted Patient Days (Revenue) 2. Total Operating Expense per Adjusted Patient Days (Expense) 3. Adjusted Patient Days (Volume)
Operating Margin

32
1. H1: Smaller budget variances are associated with greater operating margins.
2. H2: Smaller unfavorable budget variances are associated with greater operating
margins.
3. H3: Greater favorable budget variances are associated with greater operating margins.
Data were prepared to address the three hypotheses. For Hypothesis 1, data were
prepared to provide absolute value of budget variances and the actual (positive, negative,
or zero) operating margin. Data preparation for Hypotheses 2 and 3 isolated the
unfavorable and favorable variances.
Data Preparation
Variances reflect the percent variance for independent (budget variances)
variables in the analysis. The percent variance is the difference between actual and
budget for each variable (3), hospital (115), and year (27) in the dataset. The variables
were constructed to reflect the absolute value of each variance to budget measures for
revenue, expense, and volume (see Figure 6). Hypothesis 1 addressed smaller budget
variances (regardless of whether the variance is favorable or unfavorable).
𝑋𝑋ℎ𝑦𝑦 = ��𝐴𝐴ℎ𝑦𝑦 − 𝐵𝐵ℎ𝑦𝑦�
�𝐵𝐵ℎ𝑦𝑦��
𝑋𝑋ℎ𝑦𝑦 = actual to budget percent variance with each hospital (h) and respective year (y) 𝐴𝐴ℎ𝑦𝑦 = actual variable with each hospital (h) and respective year (y) 𝐵𝐵ℎ𝑦𝑦 = budget variable with each hospital (h) and respective year (y)
Figure 6. Variance formula for independent variables (X).
Hypotheses 2 and 3 addressed a more specific component of the budget variance–
the impact of unfavorable and favorable variances. To address the unfavorable and
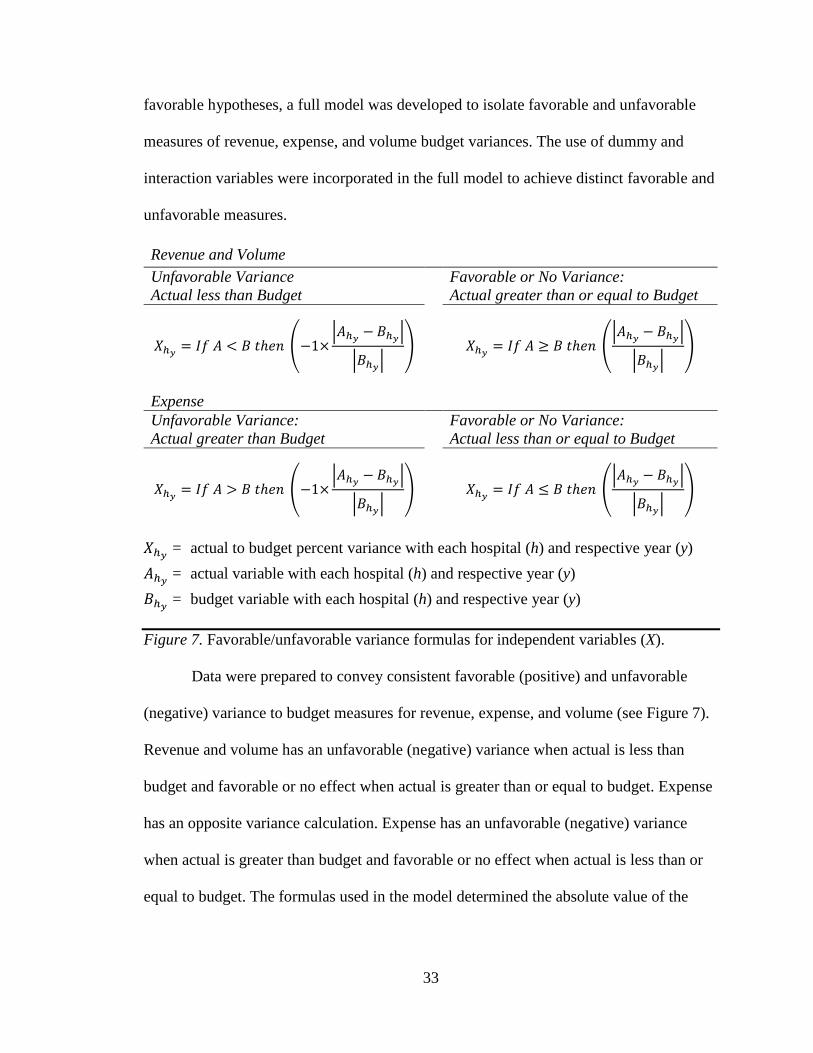
33
favorable hypotheses, a full model was developed to isolate favorable and unfavorable
measures of revenue, expense, and volume budget variances. The use of dummy and
interaction variables were incorporated in the full model to achieve distinct favorable and
unfavorable measures.
Revenue and Volume Unfavorable Variance Actual less than Budget
Favorable or No Variance: Actual greater than or equal to Budget
𝑋𝑋ℎ𝑦𝑦 = 𝐼𝐼𝐼𝐼 𝐴𝐴 < 𝐵𝐵 𝑡𝑡ℎ𝑒𝑒𝑒𝑒 �−1×�𝐴𝐴ℎ𝑦𝑦 − 𝐵𝐵ℎ𝑦𝑦�
�𝐵𝐵ℎ𝑦𝑦��
𝑋𝑋ℎ𝑦𝑦 = 𝐼𝐼𝐼𝐼 𝐴𝐴 ≥ 𝐵𝐵 𝑡𝑡ℎ𝑒𝑒𝑒𝑒 ��𝐴𝐴ℎ𝑦𝑦 − 𝐵𝐵ℎ𝑦𝑦�
�𝐵𝐵ℎ𝑦𝑦��
Expense
Unfavorable Variance: Actual greater than Budget
Favorable or No Variance: Actual less than or equal to Budget
𝑋𝑋ℎ𝑦𝑦 = 𝐼𝐼𝐼𝐼 𝐴𝐴 > 𝐵𝐵 𝑡𝑡ℎ𝑒𝑒𝑒𝑒 �−1×�𝐴𝐴ℎ𝑦𝑦 − 𝐵𝐵ℎ𝑦𝑦�
�𝐵𝐵ℎ𝑦𝑦��
𝑋𝑋ℎ𝑦𝑦 = 𝐼𝐼𝐼𝐼 𝐴𝐴 ≤ 𝐵𝐵 𝑡𝑡ℎ𝑒𝑒𝑒𝑒 ��𝐴𝐴ℎ𝑦𝑦 − 𝐵𝐵ℎ𝑦𝑦�
�𝐵𝐵ℎ𝑦𝑦��
𝑋𝑋ℎ𝑦𝑦 = actual to budget percent variance with each hospital (h) and respective year (y) 𝐴𝐴ℎ𝑦𝑦 = actual variable with each hospital (h) and respective year (y) 𝐵𝐵ℎ𝑦𝑦 = budget variable with each hospital (h) and respective year (y)
Figure 7. Favorable/unfavorable variance formulas for independent variables (X).
Data were prepared to convey consistent favorable (positive) and unfavorable
(negative) variance to budget measures for revenue, expense, and volume (see Figure 7).
Revenue and volume has an unfavorable (negative) variance when actual is less than
budget and favorable or no effect when actual is greater than or equal to budget. Expense
has an opposite variance calculation. Expense has an unfavorable (negative) variance
when actual is greater than budget and favorable or no effect when actual is less than or
equal to budget. The formulas used in the model determined the absolute value of the

34
difference between actual and budget then applied the appropriate negative or positive
variance for the respective revenue, expense, and volume.
Before including in the model, the favorable and unfavorable variables were
converted to binary dummy variables (favorable = 0, unfavorable = 1) for revenue,
expense, and volume (see Figure 8). In the full regression model, these dummy variables
identified the significance and association of a favorable or unfavorable relationship to
operating margin.
Revenue (Fav/Unf) = 0 (Favorable), 1 (Unfavorable) Expense (Fav/Unf) = 0 (Favorable), 1 (Unfavorable) Volume (Fav/Unf) = 0 (Favorable), 1 (Unfavorable)
Figure 8. Favorable/unfavorable dummy variable formulas.
In addition to understanding the favorable and unfavorable relationship,
interaction variables were added to the model for revenue, expense, and volume. The
interaction variables accounted for favorable/unfavorable as well as the magnitude of the
variance. To calculate the budget interaction variables the favorable/unfavorable dummy
variables were multiplied by the original budget variances for revenue, expense, and
volume (see Figure 9).
Revenue Interaction = Total Operating Revenue per APD × Revenue (Fav/Unf) Expense Interaction = Total Operating Expense per APD × Expense (Fav/Unf) Volume Interaction = Adjusted Patient Days (APD) × Volume (Fav/Unf)
Figure 9. Favorable/unfavorable budget variance interaction formulas.
By isolating the unfavorable budget variance relationships in the interaction
variables, the remaining or excluded variables were the favorable budget variances
captured in the full model by the original budget variances (Total Operating Revenue per
APD, Total Operating Expense per APD, and Adjusted Patient Days (APD).
35
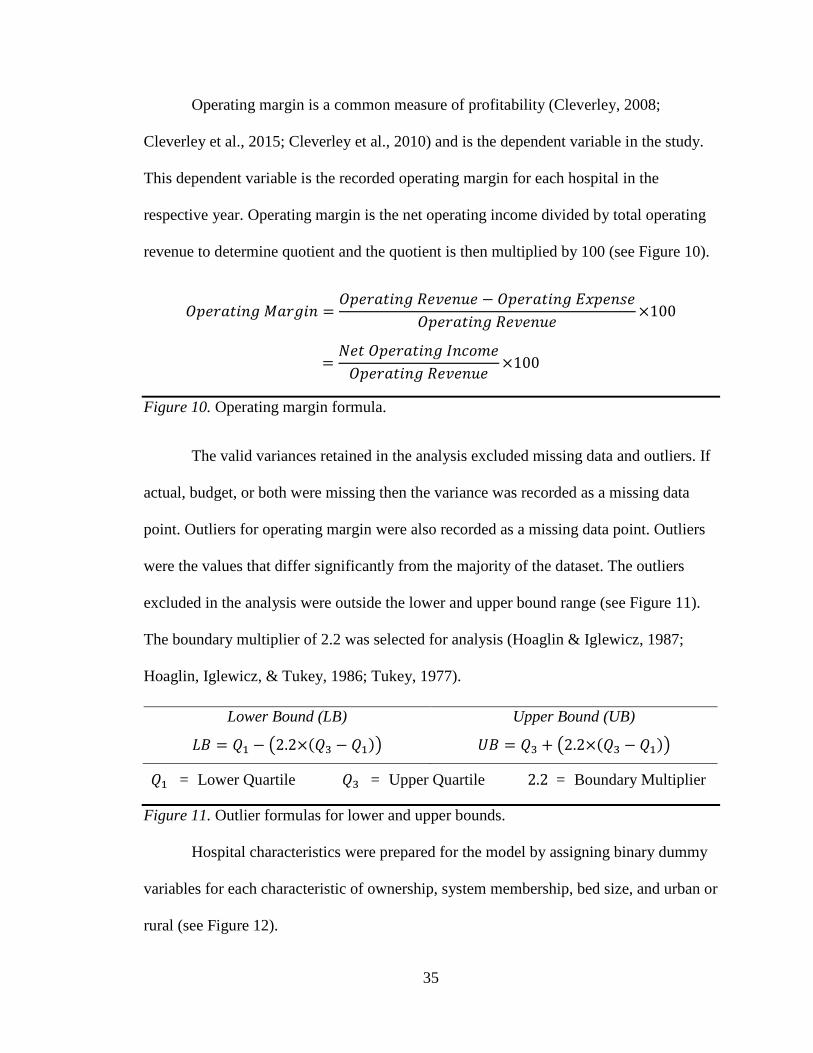
Operating margin is a common measure of profitability (Cleverley, 2008;
Cleverley et al., 2015; Cleverley et al., 2010) and is the dependent variable in the study.
This dependent variable is the recorded operating margin for each hospital in the
respective year. Operating margin is the net operating income divided by total operating
revenue to determine quotient and the quotient is then multiplied by 100 (see Figure 10).
𝑂𝑂𝑂𝑂𝑒𝑒𝑂𝑂𝑂𝑂𝑡𝑡𝑂𝑂𝑒𝑒𝑂𝑂 𝑀𝑀𝑂𝑂𝑂𝑂𝑂𝑂𝑂𝑂𝑒𝑒 =𝑂𝑂𝑂𝑂𝑒𝑒𝑂𝑂𝑂𝑂𝑡𝑡𝑂𝑂𝑒𝑒𝑂𝑂 𝑅𝑅𝑒𝑒𝑅𝑅𝑒𝑒𝑒𝑒𝑅𝑅𝑒𝑒 − 𝑂𝑂𝑂𝑂𝑒𝑒𝑂𝑂𝑂𝑂𝑡𝑡𝑂𝑂𝑒𝑒𝑂𝑂 𝐸𝐸𝐸𝐸𝑂𝑂𝑒𝑒𝑒𝑒𝐸𝐸𝑒𝑒
𝑂𝑂𝑂𝑂𝑒𝑒𝑂𝑂𝑂𝑂𝑡𝑡𝑂𝑂𝑒𝑒𝑂𝑂 𝑅𝑅𝑒𝑒𝑅𝑅𝑒𝑒𝑒𝑒𝑅𝑅𝑒𝑒×100
=𝑁𝑁𝑒𝑒𝑡𝑡 𝑂𝑂𝑂𝑂𝑒𝑒𝑂𝑂𝑂𝑂𝑡𝑡𝑂𝑂𝑒𝑒𝑂𝑂 𝐼𝐼𝑒𝑒𝐼𝐼𝐼𝐼𝐼𝐼𝑒𝑒
𝑂𝑂𝑂𝑂𝑒𝑒𝑂𝑂𝑂𝑂𝑡𝑡𝑂𝑂𝑒𝑒𝑂𝑂 𝑅𝑅𝑒𝑒𝑅𝑅𝑒𝑒𝑒𝑒𝑅𝑅𝑒𝑒×100
Figure 10. Operating margin formula.
The valid variances retained in the analysis excluded missing data and outliers. If
actual, budget, or both were missing then the variance was recorded as a missing data
point. Outliers for operating margin were also recorded as a missing data point. Outliers
were the values that differ significantly from the majority of the dataset. The outliers
excluded in the analysis were outside the lower and upper bound range (see Figure 11).
The boundary multiplier of 2.2 was selected for analysis (Hoaglin & Iglewicz, 1987;
Hoaglin, Iglewicz, & Tukey, 1986; Tukey, 1977).
𝑄𝑄1 = Lower Quartile 𝑄𝑄3 = Upper Quartile 2.2 = Boundary Multiplier
Figure 11. Outlier formulas for lower and upper bounds.
Hospital characteristics were prepared for the model by assigning binary dummy
variables for each characteristic of ownership, system membership, bed size, and urban or
rural (see Figure 12).
Lower Bound (LB)
𝐿𝐿𝐵𝐵 = 𝑄𝑄1 − �2.2×(𝑄𝑄3 − 𝑄𝑄1)�
Upper Bound (UB)
𝑈𝑈𝐵𝐵 = 𝑄𝑄3 + �2.2×(𝑄𝑄3 − 𝑄𝑄1)�

36
Not‐for‐Profit = excluded (1) For‐Profit = 0 (Other), 1 (For Profit) (2) Government = 0 (Other), 1 (Government) (3) System Membership = 0 (Stand Alone), 1 (System) Bed Size >300 = excluded (4) Bed Size 300‐101 = 0 (Other), 1 (300‐101) (5) Bed Size 100‐26 = 0 (Other), 1 (100‐26) (6) Bed Size ≤ 25 = 0 (Other), 1 (≤ 25) (7) Urban or Rural = 0 (Rural), 1 (Urban)
Figure 12. Hospital characteristics dummy variable formulas (1-7 included).
Five periods coinciding with significant macroeconomic change (economic
growth, adaptation to new regulation, and market downfalls) were added to the full model
to account for time and its potential effect. Time periods were prepared for the model by
assigning binary dummy variables for each period (see Figure 12). During positive
economic periods, higher operating margins (greater than 4%) were assigned a 1 and
lower operating margins a 0. During negative economic periods, lower operating margins
(less than 4%) were assigned a 1; higher operating margins were assigned a 0.
1987‐89 = excluded (1) 1990‐97 positive economic growth = 0 (Other), 1 (Operating Margin >4) (2) 1999‐02 adaptation to BBA of 1997 = 0 (Other), 1 (Operating Margin <4) (3) 2003‐07 positive economic growth = 0 (Other), 1 (Operating Margin >4) (4) 2008‐11 market downfall = 0 (Other), 1 (Operating Margin <4) (5) 2012‐13 positive economic growth = 0 (Other), 1 (Operating Margin >4)
Figure 13. Time dummy variable formulas (1-5 included).
The use of a 4% operating margin was selected based on a review of the average
and median operating margin trends for hospitals. The 2013 hospital medians by region
ranged from 2.3% to 4.5% with the Northwest median at 4.5% (Cleverley et al., 2015).
The 1994 to 2013 American Hospital Association (2014) reported the average hospital
operating margin as 4.0% , and the median as 3.8%.

37
Data Analysis
This study explored the relationships between variables using a non-experimental
research approach. This approach is defined by predictor variables that cannot be
controlled or altered. Relationships in non-experimental research describe a correlation
that could be valid in a larger population.
The first hypothesis addresses the budget variance relationship to operating
margin regardless of whether the variance is favorable or unfavorable. Hypothesis 1 tests
the assumption that more accurate forecasting and/or tighter management to the budget
matters in achieving higher operating margins. Hypotheses 2 and 3 test an additional
assumption that smaller unfavorable or greater favorable budget variances improves
operating margin performance.
Hypotheses 2 and 3 help clarify the impact of unfavorable and/or favorable
variances that could be masked in the results of Hypothesis 1. For example, the positive
and negative interaction and effect of non-isolated absolute value measures in Hypothesis
1 could lead to statistically significant budget variance relationships with the operating
margin but conflicting associations in comparing revenue, expense, and volume. To
address this potential conflict, the full model isolates unfavorable and favorable budget
variance measures.
To test the research question, the HPDS sample of the broader hospital population
was used to make generalizations or inferences about the hypothesized association in the
population. These sample tests and techniques are defined as inferential statistics. An
associational inferential statistic model was applied to determine both the correlation and
significance (regression). Multiple linear regression models were used to measure the

38
significance and association between the budget variance measures and operating margin
(see Figure 14).
Model A
Operating Margin (dependent variable) = β0 (intercept) +β1 (variance in Total Operating Revenue per Adjusted Patient Days)
Model B
Operating Margin (dependent variable) = β0 (intercept) +β2 (variance in Total Operating Expense per Adjusted Patient Days)
Model C
Operating Margin (dependent variable) = β0 (intercept) +β3 (variance Adjusted Patient Days)
Model D
Operating Margin (dependent variable) = β0 (intercept) +β1 (variance in Total Operating Revenue per Adjusted Patient Days) +β2 (variance in Total Operating Expense per Adjusted Patient Days) +β3 (variance Adjusted Patient Days)
Model E
Operating Margin (dependent variable) = β0 (intercept) +β1 (variance in Total Operating Revenue per Adjusted Patient Days) +β2 (variance in Total Operating Expense per Adjusted Patient Days) +β3 (variance Adjusted Patient Days) +𝛽𝛽4 (Revenue favorable or unfavorable) +𝛽𝛽5 (Expense favorable or unfavorable) +𝛽𝛽6 (Volume favorable or unfavorable) +𝛽𝛽7 (Revenue Interaction) +𝛽𝛽8 (Expense Interaction) +𝛽𝛽9 (Volume Interaction) +𝛽𝛽10 (Hospital Characteristic 1: For-Profit) +𝛽𝛽11 (Hospital Characteristic 2: Government) +𝛽𝛽12 (Hospital Characteristic 3: System Membership) +𝛽𝛽13 (Hospital Characteristic 4: Bed Size 300-101) +𝛽𝛽14 (Hospital Characteristic 5: Bed Size 100-26) +𝛽𝛽15 (Hospital Characteristic 6: Bed Size ≤ 25) +𝛽𝛽16 (Hospital Characteristic 7: Urban or Rural) +𝛽𝛽17 (Time Period 1: 1990-97 Positive Economic Growth) +𝛽𝛽18 (Time Period 2: 1999-02 Adaptation to BBA of 1987) +𝛽𝛽19 (Time Period 3: 2003-07 Positive Economic Growth) +𝛽𝛽20 (Time Period 4: 2008-11 Market Downfall) +𝛽𝛽21 (Time Period 5: 2012-13 Positive Economic Growth)
Excluded: Non-Profit, Bed Size >300, and 1987-89 Time Period
Figure 14. Multiple linear regression models for revenue (A), expense (B), volume (C), combined (D), and full model (E).
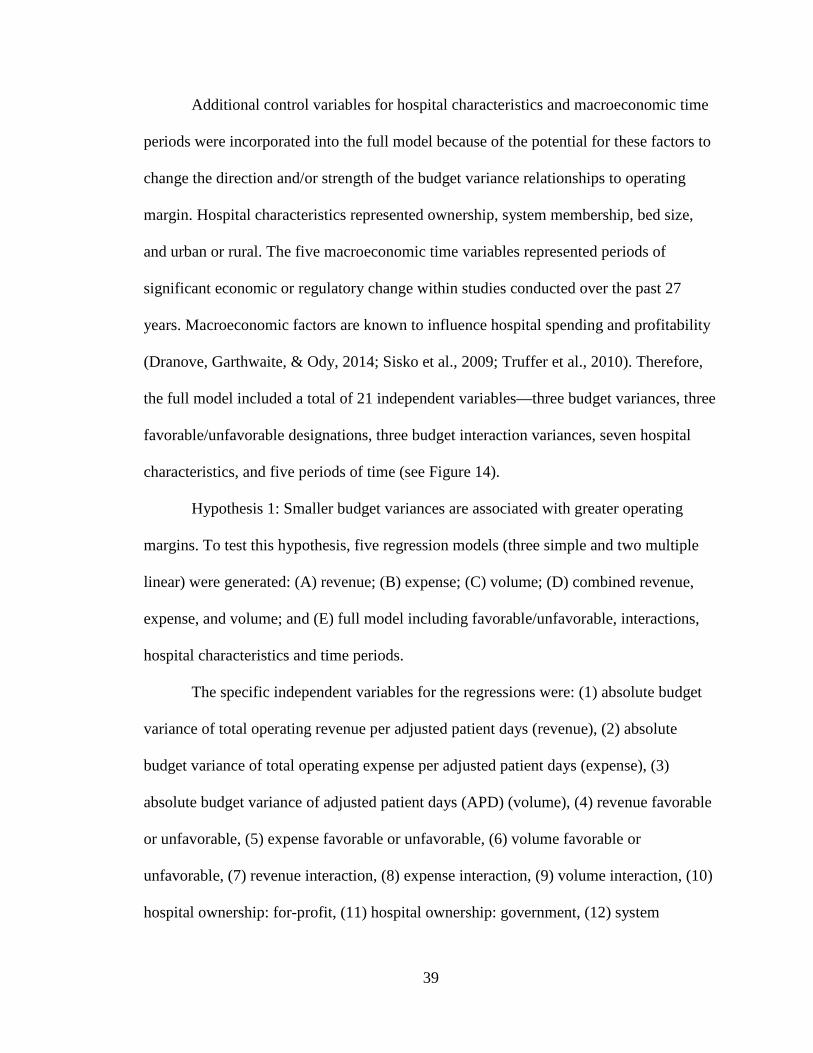
39
Additional control variables for hospital characteristics and macroeconomic time
periods were incorporated into the full model because of the potential for these factors to
change the direction and/or strength of the budget variance relationships to operating
margin. Hospital characteristics represented ownership, system membership, bed size,
and urban or rural. The five macroeconomic time variables represented periods of
significant economic or regulatory change within studies conducted over the past 27
years. Macroeconomic factors are known to influence hospital spending and profitability
(Dranove, Garthwaite, & Ody, 2014; Sisko et al., 2009; Truffer et al., 2010). Therefore,
the full model included a total of 21 independent variables—three budget variances, three
favorable/unfavorable designations, three budget interaction variances, seven hospital
characteristics, and five periods of time (see Figure 14).
Hypothesis 1: Smaller budget variances are associated with greater operating
margins. To test this hypothesis, five regression models (three simple and two multiple
linear) were generated: (A) revenue; (B) expense; (C) volume; (D) combined revenue,
expense, and volume; and (E) full model including favorable/unfavorable, interactions,
hospital characteristics and time periods.
The specific independent variables for the regressions were: (1) absolute budget
variance of total operating revenue per adjusted patient days (revenue), (2) absolute
budget variance of total operating expense per adjusted patient days (expense), (3)
absolute budget variance of adjusted patient days (APD) (volume), (4) revenue favorable
or unfavorable, (5) expense favorable or unfavorable, (6) volume favorable or
unfavorable, (7) revenue interaction, (8) expense interaction, (9) volume interaction, (10)
hospital ownership: for-profit, (11) hospital ownership: government, (12) system

40
membership, (13) bed size 300-101, (14) bed size 100-26, (15) bed size ≤ 25, (16) urban
or rural, (17) 1990-1997 time period coinciding with positive economic growth, (18)
1999-2002 time period coinciding with adaptation to Balanced Budget Act (BBA) of
1997, (19) 2003-2007 time period coinciding with positive economic growth, (20) 2008-
2011 time period coinciding with market downfall, and (21) 2012-2013 time period
coinciding with positive economic growth. The excluded variables in the model were not-
for-profit; bed size greater than 300 beds; and the 1989-1989 time period (one less
dummy coding variable than the number of conditions in hospital ownership, bed size,
and macroeconomic time periods).
In the analysis there was one outcome−operating margin that was a continuous
variable. Regression models A, B, and C each had one continuous outcome (dependent)
variable and one continuous predictor (independent) variable also known as a simple or
bivariate linear regression. Models A, B, and C utilized basic associational statistics of a
Pearson Correlation or regression. Models D and E contain multiple predictor variables
and require more complex associational statistics using multiple linear regression. For
consistency, a multiple linear regression analysis was used that includes both basic and
complex associational statistics in the results. These regression results identify statistical
significance (p-value ≤ 0.05) and associations (polarity of β) between budget variance
and operating margin. Figure 15 defines the multiple linear regression models applied.
SPSS (IBM Corp., Released 2013) analyze, regression, linear commands were
used to compute the linear multiple regression. The output from the regression includes
one-way analysis of variance (ANOVA), Model Summary, and Coefficients Tables.
These tables provide answers through a four step process addressing the (1) significant

41
relationship in each model, (2) strength and how much of the variation between hospitals
is accounted for by the selected variables, (3) significance and association of the
individual independent variables, and (4) potential impact of hospital characteristics and
time periods.
Step 1, an F test in the ANOVA is used to determine if there is a statistically
significant relationship in each model (A-E) between the independent variables and
operating margin, the dependent variable. The ANOVA table output from this command
provides the F statistic and its significance level (p-value) for the regression relationship.
A statistically significant relationship between budget variances, favorable/unfavorable,
interactions, hospital characteristics, and time periods with operating margin would be
indicated in the ANOVA if the p-value is less than or equal to the level of significance (α
≤ 0.05).
Step 2, the Model Summary table output describes the overall model fit. The
correlation coefficient (R, sometimes referred to as the Pearson Correlation Coefficient)
describes the strength and direction of a linear relationship between observed and
predicted values of the dependent variable. The value of R (-1≤R≤+1) has a strong
correlation as it approaches either a negative or positive 1. Generally, the strength of the
relationship ranges from very strong (R>0.80) to very weak (R≤0.20). The coefficient of
determination (R2) will describe the percent of variance explained by the model. The
value of R2 (0≤R2≤1) approaches 1 (100%), indicating more of the total variation can be
explained by the variables included in the model.
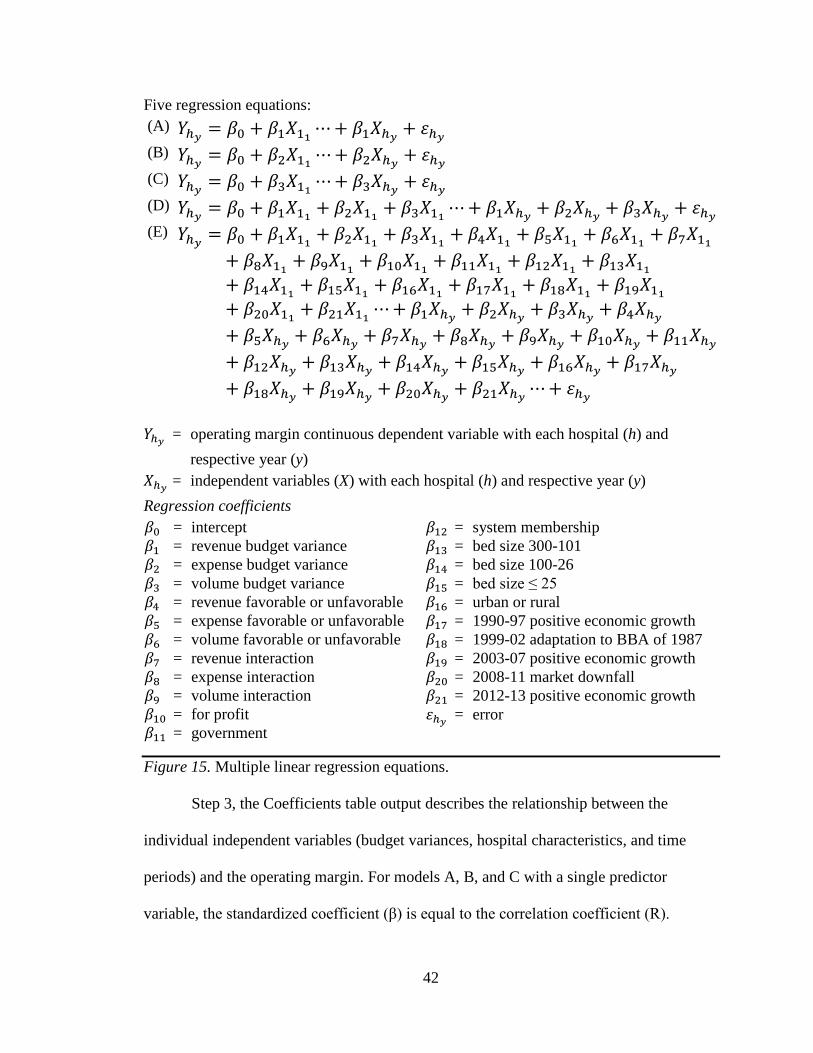
42
Five regression equations: (A) 𝑌𝑌ℎ𝑦𝑦 = 𝛽𝛽0 + 𝛽𝛽1𝑋𝑋11 ⋯ + 𝛽𝛽1𝑋𝑋ℎ𝑦𝑦 + 𝜀𝜀ℎ𝑦𝑦 (B) 𝑌𝑌ℎ𝑦𝑦 = 𝛽𝛽0 + 𝛽𝛽2𝑋𝑋11 ⋯ + 𝛽𝛽2𝑋𝑋ℎ𝑦𝑦 + 𝜀𝜀ℎ𝑦𝑦 (C) 𝑌𝑌ℎ𝑦𝑦 = 𝛽𝛽0 + 𝛽𝛽3𝑋𝑋11 ⋯ + 𝛽𝛽3𝑋𝑋ℎ𝑦𝑦 + 𝜀𝜀ℎ𝑦𝑦 (D) 𝑌𝑌ℎ𝑦𝑦 = 𝛽𝛽0 + 𝛽𝛽1𝑋𝑋11 + 𝛽𝛽2𝑋𝑋11 + 𝛽𝛽3𝑋𝑋11 ⋯ + 𝛽𝛽1𝑋𝑋ℎ𝑦𝑦 + 𝛽𝛽2𝑋𝑋ℎ𝑦𝑦 + 𝛽𝛽3𝑋𝑋ℎ𝑦𝑦 + 𝜀𝜀ℎ𝑦𝑦 (E) 𝑌𝑌ℎ𝑦𝑦 = 𝛽𝛽0 + 𝛽𝛽1𝑋𝑋11 + 𝛽𝛽2𝑋𝑋11 + 𝛽𝛽3𝑋𝑋11 + 𝛽𝛽4𝑋𝑋11 + 𝛽𝛽5𝑋𝑋11 + 𝛽𝛽6𝑋𝑋11 + 𝛽𝛽7𝑋𝑋11
+ 𝛽𝛽8𝑋𝑋11 + 𝛽𝛽9𝑋𝑋11 + 𝛽𝛽10𝑋𝑋11 + 𝛽𝛽11𝑋𝑋11 + 𝛽𝛽12𝑋𝑋11 + 𝛽𝛽13𝑋𝑋11+ 𝛽𝛽14𝑋𝑋11 + 𝛽𝛽15𝑋𝑋11 + 𝛽𝛽16𝑋𝑋11 + 𝛽𝛽17𝑋𝑋11 + 𝛽𝛽18𝑋𝑋11 + 𝛽𝛽19𝑋𝑋11+ 𝛽𝛽20𝑋𝑋11 + 𝛽𝛽21𝑋𝑋11 ⋯ + 𝛽𝛽1𝑋𝑋ℎ𝑦𝑦 + 𝛽𝛽2𝑋𝑋ℎ𝑦𝑦 + 𝛽𝛽3𝑋𝑋ℎ𝑦𝑦 + 𝛽𝛽4𝑋𝑋ℎ𝑦𝑦
+ 𝛽𝛽5𝑋𝑋ℎ𝑦𝑦 + 𝛽𝛽6𝑋𝑋ℎ𝑦𝑦 + 𝛽𝛽7𝑋𝑋ℎ𝑦𝑦 + 𝛽𝛽8𝑋𝑋ℎ𝑦𝑦 + 𝛽𝛽9𝑋𝑋ℎ𝑦𝑦 + 𝛽𝛽10𝑋𝑋ℎ𝑦𝑦 + 𝛽𝛽11𝑋𝑋ℎ𝑦𝑦
+ 𝛽𝛽12𝑋𝑋ℎ𝑦𝑦 + 𝛽𝛽13𝑋𝑋ℎ𝑦𝑦 + 𝛽𝛽14𝑋𝑋ℎ𝑦𝑦 + 𝛽𝛽15𝑋𝑋ℎ𝑦𝑦 + 𝛽𝛽16𝑋𝑋ℎ𝑦𝑦 + 𝛽𝛽17𝑋𝑋ℎ𝑦𝑦
+ 𝛽𝛽18𝑋𝑋ℎ𝑦𝑦 + 𝛽𝛽19𝑋𝑋ℎ𝑦𝑦 + 𝛽𝛽20𝑋𝑋ℎ𝑦𝑦 + 𝛽𝛽21𝑋𝑋ℎ𝑦𝑦 ⋯ + 𝜀𝜀ℎ𝑦𝑦 𝑌𝑌ℎ𝑦𝑦 = operating margin continuous dependent variable with each hospital (h) and
respective year (y) 𝑋𝑋ℎ𝑦𝑦 = independent variables (X) with each hospital (h) and respective year (y) Regression coefficients 𝛽𝛽0 = intercept 𝛽𝛽1 = revenue budget variance 𝛽𝛽2 = expense budget variance 𝛽𝛽3 = volume budget variance 𝛽𝛽4 = revenue favorable or unfavorable 𝛽𝛽5 = expense favorable or unfavorable 𝛽𝛽6 = volume favorable or unfavorable 𝛽𝛽7 = revenue interaction 𝛽𝛽8 = expense interaction 𝛽𝛽9 = volume interaction 𝛽𝛽10 = for profit 𝛽𝛽11 = government
𝛽𝛽12 = system membership 𝛽𝛽13 = bed size 300-101 𝛽𝛽14 = bed size 100-26 𝛽𝛽15 = bed size ≤ 25 𝛽𝛽16 = urban or rural 𝛽𝛽17 = 1990-97 positive economic growth 𝛽𝛽18 = 1999-02 adaptation to BBA of 1987 𝛽𝛽19 = 2003-07 positive economic growth 𝛽𝛽20 = 2008-11 market downfall 𝛽𝛽21 = 2012-13 positive economic growth 𝜀𝜀ℎ𝑦𝑦 = error
Figure 15. Multiple linear regression equations.
Step 3, the Coefficients table output describes the relationship between the
individual independent variables (budget variances, hospital characteristics, and time
periods) and the operating margin. For models A, B, and C with a single predictor
variable, the standardized coefficient (β) is equal to the correlation coefficient (R).

43
Models D and E have multiple (three and 21, respectively) predictor variables and a
corresponding β for each of these variables. The polarity of the standardized coefficient
(β) describes the direction of the relationship. A negative or inverse relationship (-β)
supports smaller budget variances associated with greater operating margins. A positive
relationship (+β) supports greater budget variances associated with greater operating
margins. There is no relationship if β=0.
The Coefficients table also includes the t statistic for the unstandardized
coefficient (B) and its significance level (p-value) for each predictive variable in the five
regression models. A statistically significant relationship between budget variances and
operating margin would be indicated in the t-test if the p-value is less than or equal to the
level of significance (α ≤ 0.05).
Hypothesis 2: Smaller unfavorable budget variances are associated with greater
operating margins. Hypothesis 3: Greater favorable budget variances are associated with
greater operating margins. The Coefficients table in the full regression model (E)
includes favorable or unfavorable binary variables for revenue, expense, and volume (see
Figure 8). Table 8 indicates whether an unfavorable budget variance by itself,
independent of magnitude, has a significant relationship (p-value) and association
(polarity of β).
The full model includes budget variance interactions for revenue, expense, and
volume (see Figure 9). The Coefficients table indicates whether larger unfavorable
variances are associated with smaller operating margins. The table results address
Hypothesis 2, smaller unfavorable variances are associated with greater operating
margins. Because the interactions have accounted for unfavorable budget variances, the

44
remaining favorable variances are the excluded variables in the original budget variance
measures of revenue, expense, and volume (Total Operating Revenue per APD, Total
Operating Expense per APD, and Adjusted Patient Days (APD)). In the full model, these
original budget variances address Hypothesis 3 and indicate whether larger favorable
variances are associated with greater operating margins. Restated in a question: Are
greater favorable variances associated with greater operating margins?
An additional test of the full model was performed using stepwise regression.
This regression method determines the variables contributing to the model in a stepwise
cumulative impact. The model summary of the stepwise regression identifies which of
the 21 variables contribute to or explain the relationship in the full model.
Control variables: Hospital characteristics. The Coefficients table output was
examined in the full regression model (E) to control for these characteristics. Each
hospital characteristic was examined for statistical significance (p-value) and association
(polarity of β).
Control variables to a model have an effect if they change the significance
(change the p-value from p ≤ 0.05 to p > 0.05 or vice versa) and/or change the association
(polarity of β) of the original variables. The hospital characteristics effect was determined
by comparing any changes in the significance and association of the budget variables in
the combined (D) and full (E) models.
Control variables: Macroeconomic periods. Step 4, five periods coinciding
with economic or regulatory change were added to the full model to account for time and
its potential effect on the full model (see Figure 14). The same process for testing the
effect of hospital characteristics was employed to account for time in the model. The

45
effect of the five periods of time was determined by comparing any changes in the
significance and association of the budget variables in the combined (D) and full (E)
models.
Actual, budget, and prior year. The studies predictor variables are actual to
budget variances and the potential association with operating margin. Although beyond
the scope of this study, additional insight could be gained in reviewing actual to prior
year variances (a measure of year over year performance) and budget to prior year
variances (a measure of setting budgets to exceed prior year performance–using budgets
to drive improved performance). Additional comparisons are addressed in the study’s
descriptive statistics by counting the number of cases favorable to the total valid cases of
(1) actual to budget, (2) actual to prior year, and (3) budget to prior year in each of the
studies variables–operating margin, total operating revenue per APD, total operating
expense per APD, and adjusted patient days.
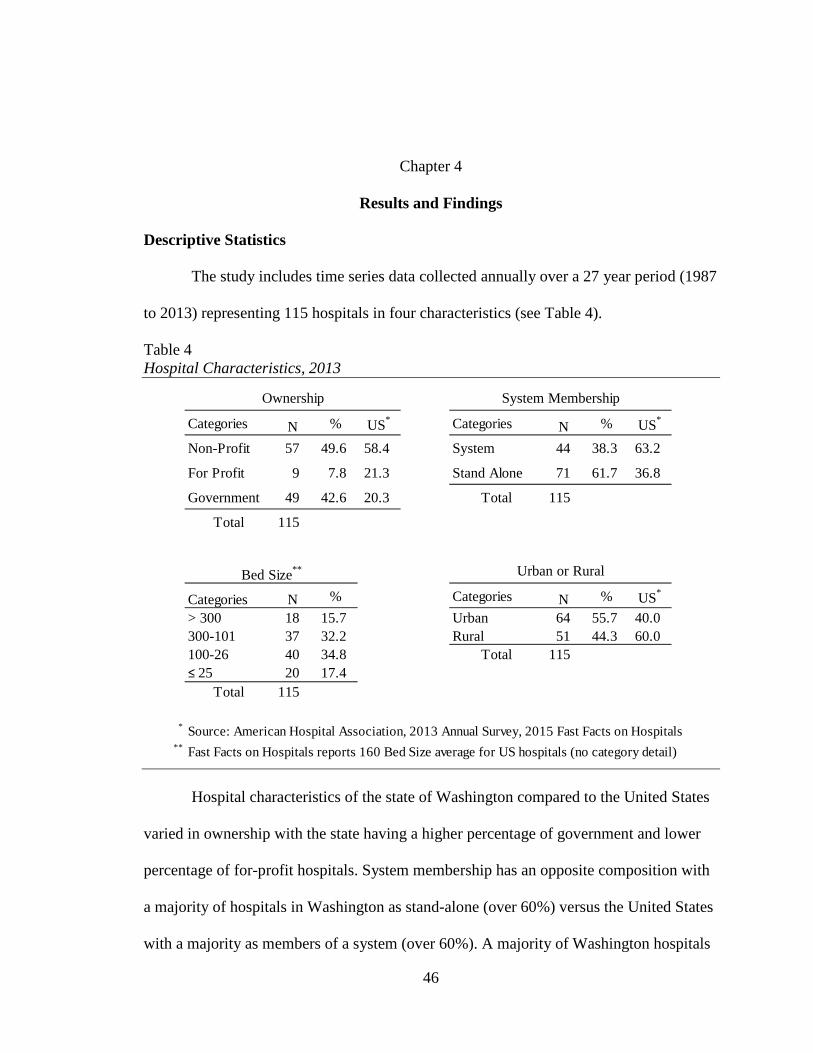
46
Chapter 4
Results and Findings
Descriptive Statistics
The study includes time series data collected annually over a 27 year period (1987
to 2013) representing 115 hospitals in four characteristics (see Table 4).
Table 4 Hospital Characteristics, 2013
Hospital characteristics of the state of Washington compared to the United States
varied in ownership with the state having a higher percentage of government and lower
percentage of for-profit hospitals. System membership has an opposite composition with
a majority of hospitals in Washington as stand-alone (over 60%) versus the United States
with a majority as members of a system (over 60%). A majority of Washington hospitals
Categories N % US* Categories N % US*
Non-Profit 57 49.6 58.4 System 44 38.3 63.2
For Profit 9 7.8 21.3 Stand Alone 71 61.7 36.8
Government 49 42.6 20.3 Total 115
Total 115
Categories N % Categories N % US*
> 300 18 15.7 Urban 64 55.7 40.0 300-101 37 32.2 Rural 51 44.3 60.0 100-26 40 34.8 Total 115 ≤ 25 20 17.4
Total 115
* Source: American Hospital Association, 2013 Annual Survey, 2015 Fast Facts on Hospitals** Fast Facts on Hospitals reports 160 Bed Size average for US hospitals (no category detail)
Bed Size**
System MembershipOwnership
Urban or Rural

47
are in the 101-300 bed range comparable with the US hospital average bed size of 160.
Washington also has a lower percentage of rural hospitals (44.3%) versus United States
(60%).
Table 5 Descriptive Statistics of Dataset
The total sample size was 2,464 cases which is less 641 measures (641 = 3105 –
2464 and 3105 = 27 × 115) due to hospital closures, mergers, or non-reported years over
the 27 year period. A case summary analysis was conducted on the dataset using SPSS
(IBM Corp., Released 2013) to provide a descriptive statistical summary of the dataset
StandardVariables N Mean Median Deviation Min MaxDependent Variable
Operating Margin (Actual) 2321 4.164 4.259 6.323 -16.448 24.591
Independent Variables (Variances)Total Operating Revenue per APD 1890 0.091 0.066 0.082 0.000 0.375Total Operating Expense per APD 1656 0.083 0.058 0.079 0.000 0.374Adjusted Patient Days (APD) 1872 0.086 0.062 0.081 0.000 0.374Revenue (Fav/Unf) 2464 0.330 0 0.469 0 1Expense (Fav/Unf) 2464 0.420 0 0.494 0 1Volume (Fav/Unf) 2464 0.400 0 0.490 0 1Revenue Interaction 2464 0.032 0 0.070 0 0.373Expense Interaction 2464 0.036 0 0.065 0 0.372Volume Interaction 2464 0.036 0 0.067 0 0.371For Profit 2464 0.070 0 0.258 0 1Government 2464 0.460 0 0.498 0 1System Membership 2464 0.440 0 0.497 0 1Bed Size 300-101 2464 0.290 0 0.455 0 1Bed Size 100-26 2464 0.340 0 0.475 0 1Bed Size <=25 2464 0.170 0 0.374 0 1Urban or Rural 2464 0.520 1 0.500 0 11990-97 Positive Economic Growth 2464 0.190 0 0.388 0 11999-02 Adaptation to BBA of 1987 2464 0.080 0 0.272 0 12003-07 Positive Economic Growth 2464 0.100 0 0.306 0 12008-11 Market Downfall 2464 0.080 0 0.269 0 12012-13 Positive Economic Growth 2464 0.040 0 0.192 0 1
Valid N (listwise) 1560

48
(see Table 5). The number of non-missing values also known as the Valid N (listwise) is
1,834 (A), 1,621 (B), 1,815 (C), 1,560 (D), and 1,560 (E) cases, respectively for each of
the five regression models (see Table 6).
Table 6 Descriptive Statistics of Regression Analysis (Models A, B, C, and D)
Green (1991) suggested a minimum sample size based on the number of
independent variables (k) in the equation 50 + 8(k) for testing an overall regression model
and 104 + k when testing individual predictors. For the overall regression models A, B,
and C, the minimum sample size was 58 (50 + 8(1) = 58), for model D it was 74 (50 +
8(3) = 74), and for model E it was 218 (50 + 8(21) = 218). For testing individual
predictors in models A, B, and C, the minimum sample size was 105 (104 + 1), for model
D, 107 (104 + 3), and for model E, 125 (104 + 21). The regression models A, B, C, D,
and E had a sample size of 1,834, 1,621, 1,815, 1,560, and 1560, respectively (see Table
StandardVariables N Mean DeviationModel A: Revenue
Operating Margin 1834 4.465 6.171 Total Operating Revenue per APD 1834 0.089 0.080
Model B: ExpenseOperating Margin 1621 4.559 6.166 Total Operating Expense per APD 1621 0.081 0.077
Model C: VolumeOperating Margin 1815 4.502 6.126 Adjusted Patient Days (APD) 1815 0.084 0.079
Model D: CombinedOperating Margin 1560 4.628 6.059 Total Operating Revenue per APD 1560 0.075 0.067 Total Operating Expense per APD 1560 0.075 0.068 Adjusted Patient Days (APD) 1560 0.079 0.073

49
6). All five regression models satisfied the minimum requirement for testing an overall
regression model and individual predictors.
Table 7 Descriptive Statistics of Regression Analysis (Model E: Full Model)
On average, over the entire time series (1-27) hospitals had positive operating
margins of 4.5% or greater in each of the five regression models with budget variances in
a narrow range between 7.5% to 8.9% (see Table 6).
In a dataset case count, hospitals outperformed operating margin expectations
(actual to budget) in 48.5% of the total valid cases, outperformed prior year 49.0%, and
set budgets above prior year in 50.3% of the cases (see Table 8). The least favorable
performance actual to budget, actual to prior year, and budget to prior year was in
StandardVariables N Mean DeviationModel E: Full Model
Operating Margin 1560 4.628 6.059Total Operating Revenue per APD 1560 0.075 0.067Total Operating Expense per APD 1560 0.075 0.068Adjusted Patient Days (APD) 1560 0.079 0.073Revenue (Fav/Unf) 1560 0.360 0.479Expense (Fav/Unf) 1560 0.640 0.479Volume (Fav/Unf) 1560 0.500 0.500Revenue Interaction 1560 0.023 0.049Expense Interaction 1560 0.053 0.070Volume Interaction 1560 0.038 0.060For Profit 1560 0.080 0.263Government 1560 0.420 0.494System Membership 1560 0.490 0.500Bed Size 300-101 1560 0.340 0.474Bed Size 100-26 1560 0.330 0.470Bed Size <=25 1560 0.110 0.318Urban or Rural 1560 0.560 0.4971990-97 Positive Economic Growth 1560 0.210 0.4061999-02 Adaptation to BBA of 1987 1560 0.110 0.3072003-07 Positive Economic Growth 1560 0.110 0.3182008-11 Market Downfall 1560 0.060 0.2302012-13 Positive Economic Growth 1560 0.030 0.164

50
expense (total operating expense per APD) of 31.8%, 20.7%, and 36.9%, respectively.
Revenue (total operating revenue per APD) demonstrated the most favorable
performance with 57.3% actual to budget, 78.9% actual to prior year, and 70.3% budget
to prior year. Finally, a majority of the volume (adjusted patient days) comparisons were
favorable with 50.0% actual to budget, 60.0% actual to prior year, and 63.8% budget to
prior year.
Table 8 Descriptive Statistics: Favorability Case Count of Actual to Budget, Actual to Prior Year, and Budget to Prior Year
Research Question and Hypotheses Results
The research question employed five regression models (A-E, see Figure 14)
including four regression models (A-D) for the independent budget variables and a
regression model (E) adding the favorable/unfavorable, interactions, hospital
characteristics, and time dummy variables. To test the hypotheses, the budget variance,
favorable/unfavorable, and interaction variables in models A-E were examined. In the
Variables N FAV* % FAV N FAV* % FAV N FAV* % FAVOperating Margin 1749 849 48.5% 2167 1062 49.0% 1764 888 50.3%
Total Op. Revenue per APD 1987 1139 57.3% 2244 1771 78.9% 1902 1338 70.3%
Total Op. Expense per APD** 1992 633 31.8% 2238 463 20.7% 1904 703 36.9%
Adjusted Patient Days (APD) 2025 1012 50.0% 2250 1350 60.0% 1940 1238 63.8%
N Valid Cases*
**
Budget to Prior Yr.
FAV: Case count of favorability (greater than) Actual to Budget, Actual to Prior Year, Budget to Prior Year for all variables except Total Operating Expense per APD (favorable is less than).Expense favorability is Actual less than Budget, Actual less than Prior Yr., and Budget less than Prior Yr.
Actual to Budget Actual to Prior Yr.

51
full model (E), hospital characteristics and time dummy variables were added to control
for these factors.
Hypothesis 1: Smaller budget variances are associated with greater operating
margins. The output from the regression test of this hypothesis included one-way analysis
of variance (ANOVA), Model Summary, and Coefficients Tables. These tables provided
answers through a four step process addressing the (1) significant relationship in each
model, (2) strength and how much of the model is accounted for in the selected variables,
(3) significance and association of the individual independent variables, and (4) potential
impact of time.
From the ANOVA (see Table 9), the probability (p-value) of the F ratio (7.605,
45.357, 13.695, 25.010 and 79.835) for each of the regression relationships was less than
the level of significance (α) of 0.05. Each of the five models had predictive value and
rejected the null hypothesis that they were not associated with the dependent variable.
These results indicated a statistically significant relationship between the set of
independent variables and the dependent variable. The independent variable groups in the
five models were associated with operating margin.

52
Table 9 ANOVA* Revenue (A), Expense (B), Volume (C), Combined (D), and Full (E) Models
ANOVA* Sum of Degrees of MeanModel Squares Freedom (df) Square F ratioA Regression 288.573 1 288.573 7.605 0.006a **
Residual 69516.445 1832 37.946
Total 69805.018 1833
B Regression 1678.254 1 1678.254 45.357 0.000b **
Residual 59904.820 1619 37.001
Total 61583.074 1620
C Regression 510.384 1 510.384 13.695 0.000c **
Residual 67564.277 1813 37.267
Total 68074.661 1814
D Regression 2633.177 3 877.726 25.010 0.000d **
Residual 54608.684 1556 35.096
Total 57241.861 1559
E Regression 29854.354 21 1421.636 79.835 0.000e **
Residual 27387.507 1538 17.807
Total 57241.861 1559
*
**
a
b
c
d
e Predictors: (Constant), 2012-13 Positive Economic Growth, Revenue Interaction, 2008-11 Market Downfall, For Profit, Bed Size 100-26, 2003-07 Positive Economic Growth, 1999-02 Adaptation to BBA of 1987, Total Operating Expense per APD, 1990-97 Positive Economic Growth, System Membership, Volume (Fav/Unf), Bed Size <=25, Bed Size 300-101, Expense (Fav/Unf), Government, Adjusted Patient Days (APD), Revenue (Fav/Unf), Urban or Rural, Total Operating Revenue per APD, Volume Interaction, Expense Interaction
Predictors: (Constant), Adjusted Patient Days (APD), Total Operating Revenue per APD, Total Operating Expense per APD
Predictors: (Constant), Adjusted Patient Days (APD)Predictors: (Constant), Total Operating Expense per APDPredictors: (Constant), Total Operating Revenue per APD
SignificanceLevel (Sig.)
The F statistic (F ratio) for the regression model is less than or equal to the level of significance of 0.05
Dependent Variable: Operating Margin
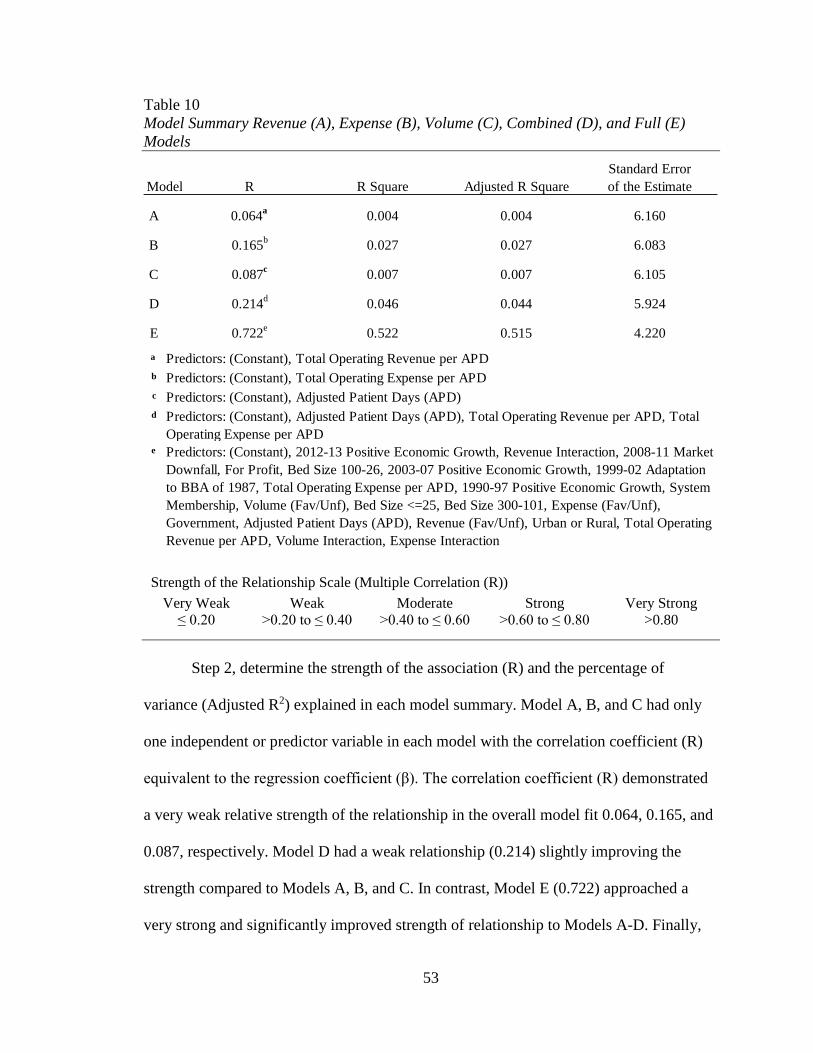
53
Table 10 Model Summary Revenue (A), Expense (B), Volume (C), Combined (D), and Full (E) Models
Strength of the Relationship Scale (Multiple Correlation (R))
Very Weak Weak Moderate Strong Very Strong ≤ 0.20 >0.20 to ≤ 0.40 >0.40 to ≤ 0.60 >0.60 to ≤ 0.80 >0.80
Step 2, determine the strength of the association (R) and the percentage of
variance (Adjusted R2) explained in each model summary. Model A, B, and C had only
one independent or predictor variable in each model with the correlation coefficient (R)
equivalent to the regression coefficient (β). The correlation coefficient (R) demonstrated
a very weak relative strength of the relationship in the overall model fit 0.064, 0.165, and
0.087, respectively. Model D had a weak relationship (0.214) slightly improving the
strength compared to Models A, B, and C. In contrast, Model E (0.722) approached a
very strong and significantly improved strength of relationship to Models A-D. Finally,
Model R R Square Adjusted R SquareStandard Error of the Estimate
A 0.064a 0.004 0.004 6.160
B 0.165b 0.027 0.027 6.083
C 0.087c 0.007 0.007 6.105
D 0.214d 0.046 0.044 5.924
E 0.722e 0.522 0.515 4.220a
b
c
d
e
Predictors: (Constant), Adjusted Patient Days (APD), Total Operating Revenue per APD, Total Operating Expense per APD
Predictors: (Constant), Total Operating Revenue per APDPredictors: (Constant), Total Operating Expense per APDPredictors: (Constant), Adjusted Patient Days (APD)
Predictors: (Constant), 2012-13 Positive Economic Growth, Revenue Interaction, 2008-11 Market Downfall, For Profit, Bed Size 100-26, 2003-07 Positive Economic Growth, 1999-02 Adaptation to BBA of 1987, Total Operating Expense per APD, 1990-97 Positive Economic Growth, System Membership, Volume (Fav/Unf), Bed Size <=25, Bed Size 300-101, Expense (Fav/Unf), Government, Adjusted Patient Days (APD), Revenue (Fav/Unf), Urban or Rural, Total Operating Revenue per APD, Volume Interaction, Expense Interaction

54
revenue, expense, volume, combined, and full models (Adjusted R2) explained 0.4%,
2.7%, 0.7%, 4.4% and 51.5%, respectively, of the variance in their individual models (see
Table 10).
Step 3, determine if one or more of the 21 predictor variables is significantly
associated with operating margin. For each simple linear regression of the individual
independent variables (A) revenue, (B) expense, and (C) volume, the probability (p-
value) of the t statistic for the β coefficient was less than or equal to the level of
significance (α) of 0.05 (see Table 11). For these variables, we concluded that there was a
statistically significant relationship between these variables and operating margin.
Additionally, the relationship had a negative (β1, β2, and β3 are negative) association to
operating margin. A smaller variation to budgeted revenue, expense, and volume was
associated with a greater operating margin.
The multiple linear regression of the combined group of variables concluded a
statistical significant relationship with revenue and expense but not volume. Once
revenue and expense were taken into account there was no longer a significant operating
margin difference with volume. The β coefficient was negative for expense indicating a
smallr budget variation was associated with a greater operating margin. Conversely, the β
coefficient was positive for revenue indicating a greater budget variation was associated
with a greater operating margin. The revenue β coefficient was positive in the multiple
linear model (D) and negative in the bivariate, simple linear model (A). A bivariate
association can change when accounting for other variables in a multiple linear model.
The multiple linear regression analysis was the better result because it explained more of
the variance (Model A explained 0.4% of the variance whereas Model D explained

55
4.4%). The full model (E) explained 51.5% of the variance and provided the best results
of the five models selected in the study.
Table 11 Coefficients* Revenue (A), Expense (B), Volume (C), and Combined (D) Models
Testing the absolute value variances in the combined model explained less than
5% of the relationship; produced an inconsistent revenue and expense association; and
discounted the significance of volume. In the full model, favorable/unfavorable variances
and the magnitude of these favorable/unfavorable interactions were added to test if these
explained more of the budget variance relationship with operating margin.
Hypothesis 2: Smaller unfavorable budget variances are associated with greater
operating margins. Hypothesis 3: Greater favorable budget variances are associated with
greater operating margins. The unfavorable measures of revenue, expense, and volume
were isolated by assigning them a 1 (see Figure 8). The p-value for each unfavorable
Standardized Coefficients
Model B Std. Error Beta (β)A (Constant) 4.904 0.214 22.876 0.000
Total Operating Revenue per APD -4.948 1.794 -0.064 -2.758 0.006 **
B (Constant) 5.635 0.220 25.628 0.000Total Operating Expense per APD -13.245 1.967 -0.165 -6.735 0.000 **
C (Constant) 5.065 0.209 24.224 0.000Adjusted Patient Days (APD) -6.730 1.819 -0.087 -3.701 0.000 **
D (Constant) 5.357 0.242 22.169 0.000Total Operating Revenue per APD 19.204 3.464 0.213 5.545 0.000 **
Total Operating Expense per APD -28.565 3.601 -0.322 -7.933 0.000 **
Adjusted Patient Days (APD) -0.289 2.643 -0.003 -0.109 0.913
* Dependent Variable: Operating Margin** The t statistic for the B coefficient is less than or equal to the level of significance of 0.05.
Coefficients*Unstandardized
Coefficients t statistic
Significance Level (Sig.)

56
measure of revenue (0.972), expense (0.610), and volume (0.618) was greater than 0.05
confirming they were not statistically significant (see Table 12). An unfavorable budget
variance, had no statistically significant relationship to operating margin.
Table 12 Coefficients* Full (E) Model
Standardized Coefficients
Model B Std. Error Beta (β)E (Constant) 4.404 0.621 7.088 0.000
Total Operating Revenue per APD 47.453 3.092 0.526 15.347 0.000 **
Total Operating Expense per APD 39.734 5.022 0.448 7.913 0.000 **
Adjusted Patient Days (APD) 5.811 2.711 0.070 2.143 0.032 **
Revenue (Fav/Unf) -0.013 0.362 -0.001 -0.035 0.972
Expense (Fav/Unf) -0.189 0.370 -0.015 -0.510 0.610
Volume (Fav/Unf) 0.168 0.336 0.014 0.499 0.618
Revenue Interaction -105.620 5.231 -0.854 -20.192 0.000 **
Expense Interaction -89.532 6.168 -1.039 -14.516 0.000 **
Volume Interaction -9.623 4.176 -0.095 -2.304 0.021 **
For Profit -0.214 0.426 -0.009 -0.503 0.615
Government -0.195 0.317 -0.016 -0.615 0.538
System Membership 0.132 0.282 0.011 0.467 0.640
Bed Size 300-101 0.202 0.310 0.016 0.652 0.514
Bed Size 100-26 0.505 0.403 0.039 1.252 0.211
Bed Size <=25 0.076 0.514 0.004 0.149 0.882
Urban or Rural -0.116 0.351 -0.010 -0.331 0.741
1990-97 Positive Economic Growth 3.429 0.292 0.230 11.758 0.000 **
1999-02 Adaptation to BBA of 1987 -3.324 0.371 -0.168 -8.961 0.000 **
2003-07 Positive Economic Growth 3.354 0.360 0.176 9.324 0.000 **
2008-11 Market Downfall -3.059 0.483 -0.116 -6.339 0.000 **
2012-13 Positive Economic Growth 5.153 0.670 0.139 7.693 0.000 **
* Dependent Variable: Operating Margin** The t statistic for the B coefficient is less than or equal to the level of significance of 0.05.
Coefficients*Unstandardized
Coefficients t statistic
Significance Level (Sig.)
57
Does the magnitude of the favorable or unfavorable variance have an association
with a higher operating margin? The favorable/unfavorable dummy variables were
multiplied by the budget variance measures of revenue, expense, and volume to isolate
the unfavorable budget variances and create revenue, expense, and volume interaction
variables (see Figure 9). Each of the budget variance interactions (revenue, expense, and
volume) were statistically significant (p-value ≤ 0.05) and negatively or inversely
associated (-β) with operating margin. Larger unfavorable budget variances were
associated with smaller operating margins. Restated, smaller unfavorable budget
variances (revenue, expense, and volume) were associated with greater operating
margins.
By isolating the unfavorable budget variance interactions, the full model also
isolated the favorable excluded interactions. The favorable interactions were captured in
the full model by the original measures of revenue, expense, and volume budget
variances (Total Operating Revenue per APD, Total Operating Expense per APD, and
Adjusted Patient Days (APD)). Each of the original budget variances was statistically
significant (p-value ≤ 0.05) and positively associated (+β) with operating margin. Larger
favorable budget variances were associated with greater operating margins. Restated,
greater favorable budget variances (revenue, expense, and volume) were associated with
greater operating margins.
Favorable and unfavorable revenue, expense, and volume budget variances were
associated with operating margin. The impact of an unfavorable variance in revenue,
expense, and volume to the operating margin (-5.2%, -6.3%, and -0.6%, respectively)

58
was greater than the corresponding favorable variance (3.2%, 2.7%, and 0.4%,
respectively, see Figure 16).
Figure 16. Favorable and unfavorable budget variance impact on operating margin.
A stepwise regression was performed to determine the variables contributing to
the model through the creation of a cumulative series of models. The stepwise summary
identified a model of nine of the 21 variables explained all of the 51.5% (Adj. R2 =
51.5%, R2 = 51.8%) relationship in the full model (see Table 13). The favorable and
unfavorable measures of revenue and expense contributed to the model and explained
21.6% of the total 51.8% (R2) relationship in the full model (∆R2 = 2.5% (Unfavorable
Standard Deviation B
FavorableRevenue 0.067 × 47.453 = 3.2 %Expense 0.068 × 39.734 = 2.7 %Volume 0.073 × 5.811 = 0.4 %
UnfavorableRevenue 0.049 × -105.620 = -5.2 %Expense 0.070 × -89.532 = -6.3 %Volume 0.060 × -9.623 = -0.6 %
5% Deviation B
FavorableRevenue 0.050 × 47.453 = 2.4 %Expense 0.050 × 39.734 = 2.0 %Volume 0.050 × 5.811 = 0.3 %
UnfavorableRevenue 0.050 × -105.620 = -5.3 %Expense 0.050 × -89.532 = -4.5 %Volume 0.050 × -9.623 = -0.5 %
A 1 standard deviation unfavorable expense budget variance reduces the operating margin by 6.3%, lowering the 4% example to a -2.3% operating margin.
A 5% favorable expense budget variance improves the operating margin by 2.0%, raising the 4% example to a 6.0% operating margin.
A 5% unfavorable expense budget variance reduces the operating margin by 4.5%, lowering the 4% example to a -0.5% operating margin.
Operating Margin Impact
Budget Variances
Example using a 4% operating marginand all other factors constant:
A 1 standard deviation favorable expense budget variance improves the operating margin by 2.7%, raising the 4% example to a 6.7% operating margin.
Budget Variances
Operating Margin Impact
Example using a 4% operating marginand all other factors constant:

59
Revenue Interaction) + 4.5% (Unfavorable Expense Interaction) + 10.5% (Favorable
Revenue Interaction) + 4.1% (Favorable Expense Interaction) = 21.6%).
Table 13 Model Summary Stepwise Regression Models 1-9
R SquareAdjusted R
SquareStandard Error of the Estimate
R Square Change
0.350 a 0.122 0.122 5.679 0.1220.465 b 0.216 0.215 5.368 0.0940.510 c 0.260 0.259 5.216 0.0440.538 d 0.289 0.287 5.115 0.0290.560 e 0.314 0.312 5.027 0.0250.599 f 0.359 0.357 4.860 0.0450.681 g 0.464 0.461 4.447 0.1050.710 h 0.505 0.502 4.275 0.0410.720 i 0.518 0.515 4.219 0.013
a
b
c
d
e
f
g
h
i
Predictors: (Constant), 1990-97 Positive Economic GrowthPredictors: (Constant), 1990-97 Positive Economic Growth, 2003-07 Positive Economic GrowthPredictors: (Constant), 1990-97 Positive Economic Growth, 2003-07 Positive Economic Growth, 1999-02 Adaptation to BBA of 1987Predictors: (Constant), 1990-97 Positive Economic Growth, 2003-07 Positive Economic Growth, 1999-02 Adaptation to BBA of 1987, 2012-13 Positive Economic GrowthPredictors: (Constant), 1990-97 Positive Economic Growth, 2003-07 Positive Economic Growth, 1999-02 Adaptation to BBA of 1987, 2012-13 Positive Economic Growth, Revenue InteractionPredictors: (Constant), 1990-97 Positive Economic Growth, 2003-07 Positive Economic Growth, 1999-02 Adaptation to BBA of 1987, 2012-13 Positive Economic Growth, Revenue Interaction, Expense InteractionPredictors: (Constant), 1990-97 Positive Economic Growth, 2003-07 Positive Economic Growth, 1999-02 Adaptation to BBA of 1987, 2012-13 Positive Economic Growth, Revenue Interaction, Expense Interaction, Total Operating Revenue per APDPredictors: (Constant), 1990-97 Positive Economic Growth, 2003-07 Positive Economic Growth, 1999-02 Adaptation to BBA of 1987, 2012-13 Positive Economic Growth, Revenue Interaction, Expense Interaction, Total Operating Revenue per APD, Total Operating Expense per APDPredictors: (Constant), 1990-97 Positive Economic Growth, 2003-07 Positive Economic Growth, 1999-02 Adaptation to BBA of 1987, 2012-13 Positive Economic Growth, Revenue Interaction, Expense Interaction, Total Operating Revenue per APD, Total Operating Expense per APD, 2008-11 Market Downfall
56789
RStepwise Model
1234

60
Table 14 Coefficients* Stepwise Model 9
Table 15 Excluded Variables* Stepwise Model 9
Standardized Coefficients
Stepwise Model 9 B Std. Error Beta (β)9 (Constant) 4.571 0.204 22.447 0.000
1990-97 Positive Economic Growth 3.419 0.290 0.229 11.799 0.000 **
2003-07 Positive Economic Growth 3.366 0.359 0.177 9.377 0.000 **
1999-02 Adaptation to BBA of 1987 -3.223 0.367 -0.163 -8.774 0.000 **
2012-13 Positive Economic Growth 5.101 0.663 0.138 7.693 0.000 **
Revenue Interaction -105.001 4.306 -0.849 -24.386 0.000 **
Expense Interaction -98.955 4.417 -1.149 -22.404 0.000 **
Total Operating Revenue per APD 47.994 2.858 0.532 16.793 0.000 **
Total Operating Expense per APD 45.978 4.005 0.519 11.480 0.000 **
2008-11 Market Downfall -3.106 0.477 -0.118 -6.504 0.000 **
* Dependent Variable: Operating Margin** The t statistic for the B coefficient is less than or equal to the level of significance of 0.05.
Coefficients*Unstandardized
Coefficients t statistic
Significance Level (Sig.)
Stepwise Model 99 Adjusted Patient Days (APD) 0.026 0.026 1.022 0.307
Revenue (Fav/Unf) 0.004 0.004 0.168 0.867
Expense (Fav/Unf) -0.010 -0.010 -0.379 0.705
Volume (Fav/Unf) -0.029 -0.025 -1.141 0.254
Volume Interaction -0.039 -0.043 -1.537 0.125
For Profit -0.011 -0.007 -0.415 0.679
Government -0.002 -0.002 -0.091 0.927
System Membership -0.002 -0.001 -0.067 0.946
Bed Size 300-101 -0.005 -0.003 -0.177 0.859Bed Size 100-26 0.041 0.029 1.608 0.108Bed Size <=25 -0.013 -0.009 -0.508 0.612Urban or Rural -0.026 -0.018 -1.011 0.312
* Dependent Variable: Operating Margin** The t statistic for the B coefficient is less than or equal to the level of significance of 0.05.a Predictors in the Model: (Constant), 1990-97 Positive Economic Growth, 2003-07
Positive Economic Growth, 1999-02 Adaptation to BBA of 1987, 2012-13 Positive Economic Growth, Revenue Interaction, Expense Interaction, Total Operating Revenue per APD, Total Operating Expense per APD, 2008-11 Market Downfall
t statisticExcluded Variables* Significance
Level (Sig.)Beta (β) InaPartial
Correlation
61
Control variables: Hospital characteristics. There was no statistically
significant relationship with any of the individual hospital characteristics included in the
full model (hospital characteristics p-value > 0.05, see Table 12). A t-static greater than 2
in magnitude corresponds to p-values less than 0.05 (level of significance). If the t-
statistic is greater than 1 it is important to the model even though it does not achieve the
level of significance. One of the hospital characteristics, bed size 100-26, had a t-statistic
greater than 1 (1.252) indicating it was important to the model even if it was not
statistically significant. The bed size 100-26 coefficient (β = 0.039) indicated, on average,
hospitals with bed size 100-26 had operating margins that were slightly higher than the
excluded group of hospitals with over 300 beds.
In review of the stepwise regression, hospital characteristics did not contribute to
the 51.5% (Adj. R2 = 51.5%, R2 = 51.8%) relationship and were excluded in the stepwise
regression (see Table 16). The hospital characteristic control variables did not change the
potential budget variance association with operating margin.
Control variables: Macroeconomic periods. Step 4, each of the five
independent variables representing periods of macroeconomic change had a significant
relationship with operating margin (see Table 12). In positive economic periods operating
margins are inflated by 3% to 5%, and in negative economic periods margins are deflated
by 3% (B = 3.429, -3.324, 3.354, -3.059, and 5.153). These macroeconomic periods
represented the largest percentage, 30.2 %, of the total 51.8% (R2) relationship in the full
model (∆R2 = 12.2% + 9.4% + 4.4% + 2.9% + 1.3% = 30.2%, see Table 13). During the
1990-1997 period of economic growth, hospitals with strong operating margins (greater
than 4%) were associated with higher operating margins (+β). During the 1999-2002

62
period of adaptation to Balance Budget Act (BBA) of 1997, hospitals with weak
operating margins (less than 4%) were associated with smaller operating margins (-β).
During the 2003-2007 period of positive economic growth, hospitals with strong
operating margins (greater than 4%) were associated with higher operating margins (+β).
During the 2008-2011 period of market downfall, hospitals with weak operating margins
(less than 4%) were associated with smaller operating margins (-β). During the 2012-
2013 period of positive economic growth, hospitals with strong operating margins
(greater than 4%) were associated with higher operating margins (+β).
In summary, the study supported all three hypotheses. Hypothesis 1: Smaller
budget variances are associated with greater operating margins. Hypothesis 2: Smaller
budget variances are associated with greater operating margins. Hypothesis 3: Greater
favorable budget variances are associated with greater operating margins. In addition,
hospital characteristics did not affect the budget variance relationship to operating
margin. A final interesting finding, the macro-economy had a significant impact on
operating margin.

63
Chapter 5
Summary and Conclusions
There is a near-universal assumption in literature and practice that greater
accuracy in forecasting and/or tighter management to the budget improves profitability
(Libby & Lindsay, 2010; Umapathy, 1987). This assumption drives the use of budgets in
planning, coordination, oversight, and motivation within organizations (Merchant & Van
der Stede, 2012). Control theory is often cited as the mechanism behind this assumed
budget relationship to profitability (Carver & Scheier, 1982; Wiener, 1948). The theory
suggests budget variance reporting alerts managers of discrepancies and elicits action that
improves an organization’s profitability. It is a widely held belief that some hospitals
based on their characteristics (e.g., ownership, system membership, bed size, urban or
rural) are better at these types of budget controls and achieve higher profitability. For
example, for-profit, system, larger, and/or urban hospitals are assumed to be more
profitable because of these characteristics. Prior to this study, these assumptions were
untested and revealed a significant gap in the literature.
Purpose: Research Question and Hypotheses
The purpose of this study was to examine the relationship between hospital
budget variances and profitability. Specifically, the study examined the following
research question and related three hypotheses for hospitals:
Are smaller budget variances (more accurate forecasting and/or tighter management)
associated with greater operating margins?

64
1. H1: Smaller budget variances are associated with greater operating margins.
2. H2: Smaller unfavorable budget variances are associated with greater operating
margins.
3. H3: Greater favorable budget variances are associated with greater operating margins.
Discussion of Findings
Hypothesis 1: Smaller budget variances are associated with greater operating
margins. True and false. If they are unfavorable budget variances the hypothesis is true
but if favorable, false. Budget variances, independent of their favorable or unfavorable
relationship, had a statistically significant relationship but were limited in explaining their
association with operating margin. Isolating and including the favorable and unfavorable
variables into the model explained more and provided a clearer understanding of the
relationship. The indecisive findings in Hypothesis 1 begs the question whether this was a
necessary or even testable hypothesis in its current form.
Hypothesis 2: Smaller unfavorable budget variances are associated with greater
operating margins. Hypothesis 3: Greater favorable budget variances are associated with
greater operating margins. Hypotheses 2 and 3 are true. By isolating the favorable and
unfavorable variables in the model both hypotheses 2 and 3 are true.
The results of this study affirmed greater accuracy in forecasting and/or tighter
management to, or favorably exceeding, the budget improves profitability. The study also
provided an expected and measurable impact of these budget variances to the operating
margin. In the study, almost 70% of the hospital expense budget variances were
unfavorable. Managers would benefit from greater attention to unfavorable expense
variances because of the impact on operating margin. A 5% deviation (less than a single
65
standard deviation of 7.0%) in expenses was associated with a -4.5% reduction in
operating margin, and a similar favorable deviation in expenses was associated with a
2.0% increase in operating margin. Hospitals in the study performed better on revenue,
achieving favorable variances in almost 60% of cases. Budget variances in revenue are
also an area for management attention as a 5% unfavorable variance deviation (about one
standard deviation of 4.9%) was associated with a -5.3% reduction in operating margin
and a similar favorable variance has a 2.4% operating margin improvement. Although
management should be attentive to volume variances, their relationships have a weaker
association and less impact to operating margin.
Negative deviations in both revenue and expenses have a greater impact on
operating margin than positive deviations. A potential reason could be the level of fixed
cost incorporated in expenses that does fluctuate when there are changes in revenue and
volume.
In sum, a budget variance in revenue and expense had a significant impact on
operating margins. Managers can improve the hospital’s operating margin by first
prioritizing the reduction and/or elimination of unfavorable variances and second
increasing favorable variances.
The hospital characteristics and macroeconomic control variables had notable
effects on the study. Hospital characteristics did not affect the budget variance
relationship to operating margin. In contrast, macroeconomic periods had a significant
impact on operating margin.

66
Limitations
The gap in the budget processes to profitability relationship in the literature limits
conflicting or reinforcing comparisons with prior research. Many research studies test the
purpose of budgeting and influence on planning, coordination, oversight, and motivation.
These studies do not, however, address the central theme of this study: Do better
budgeting practices improve profitability?
The dataset was limited to hospitals in the state of Washington. Extending the
study findings more broadly should be done with caution as the hospitals in the state of
Washington may not be representative of all hospitals in the U.S. For example,
comparisons between hospitals from the state of Washington and other U.S. hospitals
indicated Washington has a greater percentage of government, stand-alone, and urban
hospitals. Additional research is needed to determine if the conclusions are consistent
with the United States or global hospital sector.
Recommendations for Future Research
This study focused on the budget variance relationship to operating margin.
Additional areas to explore are actual to prior year and budget to prior year variance
relationships to operating margin. Are prior year variances associated with operating
margins? The results would address the degree to which hospitals continuously improve
year over year and if this improvement is associated with greater operating margins. Are
budget to prior year variances associated with operating margins? The results would
address the degree to which hospitals set budgets above prior year in targeting improved
performance and whether or not this is associated with greater operating margins.

67
The study also focused on three selected measures for revenue, expense, and
budget variance relationships to operating margin. Do other selected measures reinforce
or detract from the operating margin relationship? The database had over 60 financial and
utilization measures. With this breadth of metrics, future research could be more tailored
to the research questions posed for both independent and dependent variables.
There are numerous studies cited in the literature review relating hospital
characteristics to profitability, but they all suffer from omitted variable bias. These
studies fail to account for internal operations including the budgeting process. The
budgeting process could alter and/or reinforce the relationship of hospital characteristics
to profitability if these omitted variables were incorporated into this research. Future
studies could reevaluate previous research by taking into account the budgeting process.
This study explains just over 50% of the relationship (Adj. R2 = 51.5%). Future
studies would benefit from inclusion of other variables that explain a larger percentage of
the relationship.
An area that could benefit from this type of reexamined analysis is in hospital
ownership studies, more specifically for-profit ownership. Independent of budget factors,
the evidence is building that for-profit hospitals achieve better financial performance.
Examples for reexamination include findings that for-profit hospitals are more responsive
to changes in profitability (Horwitz, 2005); operate at a lower cost (Jiang et al., 2006;
McKay & Deily, 2005); improve financial performance following ownership conversions
(Joynt et al., 2014); and conflicting negligible differences in profitability (Becker &
Sloan, 1985).

68
The macroeconomic factors’ association with operating margins would benefit
from further research. These factors explained a significant percentage of the overall
operating margin relationship in the study. Future research regarding the specific types of
macroeconomic factors (e.g. change in balance of power between elected parties,
regulation, unemployment, inflation, investments) and quantifying the impact would
benefit managers in responding to these changes.
Final Conclusions
The results of this study indicate greater accuracy in forecasting and/or tighter
management to the budget, or favorably exceeding it, leads to improved profitability.
More specifically, smaller unfavorable budget variances are associated with greater
operating margins while greater favorable budget variances are associated with greater
operating margins. A single standard deviation reduction in unfavorable revenue and
expense increases operating margin by 5.2% and 6.3%, respectively. An equivalent
favorable deviation in revenue and expense increases operating margin by 3.2% and
2.7%, respectively. Managers can improve the hospital’s operating margin by first
prioritizing the reduction and/or elimination of unfavorable variances, and second
increasing favorable variances.
Hospital characteristics are not a factor and do not affect the budget variance to
operating margin relationship. In contrast, macroeconomic factors play a significant role
in their relationship to operating margin. In positive economic periods operating margins
are inflated by 3% to 5%, and in negative economic periods margins are deflated by 3%.

69
REFERENCES
Abernethy, M. A., & Stoelwinder, J. U. (1991). Budget use, task uncertainty, system goal orientation and subunit performance: a test of the ‘fit’hypothesis in not-for-profit hospitals. Accounting, Organizations and Society, 16(2), 105-120.
Alchian, A. A. (1950). Uncertainty, evolution, and economic theory. The Journal of Political Economy, 58(3), 211-221.
Alkire, M. (2014). Can we break even on medicare? Retrieved from www.hfma.org/Content.aspx?id=21932
American Hospital Association. (2013). AHA Hospital Statistics, 2013 edition: American Hospital Association.
American Hospital Association. (2014). TrendWatch Chartbook 2014: Trends Affecting Hospitals and Health Systems. Retrieved from
Anthony, R. N. (1965). Planning and control systems: A framework for analysis (1st ed.). Boston: Division of Research, Harvard Business School.
Anthony, R. N., & Young, D. W. (2003). Management control in nonprofit organizations (7th ed.). Homewood, IL: McGraw-Hill/Irwin.
Archer, S., & Otley, D. (1991). Strategy, structure, planning and control systems and performance evaluation. Management Accounting Research, 2(4), 263-303.
Argyris, C. (1952). The impact of budgets on people. New York: Controllership Foundation.
Arrington, B., & Haddock, C. C. (1990). Who really profits from not-for-profits? Health Services Research, 25(2), 291.
Arterian, S. (1998). Sprinting to a streamlined budget. CFO Europe, 23.
70
Atkinson, A., Banker, R. D., Kaplan, R. S., & Young, S. (1995). Management Accounting. Englewood, Cliffs, NJ: Prentice Hall.
Baum, J. R., Locke, E. A., & Smith, K. G. (2001). A multidimensional model of venture growth. Academy of Management Journal, 44(2), 292-303.
Bayton, J. A. (1943). Interrelations between levels of aspiration, performance, and estimates of past performance. Journal of Experimental Psychology, 33(1), 1.
Becker, E. R., & Sloan, F. A. (1985). Hospital ownership and performance. Economic Inquiry, 23(1), 21-36. Retrieved from http://www.ncbi.nlm.nih.gov/pubmed/10271342
Becker, S., & Green, D. (1962). Budgeting and employee behavior. Journal of Business, 392-402.
Berry, R. E. (1967). Returns to scale in the production of hospital services. Health Services Research, 2(2), 123.
Berry, R. E. (1974). Cost and efficiency in the production of hospital services. The Milbank Memorial Fund Quarterly. Health and Society, 291-313.
Berwick, D. M., & Hackbarth, A. D. (2012). Eliminating waste in US health care. Jama, 307(14), 1513-1516.
Birnberg, J. G., & Nath, R. (1967). Implications of behavioral science for managerial accounting. Accounting Review, 468-479.
Bonner, S. E., & Sprinkle, G. B. (2002). The effects of monetary incentives on effort and task performance: theories, evidence, and a framework for research. Accounting, Organizations and Society, 27(4), 303-345.
Bragg, S. (2013). What is a budget variance? Accounting Tools. Retrieved from www.accountingtools.com
Brown, L. D. (2001). How Important Is past Analyst Forecast Accuracy? Financial Analysts Journal, 57(6), 44-49. Retrieved from http://www.jstor.org/stable/4480355

71
Brown, L. D., & Rozeff, M. S. (1980). Analysts can forecast accurately! The Journal of Portfolio Management, 6(3), 31-34.
Brownell, P. (1982). The role of accounting data in performance evaluation, budgetary participation, and organizational effectiveness. Journal of Accounting Research, 12-27.
Brownell, P., & Dunk, A. S. (1991). Task uncertainty and its interaction with budgetary participation and budget emphasis: Some methodological issues and empirical investigation. Accounting, Organizations and Society, 16(8), 693-703.
Brownell, P., & Hirst, M. (1986). Reliance on accounting information, budgetary participation, and task uncertainty: Tests of a three-way interaction. Journal of accounting Research, 241-249.
Broyles, R. W., Brandt, E. N., & Biard‐Holmes, D. (1998). Networks and the fiscal performance of rural hospitals in Oklahoma: Are they associated? The Journal of Rural Health, 14(4), 327-337.
Bryan, J. F., & Locke, E. A. (1967). Goal setting as a means of increasing motivation. Journal of Applied Psychology, 51(3), 274.
Butler, K. C., & Lang, L. H. (1991). The forecast accuracy of individual analysts: Evidence of systematic optimism and pessimism. Journal of Accounting Research, 150-156.
Caplan, E. H. (1966). Behavioral assumptions of management accounting. Accounting Review, 41(3), 496-509. doi:10.2307/244479
Carey, K. (2003). Hospital cost efficiency and system membership. INQUIRY: The Journal of Health Care Organization, Provision, and Financing, 40(1), 25-38.
Carr, W. J., & Feldstein, P. J. (1967). The relationship of cost to hospital size. Inquiry, 45-65.
Carver, C. S., & Scheier, M. F. (1981). Attention and self-regulation. New York: Springer.

72
Carver, C. S., & Scheier, M. F. (1982). Control theory: A useful conceptual framework for personality–social, clinical, and health psychology. Psychological bulletin, 92(1), 111.
Centers for Medicare & Medicaid Services. (2015). Master Demonstration, Evaluation and Research Studies for ORDI System of Record 09-70-0591: List of Projects. Retrieved from http://www.cms.gov/Medicare/Demonstration-Projects/DemoProjectsEvalRpts/index.html?redirect=/DemoProjectsEvalRpts
Cherrington, D. J., & Cherrington, J. O. (1973). Appropriate reinforcement contingencies in the budgeting process. Journal of Accounting Research, 225-253.
Child, I. L., & Whiting, J. W. (1949). Determinants of level of aspiration: Evidence from everyday life. Journal of Abnormal and Social Psychology, 44(3), 303.
Chow, C. W. (1983). 1983 Competitive Manuscript Award: The effects of job standard tightness and compensation scheme on performance: An exploration of linkages. Accounting Review, 667-685.
Clement, J. P., McCue, M. J., Luke, R. D., Bramble, J. D., Rossiter, L. F., Ozcan, Y. A., & Pai, C.-W. (1997). Strategic hospital alliances: Impact on financial performance. Health Affairs, 16(6), 193-203.
Clement, M. B. (1999). Analyst forecast accuracy: Do ability, resources, and portfolio complexity matter? Journal of Accounting and Economics, 27(3), 285-303. doi:http://dx.doi.org/10.1016/S0165-4101(99)00013-0
Cleverley, J. (2008). Metrics that work. Retrieved from Worthington, OH: www.cleverleyassociates.com/library/metricsthatwork.pdf
Cleverley, W., Cleverley, J., LaFortune, J., & Handlon, L. (2015). State of the hospital industry (2015 ed.). Worthington, OH: Cleverley + Associates.
Cleverley, W. O. (1992). Financial and operating performance of systems: Voluntary versus investor-owned. Topics in Health Care Financing, 18(4), 63.
Cleverley, W. O., Cleverley, J. O., & Song, P. H. (2010). Essentials of health care finance (7th ed.). Sudbury, MA: Jones & Bartlett Learning.

73
Coch, L., & French, J. R. P. (1948). Overcoming resistance to change. Human Relations.
Congressional Budget Office, & Joint Committee on Taxation. (2012). Estimate of the direct spending and revenue effects of H.R. 6079, the Repeal of Obamacare Act, as passed by the House of Representatives on July 11, 2012. Retrieved from Washington, DC: www.cbo.gov/sites/default/files/cbofiles/attachments/43471-hr6079.pdf
Coyne, J. S. (1982). Hospital performance in multihospital systems: A comparative study of system and independent hospitals. Health Services Research, 17(4), 303.
Daniel, S., & Reitsperger, W. (1992). Management control systems for quality: An empirical comparison of the US and Japanese electronic industry. Journal of Management Accounting Research, 4, 64-78.
Daniel, S. J., & Reitsperger, W. D. (1991). Linking quality strategy with management control systems: Empirical evidence from Japanese industry. Accounting, Organizations and Society, 16(7), 601-618.
Delaune, J., & Everett, W. (2008). Waste and inefficiency in the US health care system: Clinical care: A comprehensive analysis in support of system-wide improvements. Cambridge, MA: New England Healthcare Institute.
Demsetz, H. (1983). The structure of ownership and the theory of the Firm. Journal of Law and Economics, 26, 375.
Dent, J. F. (1991). Accounting and organizational cultures: a field study of the emergence of a new organizational reality. Accounting, organizations and society, 16(8), 705-732.
Doeksen, G. A., Johnson, T. G., & Willoughby, C. (1997). Measuring the economic importance of the health sector on a local economy: A brief literature review and procedures to measure local impacts: Southern Rural Development Center.
Dranove, D., Garthwaite, C., & Ody, C. (2014). Health spending slowdown is mostly due to economic factors, not structural change in the health care sector. Health affairs (Project Hope), 33(8), 1399.

74
Dunk, A. S. (1993). The effect of budget emphasis and information asymmetry on the relation between budgetary participation and slack. Accounting Review, 400-410.
Ekholm, B.-G., & Wallin, J. (2000). Is the annual budget really dead? European Accounting Review, 9(4), 519-539.
Ellison, A. (2015). A state-by-state breakdown of 57 rural hospital closures. Becker's Hospital Review. Retrieved from www.beckershospitalreview.com
Emmanuel, C., Otley, D. T., & Merchant, K. (1990). Accounting for management control. New York: Springer.
Evans, R. (1971). Behavioral cost functions for hospitals. Canadian Journal of Economics, 4(3), 198-215.
Feather, N. T. (1967). Valence of outcome and expectation of success in relation to task difficulty and perceived locus of control. Journal of Personality and Social Psychology, 7(4, pt. 1), 372.
Fellenz, M. R. (1997). Control theory in organizational behavior: Review, critique, and prospects. (Unpublished manuscript. Trinity College: Dublin), 31. Retrieved from http://ssrn.com/abstract=939714 or http://dx.doi.org/10.2139/ssrn.939714
Ferrier, G. D., & Valdmanis, V. (1996). Rural hospital performance and its correlates. Journal of Productivity Analysis, 7(1), 63-80.
Fisher, E. S., Wennberg, D. E., Stukel, T. A., Gottlieb, D. J., Lucas, F. L., & Pinder, E. L. (2003a). The implications of regional variations in Medicare spending. Part 1: The content, quality, and accessibility of care. Annals of Internal Medicine, 138(4), 273-287.
Fisher, E. S., Wennberg, D. E., Stukel, T. A., Gottlieb, D. J., Lucas, F. L., & Pinder, E. L. (2003b). The implications of regional variations in Medicare spending. Part 2: Health outcomes and satisfaction with care. Annals of Internal Medicine, 138(4), 288-298.
Fisher, J. G., Maines, L. A., Peffer, S. A., & Sprinkle, G. B. (2002). Using budgets for performance evaluation: Effects of resource allocation and horizontal information

75
asymmetry on budget proposals, budget slack, and performance. Accounting Review, 77(4), 847-865.
Fitch Ratings. (2015). Fewer uninsured brighten U.S. nonprofit hospitals. Retrieved from New York: www.fitchratings.com/site/fitch-home/pressrelease?id=991213
Fitzgerald, J., & Jacobsen, B. (1987). Study fails to prove for-profits' superiority. Health Progress, 68(3), 32-37.
Flamholtz, E. G., Das, T., & Tsui, A. S. (1985). Toward an integrative framework of organizational control. Accounting, organizations and society, 10(1), 35-50.
Francisco, E. W. (1970). Analysis of cost variations among short-term general hospitals. Empirical Studies in Health Economics, Baltimore: The Johns Hopkins University Press.
Gapenski, L. C. (2011). Healthcare finance: An introduction to accounting and financial management (A. H. E. B. f. G. Studies Ed. 5th ed.). Chicago, IL: Health Administration Press.
Gapenski, L. C., Vogel, W. B., & Langland-Orban, B. (1993). The determinants of hospital profitability. Journal of Healthcare Management: Journal of the American College of Healthcare Executives, 38(1), 63.
Goold, M., & Quinn, J. J. (1990). The paradox of strategic controls. Strategic Management Journal, 11(1), 43-57.
Govindarajan, V. (1988). A contingency approach to strategy implementation at the business-unit level: Integrating administrative mechanisms with strategy. Academy of Management Journal, 31(4), 828-853.
Govindarajan, V., & Fisher, J. (1990). Strategy, control systems, and resource sharing: Effects on business-unit performance. Academy of Management Journal, 33(2), 259-285.
Govindarajan, V., & Gupta, A. K. (1992). Linking control systems to business unit strategy: Impact on performance. New York: Springer.
76
Green, S. B. (1991). How Many Subjects Does It Take To Do A Regression Analysis. Multivariate Behavioral Research, 26(3), 499-510. doi:10.1207/s15327906mbr2603_7
Gupta, A. K. (1987). SBU strategies, corporate-SBU relations, and SBU effectiveness in strategy implementation. Academy of Management Journal, 30(3), 477-500.
Gurton, A. (1999). Bye bye budget... the annual budget is dead. Accountancy International, 123(1267), 61.
Hansen, S. C., Otley, D. T., & Van der Stede, W. A. (2003). Practice developments in budgeting: An overview and research perspective. Journal of Management Accounting Research, 15(1), 95-116. doi:10.2308/jmar.2003.15.1.95
Hansen, S. C., & Van der Stede, W. A. (2004). Multiple facets of budgeting: An exploratory analysis. Management Accounting Research, 15(4), 415-439.
Health Care Transformation Task Force. (2015). Retrieved from www.hcttf.org
Health Transformation Alliance. (2016). Retrieved from www.htahealth.com
Healthcare Financial Management Association. (2014). HFMA key hospital financial statistics and ratio medians. Retrieved from Westchester, IL: http://www.hfma.org
Heider, F. (1946). Attitudes and cognitive organization. The Journal of Psychology, 21(1), 107-112.
Heider, F. (1958). The psychology of interpersonal relations. New York: Wiley.
Herman, B. (2012). 7 strategies to help hospitals break even on Medicare. Beckers Hospital Review.
Herzlinger, R. E., & Krasker, W. S. (1986). Who profits from nonprofits? Harvard Business Review, 65(1), 93-106.

77
Hirst, M. K., & Lowy, S. M. (1990). The linear additive and interactive effects of budgetary goal difficulty and feedback on performance. Accounting, Organizations and Society, 15(5), 425-436.
Hoaglin, D. C., & Iglewicz, B. (1987). Fine-tuning some resistant rules for outlier labeling. Journal of the American Statistical Association, 82(400), 1147-1149.
Hoaglin, D. C., Iglewicz, B., & Tukey, J. W. (1986). Performance of some resistant rules for outlier labeling. Journal of the American Statistical Association, 81(396), 991-999.
Hofstede, G. H. (1968). The game of budget control. Koninklijke Van Gorcum & Comp. N.V., Assen, The Netherlands: Tavistock Publications Limited.
Hope, J., & Fraser, R. (1999). Beyond budgeting: Building a new management model for the information age. Management Accounting, 77(1), 16-21.
Hope, J., & Fraser, R. (2003). Who needs budgets? Harvard Business Review, 81(2), 108-115,126.
Hope, J., & Fraser, R. (2013). Beyond budgeting: How managers can break free from the annual performance trap. Cambridge, MA: Harvard Business Press.
Hopwood, A. G. (1972). An empirical study of the role of accounting data in performance evaluation. Journal of Accounting Research, 156-182.
Hopwood, A. G. (1976). Accounting and Human Behavior. Upper Saddle River, NJ: Prentice Hall.
Horngren, C. T., Bhimani, A., Datar, S. M., & Foster, G. (2002). Management and cost accounting. Upper Saddle River, NJ: Prentice Hall.
Horwitz, J. R. (2005). Making profits and providing care: Comparing nonprofit, for-profit, and government hospitals. Health Affairs, 24(3), 790-801.
Hsia, R. Y., Kellermann, A. L., & Shen, Y. (2011). Factors associated with closures of emergency departments in the United States. JAMA, 305(19), 1978-1985. doi:10.1001/jama.2011.620

78
Huyck, R. (2013). Hospital and Patient Data Section (HPDS) of the Center for Health Statistics. Retrieved from http://www.doh.wa.gov/DataandStatisticalReports/
IBM Corp. (Released 2013). IBM SPSS Statistics for Windows, Version 22.0. Armonk, NY: IBM Corp.
Institute of Medicine. (2001). Crossing the quality chasm: A new health system for the 21st century: National Academies Press.
Jensen, M. C. (2001). Corporate budgeting is broken, let's fix it. Harvard Business Review, 94-101.
Jensen, M. C. (2003). Paying people to lie: The truth about the budgeting process. European Financial Management, 9(3), 379-406.
Jiang, H. J., Friedman, B., & Begun, J. W. (2006). Factors associated with high-quality/low-cost hospital performance. Journal of Health Care Finance, 32(3), 39-52.
Joynt, K. E., Orav, E., & Jha, A. K. (2014). Association between hospital conversions to for-profit status and clinical and economic outcomes. JAMA, 312(16), 1644-1652. doi:10.1001/jama.2014.13336
Kay, E., French, J. R. P., & Meyer, H. H. (1962). A study of threat and participation in an industrial performance appraisal program. Behavioral Research Service, Management Development and Employee Relations Services, General Electric Co.
Kelley, R. (2009). Where can $700 billion in waste be cut annually from the US healthcare system. Ann Arbor, MI: Thomson Reuters.
Kenis, I. (1979). Effects of budgetary goal characteristics on managerial attitudes and performance. Accounting Review, 707-721.
Kerns, C., Koppenheffer, M., & Drayton, C. (2013). 12 'must-do' strategies for protecting future margins. Retrieved from Washington DC: www.advisory.com
79
Khandwalla, P. N. (1972). The effect of different types of competition on the use of management controls. Journal of Accounting Research, 275-285.
Kim, J., & Mahoney, J. T. (2005). Property rights theory, transaction costs theory, and agency theory: An organizational economics approach to strategic management. Managerial and Decision Economics, 26(4), 223-242.
Klein, H. J. (1989). An integrated control theory model of work motivation. Academy of Management Review, 14(2), 150-172.
Knights, D., & Willmott, H. (1993). ‘It's a very foreign discipline’: The genesis of expenses control in a mutual life insurance company. British Journal of Management, 4(1), 1-18.
Langfield-Smith, K. (1997). Management control systems and strategy: A critical review. Accounting, Organizations and Society, 22(2), 207-232.
Latham, G. P., & Locke, E. A. (1975). Increasing productivity and decreasing time limits: A field replication of Parkinson's law. Journal of Applied Psychology, 60(4), 524.
Lave, J. R., & Lave, L. B. (1970). Hospital cost functions. American Economic Review, 379-395.
Leavitt, H. J., Pondy, L. R., & Boje, D. M. (1964). Readings in managerial psychology. Chicago, IL: University of Chicago Press.
Lefcourt, H. M. (1965). Risk taking in Negro and white adults. Journal of Personality and Social Psychology, 2(5), 765.
Levitz, G. S., & Brooke, P. P. (1985). Independent versus system-affiliated hospitals: a comparative analysis of financial performance, cost, and productivity. Health Services Research, 20(3), 315.
Lewin, K. (1936). Pyschology of success and failure. Occupations: The Vocational Guidance Journal, 14(9), 926-930.
Lewin, K., Dembo, T., Festinger, L., & Sears, P. S. (1944). Level of aspiration. Oxford, England: Ronald Press.
80
Li, P., Schneider, J. E., & Ward, M. M. (2009). Converting to critical access status: How does it affect rural hospitals' financial performance? INQUIRY: The Journal of Health Care Organization, Provision, and Financing, 46(1), 46-57.
Libby, T., & Lindsay, R. M. (2010). Beyond budgeting or budgeting reconsidered? A survey of North-American budgeting practice. Management Accounting Research, 21(1), 56-75.
Locke, E. A. (1991). Goal theory vs. control theory: Contrasting approaches to understanding work motivation. Motivation and Emotion, 15(1), 9-28.
Locke, E. A., & Latham, G. P. (1990). A theory of goal setting & task performance. Upper Saddle River, NJ: Prentice Hall.
Locke, E. A., & Latham, G. P. (2002). Building a practically useful theory of goal setting and task motivation: A 35-year odyssey. American Psychologist, 57(9), 705.
Locke, E. A., Shaw, K. N., Saari, L. M., & Latham, G. P. (1981). Goal setting and task performance: 1969–1980. Psychological Bulletin, 90(1), 125.
Manheim, L. M., Shortell, S. M., & McFall, S. (1989). The effect of investor-owned chain acquisitions on hospital expenses and staffing. Health Services Research, 24(4), 461.
Martocchio, J. J., & Frink, D. D. (1994). A review of the influence of group goals on group performance. Academy of Management Journal, 37(5), 1285-1301.
McKay, N. L., & Deily, M. E. (2005). Comparing high-and low-performing hospitals using risk-adjusted excess mortality and cost inefficiency. Health Care Management Review, 30(4), 347-360.
Medicare Payment Advisory Commission, M. (2012). A Data Book: Health Care Spending and the Medicare Program. Retrieved from http://www.medpac.gov/documents/Jun12DataBookEntireReport.pdf
Merchant, K. A. (1981). The design of the corporate budgeting system: Influences on managerial behavior and performance. Accounting Review, 813-829.

81
Merchant, K. A. (1985a). Budgeting and the propensity to create budgetary slack. Accounting, Organizations and Society, 10(2), 201-210.
Merchant, K. A. (1985b). Organizational controls and discretionary program decision making: A field study. Accounting, Organizations and Society, 10(1), 67-85.
Merchant, K. A. (1998). Modern management control systems: Text and cases. Upper Saddle River, NJ: Prentice Hall.
Merchant, K. A., & Manzoni, J.-F. (1989). The achievability of budget targets in profit centers: A field study. Accounting Review, 539-558.
Merchant, K. A., & Otley, D. T. (2006). A review of the literature on control and accountability. Handbook of Management Accounting Research, 2, 785-802.
Merchant, K. A., & Van der Stede, W. A. (2012). Management control systems: Performance measurement, evaluation and incentives (3rd ed.). Harlow, UK: Pearson Education Limited.
Miles, J. A. (2012). Management and organization theory: A Jossey-Bass Reader (Vol. 9). San Francisco, CA: Jossey Bass Wiley.
Miller, D., & Friesen, P. H. (1982). Innovation in conservative and entrepreneurial firms: Two models of strategic momentum. Strategic management journal, 3(1), 1-25.
Minich-Pourshadi, K. (2011). How to break even on Medicare reimbursements. HealthleadersMedia.
Mintzberg, H. (1978). Patterns in strategy formation. Management Science, 24(9), 934-948.
Mintzberg, H., & Waters, J. A. (1985). Of strategies, deliberate, and emergent. Strategic Management Journal, 6(3), 257-272.
Miyagi, M. (2008). 10 key metrics as components to measuring financial health. Retrieved from El Segundo, CA: http://www.thecamdengroup.com/top10/08%20March%20(Miyagi).pdf

82
Molpus, J., & Elek, S. (2010). HealthLeaders Media Breakthroughs: Hospital Merger and Acquisition Strategies. Retrieved from http://healthleadersmedia.com/breakthroughs/257025/Hospital-Merger-and-Acquisition-Strategies
Moody's Investors Service. (2013). Moody's: U.S. not-for-profit hospital outlook remains negative for 2014; revenue growth to decline. Retrieved from San Francisco, CA: www.moodys.com/research/Moodys-US-not-for-profit-hospital-outlook-remains-negative-for--PR_287519
Moscovice, I. S. (1989). Rural hospitals: A literature synthesis and health services research agenda. Health Services Research, 23(6), 891.
Moscovice, I. S., & Stensland, J. (2002). Rural hospitals: Trends, challenges, and a future research and policy analysis agenda. The Journal of Rural Health, 18(5), 197-210. doi:10.1111/j.1748-0361.2002.tb00931.x
Nouri, H., & Parker, R. J. (1998). The relationship between budget participation and job performance: The roles of budget adequacy and organizational commitment. Accounting, Organizations and Society, 23(5), 467-483.
NRHA, N. R. H. A. (2013). Rural hospital closures are decimating rural health care delivery. Retrieved from Leawood, KS: www.ruralhealthweb.org or file:///C:/Users/3729fv1/Downloads/SaveRuralHospitalsActtalkingpointsJune2015.pdf
O'Brien, P. C. (1990). Forecast accuracy of individual analysts in nine industries. Journal of Accounting Research, 286-304.
Office of Inspector General. (2002). Hospital closure 2000 (1987-1999) (OEI-04-02-00010). Retrieved from Washington, DC: www.oig.hhs.gov
Office of Inspector General. (2003a). Trends in rural hospital closure 1990-2000 (OEI 04-02-00610). Retrieved from Washington, DC: www.oig.hhs.gov
Office of Inspector General. (2003b). Trends in urban hospital closure 1990-2000 (OEI 04-02-00611). Retrieved from Washington, DC: www.oig.hhs.gov

83
Office of the Legislative Counsel. (2010). Compilation of Patient Protection and Affordable Care Act: Patient Protection and Affordable Care Act (PPACA) and health-related portions of the Health Care and Education Reconciliation Act (HCERA) of 2010. Retrieved from United States of America: www.hhs.gov
Otley, D. T. (1978). Budget use and managerial performance. Journal of Accounting Research, 122-149.
Otley, D. T. (1999). Performance management: A framework for management control systems research. Management Accounting Research, 10(4), 363-382.
Parker, R. J., & Kyj, L. (2006). Vertical information sharing in the budgeting process. Accounting, Organizations and Society, 31(1), 27-45. doi:http://dx.doi.org/10.1016/j.aos.2004.07.005
Poley, S. T., & Ricketts, T. C. (2001). Fewer hospitals close in the 1990s: Rural hospitals mirror this trend. Findings Brief. Chapel Hill, NC: Sheps Center for Health Services Research, University of North Carolina at Chapel Hill.
Porter, L. W., & Lawler, E. E. (1968). Managerial attitudes and performance. Homewood, IL: RD Irwin.
Porter, M. E. (1980). Competitive strategy: Techniques for analyzing industries and competition. New York: The Free Press.
Porter, M. E., & Lee, T. H. (2015). Why strategy matters now. New England Journal of Medicine, 372(18), 1681-1684.
Posnett, J. (1999). Is bigger better? Concentration in the provision of secondary care. BMJ : British Medical Journal, 319(7216), 1063-1065. Retrieved from http://www.ncbi.nlm.nih.gov/pmc/articles/PMC1116851/
Renn, S. C., Schramm, C. J., Watt, J. M., & Derzon, R. A. (1985). The effects of ownership and system affiliation on the economic performance of hospitals. Inquiry, 219-236.
Richards, R. M. (1976). Analysts' performance and the accuracy of corporate earnings forecasts. The Journal of Business, 49(3), 350-357.

84
Roberts, J. (1990). Strategy and accounting in a UK conglomerate. Accounting, Organizations and Society, 15(1), 107-126.
Rockness, H. O. (1977). Expectancy theory in a budgetary setting: An experimental examination. Accounting Review, 893-903.
Rodgers, R., & Hunter, J. E. (1991). Impact of management by objectives on organizational productivity. Journal of Applied Psychology, 76(2), 322.
Ronen, J., & Livingstone, J. (1975). An expectancy theory approach to the motivational impacts of budgets. Accounting Review, 671-685.
Rotter, J. B., Liverant, S., & Crowne, D. P. (1961). The growth and extinction of expectancies in chance controlled and skilled tasks. The Journal of Psychology, 52(1), 161-177.
Sayles, L. R., & Chandler, M. K. (1971). Managing large systems: Organizations for the future. New York: Transaction Publishers. The Free Press.
Schiff, M., & Lewin, A. Y. (1970). The impact of people on budgets. Accounting Review, 259-268.
Schmidt, J. A. (1992). Is it time to replace traditional budgeting? Journal of Accountancy, 174, 103-103.
Sear, A. M. (1991). Comparison of efficiency and profitability of investor-owned multihospital systems with not-for-profit hospitals. Health Care Management Review, 16(2), 31-37.
Shields, J. F., & Shields, M. D. (1998). Antecedents of participative budgeting. Accounting, Organizations and Society, 23(1), 49-76.
Simon, H. A. (1954). Centralization vs. decentralization in organizing the controller's department: A research study and report. New York: Controllership Foundation.
Simons, R. (1987). Accounting control systems and business strategy: An empirical analysis. Accounting, Organizations and Society, 12(4), 357-374.

85
Simons, R. (1990). The role of management control systems in creating competitive advantage: New perspectives. Accounting, Organizations and Society, 15(1/2), 127-143.
Simons, R. (1991). Strategic orientation and top management attention to control systems. Strategic Management Journal, 12(1), 49-62.
Simons, R. (1994). How new top managers use control systems as levers of strategic renewal. Strategic Management Journal, 15(3), 169-189.
Simons, R. (2013). Levers of control: How managers use innovative control systems to drive strategic renewal. Cambridge, MA: Harvard Business Press.
Sinha, P., Brown, L. D., & Das, S. (1997). A Re-Examination of Financial Analysts' Differential Earnings Forecast Accuracy*. Contemporary Accounting Research, 14(1), 1-42. doi:10.1111/j.1911-3846.1997.tb00518.x
Sisko, A., Truffer, C., Smith, S., Keehan, S., Cylus, J., Poisal, J. A., . . . Lizonitz, J. (2009). Health spending projections through 2018: recession effects add uncertainty to the outlook. Health Affairs, 28(2), w346-w357.
Sivabalan, P., Booth, P., Malmi, T., & Brown, D. A. (2009). An exploratory study of operational reasons to budget. Accounting & Finance, 49(4), 849-871.
Sloan, F. A., Picone, G. A., Taylor, D. H., & Chou, S.-Y. (2001). Hospital ownership and cost and quality of care: Is there a dime’s worth of difference? Journal of Health Economics, 20(1), 1-21.
Sloan, F. A., & Vraciu, R. A. (1983). Investor-owned and not-for-profit hospitals: Addressing some issues. Health Affairs, 2(1), 25-37.
Smith, K. G., & Hitt, M. A. (2005). Great minds in management: The process of theory development. Oxford: Oxford University Press.
Smith, M., Saunders, R., Stuckhardt, L., & McGinnis, J. M. (2013). Best care at lower cost: The path to continuously learning health care in America. Washington, DC: National Academies Press.

86
Standard & Poor's. (2013). U.S. not-for-profit health care system ratios: Operating performance weakened in 2013. Retrieved from New York: www.standardandpoors.com/ratingsdirect
Stedry, A. C. (1959). Budget control and cost behavior. Upper Saddle River, NJ: Prentice-Hall.
Stedry, A. C., & Kay, E. (1966). The effects of goal difficulty on performance: A field experiment. Behavioral Science, 11(6), 459-470.
Steingart, D., & Smith, K. (2014). Moody's: US not-for-profit hospital outlook remains negative for 2014; revenue growth to decline. Retrieved from Moody's Investors Service: www.moodys.com
Stickel, S. E. (1992). Reputation and performance among security analysts. The Journal of Finance, 47(5), 1811-1836.
Stiefel, M., & Nolan, K. (2012). A guide to measuring the Triple Aim: Population health, experience of care, and per capita cost. Retrieved from Cambridge, Massachusetts: www.IHI.org
Sutcliffe, J. (1956). Judgement of random events as a function of belief in control. Australian Journal of Psychology, 8(2), 128-139.
Swieringa, R. J., & Moncur, R. H. (1975). Some effects of participative budgeting on managerial behavior. New York: National Association of Accountants.
Tennyson, D. H., & Fottler, M. D. (2000). Does system membership enhance financial performance in hospitals? Medical Care Research and Review, 57(1), 29-50.
Truffer, C. J., Keehan, S., Smith, S., Cylus, J., Sisko, A., Poisal, J. A., . . . Clemens, M. K. (2010). Health Spending Projections Through 2019: The Recession's Impact Continues. Health Affairs, 29(3), 522.
Tukey, J. W. (1977). Exploratory data analysis. Reading, MA: Addison-Wesley.
Umapathy, S. (1987). Current budgeting practices in U.S. industry: The state of the art. New York, NY: Quorum Books.

87
Van der Stede, W. A. (2001). Measuring ‘tight budgetary control’. Management Accounting Research, 12(1), 119-137.
Vroom, V. H. (1964). Work and motivation. New York: John Wiley & Sons, Inc.
Vroom, V. H., & Maier, N. R. F. (1961). Industrial social psychology. Annual Review of Psychology, 12(1), 413-446.
Waller, W. S. (1988). Slack in participative budgeting: The joint effect of a truth-inducing pay scheme and risk preferences. Accounting, Organizations and society, 13(1), 87-98.
Waller, W. S. (1994). Discussion of “Motivating truthful subordinate reporting: An experimental investigation in a two‐subordinate context”. Contemporary Accounting Research, 10(2), 721-734.
Washington State Department of Health. (1990). Washington State Department of Health Accounting and Reporting Manual for Hospitals. Retrieved from www.doh.wa.gov/DataandStatisticalReports
Weitzman, M. L. (1976). The new Soviet incentive model. The Bell Journal of Economics, 251-257.
Welsch, G. A. (1976). Budgeting: profit planning and control. Upper Saddle River, NJ: Prentice Hall.
Wentzel, K. (2002). The influence of fairness perceptions and goal commitment on managers' performance in a budget setting. Behavioral Research in Accounting, 14(1), 247-271.
Whetsell, G. W. (1999). The history and evolution of hospital payment systems: How did we get here? Nursing Administration Quarterly, 23(4), 1-15.
Wiener, N. (1948). Cybernetics: Control and communication in the animal and the machine. Cambridge, MA: The MIT press.

88
Young, S. M., & Lewis, B. (1995). Experimental incentive-contracting research in management accounting. Judgment and Decision-making Research in Accounting and Auditing, 55-75.
Younis, M. (2012). A comparison study of urban and small rural hospitals financial and economic performance. Online Journal of Rural Nursing and Health Care, 3(1), 38-48.
Younis, M., Rice, J., & Barkoulas, J. (2001). An empirical investigation of hospital profitability in the post-PPS era. Journal of Health Care Finance, 28(2), 65.
Younis, M., Younies, H., & Okojie, F. (2006). Hospital financial performance in the United States of America: A follow-up study. Eastern Mediterranean Health Journal, 12(5), 670-678.
Zimmerman, J. L., & Yahya-Zadeh, M. (2011). Accounting for decision making and control. Issues in Accounting Education, 26(1), 258-259.
Zuckerman, S., Hadley, J., & Iezzoni, L. (1994). Measuring hospital efficiency with frontier cost functions. Journal of Health Economics, 13(3), 255-280.

89
APPENDIX A
HOSPITALS AND HOSPITAL CHARACTERISTICS

90
TotalLicen Licensed Hosp Syst Bed Urb or
# Hospital Name Beds Owna Memb Sizec Rurald
1 1 SWEDISH HEALTH SERVICES 860 1 1 1 1
2 3 SWEDISH MEDICAL CENTER CHERRY HILL 385 1 1 1 1
3 8 KLICKITAT VALLEY HEALTH 25 3 2 4 2
4 10 VIRGINIA MASON MEDICAL CENTER 371 1 1 1 1
5 14 SEATTLE CHILDRENS HOSPITAL 323 1 1 1 1
6 20 GROUP HEALTH CENTRAL 326 1 2 1 1
7 21 NEWPORT HOSPITAL & HEALTH SERVICES 74 3 2 3 2
8 22 LOURDES MEDICAL CENTER 95 1 1 3 1
9 23 THREE RIVERS HOSPITAL 43 3 2 3 2
10 26 PEACEHEALTH SAINT JOHN MEDICAL CENTER 346 1 2 1 1
11 27 PROVIDENCE GENERAL MEDICAL CTR - PACIFIC27 218 1 1 2 1
12 29 HARBORVIEW MEDICAL CENTER29 413 3 1 1 1
13 32 SAINT JOSEPH MEDICAL CENTER 366 1 1 1 1
14 35 SAINT ELIZABETH HOSPITAL 38 1 1 3 1
15 36 BALLARD COMMUNITY HOSPITAL36 163 1 2 2 1
16 37 DEACONESS HOSPITAL 388 2 1 1 1
17 38 OLYMPIC MEDICAL CENTER 126 3 2 2 2
18 39 KENNEWICK GENERAL HOSPITAL 111 3 1 2 1
19 43 ADVENTIST HEALTH/WALLA WALLA GEN HOSP 72 1 1 3 2
20 45 COLUMBIA BASIN HOSPITAL 73 3 2 3 2
21 46 PMH MEDICAL CENTER 25 3 2 4 2
22 47 SAINT CABRINI HOSPITAL47 189 1 2 2 1
23 50 PROVIDENCE SAINT MARY MEDICAL CENTER 142 1 1 2 2
24 51 MEDICAL DENTAL BUILDING HOSPITAL51 26 3 2 3 1
25 54 FORKS COMMUNITY HOSPITAL 45 3 2 3 2
26 56 WILLAPA HARBOR HOSPITAL 26 3 2 3 2
27 58 YAKIMA VALLEY MEMORIAL HOSPITAL 226 1 2 2 1
28 59 NORTHGATE GENERAL HOSPITAL59 87 1 2 3 1
29 63 GRAYS HARBOR COMMUNITY HOSPITAL 140 1 2 2 2
30 73 AFFILIATED HEALTH SERVICES73 234 3 1 2 2
#Entry

91
TotalLicen Licensed Hosp Syst Bed Urb or
# Hospital Name Beds Owna Memb Sizec Rurald
31 78 SAMARITAN HOSPITAL 50 3 2 3 2
32 79 OCEAN BEACH HOSPITAL 25 3 2 4 2
33 80 ODESSA MEMORIAL HOSPITAL 25 3 2 4 2
34 81 MULTICARE GOOD SAMARITAN HOSPITAL 286 1 1 2 1
35 82 GARFIELD COUNTY MEMORIAL HOSPITAL 45 3 2 3 2
36 84 PROVIDENCE REGIONAL MEDICAL CTR EVERETT 491 1 1 1 1
37 85 JEFFERSON HEALTHCARE 25 3 2 4 2
38 92 COMMUNITY HOSPITAL92 30 3 2 3 1
39 96 SKYLINE HOSPITAL 32 3 2 3 2
40 102 YAKIMA REGIONAL MED AND CARDIAC CTR102 214 2 1 2 1
41 104 VALLEY GENERAL HOSPITAL 112 3 2 2 1
42 106 CASCADE VALLEY HOSPITAL 48 3 2 3 2
43 107 NORTH VALLEY HOSPITAL 27 3 2 3 2
44 108 TRI-STATE MEMORIAL HOSPITAL108 61 1 2 3 1
45 111 EAST ADAMS RURAL HOSPITAL 20 3 2 4 2
46 125 OTHELLO COMMUNITY HOSPITAL 42 3 2 3 2
47 126 HIGHLINE MEDICAL CENTER 269 1 1 2 1
48 127 MOUNT LINTON HOSPITAL127 19 3 2 4 2
49 128 UNIVERSITY OF WASHINGTON MEDICAL CENTER 450 3 1 1 1
50 129 QUINCY VALLEY MEDICAL CENTER 25 3 2 4 2
51 130 UWMC NORTHWEST HOSPITAL 281 1 1 2 1
52 131 OVERLAKE HOSPITAL MEDICAL CENTER 337 1 2 1 1
53 132 SAINT CLARE HOSPITAL 106 1 1 2 1
54 134 ISLAND HOSPITAL 43 3 2 3 2
55 137 LINCOLN HOSPITAL 60 3 2 3 2
56 138 SWEDISH EDMONDS 217 1 1 2 1
57 139 PROVIDENCE HOLY FAMILY HOSPITAL 272 1 1 2 1
58 140 KITTITAS VALLEY HEALTHCARE 50 3 2 3 2
59 141 DAYTON GENERAL HOSPITAL 62 3 2 3 2
60 142 HARRISON MEDICAL CENTER 297 1 2 2 1
61 143 UNITED GENERAL HOSPITAL143 97 1 2 3 1
62 145 PEACEHEALTH SAINT JOSEPH HOSPITAL 253 1 1 2 1
63 146 ALLENMORE COMMUNITY HOSPITAL146 130 2 1 2 1
64 147 MID VALLEY HOSPITAL 44 3 2 3 2
65 148 KINDRED HOSPITAL - SEATTLE 80 2 1 3 1
66 150 COULEE COMMUNITY HOSPITAL 25 3 2 4 2
67 151 MONTICELLO MEDICAL CENTER151 122 3 2 2 2
Entry#

92
TotalLicen Licensed Hosp Syst Bed Urb or
# Hospital Name Beds Owna Memb Sizec Rurald
68 152 MASON GENERAL HOSPITAL 68 3 2 3 2
69 153 WHITMAN HOSPITAL AND MEDICAL CENTER 48 3 2 3 2
70 155 UW MEDICINE/VALLEY MEDICAL CENTER 303 3 2 1 1
71 156 WHIDBEY GENERAL HOSPITAL 25 3 1 4 2
72 157 SAINT LUKES REHABILIATION INSTITUTE157 102 1 1 2 1
73 158 CASCADE MEDICAL CENTER 12 3 2 4 2
74 159 PROVIDENCE SAINT PETER HOSPITAL 390 1 1 1 1
75 161 KADLEC REGIONAL MEDICAL CENTER 270 1 2 2 1
76 162 PROVIDENCE SACRED HEART MEDICAL CENTER 644 1 1 1 1
77 164 EVERGREENHEALTH MEDICAL CENTER 333 3 2 1 1
78 165 LAKE CHELAN COMMUNITY HOSPITAL 35 3 2 3 2
79 167 FERRY COUNTY MEMORIAL HOSPITAL 25 3 2 4 2
80 168 CENTRAL WASHINGTON HOSPITAL 206 1 1 2 1
81 169 GROUP HEALTH EASTSIDE 179 1 2 2 1
82 170 PEACEHEALTH SOUTHWEST MEDICAL CENTER 450 1 1 1 1
83 172 PULLMAN REGIONAL HOSPITAL 42 3 2 3 2
84 173 MORTON GENERAL HOSPITAL 25 3 2 4 2
85 175 MARY BRIDGE CHILDRENS HEALTH CENTER 82 1 1 3 1
86 176 TACOMA GENERAL ALLENMORE HOSPITAL176 567 1 1 1 1
87 178 DEER PARK HOSPITAL178 25 1 2 4 2
88 180 VALLEY HOSPITAL-SPOKANE 123 2 1 2 1
89 181 PACIFIC MEDICAL CENTER181 152 2 2 2 1
90 183 MULTICARE AUBURN MEDICAL CENTER 195 1 1 2 1
91 184 CENTRALIA GENERAL HOSPITAL184 87 1 2 3 2
92 185 RIVERTON GENERAL HOSPITAL 142 1 2 2 1
93 186 SUMMIT PACIFIC MEDICAL CENTER 24 3 2 4 2
94 187 SHOREWOOD OSTEOPATHIC HOSPITAL187 53 1 2 3 1
95 188 SAINT LUKE GENERAL HOSPITAL188 117 1 2 2 1
96 189 WEST SEATTLE COMMUNITY HOSPITAL189 198 1 2 2 1
97 191 PROVIDENCE CENTRALIA HOSPITAL 128 1 1 2 2
98 192 SAINT JOSEPH HOSPITAL192 163 3 2 2 2
99 193 PROVIDENCE MOUNT CARMEL HOSPITAL 55 1 1 3 2
100 194 PROVIDENCE SAINT JOSEPHS HOSPITAL 65 1 1 3 2
101 195 SNOQUALMIE VALLEY HOSPITAL 25 3 2 4 2
102 197 CAPITAL MEDICAL CENTER 110 2 2 2 1
103 198 SUNNYSIDE COMMUNITY HOSPITAL 38 1 2 3 2
104 199 TOPPENISH COMMUNITY HOSPITAL 63 2 1 3 2
Entry#

93
TotalLicen Licensed Hosp Syst Bed Urb or
# Hospital Name Beds Owna Memb Sizec Rurald
105 200 CASCADE OAKS 10 2 2 4 1
106 201 SAINT FRANCIS COMMUNITY HOSPITAL 124 1 1 2 1
107 202 REGIONAL HOSPITAL 31 1 1 3 1
108 204 SEATTLE CANCER CARE ALLIANCE 20 1 2 4 1
109 205 WENATCHEE VALLEY HOSPITAL 20 1 1 4 1
110 206 PEACEHEALTH UNITED GENERAL MEDICAL CTR 97 3 2 3 1
111 207 SKAGIT VALLEY HOSPITAL 137 3 2 2 1
112 208 LEGACY SALMON CREEK HOSPITAL 220 1 2 2 1
113 209 SAINT ANTHONY HOSPITAL 80 1 2 3 2
114 210 SWEDISH MEDICAL CENTER ISSAQUAH 80 1 1 3 1
115 211 PEACEHEALTH PEACE ISLAND MEDICAL CENTER 10 1 2 4 2
a Hospital Ownership: 1 = Non-Profit, 2 = For Profit, 3 = State, 4 = District, 5 = County b System Membership: 1 = System, 2 = Stand Alonec Bed Size: 1 = >300, 2 = 300-, 3 = 100-26, 4 = ≤25 d Urban or Rural: 1 = Urban, 2 = Rural
27 MERGED 1995 with Providence Regional Medical Center Everett29 MANAGED UWMC36 MERGED 1992 with Swedish Health Services47 CLOSED 199051 CLOSED 198959 MERGED 198673 DEAFFILIATION 200392 CLOSED 1992
102 PURCHASED 2003108 CLOSED 2009, NAME CHANGE 1994 (LIN# 178)127 CLOSED 1988143 MERGED 1991 with Skagit Valley Hospital146 MERGED 1998 with Tacoma General Allenmore Hospital151 MERGED 1987 with PeaceHealth Saint John Medical Center157 MERGED 1993 with Deaconess Hospital176 MERGED 1998 with Allenmore Community Hospital178 CLOSED 2009181 CLOSED 1987184 MERGED 1988 with St Helen Hospital to form Providence Hospital-Centralia187 CLOSED 1987
Entry#

94
188 MERGED 1989 with St Joseph-Bellingham189 CLOSED 1990192 MERGED 1988 with Grays Harbor Community Hospital

95
APPENDIX B
QUARTILE AND BOUNDARY STATISTICS (DATASET)

96
Boundary Multiplier = 2.20
Inter- N = 2464 Quartile quartile Lower Upper Variables Valid Missing Outliers Lower Upper Range Bound Bound Year 2464 0 0 License # 2464 0 0 Dependent Variable Operating Margin (Actual) 2321 75 68 0.307 7.828 7.521 -16.240 24.375
Independent Variables (Variances) Inpatient Revenue 1984 399 81 -0.061 0.070 0.130 -0.347 0.356 Outpatient Revenue 1929 454 81 -0.012 0.131 0.143 -0.327 0.445 Total Patient Services Revenue 1995 398 71 -0.023 0.078 0.101 -0.245 0.300 Contractual Adjustments 1670 666 128 -0.068 0.152 0.221 -0.554 0.638 Charity & Uncompensated Care 1651 741 72 -0.226 0.338 0.564 -1.466 1.578 Other Adjustments & Allowances 901 1460 103 -0.413 0.960 1.373 -3.434 3.982 Total Deductions from Revenue 1691 662 111 -0.055 0.139 0.194 -0.481 0.566 Net Patient Services Revenue 1992 397 75 -0.055 0.059 0.113 -0.304 0.308 Other Operating Revenue (Recovery) 1625 682 157 -0.095 0.316 0.412 -1.002 1.223 Tax Revenue 571 1812 81 -0.009 0.179 0.189 -0.425 0.595 Total Operating Revenue 1998 397 69 -0.046 0.064 0.110 -0.289 0.307 Salaries 1716 632 116 -0.045 0.002 0.046 -0.147 0.104 Employee Benefits 1768 636 60 -0.039 0.036 0.076 -0.205 0.203 Salaries & Benefits 1721 636 107 -0.039 0.004 0.044 -0.135 0.100 Supplies 1768 634 62 -0.072 0.015 0.087 -0.263 0.207 Professional Fees 1641 687 136 -0.162 0.000 0.162 -0.518 0.356 Purchased Services (Utilities) 1692 671 101 -0.037 0.052 0.089 -0.232 0.248 Purchased Services (Others) 1645 659 160 -0.172 0.000 0.172 -0.550 0.378 Depreciation 1842 524 98 -0.025 0.063 0.089 -0.221 0.259 Rental/Lease 1659 685 120 -0.106 0.090 0.196 -0.537 0.521 Insurance 1644 713 107 -0.028 0.123 0.151 -0.359 0.455 Licenses & Taxes 1296 997 171 -0.103 0.014 0.117 -0.361 0.272 Interest 1434 827 203 -0.009 0.061 0.069 -0.161 0.213 Other Direct Expenses 1707 660 97 -0.128 0.176 0.303 -0.795 0.843 Other Expenses (Total) 1793 392 279 -0.126 0.003 0.129 -0.411 0.288 Provision for Bad Debts 1686 698 80 -0.175 0.084 0.259 -0.745 0.653 Total Operating Expense 1771 392 301 -0.075 0.000 0.075 -0.241 0.166 Net Operating Income 1786 449 229 -0.988 0.605 1.592 -4.490 4.107 Non-Operating Revenue Net Expenses 1314 979 171 -0.326 0.906 1.232 -3.037 3.617 Net Revenue Before Extraordinary Items 1820 448 196 -0.944 0.531 1.475 -4.188 3.775
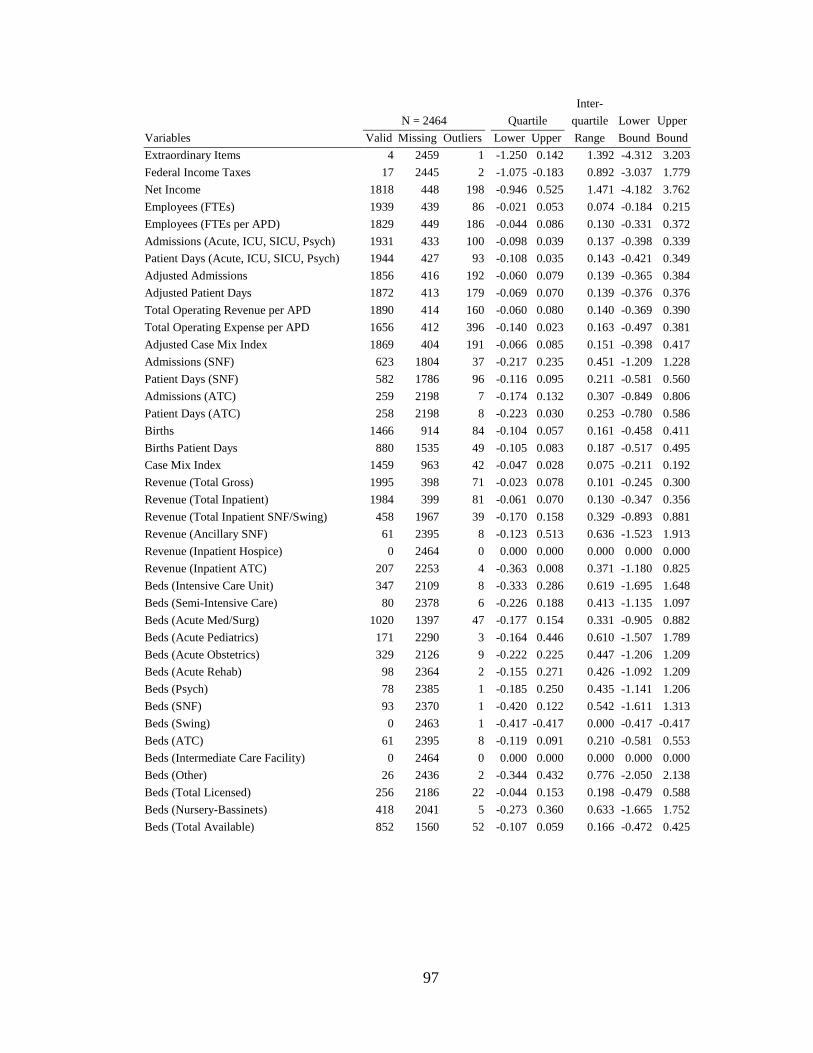
97
Inter- N = 2464 Quartile quartile Lower Upper Variables Valid Missing Outliers Lower Upper Range Bound Bound Extraordinary Items 4 2459 1 -1.250 0.142 1.392 -4.312 3.203 Federal Income Taxes 17 2445 2 -1.075 -0.183 0.892 -3.037 1.779 Net Income 1818 448 198 -0.946 0.525 1.471 -4.182 3.762 Employees (FTEs) 1939 439 86 -0.021 0.053 0.074 -0.184 0.215 Employees (FTEs per APD) 1829 449 186 -0.044 0.086 0.130 -0.331 0.372 Admissions (Acute, ICU, SICU, Psych) 1931 433 100 -0.098 0.039 0.137 -0.398 0.339 Patient Days (Acute, ICU, SICU, Psych) 1944 427 93 -0.108 0.035 0.143 -0.421 0.349 Adjusted Admissions 1856 416 192 -0.060 0.079 0.139 -0.365 0.384 Adjusted Patient Days 1872 413 179 -0.069 0.070 0.139 -0.376 0.376 Total Operating Revenue per APD 1890 414 160 -0.060 0.080 0.140 -0.369 0.390 Total Operating Expense per APD 1656 412 396 -0.140 0.023 0.163 -0.497 0.381 Adjusted Case Mix Index 1869 404 191 -0.066 0.085 0.151 -0.398 0.417 Admissions (SNF) 623 1804 37 -0.217 0.235 0.451 -1.209 1.228 Patient Days (SNF) 582 1786 96 -0.116 0.095 0.211 -0.581 0.560 Admissions (ATC) 259 2198 7 -0.174 0.132 0.307 -0.849 0.806 Patient Days (ATC) 258 2198 8 -0.223 0.030 0.253 -0.780 0.586 Births 1466 914 84 -0.104 0.057 0.161 -0.458 0.411 Births Patient Days 880 1535 49 -0.105 0.083 0.187 -0.517 0.495 Case Mix Index 1459 963 42 -0.047 0.028 0.075 -0.211 0.192 Revenue (Total Gross) 1995 398 71 -0.023 0.078 0.101 -0.245 0.300 Revenue (Total Inpatient) 1984 399 81 -0.061 0.070 0.130 -0.347 0.356 Revenue (Total Inpatient SNF/Swing) 458 1967 39 -0.170 0.158 0.329 -0.893 0.881 Revenue (Ancillary SNF) 61 2395 8 -0.123 0.513 0.636 -1.523 1.913 Revenue (Inpatient Hospice) 0 2464 0 0.000 0.000 0.000 0.000 0.000 Revenue (Inpatient ATC) 207 2253 4 -0.363 0.008 0.371 -1.180 0.825 Beds (Intensive Care Unit) 347 2109 8 -0.333 0.286 0.619 -1.695 1.648 Beds (Semi-Intensive Care) 80 2378 6 -0.226 0.188 0.413 -1.135 1.097 Beds (Acute Med/Surg) 1020 1397 47 -0.177 0.154 0.331 -0.905 0.882 Beds (Acute Pediatrics) 171 2290 3 -0.164 0.446 0.610 -1.507 1.789 Beds (Acute Obstetrics) 329 2126 9 -0.222 0.225 0.447 -1.206 1.209 Beds (Acute Rehab) 98 2364 2 -0.155 0.271 0.426 -1.092 1.209 Beds (Psych) 78 2385 1 -0.185 0.250 0.435 -1.141 1.206 Beds (SNF) 93 2370 1 -0.420 0.122 0.542 -1.611 1.313 Beds (Swing) 0 2463 1 -0.417 -0.417 0.000 -0.417 -0.417 Beds (ATC) 61 2395 8 -0.119 0.091 0.210 -0.581 0.553 Beds (Intermediate Care Facility) 0 2464 0 0.000 0.000 0.000 0.000 0.000 Beds (Other) 26 2436 2 -0.344 0.432 0.776 -2.050 2.138 Beds (Total Licensed) 256 2186 22 -0.044 0.153 0.198 -0.479 0.588 Beds (Nursery-Bassinets) 418 2041 5 -0.273 0.360 0.633 -1.665 1.752 Beds (Total Available) 852 1560 52 -0.107 0.059 0.166 -0.472 0.425

98
APPENDIX C
DESCRIPTIVE STATISTICS (DATASET)

99
N = 2464 Missing Standard
Variables Valid (inc. O li )
Mean Median Deviation Min Max Year 2464 0 1987 2013 License # 2464 0 1 211
Dependent Variable Operating Margin (Actual) 2321 143 4.164 4.259 6.323 -16.448 24.591
Independent Variables (V i ) Inpatient Revenue 1984 480 0.001 0.003 0.108 -0.344 0.347 Outpatient Revenue 1929 535 0.057 0.049 0.117 -0.321 0.448 Total Patient Services Revenue 1995 469 0.027 0.024 0.082 -0.245 0.301 Contractual Adjustments 1670 794 0.032 0.023 0.193 -0.560 0.642 Charity & Uncompensated Care 1651 813 0.045 -0.017 0.452 -0.992 1.527 Other Adjustments & Allowances 901 1563 0.000 0.000 0.000 0.000 0.000 Total Deductions from Revenue 1691 773 0.035 0.026 0.167 -0.473 0.562 Net Patient Services Revenue 1992 472 -0.001 0.009 0.101 -0.310 0.313 Other Operating Revenue (R )
1625 839 0.055 0.054 0.376 -0.990 1.229 Tax Revenue 571 1893 0.000 0.000 0.000 0.000 0.000 Total Operating Revenue 1998 466 0.006 0.014 0.097 -0.299 0.312 Salaries 1716 748 -0.017 -0.018 0.059 -0.178 0.214 Employee Benefits 1768 696 -0.001 0.001 0.104 -0.346 0.346 Salaries & Benefits 1721 743 -0.014 -0.015 0.058 -0.178 0.205 Supplies 1768 696 -0.024 -0.025 0.112 -0.350 0.388 Professional Fees 1641 823 -0.053 -0.058 0.260 -0.715 0.915 Purchased Services (Utilities) 1692 772 0.004 0.010 0.131 -0.438 0.429 Purchased Services (Others) 1645 819 -0.071 -0.061 0.220 -0.653 0.797 Depreciation 1842 622 0.022 0.020 0.117 -0.390 0.355 Rental/Lease 1659 805 0.043 0.016 0.393 -1.054 1.096 Insurance 1644 820 0.041 0.055 0.257 -0.832 0.744 Licenses & Taxes 1296 1168 -0.029 -0.009 0.388 -1.195 1.357 Interest 1434 1030 0.029 0.013 0.194 -0.646 0.580 Other Direct Expenses 1707 757 0.027 0.049 0.444 -1.469 1.316 Other Expenses (Total) 1793 671 -0.037 -0.033 0.120 -0.399 0.488 Provision for Bad Debts 1686 778 -0.054 -0.014 0.389 -1.245 1.372 Total Operating Expense 1771 693 -0.023 -0.024 0.063 -0.217 0.295 Net Operating Income 1786 678 -0.190 -0.196 1.334 -4.424 4.089 Non-Operating Revenue Net E
1314 1150 0.220 0.125 1.032 -3.057 3.624 Net Revenue Before Extraordinary I
1820 644 -0.154 -0.134 1.179 -4.228 3.789 Extraordinary Items 4 2460 0.000 0.000 0.000 0.000 0.000 Federal Income Taxes 17 2447 0.000 0.000 0.000 0.000 0.000
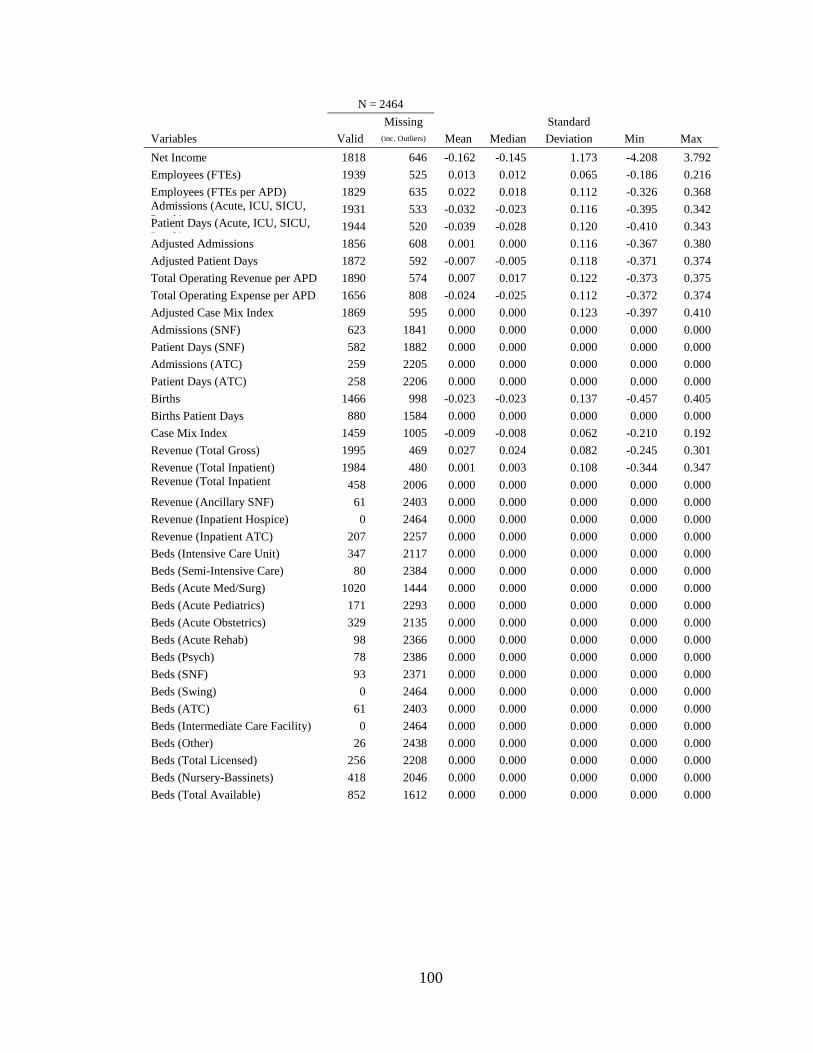
100
N = 2464 Missing Standard
Variables Valid (inc. Outliers) Mean Median Deviation Min Max Net Income 1818 646 -0.162 -0.145 1.173 -4.208 3.792 Employees (FTEs) 1939 525 0.013 0.012 0.065 -0.186 0.216 Employees (FTEs per APD) 1829 635 0.022 0.018 0.112 -0.326 0.368 Admissions (Acute, ICU, SICU, P h)
1931 533 -0.032 -0.023 0.116 -0.395 0.342 Patient Days (Acute, ICU, SICU, P h)
1944 520 -0.039 -0.028 0.120 -0.410 0.343 Adjusted Admissions 1856 608 0.001 0.000 0.116 -0.367 0.380 Adjusted Patient Days 1872 592 -0.007 -0.005 0.118 -0.371 0.374 Total Operating Revenue per APD 1890 574 0.007 0.017 0.122 -0.373 0.375 Total Operating Expense per APD 1656 808 -0.024 -0.025 0.112 -0.372 0.374 Adjusted Case Mix Index 1869 595 0.000 0.000 0.123 -0.397 0.410 Admissions (SNF) 623 1841 0.000 0.000 0.000 0.000 0.000 Patient Days (SNF) 582 1882 0.000 0.000 0.000 0.000 0.000 Admissions (ATC) 259 2205 0.000 0.000 0.000 0.000 0.000 Patient Days (ATC) 258 2206 0.000 0.000 0.000 0.000 0.000 Births 1466 998 -0.023 -0.023 0.137 -0.457 0.405 Births Patient Days 880 1584 0.000 0.000 0.000 0.000 0.000 Case Mix Index 1459 1005 -0.009 -0.008 0.062 -0.210 0.192 Revenue (Total Gross) 1995 469 0.027 0.024 0.082 -0.245 0.301 Revenue (Total Inpatient) 1984 480 0.001 0.003 0.108 -0.344 0.347 Revenue (Total Inpatient SNF/S i )
458 2006 0.000 0.000 0.000 0.000 0.000 Revenue (Ancillary SNF) 61 2403 0.000 0.000 0.000 0.000 0.000 Revenue (Inpatient Hospice) 0 2464 0.000 0.000 0.000 0.000 0.000 Revenue (Inpatient ATC) 207 2257 0.000 0.000 0.000 0.000 0.000 Beds (Intensive Care Unit) 347 2117 0.000 0.000 0.000 0.000 0.000 Beds (Semi-Intensive Care) 80 2384 0.000 0.000 0.000 0.000 0.000 Beds (Acute Med/Surg) 1020 1444 0.000 0.000 0.000 0.000 0.000 Beds (Acute Pediatrics) 171 2293 0.000 0.000 0.000 0.000 0.000 Beds (Acute Obstetrics) 329 2135 0.000 0.000 0.000 0.000 0.000 Beds (Acute Rehab) 98 2366 0.000 0.000 0.000 0.000 0.000 Beds (Psych) 78 2386 0.000 0.000 0.000 0.000 0.000 Beds (SNF) 93 2371 0.000 0.000 0.000 0.000 0.000 Beds (Swing) 0 2464 0.000 0.000 0.000 0.000 0.000 Beds (ATC) 61 2403 0.000 0.000 0.000 0.000 0.000 Beds (Intermediate Care Facility) 0 2464 0.000 0.000 0.000 0.000 0.000 Beds (Other) 26 2438 0.000 0.000 0.000 0.000 0.000 Beds (Total Licensed) 256 2208 0.000 0.000 0.000 0.000 0.000 Beds (Nursery-Bassinets) 418 2046 0.000 0.000 0.000 0.000 0.000 Beds (Total Available) 852 1612 0.000 0.000 0.000 0.000 0.000

101
APPENDIX D
UNIVERSITY OF ALABAMA AT BIRMINGHAM INSTITUTIONAL REVIEW BOARD LETTER OF APPROVAL

102