Banking Profitability and Performance Management
17
www.pwc.com Banking Profitability and Performance Management
Transcript of Banking Profitability and Performance Management
www.pwc.com
Banking Profitability and Performance Management
Banking Profitability and Performance Management
PwC Page 2 of 17
Table of Contents
Executive Summary 3
Introduction 3
Cross-sectional Analysis of Profitability in Banking using ROA as the Parent Metric 6
Detailed findings and key takeaways 6
ROA based Performance Management 10
PwC‟s Enterprise Performance Management (EPM) Framework 10
Illustrative examples of what implementing Profitability based EPM framework entails 12
Appendix 15
PwC Contacts 17
Banking Profitability and Performance Management
PwC Page 3 of 17
Executive Summary
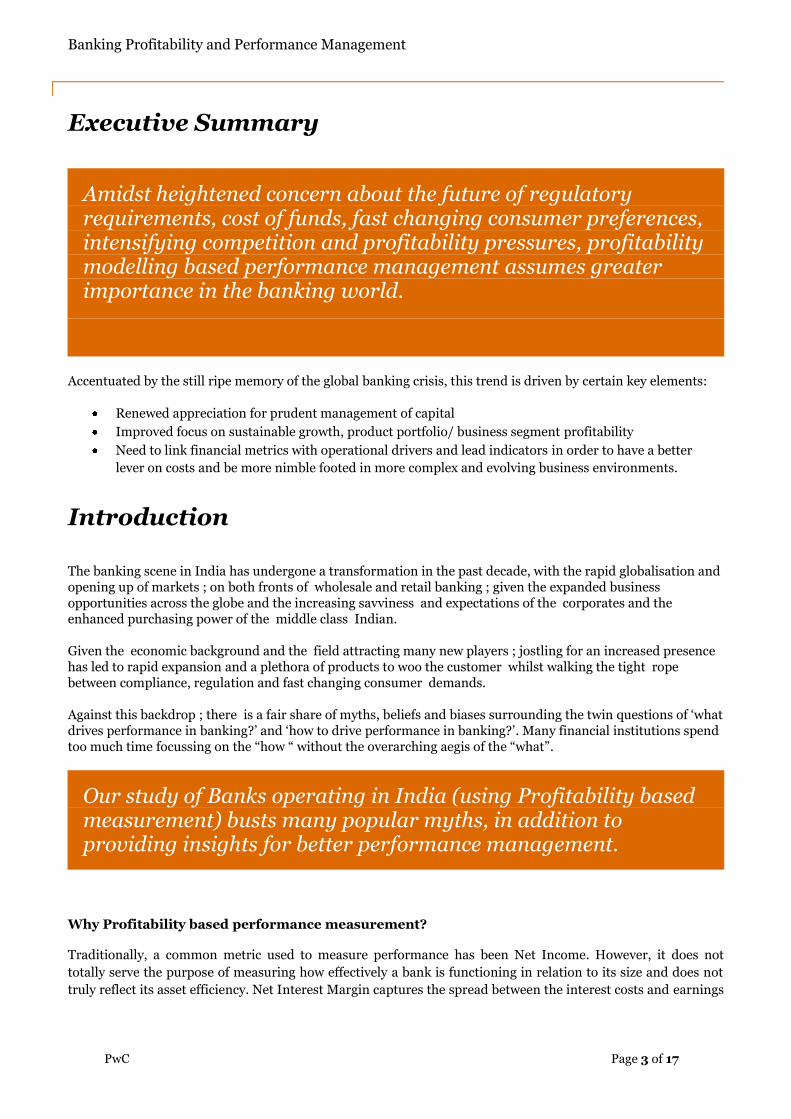
Amidst heightened concern about the future of regulatory requirements, cost of funds, fast changing consumer preferences, intensifying competition and profitability pressures, profitability modelling based performance management assumes greater importance in the banking world.
Accentuated by the still ripe memory of the global banking crisis, this trend is driven by certain key elements:
Renewed appreciation for prudent management of capital
Improved focus on sustainable growth, product portfolio/ business segment profitability
Need to link financial metrics with operational drivers and lead indicators in order to have a better
lever on costs and be more nimble footed in more complex and evolving business environments.
Introduction
The banking scene in India has undergone a transformation in the past decade, with the rapid globalisation and opening up of markets ; on both fronts of wholesale and retail banking ; given the expanded business opportunities across the globe and the increasing savviness and expectations of the corporates and the enhanced purchasing power of the middle class Indian.
Given the economic background and the field attracting many new players ; jostling for an increased presence has led to rapid expansion and a plethora of products to woo the customer whilst walking the tight rope between compliance, regulation and fast changing consumer demands.
Against this backdrop ; there is a fair share of myths, beliefs and biases surrounding the twin questions of „what drives performance in banking?‟ and „how to drive performance in banking?‟. Many financial institutions spend too much time focussing on the “how “ without the overarching aegis of the “what”.
Our study of Banks operating in India (using Profitability based measurement) busts many popular myths, in addition to providing insights for better performance management.
Why Profitability based performance measurement?
Traditionally, a common metric used to measure performance has been Net Income. However, it does not
totally serve the purpose of measuring how effectively a bank is functioning in relation to its size and does not
truly reflect its asset efficiency. Net Interest Margin captures the spread between the interest costs and earnings
Banking Profitability and Performance Management
PwC Page 4 of 17
on bank‟s liabilities and assets and indicates how well the bank manages its assets and liabilities. But it fails to
measure the operational efficiency of a bank.
Profitability based measurement on the other hand can serve as a more robust and inclusive means to measure
the performance by gauging the extent of operational efficiency as well as capturing the nuances of bank‟s
diversifying earnings through non-interest income activities and management of their costs.
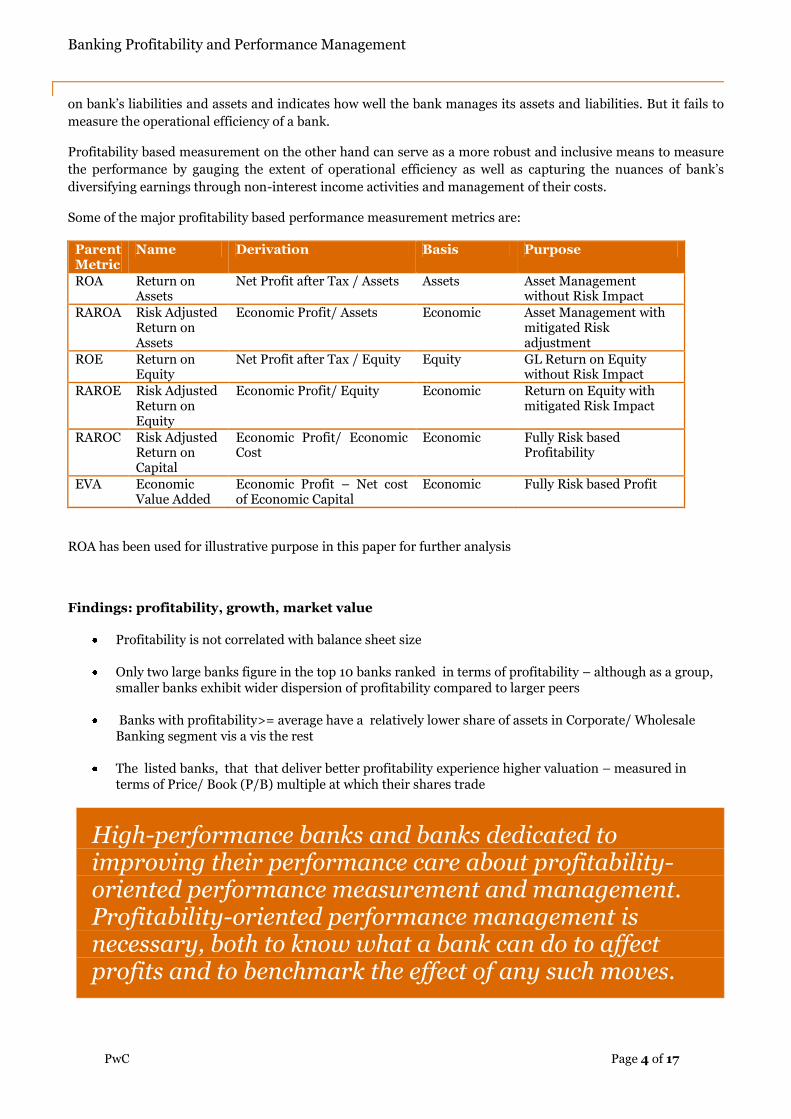
Some of the major profitability based performance measurement metrics are:
Parent Metric
Name Derivation Basis Purpose
ROA Return on Assets
Net Profit after Tax / Assets Assets Asset Management without Risk Impact
RAROA Risk Adjusted Return on Assets
Economic Profit/ Assets Economic Asset Management with mitigated Risk adjustment
ROE Return on Equity
Net Profit after Tax / Equity Equity GL Return on Equity without Risk Impact
RAROE Risk Adjusted Return on Equity
Economic Profit/ Equity Economic Return on Equity with mitigated Risk Impact
RAROC Risk Adjusted Return on Capital
Economic Profit/ Economic Cost
Economic Fully Risk based Profitability
EVA Economic Value Added
Economic Profit – Net cost of Economic Capital
Economic Fully Risk based Profit
ROA has been used for illustrative purpose in this paper for further analysis
Findings: profitability, growth, market value
Profitability is not correlated with balance sheet size
Only two large banks figure in the top 10 banks ranked in terms of profitability – although as a group, smaller banks exhibit wider dispersion of profitability compared to larger peers
Banks with profitability>= average have a relatively lower share of assets in Corporate/ Wholesale Banking segment vis a vis the rest
The listed banks, that that deliver better profitability experience higher valuation – measured in terms of Price/ Book (P/B) multiple at which their shares trade
High-performance banks and banks dedicated to improving their performance care about profitability-oriented performance measurement and management. Profitability-oriented performance management is necessary, both to know what a bank can do to affect profits and to benchmark the effect of any such moves.
Banking Profitability and Performance Management
PwC Page 5 of 17
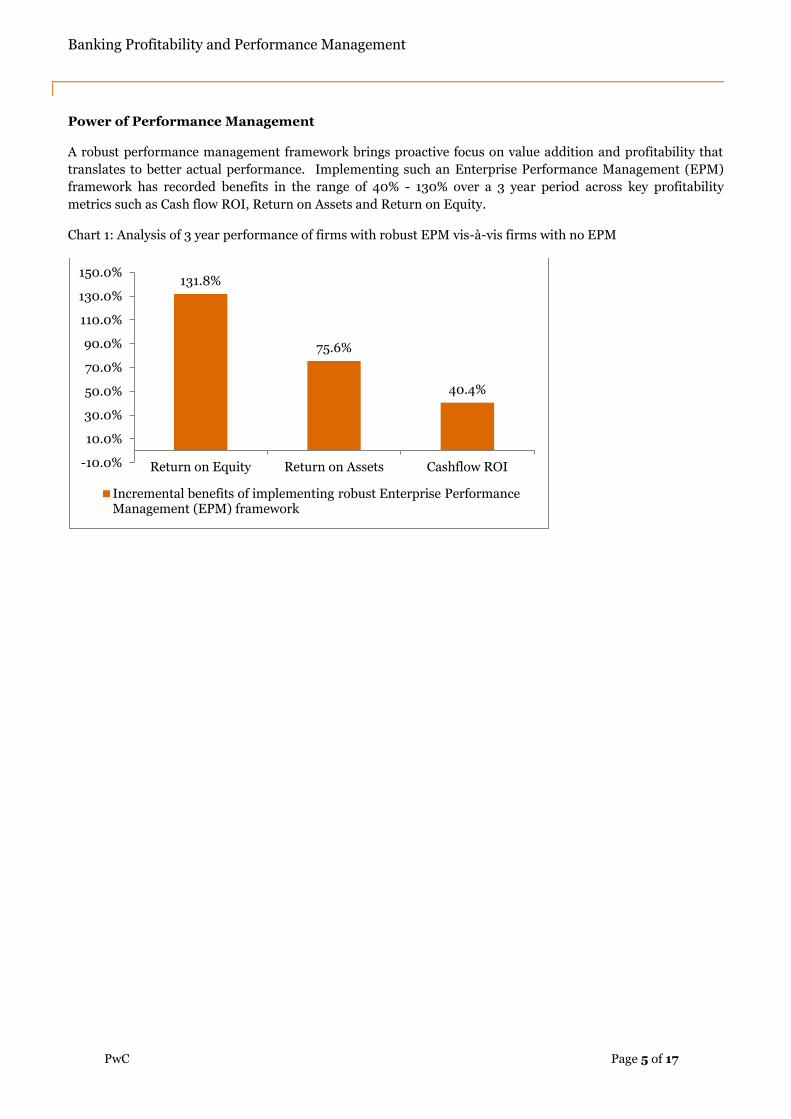
Power of Performance Management
A robust performance management framework brings proactive focus on value addition and profitability that
translates to better actual performance. Implementing such an Enterprise Performance Management (EPM)
framework has recorded benefits in the range of 40% - 130% over a 3 year period across key profitability
metrics such as Cash flow ROI, Return on Assets and Return on Equity.
Chart 1: Analysis of 3 year performance of firms with robust EPM vis-à-vis firms with no EPM
131.8%
75.6%
40.4%
-10.0%
10.0%
30.0%
50.0%
70.0%
90.0%
110.0%
130.0%
150.0%
Return on Equity Return on Assets Cashflow ROI
Incremental benefits of implementing robust Enterprise Performance Management (EPM) framework
Banking Profitability and Performance Management
PwC Page 6 of 17
Cross-sectional Analysis of Profitability in Banking
using ROA1 as the Parent Metric
Detailed findings and key takeaways
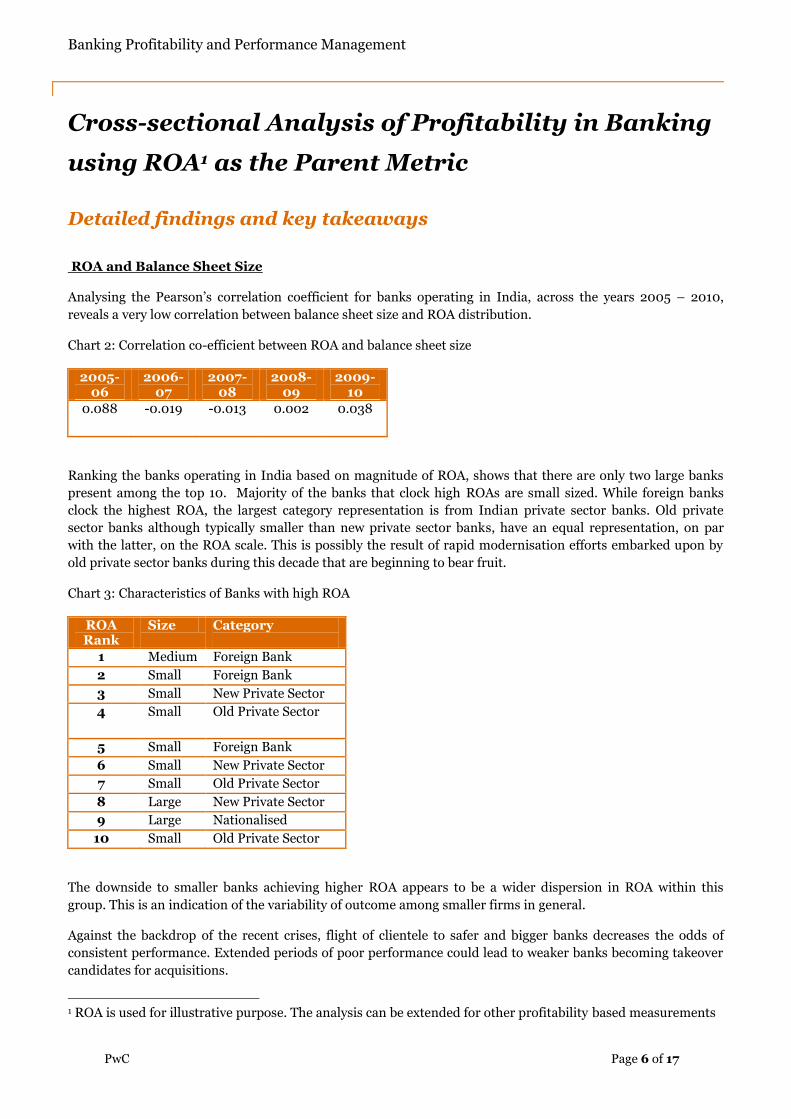
ROA and Balance Sheet Size
Analysing the Pearson‟s correlation coefficient for banks operating in India, across the years 2005 – 2010,
reveals a very low correlation between balance sheet size and ROA distribution.
Chart 2: Correlation co-efficient between ROA and balance sheet size
2005-06
2006-07
2007-08
2008-09
2009-10
0.088 -0.019 -0.013 0.002 0.038
Ranking the banks operating in India based on magnitude of ROA, shows that there are only two large banks
present among the top 10. Majority of the banks that clock high ROAs are small sized. While foreign banks
clock the highest ROA, the largest category representation is from Indian private sector banks. Old private
sector banks although typically smaller than new private sector banks, have an equal representation, on par
with the latter, on the ROA scale. This is possibly the result of rapid modernisation efforts embarked upon by
old private sector banks during this decade that are beginning to bear fruit.
Chart 3: Characteristics of Banks with high ROA
ROA Rank
Size Category
1 Medium Foreign Bank
2 Small Foreign Bank
3 Small New Private Sector
4 Small Old Private Sector
5 Small Foreign Bank
6 Small New Private Sector
7 Small Old Private Sector
8 Large New Private Sector
9 Large Nationalised
10 Small Old Private Sector
The downside to smaller banks achieving higher ROA appears to be a wider dispersion in ROA within this
group. This is an indication of the variability of outcome among smaller firms in general.
Against the backdrop of the recent crises, flight of clientele to safer and bigger banks decreases the odds of
consistent performance. Extended periods of poor performance could lead to weaker banks becoming takeover
candidates for acquisitions.
1 ROA is used for illustrative purpose. The analysis can be extended for other profitability based measurements
Banking Profitability and Performance Management
PwC Page 7 of 17
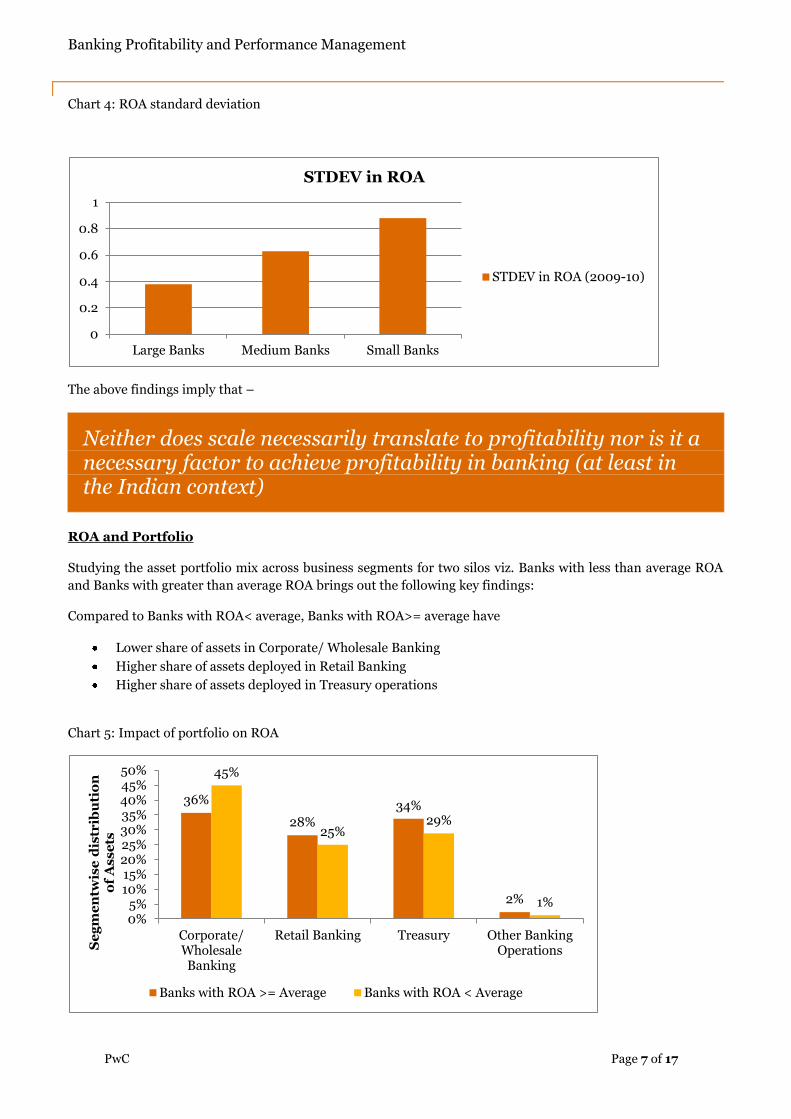
Chart 4: ROA standard deviation
The above findings imply that –
Neither does scale necessarily translate to profitability nor is it a necessary factor to achieve profitability in banking (at least in the Indian context)
ROA and Portfolio
Studying the asset portfolio mix across business segments for two silos viz. Banks with less than average ROA
and Banks with greater than average ROA brings out the following key findings:
Compared to Banks with ROA< average, Banks with ROA>= average have
Lower share of assets in Corporate/ Wholesale Banking
Higher share of assets deployed in Retail Banking
Higher share of assets deployed in Treasury operations
Chart 5: Impact of portfolio on ROA
0
0.2
0.4
0.6
0.8
1
Large Banks Medium Banks Small Banks
STDEV in ROA
STDEV in ROA (2009-10)
36%
28%
34%
2%
45%
25% 29%
1%
0% 5%
10% 15% 20% 25% 30% 35% 40% 45% 50%
Corporate/ Wholesale Banking
Retail Banking Treasury Other Banking Operations S
eg
me
ntw
ise
dis
trib
uti
on
o
f A
ss
ets
Banks with ROA >= Average Banks with ROA < Average
Banking Profitability and Performance Management
PwC Page 8 of 17
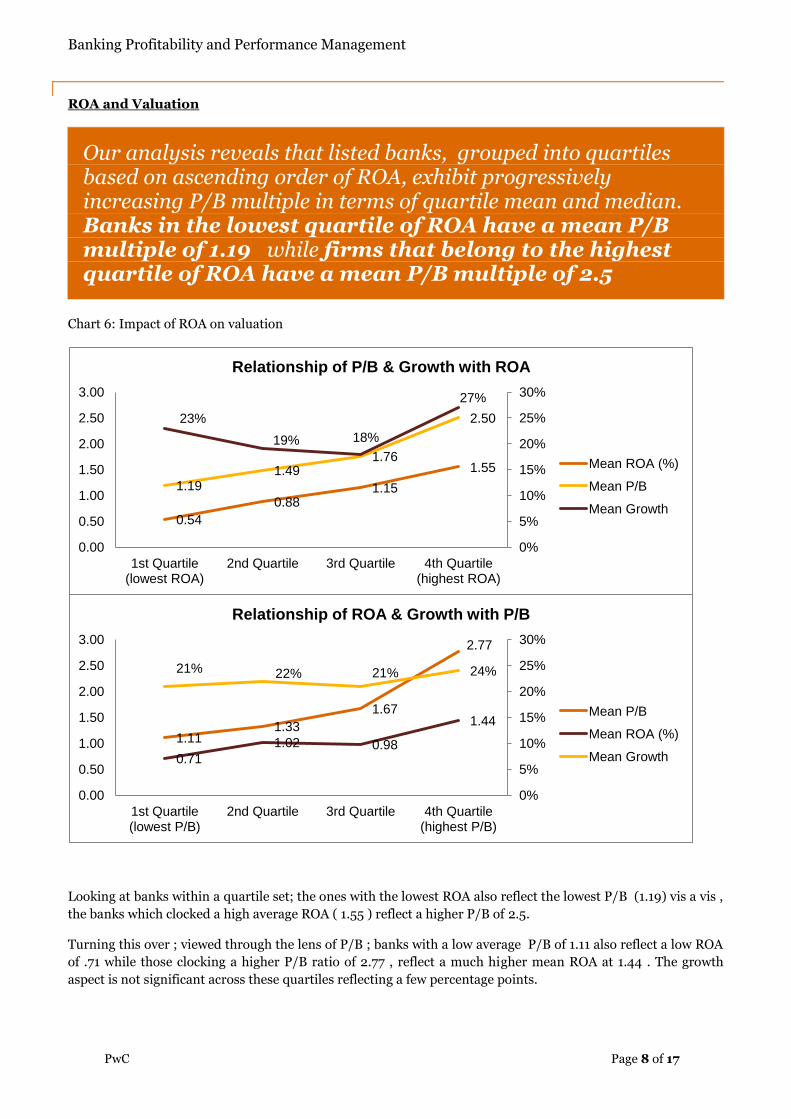
ROA and Valuation
Our analysis reveals that listed banks, grouped into quartiles based on ascending order of ROA, exhibit progressively increasing P/B multiple in terms of quartile mean and median. Banks in the lowest quartile of ROA have a mean P/B multiple of 1.19 while firms that belong to the highest quartile of ROA have a mean P/B multiple of 2.5
Chart 6: Impact of ROA on valuation
Looking at banks within a quartile set; the ones with the lowest ROA also reflect the lowest P/B (1.19) vis a vis ,
the banks which clocked a high average ROA ( 1.55 ) reflect a higher P/B of 2.5.
Turning this over ; viewed through the lens of P/B ; banks with a low average P/B of 1.11 also reflect a low ROA
of .71 while those clocking a higher P/B ratio of 2.77 , reflect a much higher mean ROA at 1.44 . The growth
aspect is not significant across these quartiles reflecting a few percentage points.
0.54
0.88 1.15
1.55
1.19 1.49
1.76
2.50 23%
19% 18%
27%
0%
5%
10%
15%
20%
25%
30%
0.00
0.50
1.00
1.50
2.00
2.50
3.00
1st Quartile (lowest ROA)
2nd Quartile 3rd Quartile 4th Quartile (highest ROA)
Relationship of P/B & Growth with ROA
Mean ROA (%)
Mean P/B
Mean Growth
1.11 1.33
1.67
2.77
0.71
1.02 0.98
1.44
21% 22% 21% 24%
0%
5%
10%
15%
20%
25%
30%
0.00
0.50
1.00
1.50
2.00
2.50
3.00
1st Quartile (lowest P/B)
2nd Quartile 3rd Quartile 4th Quartile (highest P/B)
Relationship of ROA & Growth with P/B
Mean P/B
Mean ROA (%)
Mean Growth
Banking Profitability and Performance Management
PwC Page 9 of 17
The market rewards banks that can raise capital at higher rates of return by valuing their existing equity base at a higher premium compared to peers that compound capital at relatively lower rates of return. The implication of this is lower cost of capital and less dilution of equity for future fund raising initiatives of banks that are superior managers of capital.
The corollary - while the market expects banks to grow, growth for growth‟s sake without a handle on
profitability may in fact be value eroding in terms of market multiple commanded by the bank.
Conclusion
While ROA and market capitalisation appear to be in tandem , what drives ROA appears to be a mixed bag , busting a few myths and highlighting the benefits of managed growth with a keen eye on profitability.
We believe that a keen eye on profitability is a must during the ideation and implementation of both strategic
growth plans and operational plans. This is where Enterprise Performance Management (EPM) is
crucial.
A profitability based performance management framework will translate organisational strategy into
appropriate functional level goals, which can be tracked and monitored at the right levels and frequency, to
deliver predictable improvement in metrics like ROA and thereby valuation.
Banking Profitability and Performance Management
PwC Page 10 of 17
Profitability based Performance Management
To improve ROA and reduce variability in performance, banks need to take a forward looking windshield based
approach to performance management rather than a backward looking rear-view mirror based one. This would
include:
• Clear business and financial model across its portfolio of businesses/products to create the roadmap for ROA improvement
• Strong framework and planning cell in the CFO‟s office that translates growth, pricing, profit and capital improvement initiatives into plans and budgets
• Periodic report and review mechanism that a)distinguishes between routine operational plans and strategic growth plans b) effectively tracks budget variance and converts them into actionable items
• Strong measurement framework that deploys ROA improvement targets through the management structure of the organisation
• A SMART (Specific, Measurable, Achievable, Relevant and Timely) KPI framework and hierarchy for each business
• Linkage of ROA targets to lower level financial goals (lag indicators) and operational parameters (lead indicators), and mapping them to the organisational hierarchy
• Improved linkage between ROA improvement and the compensation and reward structure
• Activity based costing
PwC’s Enterprise Performance Management (EPM)
Framework
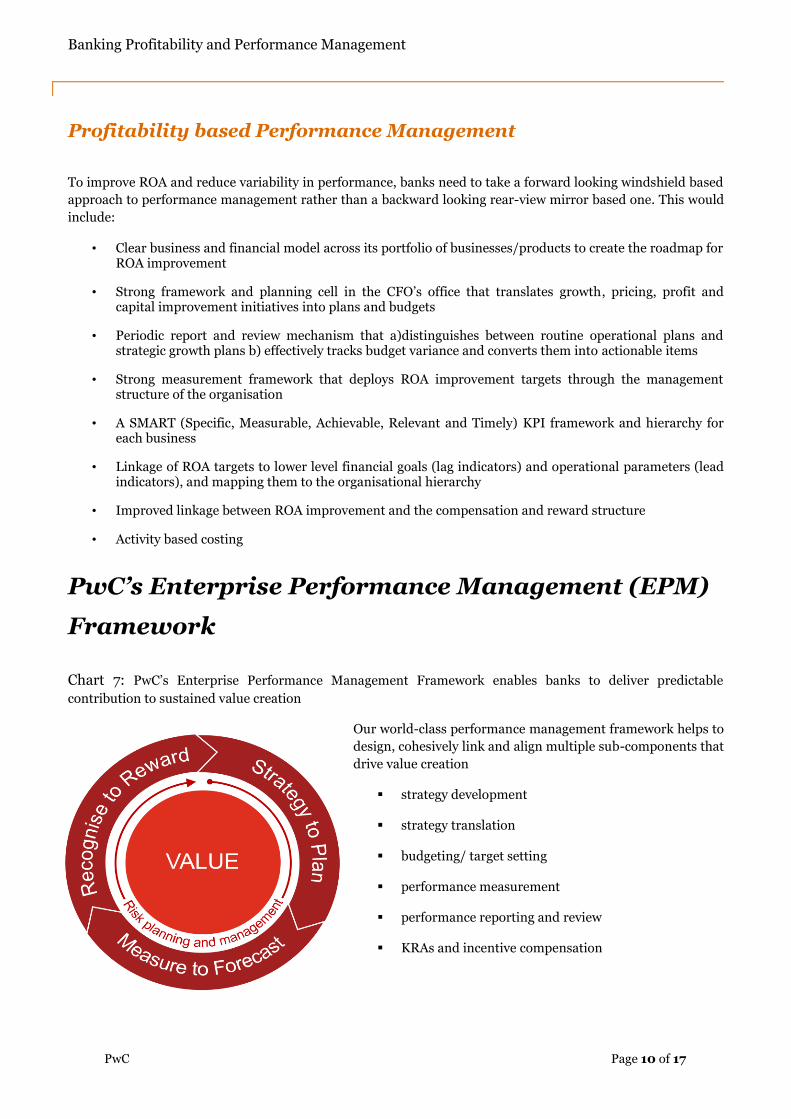
Chart 7: PwC‟s Enterprise Performance Management Framework enables banks to deliver predictable
contribution to sustained value creation
Our world-class performance management framework helps to
design, cohesively link and align multiple sub-components that
drive value creation
strategy development
strategy translation
budgeting/ target setting
performance measurement
performance reporting and review
KRAs and incentive compensation
Banking Profitability and Performance Management
PwC Page 11 of 17
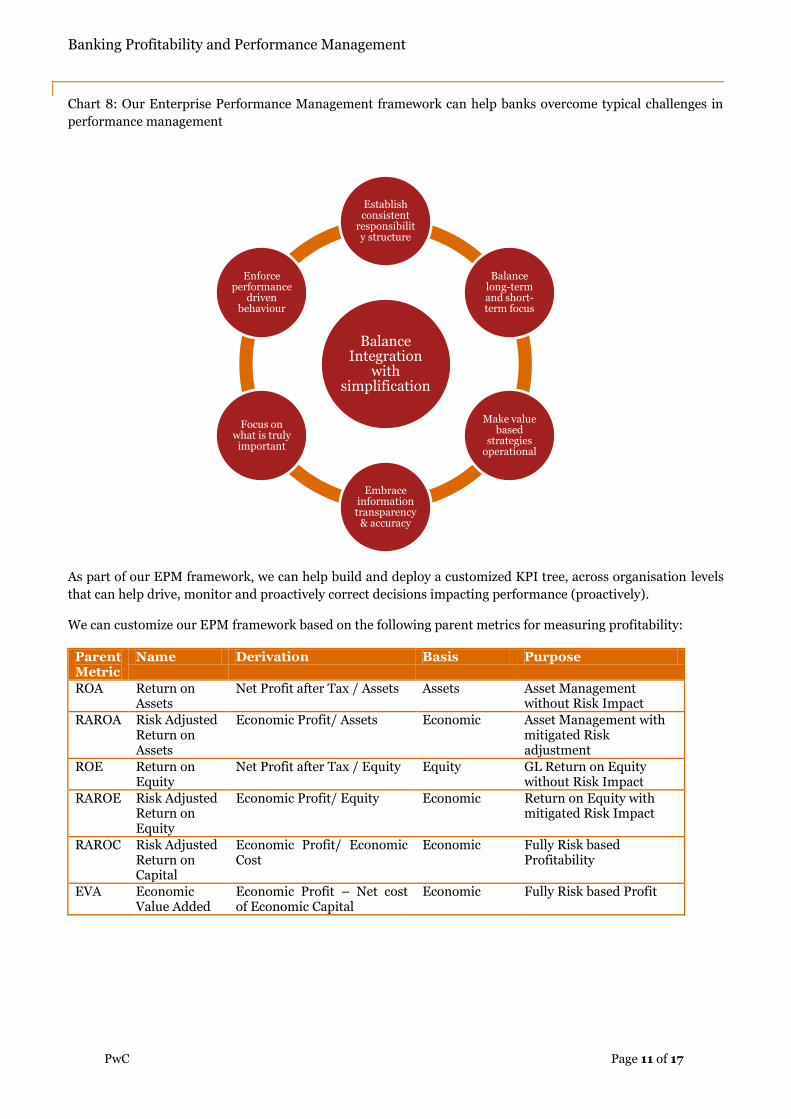
Chart 8: Our Enterprise Performance Management framework can help banks overcome typical challenges in
performance management
As part of our EPM framework, we can help build and deploy a customized KPI tree, across organisation levels
that can help drive, monitor and proactively correct decisions impacting performance (proactively).
We can customize our EPM framework based on the following parent metrics for measuring profitability:
Parent Metric
Name Derivation Basis Purpose
ROA Return on Assets
Net Profit after Tax / Assets Assets Asset Management without Risk Impact
RAROA Risk Adjusted Return on Assets
Economic Profit/ Assets Economic Asset Management with mitigated Risk adjustment
ROE Return on Equity
Net Profit after Tax / Equity Equity GL Return on Equity without Risk Impact
RAROE Risk Adjusted Return on Equity
Economic Profit/ Equity Economic Return on Equity with mitigated Risk Impact
RAROC Risk Adjusted Return on Capital
Economic Profit/ Economic Cost
Economic Fully Risk based Profitability
EVA Economic Value Added
Economic Profit – Net cost of Economic Capital
Economic Fully Risk based Profit
Balance Integration
with simplification
Establish consistent
responsibility structure
Balance long-term and short-term focus
Make value based
strategies operational
Embrace information transparency
& accuracy
Focus on what is truly important
Enforce performance
driven behaviour
Banking Profitability and Performance Management
PwC Page 12 of 17
Illustrative examples of what implementing Profitability based EPM framework entails
Following are samples of various aspects that are typically part of implementing an EPM framework in a
Financial Institution. Please note that these are purely for illustrative purposes only and are neither
comprehensive nor entirely standardized. An effective EPM framework is one that is tailored to the client
organisation based on specific objectives, needs and business dynamics.
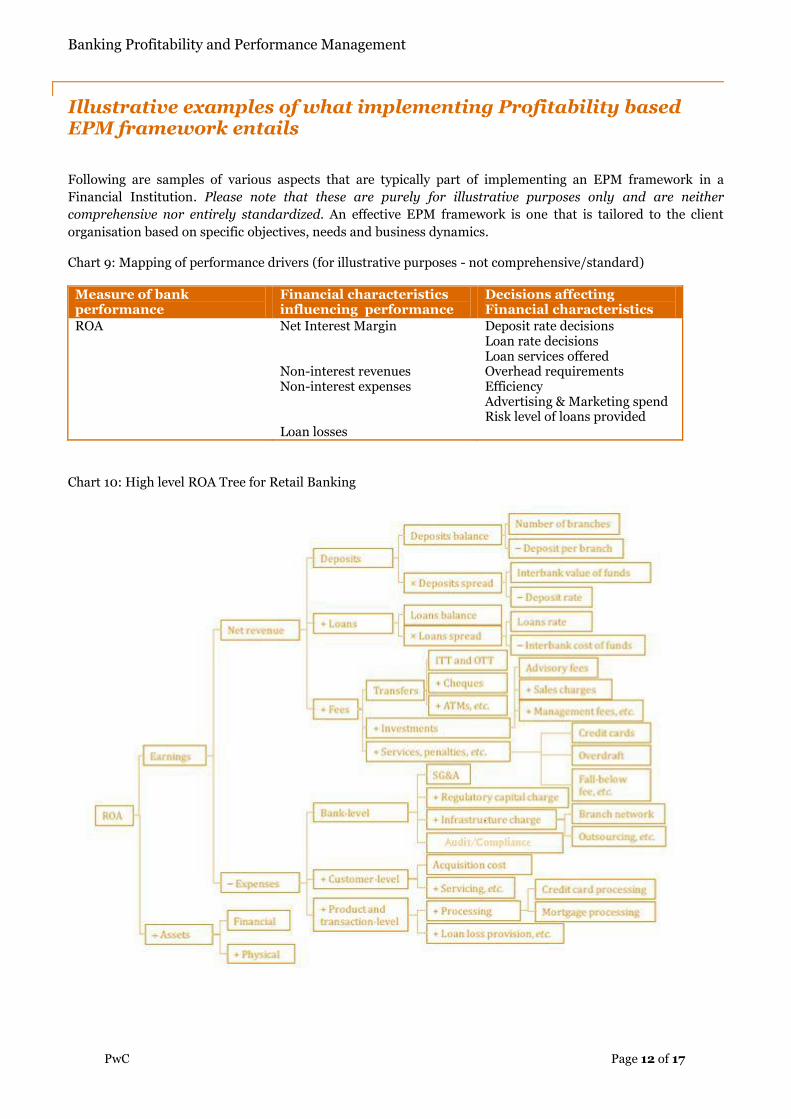
Chart 9: Mapping of performance drivers (for illustrative purposes - not comprehensive/standard)
Measure of bank performance
Financial characteristics influencing performance
Decisions affecting Financial characteristics
ROA Net Interest Margin Non-interest revenues Non-interest expenses Loan losses
Deposit rate decisions Loan rate decisions Loan services offered Overhead requirements Efficiency Advertising & Marketing spend Risk level of loans provided
Chart 10: High level ROA Tree for Retail Banking
Banking Profitability and Performance Management
PwC Page 13 of 17
ROA trees can be viewed using multiple lenses to manage performance across various dimensions:
By business unit/ desk/ product
By transaction/ counterparty/ customer type
By geography
Risk adjusted Return on Capital (RAROC) can be used along the above dimensions for:
Pro-actively tracking and forecasting performance
Achieving safety
Pricing
Strategic/ Business decisions
Capital allocation to business units or portfolios.
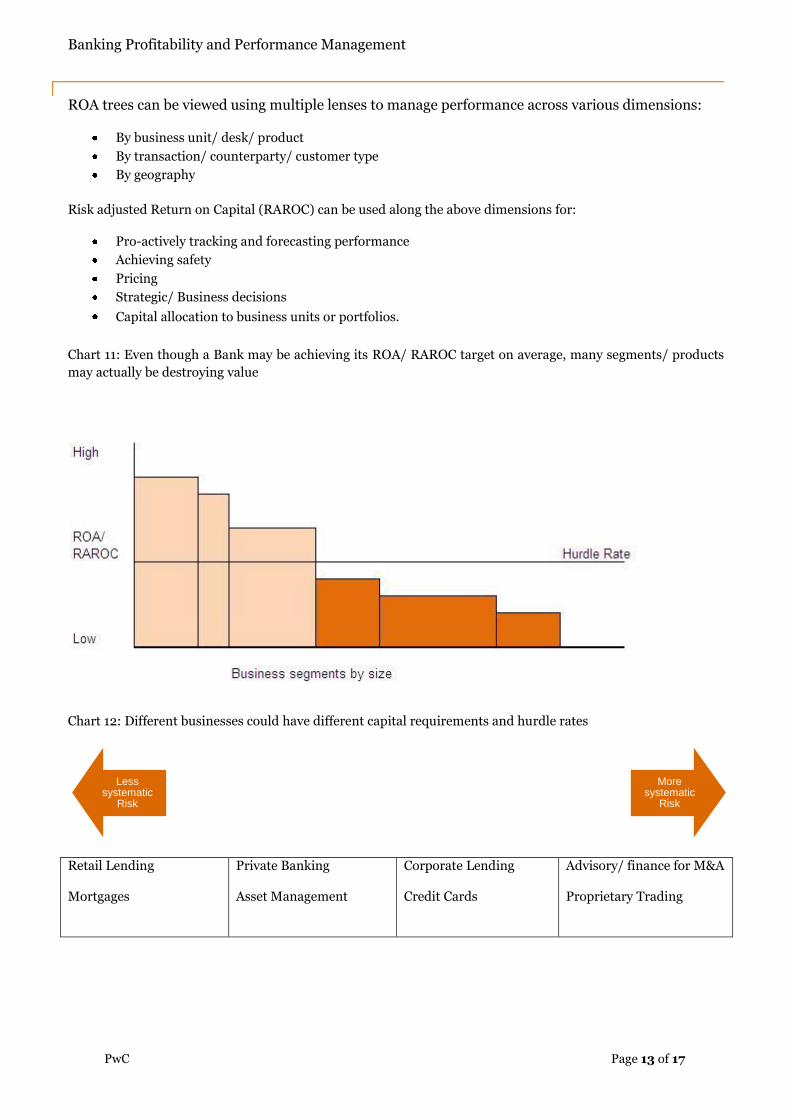
Chart 11: Even though a Bank may be achieving its ROA/ RAROC target on average, many segments/ products
may actually be destroying value
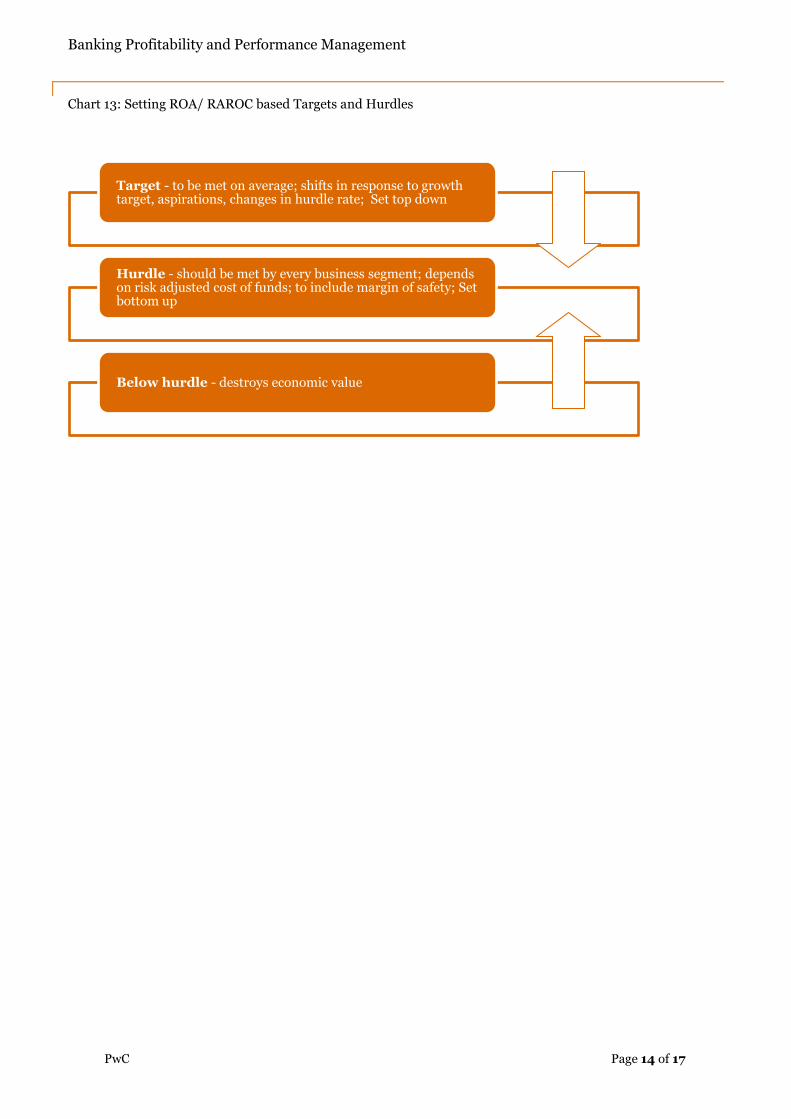
Chart 12: Different businesses could have different capital requirements and hurdle rates
Retail Lending
Mortgages
Private Banking
Asset Management
Corporate Lending
Credit Cards
Advisory/ finance for M&A
Proprietary Trading
Less systematic
Risk
More systematic
Risk
Banking Profitability and Performance Management
PwC Page 14 of 17
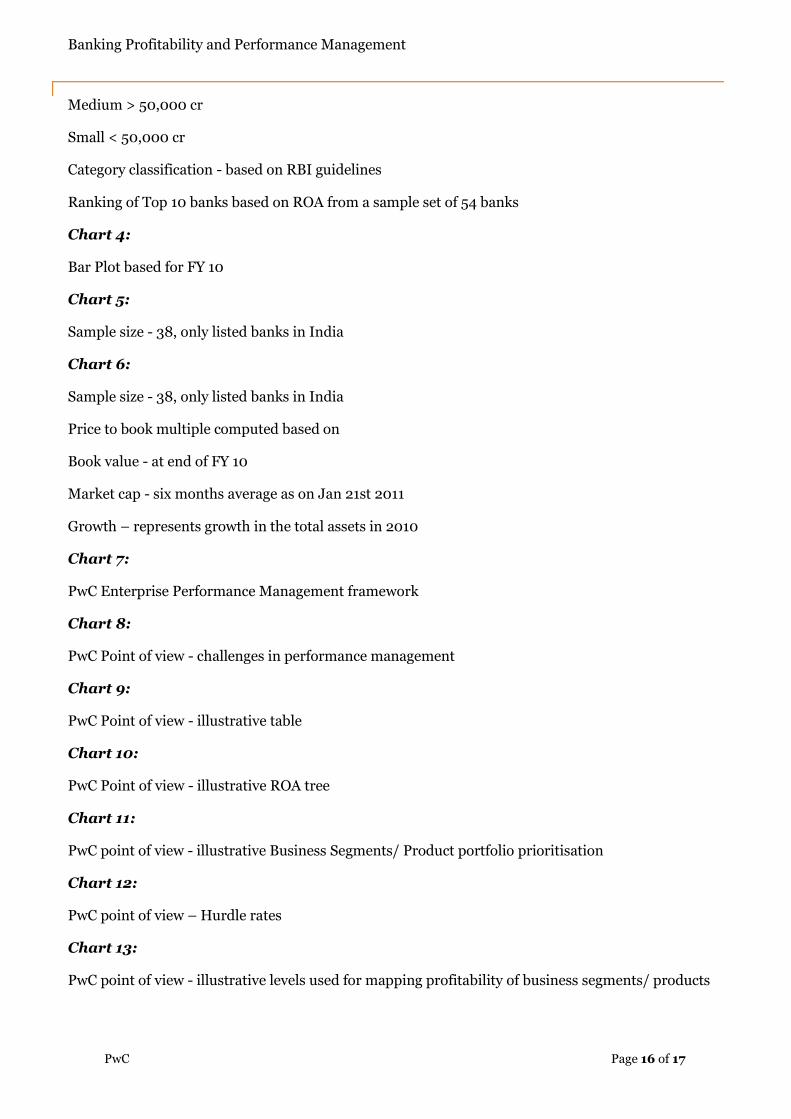
Chart 13: Setting ROA/ RAROC based Targets and Hurdles
Target - to be met on average; shifts in response to growth target, aspirations, changes in hurdle rate; Set top down
Hurdle - should be met by every business segment; depends on risk adjusted cost of funds; to include margin of safety; Set bottom up
Below hurdle - destroys economic value
Banking Profitability and Performance Management
PwC Page 15 of 17
Appendix
Source, Assumptions and Data Sets used for Analysis
Master sample:
Source: RBI data, Bank Annual Reports, PwC Analysis.
RBI list of scheduled commercial banks operating in India having atleast 10 branches as on Mar '10
No. of banks in sample set - 54
Balancesheet size proxy - asset base
Profitability proxy - ROA
Asset base, ROA - annual figures for FY 10
Chart 1:
Source: Study by Gubman EL, The Talent Solution, Aligning Strategy and People to achieve
Extraordinary Results - McGraw Hill 1998
Dataset: Performance Management Process and Financial Results of 437 publicly traded firms
were analyzed. Of the sample 232 companies said they had no formal process of EPM and 205 did.
An analysis of 3 years performance was done on the following factors:
TSR-Total Shareholder Return
ROE - Return on Equity
ROA-Return on Assets
CF-ROI - Cash Flow ROI
Growth in Sales
Growth in Number of Employees
Chart 2:
Correlation co-efficient used – Pearson
Correlation performed across master sample using annual ROA numbers
Chart 3:
Size classification based on balance sheet size
Total assets used as proxy for balance sheet size:
Large > 100,000 cr
Banking Profitability and Performance Management
PwC Page 16 of 17
Medium > 50,000 cr
Small < 50,000 cr
Category classification - based on RBI guidelines
Ranking of Top 10 banks based on ROA from a sample set of 54 banks
Chart 4:
Bar Plot based for FY 10
Chart 5:
Sample size - 38, only listed banks in India
Chart 6:
Sample size - 38, only listed banks in India
Price to book multiple computed based on
Book value - at end of FY 10
Market cap - six months average as on Jan 21st 2011
Growth – represents growth in the total assets in 2010
Chart 7:
PwC Enterprise Performance Management framework
Chart 8:
PwC Point of view - challenges in performance management
Chart 9:
PwC Point of view - illustrative table
Chart 10:
PwC Point of view - illustrative ROA tree
Chart 11:
PwC point of view - illustrative Business Segments/ Product portfolio prioritisation
Chart 12:
PwC point of view – Hurdle rates
Chart 13:
PwC point of view - illustrative levels used for mapping profitability of business segments/ products
Banking Profitability and Performance Management
PwC Page 17 of 17
PwC Contacts
Hari Rajagopalachari
Partner
Office: +91 80 4079 4000 / 7000 Mobile: +91 97403 77100 E-mail: [email protected]
Akhila Rajan
Managing Consultant
Office: +91 44 42285000 Mobile: +91 8939941666 E-mail: [email protected]
Shyam Pattabiraman
Principal Consultant
Office: +91 44 42285000 Mobile: +91 9840960669 E-mail: [email protected]
Anoop Kachhara
Consultant
Office: +91 22 6669 1294 Mobile: +91 98331 64863 E-mail: [email protected]
“PwC”, a registered trademark, refers to PricewaterhouseCoopers Private Limited (a limited company in India) or, as the context requires, other member firms of PricewaterhouseCoopers International Limited, each of whic
This report does not constitute professional advice. The information in this report has been obtained or derived from sources believed by
PricewaterhouseCoopers Pvt. Ltd. (PwC) to be reliable but PwC does not represent that this information is accurate or complete. Any
opinions or estimates contained in this report represent the judgement of PwC at this time and are subject to change without notice.
Readers of this report are advised to seek their own professional advice before taking any course of action or decision, for which they are
entirely responsible, based on the contents of this report. PwC neither accepts or assumes any responsibility or liability to any reader of this
report in respect of the information contained within it or for any decisions readers may take or decide not to or fail to take.
© 2011 PricewaterhouseCoopers Private Ltd. All rights reserved. “PwC”, a registered trademark, refers to PricewaterhouseCoopers
Private Limited (a limited company in India) or, as the context requires, other member firms of PwC International Limited, each of which is a
separate and independent legal entity.