BUDGET 2017 - Montrealville.montreal.qc.ca/.../media/documents/Budget2017_bref_en.pdf · 2014 to...
15
BUDGET 2017 1 BUDGET Operating Budget At a Glance 2017
Transcript of BUDGET 2017 - Montrealville.montreal.qc.ca/.../media/documents/Budget2017_bref_en.pdf · 2014 to...

B U D G E T 2 0 1 7 1
BUDGETOperating Budget At a Glance 2017

B U D G E T 2 0 1 7 1
This document is the tabled version of Montréal’s 2017 Operating Budget At a Glance.
Contents
2 Message from the Mayor and the Chairman of the Executive Committee
5 Highlights
7 How Are City Revenues Generated?
8 Your Taxes Are Important
9 2017 Tax Highlights
12 The Island of Montréal and its Population
2 B U D G E T 2 0 1 72 B U D G E T 2 0 1 7
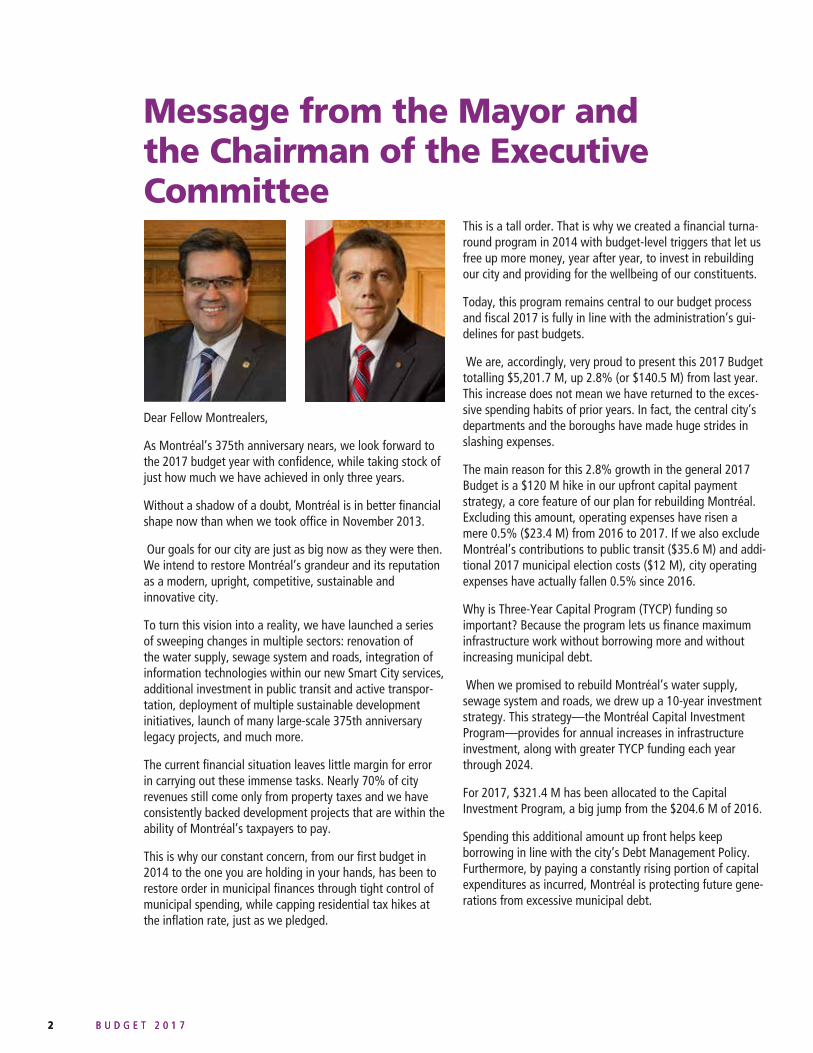
Message from the Mayor and the Chairman of the Executive Committee
Dear Fellow Montrealers,
As Montréal’s 375th anniversary nears, we look forward to the 2017 budget year with confidence, while taking stock of just how much we have achieved in only three years.
Without a shadow of a doubt, Montréal is in better financial shape now than when we took office in November 2013.
Our goals for our city are just as big now as they were then. We intend to restore Montréal’s grandeur and its reputation as a modern, upright, competitive, sustainable and innovative city.
To turn this vision into a reality, we have launched a series of sweeping changes in multiple sectors: renovation of the water supply, sewage system and roads, integration of information technologies within our new Smart City services, additional investment in public transit and active transpor-tation, deployment of multiple sustainable development initiatives, launch of many large-scale 375th anniversary legacy projects, and much more.
The current financial situation leaves little margin for error in carrying out these immense tasks. Nearly 70% of city revenues still come only from property taxes and we have consistently backed development projects that are within the ability of Montréal’s taxpayers to pay.
This is why our constant concern, from our first budget in 2014 to the one you are holding in your hands, has been to restore order in municipal finances through tight control of municipal spending, while capping residential tax hikes at the inflation rate, just as we pledged.
This is a tall order. That is why we created a financial turna-round program in 2014 with budget-level triggers that let us free up more money, year after year, to invest in rebuilding our city and providing for the wellbeing of our constituents.
Today, this program remains central to our budget process and fiscal 2017 is fully in line with the administration’s gui-delines for past budgets.
We are, accordingly, very proud to present this 2017 Budget totalling $5,201.7 M, up 2.8% (or $140.5 M) from last year. This increase does not mean we have returned to the exces-sive spending habits of prior years. In fact, the central city’s departments and the boroughs have made huge strides in slashing expenses.
The main reason for this 2.8% growth in the general 2017 Budget is a $120 M hike in our upfront capital payment strategy, a core feature of our plan for rebuilding Montréal. Excluding this amount, operating expenses have risen a mere 0.5% ($23.4 M) from 2016 to 2017. If we also exclude Montréal’s contributions to public transit ($35.6 M) and addi-tional 2017 municipal election costs ($12 M), city operating expenses have actually fallen 0.5% since 2016.
Why is Three-Year Capital Program (TYCP) funding so important? Because the program lets us finance maximum infrastructure work without borrowing more and without increasing municipal debt.
When we promised to rebuild Montréal’s water supply, sewage system and roads, we drew up a 10-year investment strategy. This strategy—the Montréal Capital Investment Program—provides for annual increases in infrastructure investment, along with greater TYCP funding each year through 2024.
For 2017, $321.4 M has been allocated to the Capital Investment Program, a big jump from the $204.6 M of 2016.
Spending this additional amount up front helps keep borrowing in line with the city’s Debt Management Policy. Furthermore, by paying a constantly rising portion of capital expenditures as incurred, Montréal is protecting future gene-rations from excessive municipal debt.

B U D G E T 2 0 1 7 3
As the latest tests show, we must focus our efforts on rever-sing the deterioration of our water supply, sewage system and roads. Over the next 10 years, Montréal must service and restore some 5,100 km of roads, water mains and sewage lines.
This is why we have fast-tracked our work—and invest-ment—as laid out in the 2017-2019 Three-Year Capital Program (TYCP). This is also why the TYCP will be enhanced by $80 M annually, from 2017 through 2024. Our strategy supports a total $480 M investment over three years ($40 M in 2015 + $160 M in 2016 + $280 M in 2017).
The main reason Montréal is allocating increasing sums to the TYCP, is because this will save the city money.
Doing so is a big job, because along with an additional $120 M for the TYCP strategy, the 2017 Budget has absorbed wide swings in certain expense items, including more funding ($13.5 M) for the boroughs, along with a $35.6 M hike in our public transit allocation, with $25.8 M of this figure going to the Société de transport de Montréal (STM).
Montréal has earmarked a total $546.7 M for public transit in 2017, up 7% from 2016, or almost four times more than 2017’s expected growth in the Consumer Price Index.
In addition to these increases, $59.2 M has been assigned to new central city priorities, including the cost of holding municipal election ($16 M).
Our cost-cutting efforts have capped net growth at $140.5 M
We have achieved our biggest savings in overall compensa-tion—the city’s largest expense category, covering pay to city workers and elected officials, plus employer contributions to various plans and benefits programs.
Overall compensation in 2014 represented a bit more than half (51.2%) of all city operating costs. Our Workforce Reduction Program and pension plan savings lowered this figure to 48.7% in 2015 and 46.4% in 2016.
For 2017, overall compensation will represent 44.2% of all operating expenses, down to $2,299.3 M from $2,350.8 M (-2.2%).
Once again, we are looking forward to some $69.2 M in savings thanks to the good return on investment in our pen-sion plans since 2013, combined with the impact of Bill 15 (An Act to foster the financial health and sustainability of municipal defined benefit pension plans).
Notwithstanding a lull in retirements, we are continuing to apply our Five-Year Workforce Reduction Plan (PQMO), which requires the elimination of one out of every two positions that become vacant due to retirement. This plan will cut a net 99.3 person years from the 2017 Budget, generating savings of $11.8 M
This net reduction is less than forecast because there were about 900 fewer retirements than expected over the past three years. Furthermore, we are creating more jobs than forecast in 2017 to contain new challenges facing the city. These jobs include 55 new positions in our police department (SPVM) to support counter-radicalization efforts, protect vulnerable groups and address other urban threats. Furthermore, the 49 positions being created for the Metropolitan Power Grid (REM) and Turcotte projects, as well as for utilities such as Hydro-Québec and Gaz Métro, will be reimbursed under agreements with these partners.
Incidentally, the city’s central departments and boroughs have also made their own contributions to workforce reduction.
Our administration’s deployment of its Borough Funding Reform (RFA) program two years ago will continue in 2017, adding an overall $13.5 M to borough budgets, including $7.8 M in indexing of budget dollars transferred from the central city.
All these factors have helped us prepare a 2017 Budget that reflects our rigorous, responsible and effective management of city funds, is faithful to our commitments and meets city priorities, while providing residents with quality services and boosts investment in such areas as public transit, culture, child development, parks, green spaces and public safety.
The overall 1.7% increase in residential property taxes is the smallest hike in the past nine years. Again, we are meeting our pledge to cap tax increases at the rate of inflation, which is expected to be 1.8% for Greater Montréal in 2017.

4 B U D G E T 2 0 1 7
We have kept the growth in non-residential property taxes at 0.9% to boost Montréal’s competitive edge and promote the metropolis’s economic development.
This initiative was introduced last year and has proved popu-lar in the business community. Our Non-Residential Taxation and Economic Development Committee (Comité de travail sur la fiscalité non résidentielle et le développement écono-mique), which was formed last year shortly after the 2016 Budget was submitted, has recommended that this measure be maintained to shrink the fiscal gap between residential and non-residential properties.
The city has already taken action on other Committee recom-mendations, as illustrated by our ongoing efforts to reduce municipal expenses and restore urban infrastructure. Québec would have to grant Montréal additional powers so we could implement additional options, including financial support to stores impacted by major infrastructure work and a reduced tax rate for the first non-residential property value bracket.
Ultimately, we are confident that the future Act respecting the metropolis will equip us with new economic develop-ment promotion tools.
Our first term in office concludes in 2017. This budget also provides an opportunity to take stock of what we have accomplished so far and serves as a guide for coming years. Montréal still has major challenges to meet and if our 375 years of existence proves anything, it is that there is no hurdle we can’t overcome.
Denis Coderre
Mayor of Montréal
Pierre Desrochers
Chair of the Executive Committee

2017 Highlights
• A $5,201.7 M budget, up 2.8% ($140.5 M) from 2016.
• Operating expenses, strictly defined, only rose by 0.5% ($23.4 M) compared to the 2016 Budget. Excluding public transit spending ($35.6 M) and election costs ($12 M), operating expenses actually fell 0.5% from 2016.
• A $120.0 M increase in upfront payments on capital investments or $40 M more than planned in the city’s 2014 upfront payment strategy.
• A 1.8% rise in general residential property taxes and a 0.9% tax increase for non-residential properties, meeting the Administration’s goal of keeping taxes in line with inflation, while promoting economic development.
• Little change in the $2,249.2 M of contribution shares earmarked for Agglomeration funding (0.1% up from the 2016 Budget).
• Overall compensation stood at $2,299.3 M, down $51.5 M from 2016 and representing 44.2% of the 2017 Budget, compared to 46.4% in 2016.
• With passage of Bill 15 (An Act to foster the financial health and sustainability of municipal defined benefit pension plans), the city is pursuing negotiations with its union partners to find long-term solutions for cutting pension plan costs. We are looking forward to some $69.2 M in savings thanks to Bill 15 and good invest-ment returns since 2013.
• Continuation of the rigorous Five-Year Workforce Reduction Plan (PQMO) will let us cut 99.3 person-years in 2017.
• Under the Plan quinquennal de main-d’œuvre (PQMO), the boroughs will also reduce staffing in 2017 and apply their savings to balance their own budgets.
• Borough Finance Reform continues in 2017, with $13.5 M more in funding for the boroughs.
• A $25.8 M hike in our regular contribution to the Société de transport de Montréal, for a total $546.7 M in 2017. In addition to this contribution, Montréal is providing additional funding of $9.5 M to SOFIL-STM and $0.3 M to the AMT, for total new payments of $35.6 M suppor-ting public transit.
• $35.6 M additional funding for public transit, up 7% from 2016, for a total of $546.7 M. This amount includes $455.6 M for the STM (+$25.8 M), $26.7 M for the Public Transit Capital Assistance Program (SOFIL-STM), plus $64.3 M for the AMT.
• $138.4 M for municipal roads, including $95.7 M in borough budgets.
• 14 posts will be added to the Water Department (Service d’eau) and 16 in Infrastructure, Roads and Transportation (Service des infrastructures, de la voirie et des transports) to boost implementation capacity of the Three Year Capital Program (TYCP).
• $157.6 M for snow removal or 3.5% ($5.8 M) less than the 2016 Budget, due to such factors as centralized management of all snow removal contracts and the Snow Removal Performance Optimization Project (Chantier d’optimisation de cette activité).
• Waste management costs of $155.8 M, down $4.8 M, including additional funds of $0.6 M to ensure ongoing implementation of the Food Scraps Collection Initiative (Stratégie d’implantation de la collecte des résidus alimentaires). The lower spending is partly due to reduced tonnage of household waste being sent to dumps and reduced contract costs, due to grouped contracting, resulting from the Borough Funding Reform (Réforme du financement des arrondissements—RFA).
• Funding of $5 M to implement the Policy on Children, which affirms the city’s commitment to child deve-lopment by providing additional support and actions, particularly in disadvantaged neighbourhoods.
• $4 M of funding earmarked for the Formula E Championship, the world’s only race for fully electric cars.
• $14.5 M for the Conseil des arts de Montréal, up $0.5 M from 2016.
• $7.4 M for Pointe-à-Callière, the Montréal Archaeology and History Complex, $1.5 M more than in 2016, prima-rily to finance two new structures: Fort de Ville-Marie and the Collector Sewer.
B U D G E T 2 0 1 7 5

6 B U D G E T 2 0 1 7
• $1.5 M to redevelop the Complexe environnemental de Saint-Michel (CESM) park, one of the legacy projects marking the 375th anniversary of Montréal’s founding.
• An $11 M contribution will be made to the Société des célébrations du 375e anniversaire de Montréal en 2017, in addition to the $24 M of funding announced in the 2015 and 2016 budgets.
6 B U D G E T 2 0 1 7

B U D G E T 2 0 1 7 7
Operating Budget 2017
How Are City Revenues Generated?
Montréal’s 2017 revenues will come primarily from property taxes totalling $3.6 B and representing 69.2% of the city administration’s total funding.
Fee-for-service and other revenues are projected to stand at $954.2 M and represent 18.3% of the total. Transfer revenues—grants from the higher levels of government and various agencies—amount to an expected $245.3 M 4.7% of the total).
Under An Act to amend various legislative provisions concer-ning Montréal (RSQ 2008, c. 19), “urban agglomeration expenditures will be financed by aliquot (quota) shares requi-red from the related municipalities.” Quota shares charged to related municipalities are expected to stand at $403.7 M (7.8% of Montréal’s revenues).
All these revenues have been earmarked for funding expenses associated with local municipal and agglomera-tion areas of responsibility. Montréal, as the central city, is responsible for administering the agglomeration’s financial responsibilities on behalf of all its related municipalities.
Taxes69.2%
Services Renderedand Other Revenues
18.3%
Transfers4.7%
Quota Sharesfrom the
ReconstitutedMunicipalities
7.8%
Revenues$5 201.7 M

8 B U D G E T 2 0 1 7
Social housing, food inspectionand others2.1¢
Waste pickup, disposal and environment3.4¢
Corporatecharges
7.1¢
Generaladministration
9.9¢
Debt servicing17.5¢
Urban planning andeconomic development
4.1¢
Water and sewers5.0¢
Public transit11.1¢
Snow removal3.2¢
Road network5.4¢
Public security20.1¢
Recreationand culture
11.1¢
Public security 20.1¢
Police 12.9¢
Fire safety 6.8¢
Civil security and others 0.4¢
Recreation and culture 11.1¢
Swimming pools, parks and playing fields 4.2¢
Community centres 1.7¢
Libraries 1.9¢
Heritage, musieums and exhibition centres 1.5¢
Skating rinks 0.7¢
Others 1.1¢
Corporate charges 7.1¢
Pension plans 3.1¢
Contingencies, pay equity and others 4.0¢
General administration 9.9¢
City council 1.2¢
Law enforcement 1.4¢
Financial management 5.1¢
City clerk and property assessment 0.9¢
Human resource management 1.3¢
Your Taxes Are Important
Operating Budget
8 B U D G E T 2 0 1 7

B U D G E T 2 0 1 7 9
Operating Budget
2017 Tax Highlights
City Council Decision: General Tax Increase
The administration is raising taxes 1.9% for residential and 0.9% for non-residential properties in 2017. This decision will result in a total tax charge increase of 1.8% for residential and 0.9% for non-residential properties.
The Administration’s decision to apply a lower tax increase to non-residential properties is in keeping with its commitment to promote economic development.
Borough Council Decisions: Impact of Service Taxes
The boroughs are responsible for indexing their service taxes in line with overall indexing of their budgets.
Borough councils decreased their service tax revenues a global 1% for 2017. These decisions, made by each council, will reduce total residential property taxes 0.1% and have a negligible overall impact on non-residential taxes.

10 B U D G E T 2 0 1 7
Changes in Overall Taxation
The following chart presents changes in overall taxation for Montreal taxpayers by borough, including the impact of changes in borough taxes.
Individual taxpayer’s tax bills could fall or rise to different extents depending on changes in the value of their property compared to that of other Montréal properties.
Ahuntsic-Cartierville 1,7% 0,1% 1,8% 0,5% – 0,5%
Anjou 0,6% (1,9%) (1,3%) (0,1%) (0,5%) (0,6%)
Côte-des-Neiges–Notre-Dame-de-Grâce 2,5% – 2,5% 0,8% – 0,8%
Lachine 1,5% – 1,5% 1,5% 0,1% 1,6%
LaSalle 1,2% (2,9%) (1,7%) 0,2% (0,7%) (0,5%)
L'Île-Bizard–Sainte-Geneviève 0,7% 0,3% 1,0% 0,1% 0,1% 0,2 %
Mercier–Hochelaga-Maisonneuve 1,7% 0,1% 1,8% 0,0% – 0,0%
Montréal-Nord 0,9% 0,1% 1,0% 0,5% – 0,5%
Outremont 2,3% 0,1% 2,4% 3,1% – 3,1%
Pierrefonds-Roxboro 1,0% 0,1% 1,1% 0,5% – 0,5%
Plateau-Mont-Royal 1,7% 0,7% 2,4% 1,8% 0,1% 1,9%
Rivière-des-Prairies–Pointe-aux-Trembles 2,3% (1,0%) 1,3% 0,9% (0,2%) 0,7%
Rosemont–La Petite-Patrie 2,5% 0,1% 2,6% 1,9% – 1,9%
Saint-Laurent 2,0% 0,1% 2,1% 0,7% – 0,7%
Saint-Léonard 1,5% 0,1% 1,6% 1,0% – 1,0%
Sud-Ouest 1,9% – 1,9% 2,3% – 2,3%
Verdun 1,7% 0,1% 1,8% 1,4% – 1,4%
Ville-Marie 1,2% – 1,2% 0,8% – 0,8%
Villeray–Saint-Michel–Parc-Extension 2,1% 0,1% 2,2% 1,4% – 1,4%
VILLE DE )%1,0(%8,1LAÉRTNOM 1,7% 0,9% – 0,9%
─ Minimal data
General tax charges1
Source: Compilation updated September 14, 2016 and based on 2016 and 2017 tax parameters.
1 “General tax charges” include general property taxes, the water and road taxes, fiscal user fees and borough investment taxes. They exclude changes relating to borough service taxes.
Change in total tax charges between 2016 and 2017, by borough
Residential properties Non-residential properties
Boroughs Borough service taxes
Overall tax charges
General tax charges1
Borough service taxes
Overall tax charges
2016-11-21

B U D G E T 2 0 1 7 11
Evolution of total tax charge and consumerprice indexes, by property category,between 2001 à 2017
100
105
110
115
120
125
130
135
2001 2003 2005 2007 2009 2011 2013 2015 2017
Residential 100.0 98.1 98.7 99.0 100.4 110.0 115.8 120.1 124.4
Non-Residential 100.0 99.7 105.1 105.8 107.0 118.2 124.4 129.4 131.7
CPI 100.0 104.4 108.9 112.6 115.9 120.5 123.8 127.5 131.2
* Forecast CPI
95
Evolution of total tax charge and consumer price indexes, between 2001 and 2017
100
105
110
115
120
125
130
135
2001 2003 2005 2007 2009 2011 2013 2015 2017
Total tax charge 100.0 98.9 102.3 102.7 104.1 114.6 120.6 125.2 128.4
CPI 100.0 104.4 108.9 112.6 115.9 120.5 123.8 127.5 131.2
* Forecast CPI
95
Total Tax Changes Since 2001
The following graphs present changes in total taxes paid by Montréal taxpayers since 2001, by property category.
Evolution of total tax charge1 and consumer price indexes2, between 2001 and 2017 Index (2001 = 100)
Evolution of total tax charge1 and consumer price indexes2, by property category, between 2001 and 2017Index (2001 = 100)
1. The total tax charge index measures the changes in the general property tax, fiscal and user fees, borough service taxes and water and road taxes.
2. Source: Institut de la statistique du Québec and Statistics Canada.

12 B U D G E T 2 0 1 7
The
Isla
nd
of
Mo
ntr
éal
and
its
Pop
ula
tio
n

Published by the Ville de MontréalService des finances
155, rue Notre-Dame EstMontréal (Québec)H2Y 1B5Canada
ville.montreal.qc.ca/finances
Legal deposit – Bibliothèque et Archives nationales du Québec, 2016
Legal depositif – Library and Archives Canada, 2016
978-2-7647-1466-9Budget de fonctionnement 2017Printed document, French
978-2-7647-1467-6Budget de fonctionnement 2017PDF, French
978-2-7647-1468-3Budget en bref Printed document, French
978-2-7647-1469-0Budget en bref PDF, French
978-2-7647-1470-6Operating Budget / At a GlancePrinted document, English
978-2-7647-1471-3Operating Budget / At a GlancePDF, English
Graphic design and printingService des communicationsVille de Montréal
Printed in Canada
The document is printed on recycled paper

ville.montreal.qc.ca/finances