I COUNT MTL 2015 - Montrealville.montreal.qc.ca/.../media/documents/I_Count_MTL_2015_report.pdf ·...
81
Centre intégré universitaire de santé et de services sociaux de l’Ouest-de-l’Île-de-Montréal Project financed by Count and Survey of Montreal’s Homeless Population on March 24, 2015 I COUNT MTL 2015
Transcript of I COUNT MTL 2015 - Montrealville.montreal.qc.ca/.../media/documents/I_Count_MTL_2015_report.pdf ·...

Centre intégré universitairede santé et de services sociauxde l’Ouest-de-l’Île-de-Montréal
Project financed by
Count andSurvey ofMontreal’sHomelessPopulation onMarch 24, 2015
I COUNTMTL2015

i
I Count MTL 2015: Count and Survey of Montreal’s Homeless Population on March 24, 2015
Eric Latimer, Ph.D.
James McGregor, M.Urb.
Christian Méthot, M.Sc.
Alison Smith, Ph.D. candidate
July 2015
Centre intégré universitairede santé et de services sociauxde l’Ouest-de-l’Île-de-Montréal
Project financed by

ii
Project team
This report reflects the efforts of many people who worked on the count and survey from November 2014 to June 2015. A team from the Downtown YMCA, led by Art Campbell, Director of Community Development, and including Sylvie Gagnon, Louison Cuvelier, Sylvie Guiguemdé, Marie-José LeBlanc and Michel Forgues, recruited the volunteers and organized logistics during the evening of March 24. A second team from Convercité, led by its Director Daniel Malo and including Marianik Gagnon, Ophélie Chabant, Louison Cuvelier and Léa Riou, produced the maps for the survey of outside locations, organized the decoys, entered and processed the data. A third team from the Douglas Mental Health University Institute, led by Research Coordinator Christian Méthot and including Marie-Anne Bourassa, Marc-Antoine Lapierre and Michaël Sam Tion, helped draw up the questionnaires, organized the count in soup kitchens and day centres on March 25 and 26, obtained additional data from other service providers, hospitals and detention centres from April to June, and helped analyze and synthesize the data. Neal Santamaria was responsible for liaison with the shelters and transitional housing and helped make links with the local community. Alison Smith, Ph.D. candidate at the Université de Montréal, contributed in an important way to the methodology and also worked with Mr. Santamaria on community relations. Communications specialist Stéphanie Lassonde, was initially in charge of the media aspects of the project, later followed by Florence Meney from the Douglas Mental Health University Institute of the Centre Intégré Universitaire de Santé et de Services sociaux de l’Ouest-de-l’Île-de-Montréal. Matthew Pearce, President and CEO of the Old Brewery Mission, and Cyril Morgan, CEO of Welcome Hall Mission, helped guide the project. A Scientific Committee, whose members are listed below, contributed to the methodology and the questionnaire. A Steering Committee, put together by the City of Montreal’s Service de la diversité sociale et des sports and whose members are listed below, guided the project along the way. Dr. Eric Latimer and consultant James McGregor co-directed the project.
Funding This project was commissioned and funded by the City of Montreal, following a request for proposals. The contract between the City of Montreal and the Douglas Hospital Research Centre – the lead agency of a consortium that included the YMCA and Convercité – was signed on November 29, 2014.
How to cite this document: Eric Latimer, James McGregor, Christian Méthot and Alison Smith, for the “I Count MTL 2015” team, Count and Survey of Montreal’s homeless population on March 24, 2015 (2015), Montreal, Quebec: City of Montreal, July 7.
English translation: Susan Altschul
© Douglas Mental Health University Institute of the Centre intégré universitaire de santé et de services sociaux de l’Ouest-de-l’Île-de-Montréal, 2015.
This document may be reproduced in whole or in part, provided the source is given.

iii
Members of the Scientific Committee Eric Latimer, Ph.D. (Chair) Researcher, Douglas Institute Research Centre, CIUSSS de l’Ouest-de-l’Île-de-Montréal Professor, Department of Psychiatry, McGill University Jean-Pierre Bonin, Ph.D. Professor, Faculty of Nursing Sciences, Université de Montréal Serge Chevalier Consultant Dr. Olivier Farmer Psychiatrist (Psychotic Disorders, Urban Psychiatry), Notre-Dame Hospital Stephen Gaetz, Ph.D. Professor, Faculty of Education, York University Director of the Canadian Observatory on Homelessness Elise Roy, Ph.D. Professor, Director of Study and Research Programs on Addictions, Faculty of Medicine and Health Sciences, Université de Sherbrooke Laurence Roy, Ph.D. Researcher, Douglas Institute Research Centre Assistant Professor, School of Physical and Rehabilitation Therapy, McGill University Alison Smith Ph. D. candidate in Political Science, Université de Montréal Alina Turner, Ph.D. School of Public Policy, University of Calgary

iv
Members of the Steering Committee
Johanne Derome Director, Service du développement social et des sports, City of Montreal
Patrice Allard Division Head, Service du développement social et des sports, City of Montreal
Pierre-Luc Lortie Community development consultant, Service du développement social et des sports, City of Montreal
Marlene Caron Community development consultant, Service du développement social et des sports, City of Montreal
Dominique Archambault Director, Culture, Sports, Recreation and Social Development, Ville-Marie Borough, Montreal
Manon Barnabé Community and Homelessness Activities, CIUSSS Centre-Est-de-l’Île-de-Montréal
Julien Baudry Corporate communications consultant, City of Montreal
Jason Champagne Assistant Director of Mental Health and Addictions Programs, CIUSSS Centre-Est-de-l’Île-de-Montréal
Richard Chrétien Director, Le Sac à Dos
Sylvie Cornez Consultant, MAKIVIK
Léonie Couture Director, Herstreet
Alain Gagnon Chief Inspector, South Region Community Services, Service de police de la Ville de Montréal
Louise Giguère Director, RAP Jeunesse
Alain Larivière Security and Control Superintendant, Montreal Transit Authority
v
KEY FINDINGS
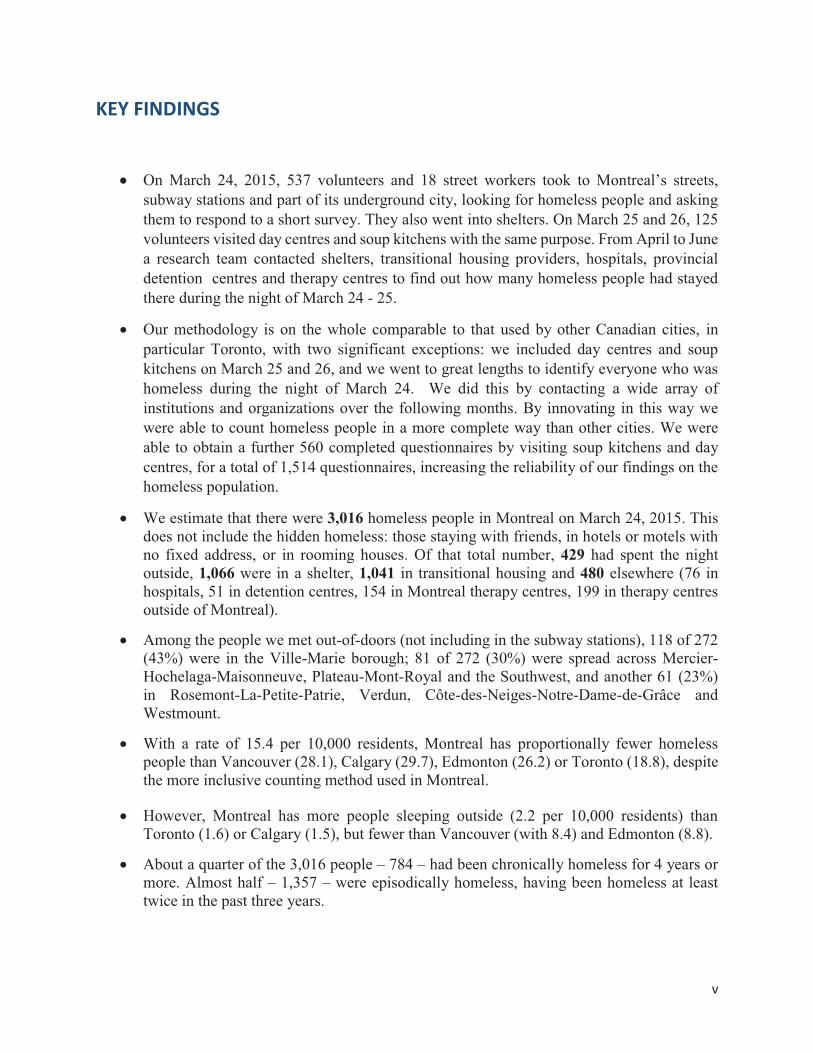
�� On March 24, 2015, 537 volunteers and 18 street workers took to Montreal’s streets, subway stations and part of its underground city, looking for homeless people and asking them to respond to a short survey. They also went into shelters. On March 25 and 26, 125 volunteers visited day centres and soup kitchens with the same purpose. From April to June a research team contacted shelters, transitional housing providers, hospitals, provincial detention centres and therapy centres to find out how many homeless people had stayed there during the night of March 24 - 25.
� Our methodology is on the whole comparable to that used by other Canadian cities, in particular Toronto, with two significant exceptions: we included day centres and soup kitchens on March 25 and 26, and we went to great lengths to identify everyone who was homeless during the night of March 24. We did this by contacting a wide array of institutions and organizations over the following months. By innovating in this way we were able to count homeless people in a more complete way than other cities. We were able to obtain a further 560 completed questionnaires by visiting soup kitchens and day centres, for a total of 1,514 questionnaires, increasing the reliability of our findings on the homeless population.
� We estimate that there were 3,016 homeless people in Montreal on March 24, 2015. This does not include the hidden homeless: those staying with friends, in hotels or motels with no fixed address, or in rooming houses. Of that total number, 429 had spent the night outside, 1,066 were in a shelter, 1,041 in transitional housing and 480 elsewhere (76 in hospitals, 51 in detention centres, 154 in Montreal therapy centres, 199 in therapy centres outside of Montreal).
� Among the people we met out-of-doors (not including in the subway stations), 118 of 272 (43%) were in the Ville-Marie borough; 81 of 272 (30%) were spread across Mercier-Hochelaga-Maisonneuve, Plateau-Mont-Royal and the Southwest, and another 61 (23%) in Rosemont-La-Petite-Patrie, Verdun, Côte-des-Neiges-Notre-Dame-de-Grâce and Westmount.
� With a rate of 15.4 per 10,000 residents, Montreal has proportionally fewer homeless people than Vancouver (28.1), Calgary (29.7), Edmonton (26.2) or Toronto (18.8), despite the more inclusive counting method used in Montreal.
� However, Montreal has more people sleeping outside (2.2 per 10,000 residents) than Toronto (1.6) or Calgary (1.5), but fewer than Vancouver (with 8.4) and Edmonton (8.8).
� About a quarter of the 3,016 people – 784 – had been chronically homeless for 4 years or more. Almost half – 1,357 – were episodically homeless, having been homeless at least twice in the past three years.

vi
�� We collected and analyzed a total of 1,097 questionnaires from people who spent the night outside (177), in emergency shelters (552), in transitional housing (307) and elsewhere (61).
� Nearly a quarter (24%) of the people who had been identified as homeless in those places were women. The proportions vary according to the kind of place, reaching 54% among those in transitional housing and only 7% among those unsheltered.
� Immigrants represent 16% of our sample, with women accounting for 39% of this group – a much higher proportion than the 24% we found in our overall sample of 1,097 people. Female immigrants were more likely to have children under 18 with them: 22% were in that situation, compared to 10% for the general population.
� Aboriginals make up 10% of our sample, although they constitute only 0.6% of the total Montreal population. The Inuit represent 41% of Aboriginal sample, although they make up only 10% of Montreal’s Aboriginal population.
� Veterans make up 6% of our sample. This is very similar to the 7% found in the 2013 Toronto survey. Veterans account for 2.6% of the Canadian population 20 and over.
� Social assistance benefits (aide sociale or solidarité sociale) constitute by far the most important source of income for homeless people. Employment rates were highest among the residents of transitional housing, but do not exceed 10%.
� Two main reasons were given for the most recent transition into homelessness: financial problems and drug or alcohol dependency. Among women and immigrants, violence and abuse were more likely causes of homelessness than alcohol or drugs.
� We counted 356 “hidden homeless” people in Montreal, spread almost equally among those staying with others and those living in rooming houses. This number represents only a small fraction of the “hidden homeless”. It is very hard to estimate their exact number.
� Compared to respondents in the other categories, the hidden homeless that we identified are much more likely to use day centres and soup kitchens or food banks, and less likely to turn to shelters. They report physical health problems more often, but do not go to hospitals or emergency clinics as often. They use crisis centres less often, contact the police less often, and use substance abuse services less often. In other respects, they are similar to the other homeless people we identified.

vii
TABLE OF CONTENTS
KEY FINDINGS ......................................................................................................... v
TABLE OF CONTENTS ............................................................................................ vii LIST OF TABLES..................................................................................................... viii LIST OF FIGURES ..................................................................................................... ix
ACKNOWLEDGEMENTS ........................................................................................... x
I. INTRODUCTION .................................................................................................. 1
II. METHODOLOGY ................................................................................................. 2
1. Outdoor locations and shelters ........................................................................................... 3
2. Transitional housing ............................................................................................................. 5
3. Day centres and soup kitchens ............................................................................................ 5
4. Other homeless people ........................................................................................................ 6
5. Data analysis ........................................................................................................................ 6
5.1 Reclassifying the questionnaires................................................................................... 6
5.2 Estimating the number of unsheltered people ............................................................. 7
5.3 Reporting the results ..................................................................................................... 8
III. RESULTS ........................................................................................................... 8
1. How the count was conducted .............................................................................................. 8
1.1 Outdoor locations and shelters ...................................................................................... 8
1.2 Transitional housing ....................................................................................................... 9
1.3 Day centres and soup kitchens ..................................................................................... 11
1.4 Data obtained from additional facilities ....................................................................... 11
2. Estimated number of homeless people, other than hidden homeless ............................... 12
3. Analysis of questionnaire data – visible homelessness ....................................................... 13
3.1 Breakdown by sex and homelessness category ........................................................... 13
3.2 Breakdown by age ........................................................................................................ 13
3.3 Breakdown by birthplace .............................................................................................. 15
3.4 Composition of the Aboriginal part of the sample ........................................................ 18
3.5 Length and chronicity of homelessness episodes ........................................................ 19
3.6 Previous service in the Canadian Armed Forces .......................................................... 21
3.7 Accompanying children ................................................................................................ 21

viii
3.8 Services used during the past six months .................................................................... 22
3.9 Reasons for the current episode of homelessness ...................................................... 25
3.10 Sources of income ...................................................................................................... 31
4. Analysis of questionnaire data – hidden homelessness ....................................................... 35
IV. DISCUSSION .....................................................................................................40
REFERENCES ..........................................................................................................48
APPENDIX A: Questionnaires ................................................................................49
APPENDIX B: Organizations and facilities we contacted ........................................59
APPENDIX C: Method for estimating the number of people who spent the night of March 24 unsheltered ...........................................................................................68
LIST OF TABLES
Table 1. Categories of homelessness based on the Canadian classification ................................................ 2 Table 2. Number of questionnaires and additional number of people identified as being clearly homeless, by borough, on the evening of March 24 .................................................................... 10 Table 3. Estimated number of homeless people in Montreal on March 24, 2015 ..................................... 12 Table 4. Percentages of Aboriginals and breakdown by homelessness category ...................................... 19 Table 5. Services used during the past 6 months, by homelessness category ........................................... 22 Table 6. Breakdown by homelessness category of reasons for current episode of homelessness ............ 26 Table 7. Sources of income by homelessness category ............................................................................. 32 Table 8. Type of location where questionnaires in hidden homelessness category were collected, by type of place where night of March 24 was spent ............................................................................... 35 Table 9. Comparison of the samples of visible homelessness and hidden homelessness ......................... 36 Table 10. Numbers of homeless people in Montreal compared to other major Canadian cities that carried out street counts ............................................................................................................. 43

ix
LIST OF FIGURES
Figure 1. Breakdown by sex and homelessness category ........................................................................ 13 Figure 2. Breakdown by age and homelessness category ....................................................................... 14 Figure 3. Breakdown of women by age .................................................................................................... 14 Figure 4. Breakdown of immigrants by age ............................................................................................. 15 Figure 5. Breakdown of Aboriginals by age .............................................................................................. 15 Figure 6. Breakdown by birthplace and homelessness category ............................................................. 16 Figure 7. Breakdown by birthplace of women ......................................................................................... 16 Figure 8. Breakdown of Aboriginals by birthplace ................................................................................... 17 Figure 9. Immigrants’ main countries of origin ........................................................................................ 17 Figure 10. Breakdown of immigrants by immigration status..................................................................... 18 Figure 11. Breakdown of immigrants by length of residence in Canada ................................................... 18 Figure 12. Breakdown by length and type of homelessness ..................................................................... 19 Figure 13. Breakdown of the number of homelessness episodes of people who had been homeless for less than three years, by homelessness category ..................................................................... 20 Figure 14. Breakdown by chronicity of homelessness and homelessness category ................................. 20 Figure 15. Breakdown by age of veterans.................................................................................................. 21 Figure 16. Breakdown of the respondents who said they had one or more children with them the night of March 24, by number of children ......................................................................................... 21 Figure 17. Breakdown by sex of services used during the past six months ............................................... 23 Figure 18. Breakdown by immigrant status of services used during the past six months ......................... 24 Figure 19. Breakdown by Aboriginal status of services used during the past six months ......................... 25 Figure 21. Breakdown by age of reasons for current episode of homelessness ....................................... 28 Figure 22. Breakdown by sex of reasons for current episode of homelessness ........................................ 29 Figure 23. Breakdown by immigrant status of reasons for current episode of homelessness ................. 30 Figure 24. Breakdown by Aboriginal status of reasons for current episode of homelessness .................. 31 Figure 25. Breakdown of income sources by sex ....................................................................................... 33 Figure 26. Breakdown of income sources by immigrant status ................................................................. 34 Figure 27. Breakdown of income sources by Aboriginal status ................................................................. 34 Figure 28. Comparison of services used in the past six months, by hidden vs visible homelessness ....... 37 Figure 29. Comparison of the reasons for homelessness by category: hidden or visible homelessness .. 38 Figure 30. Comparison of income sources by homelessness category: hidden or visible ......................... 39

x
ACKNOWLEDGEMENTS
In addition to the project team, Scientific Committee and Steering Committee, this report represents the collective effort of a great many people. Representatives of over a dozen organizations, including in particular organizations working with women, young people, Aboriginals and immigrants, met with us before the count and helped shape its design and execution. Leaders of other organizations and many of their members helped us build and refine the questionnaire. Some 540 volunteers as well as some street workers were on hand the evening of March 24, and 125 on March 25 and 26. Together with people from dozens of service providers, they filled out about 1,500 questionnaires with homeless people who gave generously of their time. Some sixty other volunteers helped with training, media liaison and many other tasks. Over a hundred people from almost as many shelters, transitional housing providers, therapy centres, hospitals and detention centres agreed to share data with us on the homeless people they sheltered on the night of March 24. Phil Brown, who had been responsible for previous street counts in Toronto, and Fernando Miranda, who is responsible for street counts in New York, generously offered us their advice. We thank all of them most sincerely.
1
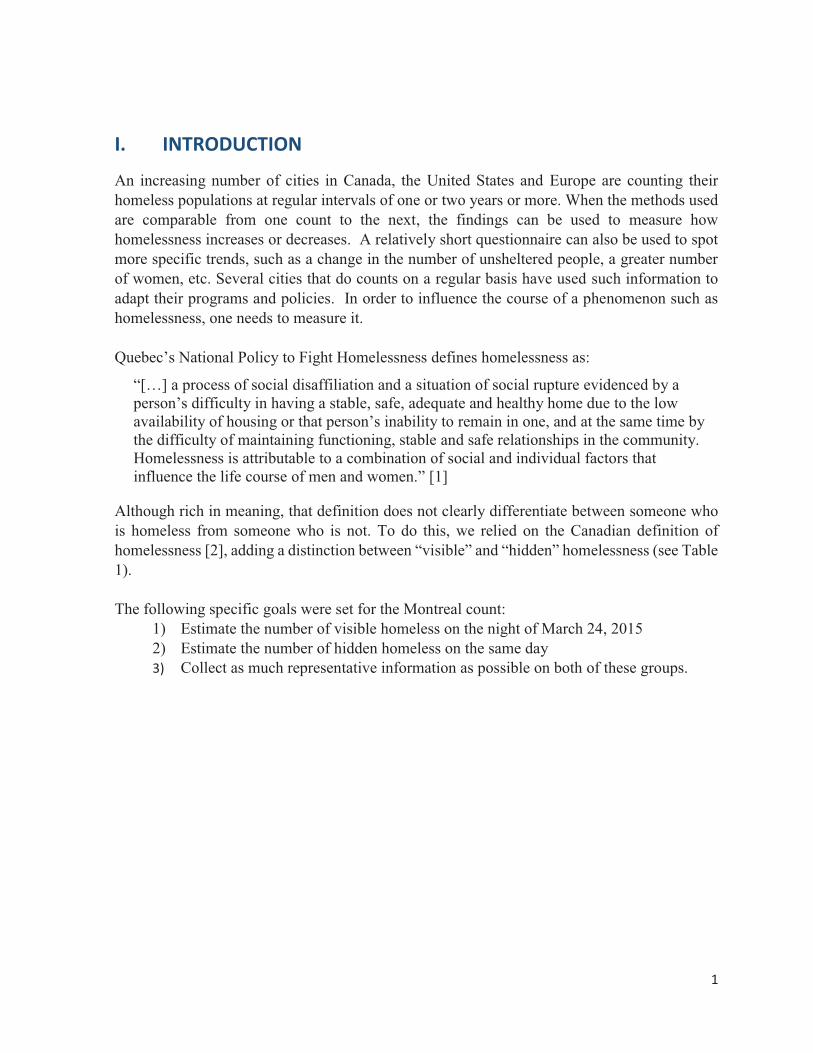
I. INTRODUCTION
An increasing number of cities in Canada, the United States and Europe are counting their homeless populations at regular intervals of one or two years or more. When the methods used are comparable from one count to the next, the findings can be used to measure how homelessness increases or decreases. A relatively short questionnaire can also be used to spot more specific trends, such as a change in the number of unsheltered people, a greater number of women, etc. Several cities that do counts on a regular basis have used such information to adapt their programs and policies. In order to influence the course of a phenomenon such as homelessness, one needs to measure it. Quebec’s National Policy to Fight Homelessness defines homelessness as:
“[…] a process of social disaffiliation and a situation of social rupture evidenced by a person’s difficulty in having a stable, safe, adequate and healthy home due to the low availability of housing or that person’s inability to remain in one, and at the same time by the difficulty of maintaining functioning, stable and safe relationships in the community. Homelessness is attributable to a combination of social and individual factors that influence the life course of men and women.” [1]
Although rich in meaning, that definition does not clearly differentiate between someone who is homeless from someone who is not. To do this, we relied on the Canadian definition of homelessness [2], adding a distinction between “visible” and “hidden” homelessness (see Table 1).
The following specific goals were set for the Montreal count:
1) Estimate the number of visible homeless on the night of March 24, 2015 2) Estimate the number of hidden homeless on the same day 3) Collect as much representative information as possible on both of these groups.

2
Table 1. Categories of homelessness based on the Canadian classification
Unsheltered Emergency sheltered Provisionally accommodated
Visible homeless Hidden homeless
1.1 In public or private spaces without consent or contract
2.1 In emergency overnight shelters for homeless people
3.1
In interim housing for homeless people
3.2 Living temporarily with others, but without guarantee of continued residence
1.2 In places not intended for permanent human habitation
2.2 In shelters for individuals/families impacted by family violence
3.4 In institutional care, lacking permanent housing
3.3 In temporary and short-term rental accommodations
3.5 Accommodation/ reception centres for recently arrived immigrants and refugees
II. METHODOLOGY
We collected and synthesized information from many different sources in order to decide on the methods we would use to meet our goals:
a) Written descriptions of the methods used for point-in-time counts in several cities (including Toronto, Vancouver, New York and Boston) and the “national” methodology developed by Dr. Stephen Gaetz and Dr. Alina Turner [3-9]
b) Direct observation of counts in Toronto (in April 2013), New York and Boston (in February 2015), and conversations with the people responsible for those counts
c) Many consultations with representatives of organizations that work with homeless people in Montreal, as well as with street workers
d) Additional consultations with members of the project’s Steering Committee e) Consultations with members of the project’s Scientific Committee
The findings in this report are the result of a data gathering process composed of four separate activities:
a) Outdoor locations and shelters: During the evening of March 24, some 550 volunteers and a score of street workers spread out through many of the streets and subway stations. They also visited many shelters on the island of Montreal. In the outdoor locations they counted the people who identified themselves as being homeless or who were clearly so and filled in the questionnaire with those who agreed. The shelters gave us the number of people who had spent the night of March 24 there, and helped get our questionnaires answered by residents who were willing to answer them.

3
b) Transitional housing: More questionnaires were filled out by the residents of 24 transitional housing resources and one therapy centre.
c) Day centres and soup kitchens: On March 25 and 26, 125 volunteers were deployed among 50 day centres and soup kitchens.
d) Other homeless people: between March 29 and June 5 we contacted hospitals, provincial jails, crisis centres, therapy centres and various housing providers in Montreal that had not been included before, to find out how many homeless people had been there on the night of March 24. We also contacted therapy centres outside of Montreal that might have sheltered homeless people from Montreal.
1. Outdoor locations and shelters For the outdoor count, we decided to cover the whole of the greater downtown area plus several additional sectors that various sources (Service de Police de la Ville de Montréal or SPVM, street workers, interviewers and researchers working in the area of homelessness, etc.) said were likely to contain visibly homeless people in outdoor locations. We also covered the interiors of all subway stations on the island of Montreal and some parts of the underground city.
We also asked teams of volunteers to try to meet homeless people in restaurants along their routes where homeless people had been known to go in the evenings. Some 40 restaurants were contacted before the count started, and volunteer teams were asked to include those restaurants on their routes.
We started to recruit volunteers for the count in outdoor locations and shelters on February 17, when we launched our registration website. An intense media campaign led to 1,049 volunteer registrations (including 250 team leaders and 480 interviewers) within a couple of weeks. We then stopped recruiting.
Two training sessions for the volunteers were organized. In the evenings of March 17 and 18 – one week before the count – team leaders were invited to the Downtown YMCA where they were split into two groups each evening and instructed for two hours on how the count was to be carried out, on the questionnaire and on how to stay safe. Street workers explained how homeless people should be approached. At that time each team leader was assigned the sector, subway stations or shelter(s) he or she was to cover on March 24. We kept some team leaders in reserve to cover for absentees on the night of the event. Only people who had attended the training sessions on March 17 and 18 were accepted as team leaders for the count.
We did the count in outdoor locations and shelters on the evening of Tuesday March 24 (mainly from 8 to 11 pm).1 We used four deployment centres. The teams that were going to cover the outdoor locations met at either the Downtown YMCA or the Hochelaga-Maisonneuve YMCA, depending on where their sector was located. The teams headed for the subway stations met at the offices of the Société de Transport de Montréal in Place Dupuis. The teams assigned to the shelters met at the Old Brewery Mission. At each meeting point a brief training session for all
1 We did the count at La Maison du Père in the afternoon.

4
the volunteers, including team leaders, touched on the same points as those the team leaders had received, although in shortened form.
The volunteers were supposed to approach everyone they met without trying to guess who was homeless and who was not. To avoid duplication, the volunteers first checked that the people they spoke to had not already responded to the “I Count MTL” questionnaire. The initial questions were aimed at identifying respondents who either had no fixed address or who said they had one that was in fact not really permanent (e.g. a shelter or a rooming house). People who had no intention of going home (to avoid abuse or unsanitary conditions, for example) were also eligible to be counted. Those eligibility criteria matched the objectives of the exercise, which included collecting information on the hidden homeless.
The same procedure was followed in the subway stations. Each team was responsible for about four stations. They were required to cover each station in its entirety, up to the swinging doors that block access to the stations at night. They were told not to approach travelers.
Some sections of Montreal’s underground city (the Desjardins complex, Central Station, the main bus station, the Palais des congrès) were also included.
The questionnaires aimed at eligible people touched on demographic characteristics, homelessness history, reasons for the most recent episode of homelessness, services used in the past six months, and sources of income. (See the questionnaires in Appendix A.)
At the end of the interview, volunteers gave respondents the choice between a coffee gift card worth $2 or a granola bar. The thank-you gifts were worth very little, to minimize the incentive to respond to the questionnaire multiple times.
When someone did not want to be approached, was asleep or intoxicated or behaved in a threatening manner, the volunteers were asked to decide whether the person was obviously homeless. They had been instructed to consider someone clearly homeless only if (1) that person had settled down for the night in an outdoor location, or (2) that person’s appearance suggested he or she was homeless and he or she was dragging a lot of personal belongings along – possibly in plastic bags or a grocery cart. The volunteers had to record, as best they could, the sex and approximate age of every person they identified as such on their tally sheets.
Some specific areas had been designated as potentially more risky for a team of inexperienced volunteers. Street workers were sent to those areas, where they also invited people who were identified as homeless to answer the questionnaire.
On the West Island and in the North of Montreal, representatives of agencies working with the homeless (Action Jeunesse de l’Ouest-de-l’Île and RAP Jeunesse, respectively) went with the volunteers to areas they thought homeless people would be most likely to frequent on the night of the count.
In addition, 50 people pretending to be homeless (we called them “decoys”) were deployed among the sectors and subway stations. They were asked to remain in the location they had been assigned to from 8 to 11 pm and wait to see whether the volunteer teams approached them. As in Toronto’s and New York City’s counts, that facet of the methodology served two

5
purposes: (1) to spur the teams to approach as many people as possible; and (2) to estimate the proportion of homeless people that the volunteer teams had missed. That proportion was later used to adjust the estimated number of people present on the streets.
Volunteer teams also went to nine shelters, where they filled out the questionnaires with as many people as possible. In the following days the shelters also had to report how many people had been there during the night of March 24 and classify them in terms of sex, age and Aboriginal status. They also had to report how many people had been turned away that evening. The shelters that took part in the count are listed in Appendix B.
2. Transitional housing To prepare for the count, 24 organizations providing transitional housing were identified and agreed to work with us. (They are also listed in Appendix B.) We were looking for limited-stay residential settings, including those with time limits that stretched to 3 or even 5 years. Staff agreed to fill in the questionnaires with all the residents who had spent the night of March 24 there and were willing to participate. One therapy centre, Dianova, offered to transport a volunteer to their location so that questionnaires could be filled in on March 24. We obtained information from the other therapy centres during the following months.
3. Day centres and soup kitchens We wanted to find the largest possible number of hidden homeless, so we added to the March 24 count an additional count on March 25 and 26 in day centres and soup kitchens on the island of Montreal. A total of 50 such service providers agreed to work with us – almost all of the ones we had targeted. (The list of these is also included in Appendix B.)
The volunteers for March 25 and 26 were recruited both from the main website and through an informal referral network. There were no team leaders for the day centres and soup kitchens. Four groups of volunteers received training, two in the evening of March 23 and two in the evening of March 24. The hour-long sessions focused on the goals of the exercise, how to act in the field, and on the questionnaire, with a half-hour run-through of the questionnaire. Some of the service providers preferred to have their staff members administer the questionnaires, so we sent members of our team to give them a short training.
The questionnaire that we distributed to the day centres and soup kitchens on March 25 and 26 included a question about where the respondent had spent the night of March 24. That allowed us to distinguish between people who had spent the night unsheltered, in transitional housing, hospitals or elsewhere from those who had stayed in rooming houses, with acquaintances (“couch-surfing”) or in a hotel or motel.

6
4. Other homeless people Time constraints and logistical difficulties kept us from sending volunteers to prisons or hospitals, and on March 24 we only tried to administer questionnaires in one therapy centre outside of Montreal.
We contacted all of the following in April, May and June in order to get a more complete count:
� all the hospitals in Montreal � provincial jails/detention centres in Montreal and the SPVM operations centres � all the shelters and transitional housing facilities that had not been included in the
March 24 count � all shelters for women victims of violence � all crisis centres � all therapy centres – including those outside Montreal – that welcome homeless people
(except the one we did get to on March 24)
For all of these we tried to obtain at least the number of people with no fixed address who had stayed there on the night of March 24. A few of the institutions or service providers chose, consistent with the law governing the release of private information, to give us only the addresses of their March 24 residents, leaving it to us to determine which of them were homeless. In these cases, we had to check each address to see whether it corresponded to some form of shelter or transitional housing. From the therapy centres outside of the island of Montreal we obtained only the number of people who had been homeless in Montreal when they began their stay at the centre. Whenever possible, we also obtained the age and sex of those people.
The places in question are all listed in Appendix B.
5. Data analysis
5.1 Reclassifying the questionnaires
The first purpose of the data analysis was to estimate how many people were homeless on the night of March 24, broken down according to each of the categories in Table 1.
To achieve that goal each questionnaire had to be assigned to a category, based on where the person had spent the night of March 24. Here is the procedure we followed:
1) In the questionnaire used for outdoor locations, one question (addressed to people with no fixed address2) was about where that person expected to spend the night of March 24. If that place fell into one of the other categories, we reclassified the questionnaire accordingly. For example, if someone was going to spend the night in a rooming house, that person’s questionnaire was classified as “hidden homeless.”
2 As previously noted, rooming houses were not considered to be a permanent residence for the purposes of this
count. Although some people stay in the same rooming house indefinitely, leases for this type of residence are generally short and tenancy rights are not as well protected as when a regular lease has been signed.

7
2) In the same way, the questionnaires we used in the day centres and soup kitchens on
March 25 and 26 asked where respondents had spent the night of March 24 and were put into the category that matched the answer. If someone had spent the night in the street, for example, that person’s questionnaire was put into the “outdoor locations” group.
3) If no answer was given to the question as to where the respondent had spent the night
of March 24, and if the questioning was done in a residential location such as a shelter or therapy centre, we considered that the person had spent the night of March 24 in the place where the questionnaire was filled in.
4) Since we were not able to speak to people who were observed outdoors and listed on
the tally sheets as clearly homeless, we initially assumed that such people had spent the night in an unsheltered location.3
5) We assumed that anyone who filled in a questionnaire in a shelter or transitional
housing had spent the night of March 24 there. However, it should be noted that the questionnaire was only given to people who stated that they had no fixed address (apartment, house or other residence with a fixed-term or indeterminate lease) where they could have spent the night had they so wished.
6) In many transitional housing locations and some shelters the questionnaires were only
handed out on March 25 or 26. If the respondent had spent the night somewhere else, the questionnaire was reclassified accordingly.
7) Questionnaires that did not indicate where the respondent had spent the night of March
24 were classified as “unknown”.
5.2 Estimating the number of unsheltered people
We made three adjustments to the number of people considered to have spent the night of March 24 unsheltered. The first took into account the sectors that volunteer teams had not covered, and the second, the percentage of decoys that the teams found. The third adjustment was based on the fact that several people who were approached in outdoor locations on the evening of March 24 said they did not intend to stay outside, while others (a smaller number) who were approached on March 25 or 26 said they had in fact spent the night of March 24 outside. These adjustments are explained in Appendix C.
3 However, as described in Appendix C, these people were ultimately redistributed among the various homelessness categories.
8
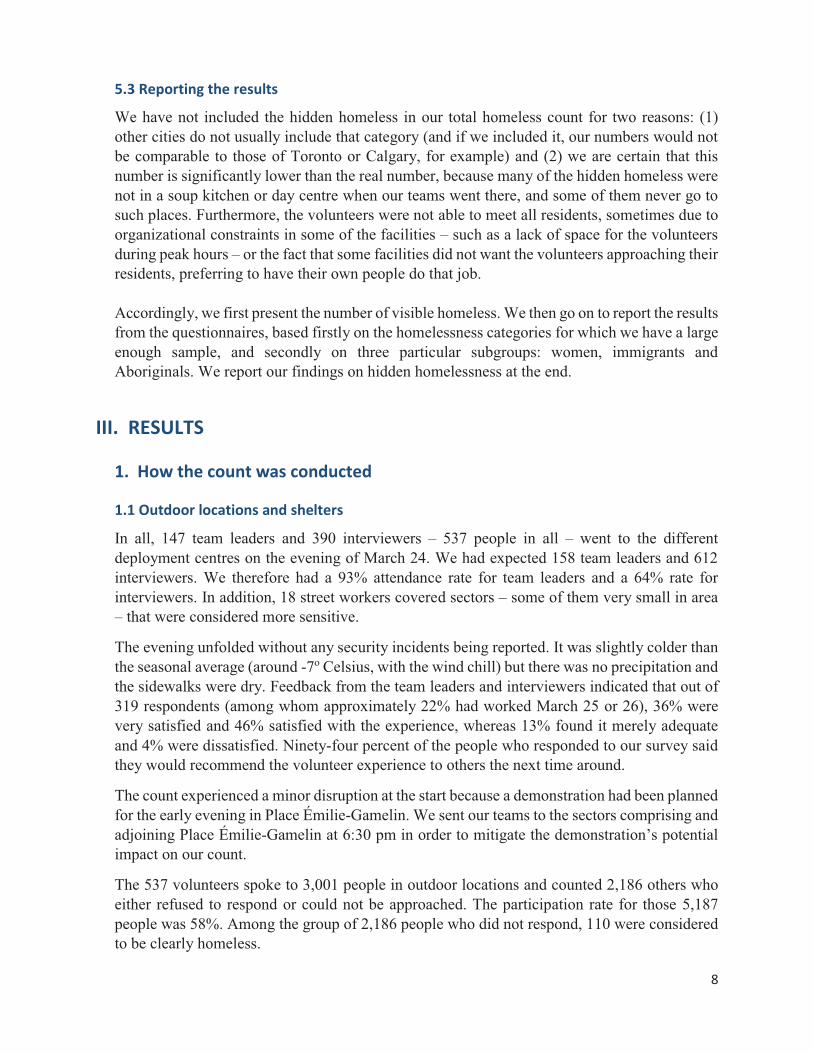
5.3 Reporting the results
We have not included the hidden homeless in our total homeless count for two reasons: (1) other cities do not usually include that category (and if we included it, our numbers would not be comparable to those of Toronto or Calgary, for example) and (2) we are certain that this number is significantly lower than the real number, because many of the hidden homeless were not in a soup kitchen or day centre when our teams went there, and some of them never go to such places. Furthermore, the volunteers were not able to meet all residents, sometimes due to organizational constraints in some of the facilities – such as a lack of space for the volunteers during peak hours – or the fact that some facilities did not want the volunteers approaching their residents, preferring to have their own people do that job. Accordingly, we first present the number of visible homeless. We then go on to report the results from the questionnaires, based firstly on the homelessness categories for which we have a large enough sample, and secondly on three particular subgroups: women, immigrants and Aboriginals. We report our findings on hidden homelessness at the end.
III. RESULTS
1. How the count was conducted
1.1 Outdoor locations and shelters
In all, 147 team leaders and 390 interviewers – 537 people in all – went to the different deployment centres on the evening of March 24. We had expected 158 team leaders and 612 interviewers. We therefore had a 93% attendance rate for team leaders and a 64% rate for interviewers. In addition, 18 street workers covered sectors – some of them very small in area – that were considered more sensitive.
The evening unfolded without any security incidents being reported. It was slightly colder than the seasonal average (around -7o Celsius, with the wind chill) but there was no precipitation and the sidewalks were dry. Feedback from the team leaders and interviewers indicated that out of 319 respondents (among whom approximately 22% had worked March 25 or 26), 36% were very satisfied and 46% satisfied with the experience, whereas 13% found it merely adequate and 4% were dissatisfied. Ninety-four percent of the people who responded to our survey said they would recommend the volunteer experience to others the next time around.
The count experienced a minor disruption at the start because a demonstration had been planned for the early evening in Place Émilie-Gamelin. We sent our teams to the sectors comprising and adjoining Place Émilie-Gamelin at 6:30 pm in order to mitigate the demonstration’s potential impact on our count.
The 537 volunteers spoke to 3,001 people in outdoor locations and counted 2,186 others who either refused to respond or could not be approached. The participation rate for those 5,187 people was 58%. Among the group of 2,186 people who did not respond, 110 were considered to be clearly homeless.

9
As planned, 50 decoys were placed into position – 47 people who normally sell L’Itinéraire (a magazine on homelessness) and 3 men in their twenties, not associated with L’Itinéraire. Among the 50, 46 were assigned to sectors that were eventually covered by the volunteer teams, and 31 of these (67.4%), were approached.4 Interviews with the team leaders right after the count revealed that the decoys did not always follow the instructions they had been given.5
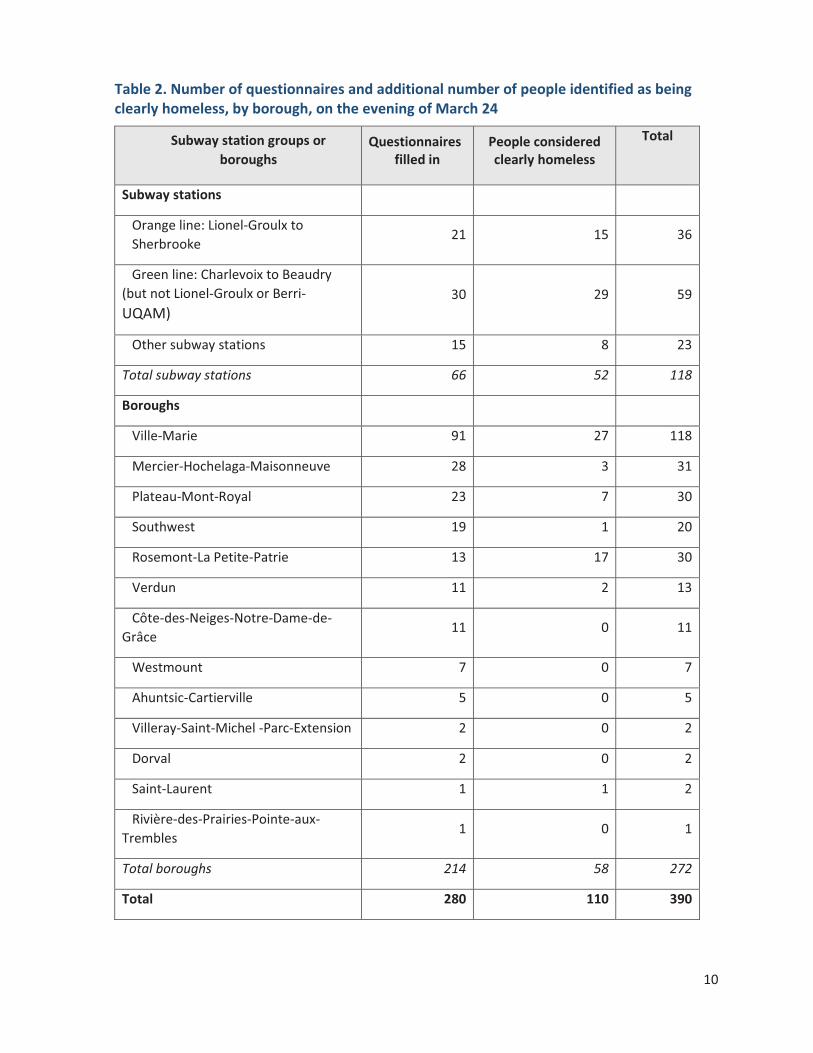
Table 2 shows the number of questionnaires collected and the number of people identified as clearly homeless, by borough and by subway station groups. The number of homeless was particularly high in the Ville-Marie borough: 118 out of 390, or 30% (not counting the subway stations). We also see that people identified as homeless in the subway stations were concentrated inside and just on the periphery of the “beltway” that the Orange and Green lines form between the Lionel-Groulx and Berri-UQAM interchange stations: 85 out of 118 people, or 81%.
Volunteers and street workers covered all the subway stations and 76% of the sectors we had planned to survey, i.e. 140 out of 184. The sectors that were not covered were spread over various boroughs, including some with a high number of homeless people.
From March 24 to 26, 312 questionnaires were filled in by eligible respondents in the 9 shelters we had identified and which had agreed to work with us. When we add the 240 questionnaires filled in elsewhere (particularly in soup kitchens and day centres) we get a total of 552 questionnaires filled in by people who spent the night of March 24 in shelters. From the tally sheets and additional information obtained afterwards, we learned that 1,066 people spent the night of March 24 in a shelter, which means that 52% of them filled in a questionnaire.6
1.2 Transitional housing
We received 329 questionnaires from the residents of 24 transitional housing organizations that had agreed to participate. However, not all of those residents had spent the night of March 24 in those locations; after reclassification only 299 questionnaires were attributed to them. From the tally sheets and subsequent information we counted a total of 1,041 people in transitional housing during the night of March 24, which means that 29% of the residents filled in a questionnaire.
4 Toronto uses the same number of decoys. 58% of them were identified in 2006 and 78% in 2009; no figures are
given in the 2013 report. 5 Some were selling l’Itinéraire (although they had been instructed not to do so), which meant that the volunteers
were not sure whether to approach them. Some other decoys came up to volunteers and identified themselves. 6 As will be seen below in Section 1.4, we included centres for victims of violence and crisis centres in the
“shelters” category.
10
Table 2. Number of questionnaires and additional number of people identified as being clearly homeless, by borough, on the evening of March 24
Subway station groups or boroughs
Questionnaires filled in
People considered clearly homeless
Total
Subway stations
Orange line: Lionel-Groulx to Sherbrooke
21 15 36
Green line: Charlevoix to Beaudry (but not Lionel-Groulx or Berri-UQAM)
30 29 59
Other subway stations 15 8 23
Total subway stations 66 52 118
Boroughs
Ville-Marie 91 27 118
Mercier-Hochelaga-Maisonneuve 28 3 31
Plateau-Mont-Royal 23 7 30
Southwest 19 1 20
Rosemont-La Petite-Patrie 13 17 30
Verdun 11 2 13
Côte-des-Neiges-Notre-Dame-de-Grâce
11 0 11
Westmount 7 0 7
Ahuntsic-Cartierville 5 0 5
Villeray-Saint-Michel -Parc-Extension 2 0 2
Dorval 2 0 2
Saint-Laurent 1 1 2
Rivière-des-Prairies-Pointe-aux-Trembles
1 0 1
Total boroughs 214 58 272
Total 280 110 390

11
1.3 Day centres and soup kitchens
The 125 volunteers who went to the 50 day centres and soup kitchens that had agreed to participate in the count collected 560 questionnaires. Among these, 519, or 91%, indicated where people had spent the night of March 24. Close to one third (32%) of the 560 respondents said they had spent the night in a shelter, 22% in a rooming house, 20% stayed with other people and 11% were unsheltered. Only one person had spent the night in a hotel or motel. 42% of the questionnaires placed the respondents among the hidden homeless.
1.4 Data obtained from additional facilities
Data gathered after the count showed:
� 226 people in 23 facilities considered to be shelters, including 148 in 13 centres for victims of violence and 5 people staying at the YMCA after a fire or other such event
� 447 people in 25 additional organizations providing transitional housing, including 17 in two shelters for new arrivals
� 416 people in a category we called “other places”: 76 of these were in 11 hospitals, 46 in 3 detention centres, 5 spread out among the SPVM’s four operational centres, 144 in 11 therapy centres in Montreal and 157 in 24 therapy centres outside Montreal.
Once the questionnaires were reclassified, the following response rates for the “other places” category emerged:
� Hospitals: 10 out of 76, or 13% � Detention centres: 0%7 � Therapy centres in Montreal: 18 out of 154, or 11.7% � Therapy centres outside Montreal: 33 out of 199, or 17% � Category as a whole: 61 out of 458, or 13%
That means that the response rate in the “other places” category is particularly low. There was a fairly balanced distribution of questionnaires among the subgroups of that category, however: 82% of the questionnaires came from the therapy centres, which in fact represent 74% of all people in the category.
7 As previously mentioned, since we had only a short time to organize the count, we did not try to administer questionnaires in detention centres.

12
2. Estimated number of homeless people, other than hidden homeless Table 3 shows the breakdown of the number of homeless people, other than hidden homeless, in Montreal on the night of March 24, 2015. All the homelessness categories listed in Table 1 are included except 3.2 and 3.3.
Table 3. Estimated number of homeless people in Montreal on March 24, 2015
Identified during the
count1
Clearly homeless
Present but not
interviewed6 Adjustment
Facilities identified after the count7
Total
Unsheltered2 177 1103 1424 429
Emergency shelters5 552 288 226 1,066
Transitional housing8 307 287 447 1,041
Hospitals 10 66 76
Detention centres
0 51 51
Therapy centres in Montreal
18 136 154
Therapy centres outside Montreal
33 9 157 199
TOTAL 1,097 110 584 142 1,083 3,016
Notes: 1 Figures based on the questionnaires 2 As per the Canadian definition of homelessness, categories 1.1, 1.2 3 Number of people that the volunteers identified as clearly homeless 4 This adjustment takes into account sectors that were not covered, undetected decoys and the breakdown of
people found on the street in other shelter locations – see Appendix C for details as to how it was calculated 5 Categories 2.1 and 2.2, including crisis centres 6 These numbers were obtained by contacting the facilities where questionnaires had been used in order to find
out how many people had been in the facility during the night of March 24 but had not filled in the questionnaire
7 These numbers were obtained by contacting additional facilities after the count 8 Categories 3.1 and 3.5 (interim housing/reception centres for recently arrived immigrants and refugees)
13
3. Analysis of questionnaire data – visible homelessness This section contains the results obtained by analyzing the questionnaire data for people who spent the night of March 24 unsheltered, in emergency shelters, transitional housing and elsewhere (hospitals, detention centres, therapy centres). (Findings for hidden homelessness are in the next section). The information is presented primarily in chart form in this section to make reading easier.
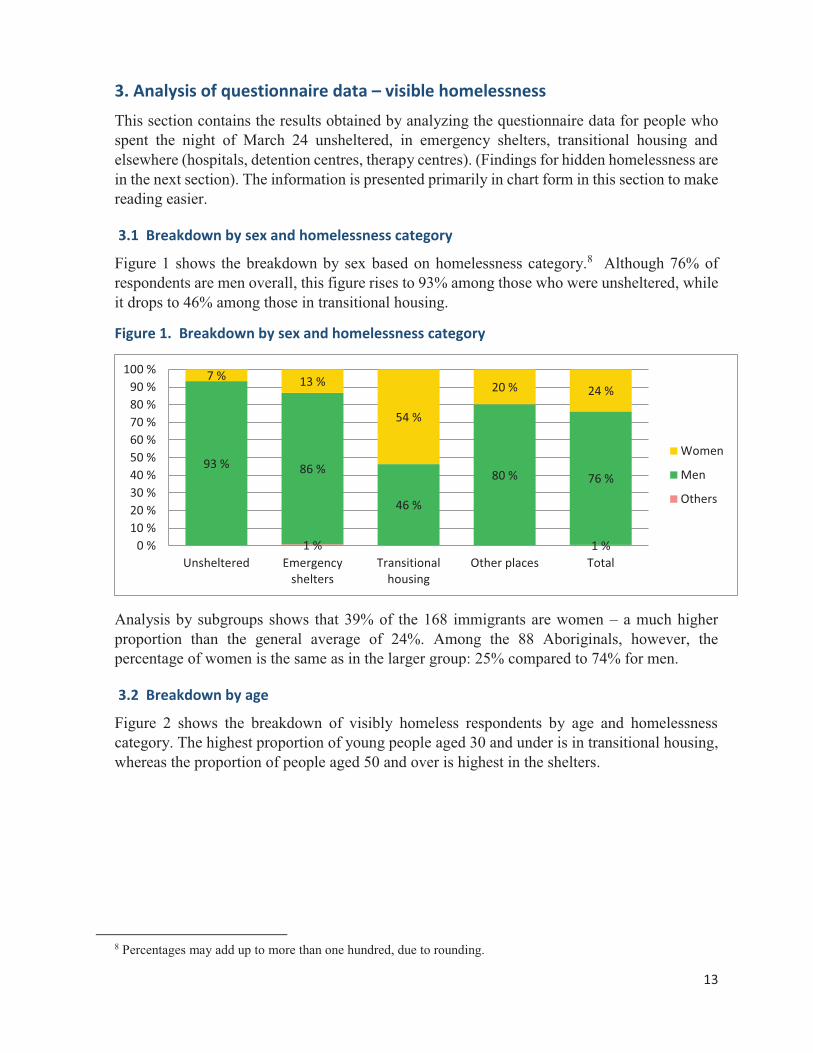
3.1 Breakdown by sex and homelessness category
Figure 1 shows the breakdown by sex based on homelessness category.8 Although 76% of respondents are men overall, this figure rises to 93% among those who were unsheltered, while it drops to 46% among those in transitional housing.
Figure 1. Breakdown by sex and homelessness category
Analysis by subgroups shows that 39% of the 168 immigrants are women – a much higher proportion than the general average of 24%. Among the 88 Aboriginals, however, the percentage of women is the same as in the larger group: 25% compared to 74% for men.
3.2 Breakdown by age
Figure 2 shows the breakdown of visibly homeless respondents by age and homelessness category. The highest proportion of young people aged 30 and under is in transitional housing, whereas the proportion of people aged 50 and over is highest in the shelters.
8 Percentages may add up to more than one hundred, due to rounding.
1 % 1 %
93 % 86 %
46 %
80 % 76 %
7 % 13 %
54 %
20 % 24 %
0 %10 %20 %30 %40 %50 %60 %70 %80 %90 %
100 %
Unsheltered Emergencyshelters
Transitionalhousing
Other places Total
Women
Men
Others

14
Figure 2. Breakdown by age and homelessness category
Figure 3 shows that homeless women tend to be younger than all the others: 27% of women are 30 or younger, compared to 19% of everyone in that age category taken together. Only 27% of women are 50 and older, compared to 41% for all respondents. The breakdown is similar to that seen in transitional housing, where women are strongly represented (Figure 1). Immigrants also tend to be relatively young (Figure 4). The same is true for Aboriginals (Figure 5).
Figure 3. Breakdown of women by age
44 % 49 %30 % 25 %
41 %
42 % 38 %
37 % 57 %39 %
14 % 14 %33 %
18 % 19 %
0 %10 %20 %30 %40 %50 %60 %70 %80 %90 %
100 %
Unsheltered Emergencyshelters
Transitionalhousing
Other places Total
30 and under31-4950 and over
27 %
45 %
27 %30 and under
31 - 49
50 and over
n = 251

15
Figure 4. Breakdown of immigrants by age
Figure 5. Breakdown of Aboriginals by age
3.3 Breakdown by birthplace
Figure 6 shows the breakdown by birthplace. In our sample, 44% were born in Montreal and 30% elsewhere in Quebec, for a total of 74%. People who were born elsewhere in Québec make up 43% of the “other places” category, which comprises mainly people in therapy centres (see Table 3). It should be noted, however, that that category only contains 61 people, so it is not necessarily representative of the whole population.
23%
44%
33%30 and under 31 - 49
50 and over
n=167
25 %
51 %
24 %30 and under
31 to 49
50 and over
n = 88

16
Figure 6. Breakdown by birthplace and homelessness category
Figure 7 reveals one material difference between the birthplaces of homeless women and those of the entire group: although immigrants represent 16% of the overall sample, among women that percentage rises to 27%.
Figure 7. Breakdown by birthplace of women
By contrast, and as expected, the breakdown of Aboriginals by birthplace shown in Figure 8 includes fewer people from Montreal and many more from elsewhere in Quebec than among the general population. (One of the two Aboriginals who were born abroad is from the United States, the other from Mexico.)
6 % 16 % 24 %8 % 16 %15 % 10 % 7 %
13 % 10 %34 % 31 % 24 % 43 % 30 %
45 % 44 % 45 % 36 % 44 %
0%10%20%30%40%50%60%70%80%90%
100%
Unsheltered Emergencyshelters
Transitionalhousing
Other places Total
In Montreal
Elsewhere inQuebecElsewhere inCanadaAbroad
n = 150, 537, 289,
38%
25%
10%
27% In Montreal
Elsewhere in Quebec
Elsewhere in Canada
Abroad
n = 246

17
Figure 8. Breakdown of Aboriginals by birthplace
Figure 9 shows immigrants’ main countries of origin. Haiti is the most heavily represented, with 26 people out of 171, or 15%.
Figure 9. Immigrants’ main countries of origin
22%
45%
31%
2%
In Montreal
Elsewhere in Quebec
Elsewhere in Canada
Abroad
n = 83
33333333
44
555
666
813
26
0 5 10 15 20 25 30
GermanyBelgiumGreece
Fr. GuianaItaly
PortugalRomania
TunisiaUK
LebanonPoland
Sri LankaVietnam
AlgeriaCameroon
FranceUSA
MoroccoHaiti
Number of respondentsn = 111 out of 171

18
Figure 10 goes on to show that approximately two-thirds of homeless immigrants are Canadian citizens, and almost all the others are permanent residents.
Figure 10. Breakdown of immigrants by immigration status
Figure 11 shows that more than 85% of the 135 immigrants who said the year they arrived in Canada arrived more than 5 years ago.
Figure 11. Breakdown of immigrants by length of residence in Canada
3.4 Composition of the Aboriginal part of the sample
Table 4 provides more detail on the characteristics of the Aboriginal people that we surveyed. Among the respondents, 10% are Aboriginals, among which 41% are Inuit. The breakdown by homelessness category is relatively imprecise due to the low number of respondents.
66 %
31 %
1 %1 % 1 % Canadian citizens
Permanent residents
Refugee claimants
Temporary foreignworkersForeign studentsn=153
14 %
28 %
39 %
19 %
Fewer than 5 years6 - 15 years16 - 35 yearsMore than 36 years
n= 135

19
Table 4. Percentages of Aboriginals and breakdown by homelessness category
Percentage of Aboriginals Breakdown of Aboriginals by group (%
among the Aboriginals who answered the question)
Non-Aboriginals Aboriginals
Status First
Nations
Non-status First
Nations Métis Inuit
n= 839 89 22 10 12 30
Unsheltered 141 87% 13% 27% 7% 13% 53%
Emergency shelters 472 89% 11% 36% 11% 15% 38%
Transitional housing 257 95% 5% 0% 30% 30% 40%
Other places 58 91% 9% 50% 50% 0% 0%
Total 928 90% 10% 30% 13% 16% 41%
3.5 Length and chronicity of homelessness episodes
Figure 12 depicts the length of the current episode by homelessness category. Note that unsheltered people tend to have the longest current episodes.
Figure 12. Breakdown by length and type of homelessness
Note: A length of exactly 7 months is classified in the “7 months to 1 year” group, and so on.
12 % 7 % 4 % 2 % 7 %
27 %15 % 16 % 13 %
17 %
32 %36 % 36 % 36 %
36 %
6 %11 % 11 % 9 %
10 %
19 % 25 % 26 % 38 % 25 %
3 % 5 % 7 % 2 % 5 %
0 %10 %20 %30 %40 %50 %60 %70 %80 %90 %
100 %
Unsheltered Emergencyshelters
Transitionalhousing
Other places Total
Less than 1month1 - 6 months
7 - 11 months
1 - 4 years
4 - 10 years
More than 10years
n= 146, 530, 278, 53, 1007
20
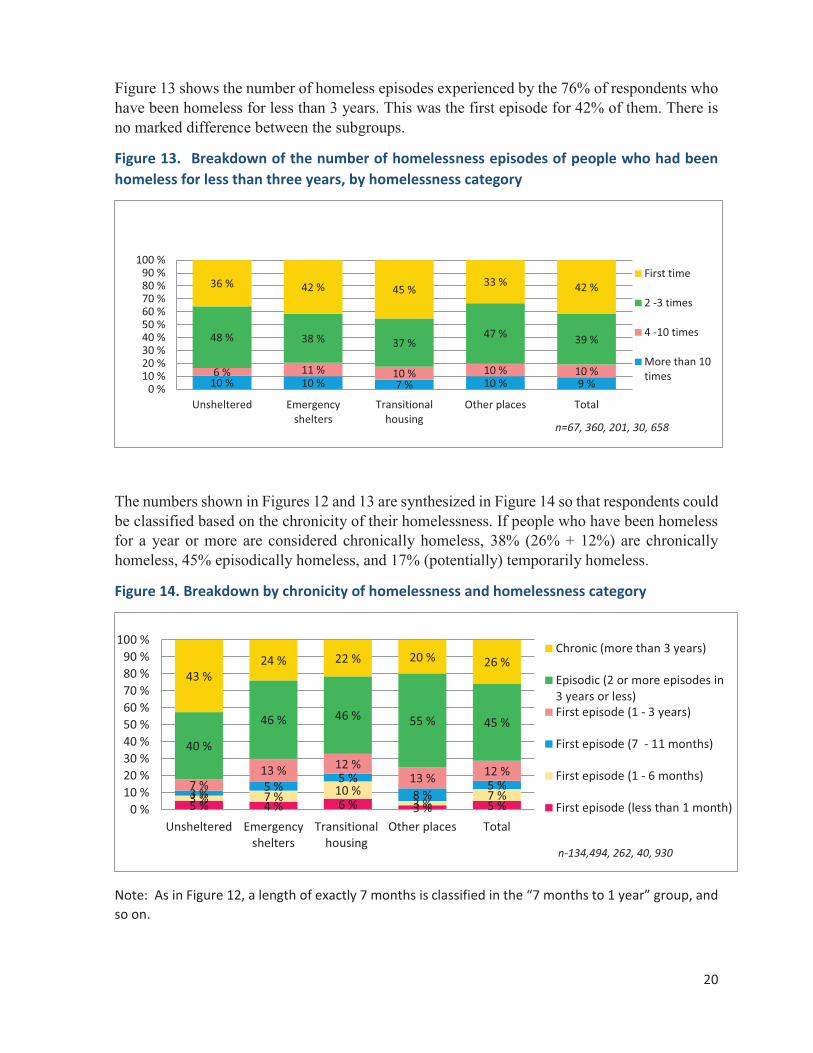
Figure 13 shows the number of homeless episodes experienced by the 76% of respondents who have been homeless for less than 3 years. This was the first episode for 42% of them. There is no marked difference between the subgroups.
Figure 13. Breakdown of the number of homelessness episodes of people who had been homeless for less than three years, by homelessness category
The numbers shown in Figures 12 and 13 are synthesized in Figure 14 so that respondents could be classified based on the chronicity of their homelessness. If people who have been homeless for a year or more are considered chronically homeless, 38% (26% + 12%) are chronically homeless, 45% episodically homeless, and 17% (potentially) temporarily homeless.
Figure 14. Breakdown by chronicity of homelessness and homelessness category
Note: As in Figure 12, a length of exactly 7 months is classified in the “7 months to 1 year” group, and so on.
10 % 10 % 7 % 10 % 9 %6 % 11 % 10 % 10 % 10 %
48 % 38 % 37 %47 % 39 %
36 % 42 % 45 %33 % 42 %
0 %10 %20 %30 %40 %50 %60 %70 %80 %90 %
100 %
Unsheltered Emergencyshelters
Transitionalhousing
Other places Total
First time
2 -3 times
4 -10 times
More than 10times
n=67, 360, 201, 30, 658
5 % 4 % 6 % 3 % 5 %3 % 7 % 10 %3 % 7 %3 % 5 %
5 %8 %
5 %7 %13 % 12 %
13 % 12 %
40 %
46 % 46 % 55 % 45 %
43 %24 % 22 % 20 % 26 %
0 %10 %20 %30 %40 %50 %60 %70 %80 %90 %
100 %
Unsheltered Emergencyshelters
Transitionalhousing
Other places Total
Chronic (more than 3 years)
Episodic (2 or more episodes in3 years or less)First episode (1 - 3 years)
First episode (7 - 11 months)
First episode (1 - 6 months)
First episode (less than 1 month)
n-134,494, 262, 40, 930

21
3.6 Previous service in the Canadian Armed Forces
Among the 1,047 respondents, 6% had served in the Canadian Armed Forces. That percentage dropped to 3% among transitional housing residents (mainly women) and rose to 9% among the unsheltered. As is shown in Figure 15, most veterans are 50 or older, although 11% are 30 or younger.
Figure 15. Breakdown by age of veterans
3.7 Accompanying children
Only 4% of respondents (38 people) said they had spent the night, or intended to spend the night, with one or more children. That proportion varies from 2% in the shelters to 8% in transitional housing. As expected, in most cases there was only one child (Figure 16).
It was to be expected that most people having one or more children with them would be women. That was so, but out of 38 people, only just over half (23) were women. Overall, 10% of the female respondents had one or more children with them.
Among 157 immigrants, 17 (11%), had one child or more with them. The percentage rises to 22% (14/61) if only female immigrants are considered.
Only 4 of the 81 Aboriginals who answered this question (5%) said they had one or more children with them on the night of March 24.
Figure 16. Breakdown of the respondents who said they had one or more children with them the night of March 24, by number of children
11 %
26 %
63 %
30 and younger31 - 4950 and older
n = 65
58 %19 %
10 %
13 %
1 child
2 children
3 childrenn = 31

22
3.8 Services used during the past six months
As shown in Table 5, the services most often reported as used during the 6 months before the interviews (by 74% of the respondents) were emergency shelters. This percentage is of course particularly high (91%) among people who said they had spent the night in such shelters. (It must be assumed that the question was misinterpreted by 9% of these respondents.) Next come day centres or soup kitchens (48%). Shelter residents, who as a rule cannot spend the day at the shelter, are most likely to report using them, while residents of transitional housing are least likely. Close to 40% of the respondents were hospitalized or went to an emergency room for physical health problems; this percentage was considerably lower among the unsheltered than among residents of transitional housing. Twenty-nine percent of the respondents reported having contact with the police during the past 6 months. Transitional housing residents made greater use of food banks (29% compared to the overall average of 17%). Transitional housing residents made very little use of crisis centres.
Table 5. Services used during the past 6 months, by homelessness category
Unsheltered Emergency shelters
Transitional housing
Other places Total
Service / n 165 552 295 60 1,072
Shelter/transition housing 40% 91% 68% 38% 74%
Day centre jour or soup kitchen 52% 60% 27% 33% 48%
Hospitalization or emergency room – physical health 21% 39% 51% 33% 39%
Police 26% 29% 28% 38% 29%
CLSC medical clinic (physical health) 31% 18% 34% 22% 24%
Prevention and harm reduction 24% 22% 18% 30% 21%
Detox centre or therapy centre 18% 19% 19% 35% 20%
Food bank 11% 14% 29% 13% 17%
CLSC medical clinic (mental health) 15% 12% 14% 67% 16%
Ambulance 10% 8% 16% 28% 12%
Crisis centre 13% 15% 4% 17% 12%
Hospitalization or emergency room – mental health 13% 12% 9% 15% 11%
Prison or penitentiary 7% 5% 12% 3% 7%
Note: respondents were allowed to check more than one box.

23
Figure 17 compares the services used by women with those used by men, combining all the homelessness categories. A few significant differences are to be noted: women are more likely to resort to food banks – recall that women are more likely to be in transitional housing and transitional housing residents are more likely to use food banks. Women are twice as likely to go to medical clinics or CLSCs for either physical or mental health reasons. They are much less likely to go to day centres or soup kitchens.
Figure 17. Breakdown by sex of services used during the past six months
3 %
14 %
13 %
18 %
5 %
10 %
22 %
19 %
55 %
14 %
14 %
27 %
21 %
76 %
3 %
6 %
8 %
10 %
13 %
17 %
21 %
22 %
27 %
29 %
29 %
34 %
36 %
69 %
0 % 20 % 40 % 60 % 80 %
No service
Prison or penitentiary
Prevention and harm reduction
Detox or therapy centre
Crisis centre
Hospitalization or emergency room -…
Police
Ambulance
Day centre or soup kitchen
CLSC (physical health)
CLSC (mental health)
Hospitalization or emergency room -…
Food bank
Shelter/transitional housing
Women Menn = 251, 805

24
Figure 18 compares the services used by immigrants with those used by non-immigrants, combining all the homelessness categories. The differences are less marked than between men and women. Immigrants seem more likely to use medical clinics – for both physical and mental problems – and less likely to use detox or therapy centres.
Figure 18. Breakdown by immigrant status of services used during the past six months
Figure 19 compares the services used by Aboriginals with those used by non-Aboriginals. With some exceptions (shelters, medical clinics or CLSCs for both mental and physical health, hospitalizations or emergency room visits for mental health problems), Aboriginals seem more likely to use services than non-Aboriginals. This is particularly true for prisons, police and ambulances.
3 %
13 %
8 %
12 %
18 %
11 %
20 %
22 %
17 %
25 %
31%
39%
49%
75%
2 %
5 %
5 %
8 %
10 %
12 %
18 %
18 %
22 %
24 %
24%
46%
47%
72%
0 % 10 % 20 % 30 % 40 % 50 % 60 % 70 % 80 %
No service
Prevention and harm reduction
Crisis centre
Prison or penitentiary
Detox or therapy centre
Hospitalization or emergency room - mental health
Ambulance
Police
CLSC (mental health)
Food bank (food hampers)
Hospitalization or emergency room - physical health
CLSC (physical health)
Day centre or soup kitchen
Shelter/transitional housing
Immigrants Non- immigrantsn = 165, 858

25
Figure 19. Breakdown by Aboriginal status of services used during the past six months
3.9 Reasons for the current episode of homelessness
Table 6 reports the responses given as to why people are currently homeless, by homelessness category. Respondents could check more than one answer. The most frequent reasons were: financial problems, drug or alcohol addiction, or eviction by landlord. Ten percent of respondents answered “personal choice.” It is interesting that being released from prison, hospital or a youth detention centre are rarely given as reasons.
8%
4%
18%
12%
11%
17%
11%
20%
20%
29%
24%
40%
47%
74%
0%
0%
8%
9%
14%
20%
24%
28%
31%
32%
33%
38%
60%
70%
0% 20% 40% 60% 80%
Crisis centre
No service
CLSC (mental health)
Hospitalization or ER - mental health
Prevention and harm reduction
Detox or therapy centre
Prison or penitentiary
Ambulance
Police
Hospitalization or ER - physical health
Food bank
CLSC (physical health)
Day centre or soup kitchen
Shelter/transitional housing
Aboriginals Non-Aboriginalsn = 88, 832

26
Table 6. Breakdown by homelessness category of reasons for current episode of homelessness
Unsheltered Emergency shelter
Transitional housing
Other places Total
Reason / n 164 548 295 53 1,060
Financial problem 32% 31% 24% 25% 29%
Drug/alcohol addiction 24% 15% 15% 40% 18%
Evicted by landlord 14% 13% 9% 9% 12%
Personal choice 11% 9% 10% 9% 10%
Mental health problem 10% 6% 15% 4% 9%
Violence/ Abuse 3% 7% 17% 2% 9%
Evicted by family or other residents 4% 7% 8% 6% 7%
Unsanitary conditions or infestation 5% 8% 3% 6% 6%
Separation 5% 6% 4% 2% 5%
Imprisonment 4% 5% 2% 8% 4%
Hospitalization 1% 2% 6% 9% 3%
Physical health problems 4% 3% 3% 0% 3%
Problems with roommates 2% 2% 2% 2% 2%
Gambling problems 1% 2% 3% 0% 2%
Family problems 0% 1% 4% 0% 2%
Loss of employment 2% 1% 1% 0% 1%
Fire 1% 1% 1% 0% 1%
Loss of a loved one 1% 1% 1% 2% 1%
Release from a youth centre 1% 0% 2% 0% 1%
Problems with landlord 0% 1% 0% 0% 0%
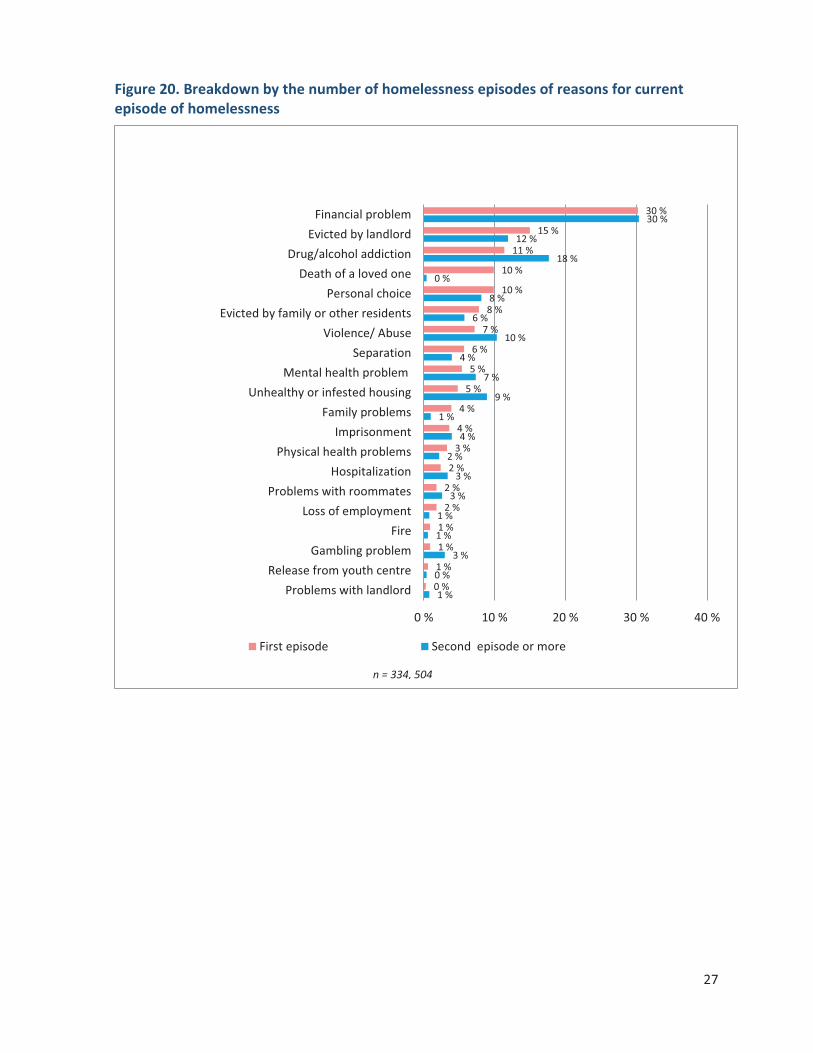
Would the reasons for the most recent homelessness be different between people for whom it was the first such episode and others? Figure 20 answers that question. Both groups responded similarly, with two exceptions: addiction is mentioned less frequently, and loss of a loved one more often when it is the first episode.
27
Figure 20. Breakdown by the number of homelessness episodes of reasons for current episode of homelessness
1 %
0 %
3 %
1 %
1 %
3 %
3 %
2 %
4 %
1 %
9 %
7 %
4 %
10 %
6 %
8 %
0 %
18 %
12 %
30 %
0 %
1 %
1 %
1 %
2 %
2 %
2 %
3 %
4 %
4 %
5 %
5 %
6 %
7 %
8 %
10 %
10 %
11 %
15 %
30 %
0 % 10 % 20 % 30 % 40 %
Problems with landlordRelease from youth centre
Gambling problemFire
Loss of employmentProblems with roommates
HospitalizationPhysical health problems
ImprisonmentFamily problems
Unhealthy or infested housingMental health problem
Separation Violence/ Abuse
Evicted by family or other residentsPersonal choice
Death of a loved one Drug/alcohol addiction
Evicted by landlordFinancial problem
First episode Second episode or more
n = 334, 504

28
Figure 21 makes a similar distinction between the reasons for homelessness based on age group. Younger people cite financial problems and addiction less often, but personal choice or eviction more often. It should be noted that only 6 (2%) of the 282 respondents of 30 or younger gave release from a youth centre as the reason for current homelessness. Physical health problems, violence and abuse are cited more often by people of 50 and older.
Figure 21. Breakdown by age of reasons for current episode of homelessness
2 %1 %
5 %5 %
1 %1 %
3 %1 %
0 %3 %
8 %5 %
1 %7 %
6 %18 %
4 %13 %
9 %32 %
1 %0 %
2 %2 %2 %2 %
1 %0 %0 %
5 %5 %6 %
1 %9 %
8 %20 %
5 %11 %
9 %31 %
0 %0 %1 %1 %1 %1 %1 %1 %
2 %3 %
4 %4 %
5 %8 %
9 %12 %
13 %13 %
16 %21 %
0% 10% 20% 30% 40%
Death of a loved oneProblems with landlord
Violence/ AbusePhysical health problem
Loss of employmentProblems with roommates
Gambling problemFire
Release from a youth centreImprisonment
Unhealthy or infested housing Separation
Family problems Mental health problem
Hospitalization Drug or alcohol addiction
Evicted by family or other residentsEvicted by landlord
Personal choiceFinancial problem
30 and under 31 - 49 50 and over
29
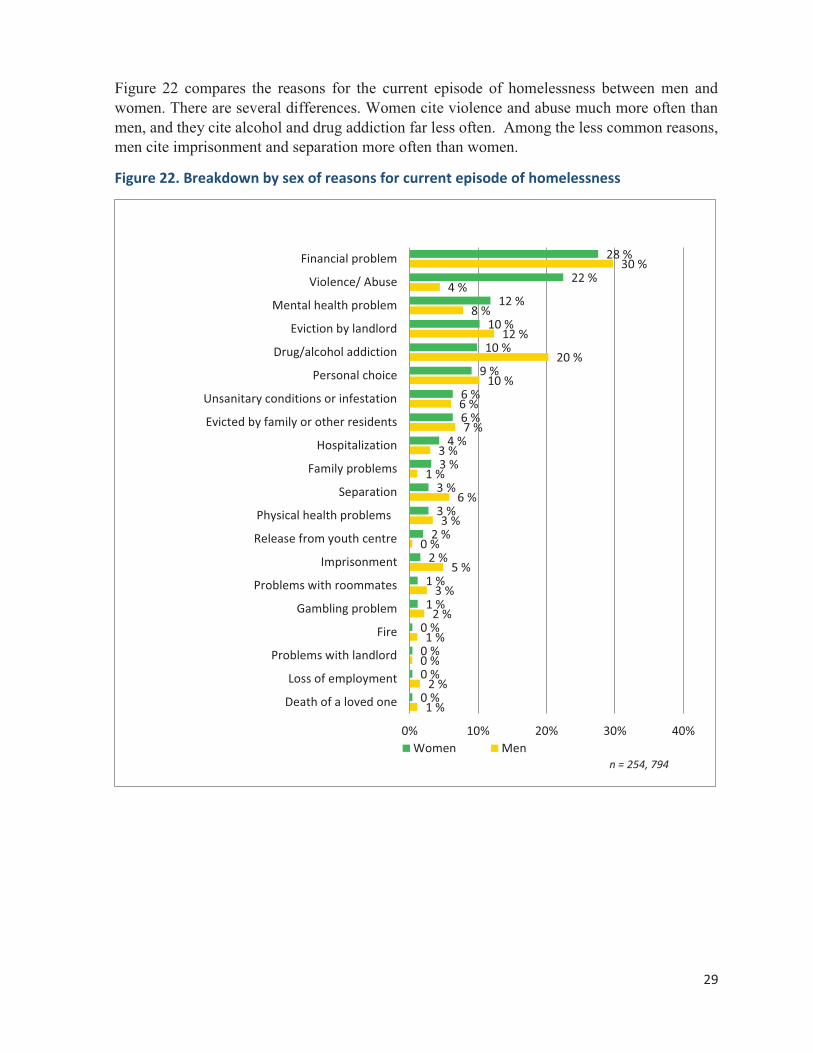
Figure 22 compares the reasons for the current episode of homelessness between men and women. There are several differences. Women cite violence and abuse much more often than men, and they cite alcohol and drug addiction far less often. Among the less common reasons, men cite imprisonment and separation more often than women.
Figure 22. Breakdown by sex of reasons for current episode of homelessness
1 %
2 %
0 %
1 %
2 %
3 %
5 %
0 %
3 %
6 %
1 %
3 %
7 %
6 %
10 %
20 %
12 %
8 %
4 %
30 %
0 %
0 %
0 %
0 %
1 %
1 %
2 %
2 %
3 %
3 %
3 %
4 %
6 %
6 %
9 %
10 %
10 %
12 %
22 %
28 %
0% 10% 20% 30% 40%
Death of a loved one
Loss of employment
Problems with landlord
Fire
Gambling problem
Problems with roommates
Imprisonment
Release from youth centre
Physical health problems
Separation
Family problems
Hospitalization
Evicted by family or other residents
Unsanitary conditions or infestation
Personal choice
Drug/alcohol addiction
Eviction by landlord
Mental health problem
Violence/ Abuse
Financial problem
Women Menn = 254, 794

30
Figure 23 compares immigrants and non-immigrants. As with women, violence and abuse are cited much more often among immigrants, and alcohol or drug addiction less often. The differences are slight in all other cases.
Figure 23. Breakdown by immigrant status of reasons for current episode of homelessness
0 %0 %
1 %
1 %
1 %
1 %
2 %
2 %
3 %
3 %
4 %
4 %
5 %
7 %
7 %
7 %
8 %
11 %
11 %
14 %
33 %
0 % 10 % 20 % 30 % 40 %
Problems with landlord
Loss of employment
Death of a loved one
Release from a youth centre
Fire
Problems with roommates
Gambling problems
Imprisonment
Family problems
Separation
Physical health problems
Hospitalization
Personal choice
Evicted by neighbours or family members
Unsanitary conditions or vermin
Mental health problems
Evicted by landlord
Drug/alcohol addiction
Violence/ Abuse
Financial problems
Immigrants Non-immigrants
n = 168, 848

31
Figure 24 compares the reasons given by Aboriginals with those given by non-Aboriginals. Aboriginal people cite “personal choice” far more often, and financial problems less often.
Figure 24. Breakdown by Aboriginal status of reasons for current episode of homelessness
3.10 Sources of income
Table 7 shows the income sources reported by our respondents, by homelessness category. The most commonly cited source of income is social assistance benefits. (This category includes both disability payments for those who qualify – solidarité sociale – and ordinary social assistance benefits – aide sociale – for others.) Few people said they were working, not even in unreported part-time jobs. When work was reported, it was slightly more prevalent among the residents of transitional housing. Six percent overall of the respondents reported panhandling, but the percentages vary considerably from one homelessness category to another: from 0% in transitional housing to 18% for unsheltered respondents.
0 %
1 %
1 %
1 %
2 %
2 %
4 %
2 %
1 %
3 %
6 %
7 %
9 %
4 %
4 %
9 %
12 %
18 %
31 %
9 %
0 %
0 %
0 %
0 %
0 %
0 %
0 %
1 %
2 %
4 %
5 %
5 %
5 %
6 %
7 %
11 %
11 %
21 %
22 %
24 %
0% 5% 10% 15% 20% 25% 30% 35%
Problems with landlord
Fire
Death of a loved one
Loss of employment
Family problems
Gambling problems
Hospitalization
Problems with roommates
Release from a youth centre
Physical health problems
Unsanitary conditions or infestation
Evicted by family or residents
Mental health problems
Separation
Imprisonment
Violence/ Abuse
Eviction by landlord
Drug/alcohol dependency
Financial problems
Personal choice
Aboriginals Non-Aboriginalsn = 85, 824

32
Table 7. Sources of income by homelessness category
Unsheltered Emergency shelters
Transitional housing
Other places Total
Type of income / n 167 546 295 61 1,069
None 11% 5% 6% 5% 6%
Social assistance benefits 63% 76% 67% 84% 72%
Disability pension 6% 6% 5% 8% 6% Old Age Security / Guaranteed Income Supplement
2% 6% 3% 0% 4%
Québec Pension Plan 4% 10% 6% 2% 8%
Full-time reported work 1% 1% 6% 2% 3%
Part-time reported work 2% 3% 8% 2% 4% Unreported part-time work 4% 4% 3% 0% 4%
Unreported full-time work 2% 1% 0% 0% 1%
Employment insurance 1% 1% 2% 2% 1%
Panhandling 18% 5% 0% 2% 6%
33
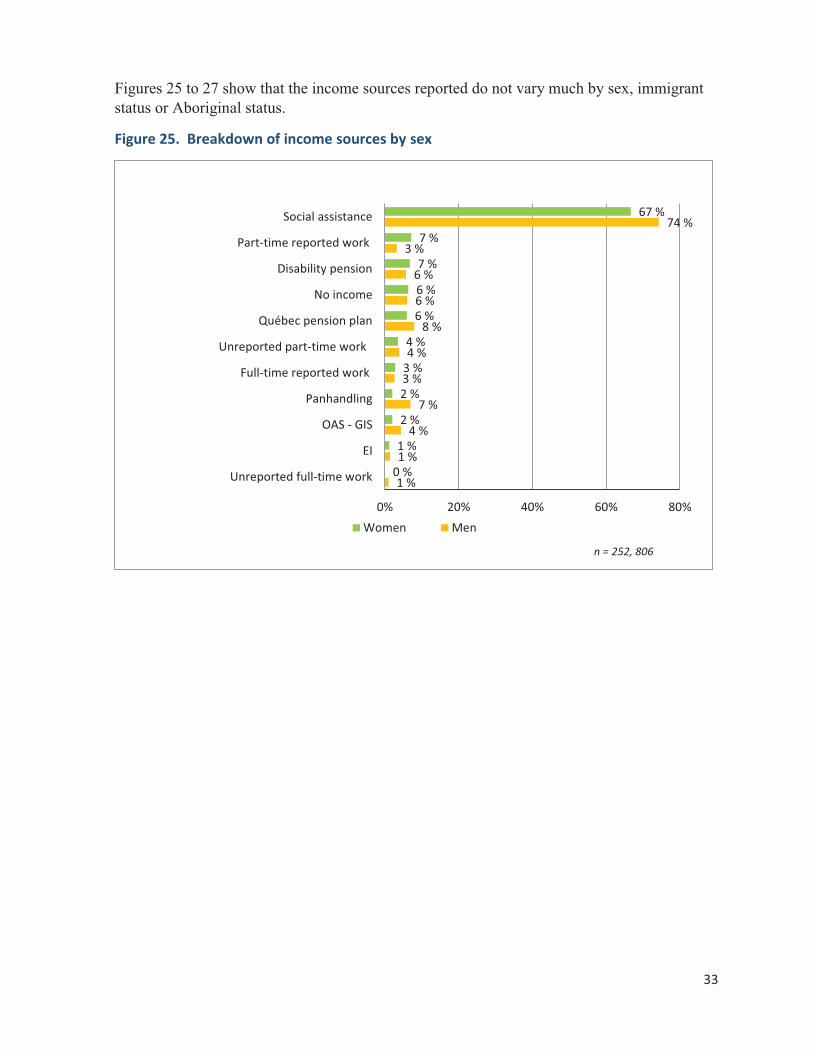
Figures 25 to 27 show that the income sources reported do not vary much by sex, immigrant status or Aboriginal status.
Figure 25. Breakdown of income sources by sex
1 %
1 %
4 %
7 %
3 %
4 %
8 %
6 %
6 %
3 %
74 %
0 %
1 %
2 %
2 %
3 %
4 %
6 %
6 %
7 %
7 %
67 %
0% 20% 40% 60% 80%
Unreported full-time work
EI
OAS - GIS
Panhandling
Full-time reported work
Unreported part-time work
Québec pension plan
No income
Disability pension
Part-time reported work
Social assistance
Women Men
n = 252, 806

34
Figure 26. Breakdown of income sources by immigrant status
Figure 27. Breakdown of income sources by Aboriginal status
4 %
4 %
1 %
1 %
6 %
2 %
6 %
8 %
4 %
5 %
74 %
1 %
2 %
2 %
2 %
2 %
5 %
6 %
6 %
6 %
10 %
65 %
0 % 20 % 40 % 60 % 80 %
Unreported part-time work
OAS - GIS
Unreportred full-time work
EI
Panhandling
Full-time reported work
Disability pension
Québec pension plan
Part-time reported work
No income
Social assistance benefits
Immigrants Non-immigrants n = 168, 860
0 %
0 %
1 %
2 %
2 %
5 %
5 %
7 %
10 %
13 %
72 %
1 %
1 %
3 %
4 %
4 %
6 %
7 %
3 %
6 %
5 %
72 %
0% 20% 40% 60% 80%
Unreported full-time work
EI
Full-time reported work
OAS - GIS
Part-time reported work
Disability pension
Québec pension plan
Unreported part-time work
No income
Panhandling
Social assistance benefits
Non-Aboriginals Aboriginalsn = 87, 835

35
4. Analysis of questionnaire data – hidden homelessness For the 356 questionnaires we put into the hidden homelessness category, Table 8 shows where the questionnaires were collected and the type of place where people spent the night of March 24.
Table 8. Type of location where questionnaires in hidden homelessness category were collected, by type of place where night of March 24 was spent
Type of place where questionnaires were
collected
Where the night of March 24 was spent Total
Rooming house At someone else’s place Hotel or motel
Outside location 30 64 11 105 Shelters and transitional housing 10 3 0 13
Soup kitchens and day centres 125 112 1 238
Total 165 179 12 356
Table 9 shows the differences between those respondents considered to be hidden homeless and the others, using several demographic variables and their homelessness history. There are few overall differences between the groups.

36
Table 9. Comparison of the samples of visible homelessness and hidden homelessness
Hidden
homelessness (n=356)
Visible homelessness (n=1,096)
Gender 345 1,076
Male 264 (77%) 814 (76%)
Female 76 (22%) 256 (24%)
Other 5 (1%) 6 (1%)
Age 336 1,057
30 and under 74 (22%) 205 (19%)
31 – 49 118 (35%) 414 (39%)
50 and older 144 (43%) 438 (41%)
Birthplace 321 1,037
Montreal 134 (42%) 455 (44%)
Elsewhere in Quebec 106 (33%) 168 (16%)
Elsewhere in Canada 32 (10%) 310 (30%)
Other countries 49 (15%) 104 (10%)
Aboriginal 36/303 (12%) 89/932 (10%)
Chronicity of homelessness 254 930
1st episode – less than a month 11 (4%) 47 (5%)
1st episode – one to 7 months 10 (4%) 65 (7%)
1st episode – 7 months to less than a year 4 (1%) 46 (5%)
1st episode – one year to less than 4 years 25 (9%) 109 (12%)
Chronic homelessness - current episode lasting 4 years or longer
99 (36%) 239 (26%)
Episodic homelessness (2 or more episodes in 3 years or less) 127 (46%) 424 (45%)
Veterans 30/344 (9%) 67 /1,047 (6%)
Accompanying children 17 / 322 (5%) 38 / 944 (4%)

37
Figure 28 shows, however, that the hidden homeless use services in many different ways from the visible homeless. The former are much more likely to use day centres or soup kitchens and food banks, and less likely to go to shelters. They consult for physical health problems more often but go to hospital or emergency rooms less often. They resort to crisis centres less, are less in contact with the police, and access services related to substance use less often.
Figure 28. Comparison of services used in the past six months, by hidden vs visible homelessness
12 %
21 %
3 %
20 %
11 %
7 %
12 %
16 %
29 %
39 %
24 %
74 %
17 %
48 %
5 %
10 %
10 %
10 %
12 %
12 %
13 %
15 %
19 %
23 %
34 %
36 %
41 %
64 %
0% 20% 40% 60% 80%
Crisis centre
Prevention and harm reduction
No service
Detox or therapy centre
Hospitalization or ER - mental health
Prison or penitentiary
Ambulance
CLSC (mental health)
Police
Hospitalization or ER - physical health
CLSC (physical health)
Shelter/transition housing
Food bank
Day centre or soup kitchen
Hidden Visiblen = 349, 1072

38
Figure 29 compares the reasons given by both groups for their current episode of homelessness. Differences are relatively minor. Financial problems and addiction are the most common reasons. In particular, hospitalization, imprisonment and release from a youth detention centre are again rarely cited.
Figure 29. Comparison of the reasons for homelessness by category: hidden or visible homelessness
1 %1 %
2 %0 %
2 %2 %
1 %3 %
4 %1 %
3 %5 %
9 %7 %
9 %6 %
10 %12 %
18 %29 %
1 %1 %1 %1 %1 %1 %2 %2 %2 %2 %
3 %4 %4 %5 %
6 %7 %
10 %14 %
15 %32 %
0% 10% 20% 30% 40%
Release from a youth centreFire
Gambling problemProblems with landlord
Problems with roommatesFamily problems
Loss of employmentHospitalizationImprisonment
Death of a loved onePhysical health problem
SeparationViolence/ Abuse
Evicted by family or other residentsMental health problem
Unsanitary conditions or infestationPersonal choice
Evicted by landlordDrug/alcohol addiction
Financial problem
Hidden Visiblen = 323, 1060

39
Finally, Figure 30 compares the income sources given by respondents. There is no significant difference.
Figure 30. Comparison of income sources by homelessness category: hidden or visible
1 %
1 %
6 %
3 %
4 %
6 %
4 %
4 %
8 %
6 %
72 %
1 %
2 %
4 %
5 %
5 %
6 %
6 %
7 %
8 %
9 %
66 %
0% 20% 40% 60% 80%
EI
Unreported full-time work
Disability pension
Full-time reported work
Part-time reported work
Panhandling
OAS - GIS
Unreported part-time work
Québec pension plan
No income
Social assistance benefits
Hidden Visible
n = 333, 1069

40
IV. DISCUSSION
Montreal’s first point-in-time count of homeless people went well overall. A remarkable number of volunteers took part, covering a significant area of Montreal and meeting hundreds of people in shelters, transitional housing, soup kitchens and day centres with the help of workers in those facilities. More than 1,500 questionnaires were filled in, which allowed us to identify many characteristics of Montreal’s homeless population on March 24, 2015. An exceptional post-count effort to reach out to the community-based and institutional organizations that might have sheltered homeless people made it possible for us to determine how many people were homeless on that day with considerable completeness and precision. The initiative was conducted more exhaustively than in other Canadian cities. We estimate that 3,016 people were in a situation of visible homelessness in Montreal on March 24, 2015. That number should not be compared to the estimate of 12,666 produced by Louise Fournier and her team in the mid-1990s, since that number referred to people who had had no fixed address at some point during a period of one year [10]. As we have seen, many people who are homeless one day may not be homeless another day; those are the situational (one-time) or episodically homeless. Had we done the count on some other day in 2015, we would have found about the same chronically homeless people, but a large number of other people would have replaced those we found to be episodically or situationally homeless. It is not possible to use our data to determine how many people are homeless in Montreal over a year.9 The estimate of the number of homeless in Montreal on March 24 partially matches the portrait of homelessness that the Government of Quebec published in 2014. That report identified 738 emergency shelter beds available on the island of Montreal, plus 232 transitional beds, for a total of 970 beds in emergency shelters, whereas we counted 1,066 people in emergency shelters, including those who were in transition programs. The difference is no doubt due to the fact that we included a larger array of facilities when counting our shelter residents, including shelters for women victims of violence and crisis centres. The Quebec portrait also reported 196 beds in women’s shelters, but that number corresponds to only a fraction of the transitional shelter facilities we covered in our count. We believe that we have provided a more complete inventory of the shelter facilities that need to be considered when counting homeless people. Although we could not estimate the number of people who were homeless over a year, we could estimate the number of those who were chronically homeless. The people in that group are particularly significant for planning services, because they live more precariously and have fewer chances of escaping homelessness without help. The answers to questions on the length of the current homelessness episode and the number of episodes over the past three years show
9 Participants would have had to be questioned in much greater detail about their homelessness history, which was
not feasible since we were using a short questionnaire administered by volunteers. Even with much more precise questionnaire data, with no information as to the duration of a current episode at the time of the interviews (we could not know when the current homeless episode would end), our estimate could only be approximate. Data would have to be compiled over a longer period of time, preferably a whole year.

41
us that some 38% of the 3,016 visibly homeless people – 1,146 people – have been homeless for a year or more; 26% of them, or 784 people, have been chronically homeless for 4 years or more. The difference between these two numbers (1146 – 784 = 362) represents some people who might fall into the episodically homeless category. It seems reasonable to estimate that Montreal has approximately 1,000 chronically homeless people who will probably never find a permanent home without a new form of assistance. The episodically homeless (2 or more episodes over the past 3 years) make up another group of interest. Based on the data in Figure 14, 45% of 3,016 people, or 1,357, were in that situation on March 24. If we had been able to count that category of people over a whole year we would certainly have found a higher number, since such people are by definition only homeless for part of the time. Without more precise information than we were able to obtain, it is impossible to determine how many people are episodically homeless over a year. Other respondents were experiencing a first homelessness episode that had lasted less than a year. They made up about 17% of the 3,016, or 513 people. As with episodically homeless people (indeed, even more so), we were only able to count some of those who are homeless for the first time within a year. Some of them, mainly among the 5% (151 out of 3,016) who had been homeless for less than a month, will be able to find permanent housing again without any new form of assistance, but others will become chronically or episodically homeless. Among the unsheltered people (not including those in the subway stations) 118 out of 272, or 43%, were in the Ville-Marie borough. This high percentage no doubt reflects the concentration of services intended for homeless people in that borough. Another 81 out of 272 (30%) were spread among Mercier-Hochelaga-Maisonneuve, Plateau-Mont-Royal and the Southwest, and 61 (23%) among Rosemont-La-Petite-Patrie, Verdun, Côte-des-Neiges-Notre-Dame-de-Grâce and Westmount. We included Ahuntsic-Cartierville (2%) and Dorval (1%), which were not originally going to be part of the outdoor count, after receiving representations from organizations10 working with the homeless in those two boroughs. Had we covered more of the City we would likely have found a greater number of people. Nevertheless, the low number of people found in the boroughs that are further away from downtown suggests that the additional number would have been very small. Of course that does not mean that such boroughs do not contain many hidden homeless. We did not manage to cover all the sectors we had aimed for on March 24, despite the large number of volunteers. We therefore estimated the number of people we might have found in the sectors that were not covered. The method we used to calculate the adjustment takes into account that the proportion of sectors that were not covered varied from one borough to another; relatively few of them were in Ville-Marie, where the number of people we found was especially high. We followed the examples of New York and Toronto in using decoys, partly to spur the volunteers to approaching as many people in their sectors as possible, and partly in order to
10 Action jeunesse de l’Ouest-de-l’Ïle and RAP Jeunesse in the North of Montreal.

42
estimate the percentage of homeless people who might have been missed. When the count was over, 67.4% of the decoys had been identified; this figure is midway between the two found in Toronto reports – 58% in 2006 and 78% in 2009. It is a relatively imprecise estimate of the proportion of homeless people found by our volunteers, because the decoys did not always follow their instructions. Forty-six is a relatively low number, and the proportion that could have been discovered is subject to some statistical variability. We nevertheless find it preferable to adjust our estimate of the number of homeless people who were really on the streets taking that percentage into account, as do New York and Toronto. The adjustment method we used, which was to divide the estimated number by the percentage of decoys who were found, is simple and straightforward. It follows the scientific literature [11]. Our adjustment methods differ in two ways from those used in other cities. First, our screening question was more complex because we wanted to be more inclusive. If respondents said they had a fixed address where they could spend the night if they wanted to, we went further and asked whether that was their own home, an apartment with a lease or indeterminate contract, and whether they intended to return there soon. We thus encountered 30 people living in rooming houses who would likely not have been counted in a different city and we reclassified the questionnaires based on the place where people said they intended to or had spent the night of March 24. The net effect of that reclassification was to reduce the number of people we estimated to be on the street by 37%. We also assumed that the same percentage of the 110 people who did not respond to the questionnaire but had been considered clearly homeless would have been reclassified to other locations. As described in detail in Appendix C, if we had only adjusted for the missing sectors and the decoys, we would have counted 678 rather than 429 unsheltered people. Leaving out rooming house residents would have brought the 678 figure down somewhat, but our estimate of 429 is probably conservative compared to the cities, particularly Toronto, which also adjusted for unfound decoys. We did not administer our questionnaires in hospitals, prisons, or more than one therapy centre during this first Montreal point-in-time count. But thanks to excellent cooperation from such facilities during the three months after the count – and in some cases with detailed analysis of their administrative data – we could ascertain quite precisely the number of people who were there on the night of March 24 and were homeless. We chose to include the residents of therapy centres outside Montreal in our estimate of the number of homeless people on March 24, provided they had been homeless when they left Montreal. There is no mechanism to systematically help people who leave such therapy centres find permanent housing when they return to Montreal. Those therapy centres can therefore be seen as one type of transitional housing, often used by homeless people in Montreal. Although they were not included in the counts of other cities, it seemed inconsistent to us not to include them. Indeed, the consultation process that preceded the count emphasized this point. Given the number of people in such facilities, it would be worth having the questionnaire filled in by as many people located in them as possible in future counts.

43
We did not include the halfway houses that look after prisoners from federal prisons before they return to the community. Those transition houses aim to help their residents find permanent housing after they leave. When we contacted representatives of such houses they felt that their residents should not be considered homeless. We added two calculations so that our estimate could be compared with those in other Canadian cities: a comparison of the number of unsheltered homeless people per 10,000 residents, and a comparison of the total number of homeless people per 10,000 residents. (We used the population figures for the Montreal agglomeration, which covers Montreal Island – the area that the count aimed to cover.) Our findings appear in Table 10.
Table 10. Numbers of homeless people in Montreal compared to other major Canadian cities that carried out street counts
Vancouver
(city) 2014
Vancouver (region)
2014
Calgary 2014
Edmonton 2014
Toronto 2013
Montreal 2015
Population 640,469 (2014)
2,474,123 (2014)
1,195,194 (2014)
877,926 (2011)
2,791,140 (2013)
1,988,24311
(2014)
Total number of homeless12
1,803 2,777 3,555 2,307 5,253 3,016
Number per 10,000 inhabitants
28.1 11.2 29.7 26.2 18.8 15.2
Unsheltered (1.1, 1.2)
536 957 182 771 447 429
Number per 10,000 inhabitants
8.4 3.9 1.5 8.8 1.6 2.2
Despite the differences between the various methods of counting homeless people in different cities,13 the numbers shown in Table 10 point to a significant contrast between the number of unsheltered people and the total number of homeless people in Montreal. Although our estimate of the total number is probably more complete than that of other cities (especially since we included 199 people residing temporarily in therapy centres outside Montreal, which no other city did), Montreal has far fewer homeless people per 10,000 residents than Vancouver (unless the whole of the Vancouver urban region is considered), Edmonton or Calgary, and somewhat fewer than Toronto. In contrast, considering only the people identified as unsheltered – even
11 Ville de Montréal, Montréal en statistiques,
http://ville.montreal.qc.ca/portal/page?_pageid=6897,67633583&_dad=portal&_schema=PORTAL [in French only]. The populations of the other cities were also obtained from sources available online.
12 According to the street count reports of those cities respectively, available online. 13 For example, Vancouver does not include transitional housing residents.

44
though our estimate is conservative, as we have seen – the Montreal number is quite a bit higher than the numbers for Toronto and Calgary.
Beyond the information on chronicity, which we have commented on above, most of the findings are consistent with what we already knew about the homeless population in Montreal. Some of them, however, merit attention.
Immigrants as a whole represented 16% of our sample, whereas in 2011 immigrants made up 33.2% of Montreal’s population.14 The predominant group of immigrants in our sample are from Haiti. These account for substantially the same percentage of our sample as they do of the Montreal population: about 2.4%.
Our findings did reveal one subgroup of immigrants who are relatively at higher risk: women. They make up 39% of visibly homeless immigrants compared to 24% of homeless people as a whole. Immigrant women are particularly likely to have children under 18 with them: We found 22% in that situation, compared to only 10% for the general population of homeless people.
In line with previous studies, Aboriginals – and especially the Inuit – are greatly overrepresented in our sample. The 10,505 Aboriginals reported in the 2011 census for the Montreal agglomeration made up only 0.56% of the agglomeration’s total population, but 10% of our sample were Aboriginals. The Inuit make up 41% of the Aboriginals in our sample, but only 10% of Montreal’s Aboriginal population.15
We counted 6% of veterans in our sample, which is very similar to the 7% counted in Toronto in 2013. Veterans Affairs Canada estimated the number of veterans in Canada in March 2014 to be about 697,400 [12], some 2.6% of the Canadian population aged 20 or over.16 The high proportion of veterans among Canada’s homeless has been noted a number of times, and Veterans Affairs Canada has set up some programs to help them [13].
Social assistance benefits, including disability benefits, constitute the most common source of income for homeless people.17 Transitional housing residents were more likely to report income from work, but employment rates remain below 10% for all groups. The more stable daily life and the assistance provided in such settings may make it easier to find and keep a job; or the people who are more capable of working may find it easier to access transitional housing.
14 Using the results of the 2011 census. 15 According to Donat Savoie, “Des Inuit déracinés et itinérants” in Relations, no 753, December 2011.
Statistics Canada’s 2011 National Household Survey, as cited in the socio-demographic profile of the Montreal agglomeration, July 2014. (http://ville.montreal.qc.ca/pls/portal/docs/PAGE/MTL_STATS_FR/MEDIA/DOCUMENTS/PROFIL_SOCIOD%C9MO_AGGLOM%C9RATION.PDF), reports only 880 Inuit in the Montreal agglomeration in 2011 out of 39,270 Aboriginals of North American origin, making up 2.2% of the agglomeration’s Aboriginals. One way or another, the Inuit are overrepresented among the Aboriginal homeless. [For an English version of the Savoie article, see: http://www.caeh.ca/wp-content/uploads/2013/11/RandP-Ib-SAVOIE_D_Inuit-Homelessness.pdf ]
16 The 2011 census reported 26,641,495 adults aged 20 and over. 17 Social solidarity benefits are granted to people who have been medically assessed as having a severely limited
capacity for employment. Our questionnaire did not distinguish between welfare and social solidarity benefits. The percentages should probably be construed as a mix of both types of benefits.
45
The data on how services are used reveal significant needs among homeless people. Almost 20% have used ambulances in the past 6 months, and close to 30% went to an emergency room or were hospitalized for physical health problems during the same time period. Food banks and day centres or soup kitchens are used frequently, an unsurprising reflection of the material needs of homeless people.
As concerns service use still, people in transitional housing (where women are relatively more numerous than in the other categories) differ in many ways: fewer of them have been in prison or a penitentiary in the past 6 months, more of them have resorted to crisis or mental health services, and more of them have consulted for physical health problems, while fewer have gone to day centres or soup kitchens.
Overall, the figures also reveal the particular needs of homeless people who are unsheltered. This group has the highest rate of chronicity, with 43% having been chronically homeless for 4 years or more. As expected, there is much more panhandling in this group – 18% – than among those in emergency shelters – 5%. People who sleep outside resort to social assistance benefits relatively less often and report work less often, but did not differ markedly from the people in all the other homelessness categories in terms of using services – except for the fact that only 40% of them went to a shelter or transitional housing in the past 6 months.
The two most common reasons given for the most recent episode of homelessness were financial problems and drug or alcohol addiction. Various personal problems (separation, family issues, personal choices in some cases at least,18 violence or abuse, eviction by residents or family members) also come into play. Release from a youth detention centre, hospital or prison were cited by several respondents, but do not appear to be significant factors. That is also true among those who said the current episode of homelessness was their first. The low percentage of respondents who said that release from a youth detention centre was the cause of a first episode of homelessness is surprising in light of other studies that indicate such release as a frequent cause of homelessness. It could be that people in that situation avoided answering the questionnaires to a disproportionate extent; alternatively, many of them may not perceive having been in a youth detention centre as a causal factor of their homelessness, even if in fact it is. It is also possible that, although release from a youth centre may often lead to the streets, many of the people involved may be able to get off the street relatively quickly; or that, in terms of absolute numbers, other factors are in fact more important than having been released from a youth detention centre. All these possible explanations may also combine to account for this surprising finding.
The Montreal street count can be distinguished from counts in other cities by the fact that it also attempted to count people in what we have called hidden homelessness – people who live in rooming houses, stay with other people or in hotels or motels without having a fixed address. It would have been possible in principle to count the people living in rooming houses in Montreal and survey them, but we did not have the financial resources or the time required to do that.
18 The “personal choice” category should not be construed as a positive choice to live unsheltered : many studies
show that most homeless people would prefer to have a place of their own. Rather, in the great majority if not all instances, it reflects a choice between an intolerable housing situation and the street.
46
The rest of that group is very hard to count, and attempts to do so by telephone, such as in Vancouver, have not produced convincing results.
The method we used consisted of meeting as many people as possible in day centres and soup kitchens in the two days following our night count. We found this method particularly useful because it allowed us to interview a larger number of people who had spent the night of March 24 outdoors, in a shelter or elsewhere. We must, however, admit that we were only able to identify a small proportion of Montreal’s hidden homeless, and the people we did identify are certainly not representative of the whole. We know, for example, that many young people in the Montreal agglomeration (e.g. the West Island), are staying with others but not going to soup kitchens or day centres, so we were not able to detect them. Many women were also in ambiguous situations, subject to various kinds of abuse and not really living in a home of their own. Nor were we able to meet people living in crackhouses or spending the night in saunas. This kind of count cannot be used to characterize such subgroups.
This first count has two important strengths compared to those done elsewhere. First, using the questionnaires in soup kitchens and day centres March 25 and 26 gave us many more questionnaires to analyze, and allowed a more precise identification of people who had spent the night of the 24th outdoors. Second, we did an exhaustive count of homeless people in shelters for victims of violence, centres for new arrivals, other transitional housing, hospitals, detention centres and therapy centres, including those outside of Montreal. In addition, we were able to deploy 50 decoys, as was done in Toronto, and using the method developed in New York, which made our estimate of the number of unsheltered people more precise. To sum up, we were able to obtain a quite precise and comprehensive estimate of the total number of homeless people in Montreal on March 24, 2015. That number has been broken down into subgroups to give us a greater understanding of the homeless population.
There are some limitations to our findings, however. First, although we identified more than 350 people as being hidden homeless, we know they represent only a fraction of the true number. The workers and experts we consulted stressed that there are many young people and women among the hidden homeless. We were not able to cover all the targeted sectors, some of which were in parts of the city with a relatively high number of homeless. Although we were able to adjust for the uncovered sectors, that makes our estimate less precise. The representativeness of the questionnaires we did obtain is modest, at best. The “other places” category in particular is only described by a very small proportion of the people we counted in those places. Future counts should aim to administer the questionnaire at a more extensive set of locations. Another limitation concerns the data analysis: in this report, due to time limitations, we have not reported any statistical tests or confidence interval estimates. When it came to estimating the total number of homeless people, however, all but one component group were counted with precision. The only exception is the 429 considered as having spent the night of March 24 unsheltered: this number is an estimate, and probably, as we have seen, a conservative one. (See also Appendix C).
Lastly, we know that the questionnaires, particularly the screening questions at the beginning, were not always clear for the volunteers and were not always interpreted as intended. Nevertheless, the results of the analyses are generally very plausible, both as to the comparisons

47
between subgroups (e.g. the larger proportion of women in transitional housing) and various overall proportions (e.g. the percentage of Aboriginals and specifically Inuit). That leads us to believe that the more unexpected results, such as the minor role that release from youth detention centres appears to play, are also valid.
In conclusion, the first count of homeless people on the Island of Montreal went well and succeeded in rallying some 700 volunteers, nearly all of whom perceived their experience positively. We were able to organize an extensive effort over three days despite the short deadline. Thanks to a considerable amount of additional work during April, May and June, we were able to estimate that there were 3,016 homeless people in Montreal on March 24, 2015, not counting the hidden homeless. Expressed per 10,000 residents, this number is quite low compared to other Canadian cities. The financial resources needed to eliminate at least chronic homeless are correspondingly reduced. However, the estimate of the number of people spending the night outdoors – 429 – remains relatively high compared to cities like Toronto. That city has made considerable efforts since 2005 to house the people who reside outdoors. Our count also pinpointed the specific needs of some of the groups, particularly those living on the streets and outside the reach of shelter facilities, veterans and Aboriginals, especially the Inuit.
48
REFERENCES
1. Gouvernment du Québec, Ensemble, pour éviter la rue et en sortir : Politique nationale de lutte à l'itinérance, M.d.l.S.e.d.S. sociaux, Editor. 2014, La Direction des communications du ministère de la Santé et des Services sociaux: Québec.
2. Canadian Observatory on Homelessness The Canadian definition of homelessness, 2012.
3. City of Toronto, Toronto 2006 Street Needs Assessment. 2006, City of Toronto.
4. City of Toronto, Street Needs Assessment Results - 2009, S.H.A. Shelter, Editor. 2009, City of Toronto: Toronto.
5. City of Toronto, 2013 Street Needs Assessment Results. 2013, City of Toronto: Toronto.
6. New York City, HOPE 2014: The New York City Street Survey. 2014.
7. Turner, A., 2014 Alberta Point-in-Time Homeless Count: Provincial Report. 2015.
8. Boston Public Health Commission, 34th Annual Homeless Census, B.P.H. Commission, Editor. 2013, City of Boston: Boston.
9. Eberle Planning and Research, Vancouver Homeless Count 2013: Final Report. 2013: Vancouver, B.C.
10. Fournier, L., Dénombrement de la clientèle itinérante dans les centres d'hébergement, les soupes populaires et les centres de jour des villes de Montréal et de Québec: 1996-1997. 1998: Santé Québec.
11. Hopper, K., M. Shinn, and J. Wanderling, Estimating Numbers of Unsheltered Homeless People Through Plant-Capture and Postcount Survey Methods. American Journal of Public Health, 2008. 99(8): p. 1438-1442.
12. Veterans Affairs Canada, General Statistics.
13. Montpetit, C., L’itinérance frappe parmi les vétérans de l’armée canadienne, in Le Devoir. 2014: Montreal.
49
APPENDIX A: Questionnaires

MARCH 24, 2015 TEAM # ______________________________ ZONE _______________________________
I COUNT MONTRÉAL 2015SCREENING FORM FOR OUTDOOR SURVEY
Interviewer : please read the following paragraph to everyone you meet
Hello, my name is ( first name ), and I am a volunteer with I Count Montréal, a project funded by the City of Montréal ( show your badge to the person ). We are doing a survey regarding housing instability. We need to approach everyone we meet. This survey is very important to us, but you are completely free to refuse to answer. It is anonymous and confidential. Neither your name nor any other identifying information will be written down. Do you agree to continue ?
Yes No Say : “Thank you, have a good evening” ( record in the tally sheet )
Q1 - Have you already answered questions from someone wearing this badge ? Show your badge to the person
Yes Say : “Thank you very much for your participation.” ( finish the survey and record in the tally sheet )
No
Q2 - Do you have your own fixed residence where you can go tonight if you wish ?
Yes ( go to Q 3 ) Refused to answer ( finish the survey and note it in the tally sheet )
No ( go to Q 4 ) Does not know ( go to Q 4 )
Q3 - What kind of a place is it ?
Are you planning on spending the night there tonight, or on returning there soon?
Yes ( say : “thank you very much, the questionnaire is completed.” )
No ( go to Q 4 )
Refused to answer ( Say : “thank you very much, the questionnaire is completed.” )
Does not know ( go to Q 4 )
Other responses to question 3 : Continue with the rest of the questionnaire.
*Do not forget to fill out the tally sheet if the interview is finished
Apartment or house or other residence with lease or contract of indefinite duration

MARCH 24, 2015 TEAM # ______________________________ ZONE _______________________________
I COUNT MONTRÉAL 2015QUESTIONNAIRE FOR OUTDOOR SURVEY
( End of Question 3. Answer only if the person answered “Yes” to question 2. )
Q3b - What kind of a place is it ? Do not read the list
Vehicle, abandoned building, etc. Transitional housing Makeshift shelter, or tent in a park, forest, etc. Detox or treatment centre Rooming house Emergency shelter Staying / housed with someone else Hospital Outside Does not know Hotel or Motel Refused to answer
Q4 - Where do you think you will be spending the night tonight ? Do not read the list
Vehicle, abandoned building, etc. Transitional housing Makeshift shelter, or tent in a park, forest, etc. Detox or treatment centre Rooming house Emergency shelter Staying / housed with someone else Hospital Outside Does not know Hotel or Motel Refused to answer
Q5 - Over the course of the past 6 months, so since the end of September, which of the following services have you used or have you been in touch with ? Read the list and check all that apply
Emergency shelter ( Ex: Old Brewery Mission, La Maison Marguerite, Auberge du Coeur)
Day centre / Soup kitchen ( Ex: Accueil Bonneau, Chez Doris, Les Amis du Plateau )
Food bank ( Food basket )
Medical clinic CLSC – physical health
Medical clinic CLSC – mental health Hospital or emergency room – physical health Hospital or emergency room – mental health Detox or therapy centre ( For alcoholism or drug addiction ) Ambulance
Harm reduction and prevention ( Ex: Cactus, Stella, Dopamine ) Crisis centre Police Prison or penitentiary Other : ___________________________ None Refused to answer
Q6 - How long has it been since you were last in your own apartment or sharing an apartment with someone else, not including rooming houses ?
______________ years ( if more than 3 years, go to Q8 ) ______________ months Does not know ______________ days Refused to answer
Q7 - Over the course of the last three years, how many times have you been without a fixed residence or in a rooming house ?
First time without a fixed residence or in a rooming house ( go to Q 8 ) Does not know ( go to Q 8 )
______(# of times) ( go to Q 8 ) Refused to answer ( go to Q 7.1 )
Q7.1 If the person does not know exactly, ask :
1 – 3 times 4 – 10 times +10 times Does not know Refused to answer
Q8 - Why did you lose your last fixed residence ? Do not read the list, check all possible responses according to what the person says
Financial problem Evicted by the landlord Evicted by family or other residents Left a youth centre Imprisonment Housing was unhealthy or infested
Hospitalisation Violence/abuse Physical health problem Mental health problem Gambling problem Drug or alcohol addiction
Personal choice Other : ___________________________ Does not know Refused to answer

MARCH 24, 2015 TEAM # ______________________________ ZONE _______________________________
Q9 - How do you self-identify : Read the list
Female Transgender or Transsexual Does not know Male Other : _____________________________ Refused to answer
Q10 - Can you tell me your approximate age ?
________ years Does not know Refused to answer
Q11 - Where were you born ?
If in Canada ( go to Q 12 ) : If in another country ( go to Q 11.1 ) :Province : ________________________________________________ Country : _______________________________________________City : ____________________________________________________ Year arrived in Canada : __________________________________
Q11.1 - Are you a : Read the list
Canadian citizen Temporary foreign worker Does not know Permanent resident International student Refused to answer Refugee claimant Other : _________________________________________________________________
Q12 - Do you self-identify as aboriginal ( including First Nations, Métis, Inuit ) ? Do not read the list, select all possible responses according to what the person says
Yes ( go to Q 12.1 ) Does not know ( go to Q 13 ) No ( go to Q 13 ) Refused to answer ( go to Q 13 )
Q12.1 - With which do you self-identify : Read the list
First Nations ( status ) Métis Does not know First Nations ( non-status ) Inuit Refused to answer Other : ________________________________________________________________________________________________________
Q13 - Have you ever served in the Canadian armed forces ?
Yes Does not know No Refused to answer
Q14 - Are there any children under the age of 18 staying with you tonight ?
Yes ( go to Q 14.1 ) Does not know ( go to Q 15 ) No ( go to Q 15 ) Refused to answer ( go to Q 15 )
Q14.1 - How many children will be staying with you tonight ?
_________ ( # of children ) Does not know Refused to answer
Q15 - Without mentioning any amounts, what are your sources of income ? Remember that your answers will remain strictly confidential Check all that apply, read list if necessary
No income Social assistance Disability assistance Old Age Security / Income supplement Pension Full-time employment (declared/legal)
Part-time employment (declared/legal) Full-time employment (undeclared/illegal) Part-time employment (undeclared/illegal) EI (unemployment)
Panhandling Do not know Refused to answer Other : ___________________________
THANK YOU. CAN I OFFER YOU A CARD THAT YOU CAN EXCHANGE FOR A COFFEE AT TIM HORTONS OR A GRANOLA BAR ? ( Show the two options to the person )
THANK YOU VERY MUCH. THE QUESTIONNAIRE IS FINISHED.

MARCH 24, 2015 NAME OF SHELTER / HOUSING PROVIDER _____________________________________
I COUNT MONTRÉAL 2015QUESTIONNAIRE FOR EMERGENCY SHELTERS AND TRANSITIONAL HOUSING
Option A : VolunteerPlease read the following paragraph to every potential participant :
Hello, my name is ( first name ), and I am a volunteer with I Count Montréal, a project funded by the City of Montréal ( show your badge to the person ). We are doing a survey regarding housing instability. We need to approach everyone we meet. This survey is very important to us, but you are completely free to refuse to answer. It is anonymous and confidential. Neither your name nor any other identifying information will be written down. Do you agree to continue ?
Yes ( go to Q 1 ) No Say : “Thank you, goodbye”
Option B : Staff person or other person internal to the resourcePlease read the following paragraph to every potential participant, adapting as needed according to what will already have been explained in a group setting:
Hi, I’d like to invite you to participate in a brief survey on residential instability. The I Count Montreal project, which is funded by the City of Montreal, is responsible for this survey. The survey is very important for its organizers, but you are completely free to refuse to respond. It is anonymous and confidential, and your name and any other identifying information will not be noted down. Do you agree to continue?
Yes ( go to Q 1 ) No Say : “Thank you, goodbye”
Q1 - Have you already answered questions from someone wearing this badge ? Show your badge to the person
Yes Say : “Thank you very much for your participation.” ( finish the survey ) No
Q2 - Aside from this shelter or transitional housing where we are now, do you have your own fixed residence where you can go tonight if you wish ?
Yes ( go to Q 3 ) Refused to answer ( finish the survey ) No ( go to Q 4 ) Does not know ( go to Q 4 )
Q3 - What kind of a place is it ? Do not read the list
Are you planning on returning there soon ? Yes ( say : “thank you very much, the questionnaire is completed.” ) No ( go to Q 4 ) Refused to answer ( Say : “thank you very much, the questionnaire is completed.” ) Does not know ( go to Q 4 )
Vehicle, abandoned building, etc. Transitional housing Makeshift shelter, or tent in a park, forest, etc. Detox or treatment centre Rooming house Emergency shelter Staying / housed with someone else Hospital Outside Does not know Hotel or Motel Refused to answer
Q4 - Ask only if this questionnaire is administered after March 24 Did you spend the night of March 24 in this shelter or transitional housing where we are now ?
Yes ( go to Q5 ) No ( go to Q4.1 )
Apartment or house or other residence with lease or contract of indefinite duration
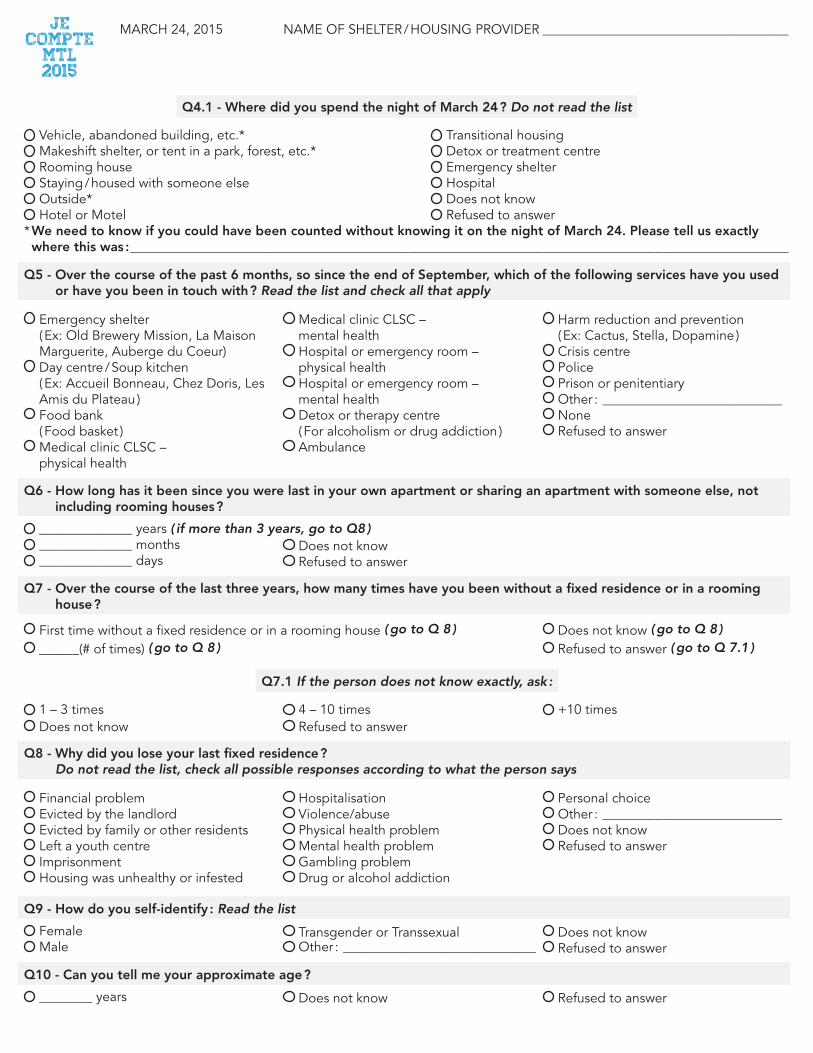
MARCH 24, 2015 NAME OF SHELTER / HOUSING PROVIDER _____________________________________
Q4.1 - Where did you spend the night of March 24 ? Do not read the list
Vehicle, abandoned building, etc.* Transitional housing Makeshift shelter, or tent in a park, forest, etc.* Detox or treatment centre Rooming house Emergency shelter Staying / housed with someone else Hospital Outside* Does not know Hotel or Motel Refused to answer
* We need to know if you could have been counted without knowing it on the night of March 24. Please tell us exactly where this was : ___________________________________________________________________________________________________
Q5 - Over the course of the past 6 months, so since the end of September, which of the following services have you used or have you been in touch with ? Read the list and check all that apply
Emergency shelter ( Ex: Old Brewery Mission, La Maison Marguerite, Auberge du Coeur)
Day centre / Soup kitchen ( Ex: Accueil Bonneau, Chez Doris, Les Amis du Plateau )
Food bank ( Food basket )
Medical clinic CLSC – physical health
Medical clinic CLSC – mental health Hospital or emergency room – physical health Hospital or emergency room – mental health Detox or therapy centre ( For alcoholism or drug addiction ) Ambulance
Harm reduction and prevention ( Ex: Cactus, Stella, Dopamine ) Crisis centre Police Prison or penitentiary Other : ___________________________ None Refused to answer
Q6 - How long has it been since you were last in your own apartment or sharing an apartment with someone else, not including rooming houses ?
______________ years ( if more than 3 years, go to Q8 ) ______________ months Does not know ______________ days Refused to answer
Q7 - Over the course of the last three years, how many times have you been without a fixed residence or in a rooming house ?
First time without a fixed residence or in a rooming house ( go to Q 8 ) Does not know ( go to Q 8 )
______(# of times) ( go to Q 8 ) Refused to answer ( go to Q 7.1 )
Q7.1 If the person does not know exactly, ask :
1 – 3 times 4 – 10 times +10 times Does not know Refused to answer
Q8 - Why did you lose your last fixed residence ? Do not read the list, check all possible responses according to what the person says
Financial problem Evicted by the landlord Evicted by family or other residents Left a youth centre Imprisonment Housing was unhealthy or infested
Hospitalisation Violence/abuse Physical health problem Mental health problem Gambling problem Drug or alcohol addiction
Personal choice Other : ___________________________ Does not know Refused to answer
Q9 - How do you self-identify : Read the list
Female Transgender or Transsexual Does not know Male Other : _____________________________ Refused to answer
Q10 - Can you tell me your approximate age ?
________ years Does not know Refused to answer

MARCH 24, 2015 NAME OF SHELTER / HOUSING PROVIDER _____________________________________
Q11 - Where were you born ?
If in Canada ( go to Q 12 ) : If in another country ( go to Q 11.1 ) :Province : ________________________________________________ Country : _______________________________________________City : ____________________________________________________ Year arrived in Canada : __________________________________
Q11.1 - Are you a : Read the list
Canadian citizen Temporary foreign worker Does not know Permanent resident International student Refused to answer Refugee claimant Other : _________________________________________________________________
Q12 - Do you self-identify as aboriginal ( including First Nations, Métis, Inuit ) ? Do not read the list, select all possible responses according to what the person says
Yes ( go to Q 12.1 ) Does not know ( go to Q 13 ) No ( go to Q 13 ) Refused to answer ( go to Q 13 )
Q12.1 - With which do you self-identify : Read the list
First Nations ( status ) Métis Does not know First Nations ( non-status ) Inuit Refused to answer Other : ________________________________________________________________________________________________________
Q13 - Have you ever served in the Canadian armed forces ?
Yes Does not know No Refused to answer
Q14 - Are there any children under the age of 18 staying with you tonight ?
Yes ( go to Q 14.1 ) Does not know ( go to Q 15 ) No ( go to Q 15 ) Refused to answer ( go to Q 15 )
Q14.1 - How many children will be staying with you tonight ?
_________ ( # of children ) Does not know Refused to answer
Q15 - Without mentioning any amounts, what are your sources of income ? Remember that your answers will remain strictly confidential Check all that apply, read list if necessary
No income Social assistance Disability assistance Old Age Security / Income supplement Pension Full-time employment (declared/legal)
Part-time employment (declared/legal) Full-time employment (undeclared/illegal) Part-time employment (undeclared/illegal) EI (unemployment)
Panhandling Do not know Refused to answer Other : ___________________________
THANK YOU. CAN I OFFER YOU A CARD THAT YOU CAN EXCHANGE FOR A COFFEE AT TIM HORTONS OR A GRANOLA BAR ? ( Show the two options to the person )
THANK YOU VERY MUCH. THE QUESTIONNAIRE IS FINISHED.

MARCH 25-26, 2015 NAME OF DAY CENTRE / SOUP KITCHEN ______________________________________
I COUNT MONTRÉAL 2015SCREENING FORM FOR DAY CENTRES AND SOUP KITCHENS
Option A : VolunteerPlease read the following paragraph to every potential participant :
Hello, my name is ( first name ), and I am a volunteer with I Count Montréal, a project funded by the City of Montréal ( show your badge to the person ). We are doing a survey regarding housing instability. We need to approach everyone we meet. This survey is very important to us, but you are completely free to refuse to answer. It is anonymous and confidential. Neither your name nor any other identifying information will be written down. Do you agree to continue ?
Yes ( go to Q 1 ) No Say : “Thank you, goodbye” ( record in the tally sheet )
Option B : Staff person or other person internal to the resourcePlease read the following paragraph to every potential participant, adapting as needed according to what will already have been explained in a group setting:
Hi, I’d like to invite you to participate in a brief survey on residential instability. The I Count Montreal project, which is funded by the City of Montreal, is responsible for this survey. The survey is very important for its organizers, but you are completely free to refuse to respond. It is anonymous and confidential, and your name and any other identifying information will not be noted down. Do you agree to continue?
Yes ( go to Q 1 ) No Say : “Thank you, goodbye” ( record in the tally sheet )
Q1 - Have you already answered questions from someone wearing this badge ? Show your badge to the person
Yes Say : “Thank you very much for your participation.” ( finish the survey ) No
Q2 - Do you have your own fixed residence where you can go tonight if you wish ?
Yes ( go to Q 3 ) Refused to answer ( finish the survey ) No ( go to Q 4 ) Does not know ( go to Q 4 )
Q3 - What kind of a place is it ?
Are you planning on returning there soon ? Yes ( say : “thank you very much, the questionnaire is completed.” ) No ( go to Q 4 ) Refused to answer ( Say : “thank you very much, the questionnaire is completed.” ) Does not know ( go to Q 4 )
Other responses to question 3 : Continue with the rest of the questionnaire.
*Do not forget to fill out the tally sheet if the interview is finished
Apartment or house or other residence with lease or contract of indefinite duration

MARCH 25-26, 2015 NAME OF DAY CENTRE / SOUP KITCHEN ______________________________________
I COUNT MONTRÉAL 2015QUESTIONNAIRE FOR DAY CENTRES AND SOUP KITCHENS
( End of Question 3. Answer only if the person answered “Yes” to question 2. )
Q3b - What kind of a place is it ? Do not read the list
Vehicle, abandoned building, etc. Transitional housing Makeshift shelter, or tent in a park, forest, etc. Detox or treatment centre Rooming house Emergency shelter Staying / housed with someone else Hospital Outside Does not know Hotel or Motel Refused to answer
Q4 - Where did you spend the night of March 24 ? Do not read the list
Vehicle, abandoned building, etc.* Transitional housing Makeshift shelter, or tent in a park, forest, etc.* Detox or treatment centre Rooming house Emergency shelter Staying / housed with someone else Hospital Outside* Does not know Hotel or Motel Refused to answer
* We need to know if you could have been counted without knowing it on the night of March 24. Please tell us exactly where this was : ___________________________________________________________________________________________________
Q5 - Over the course of the past 6 months, so since the end of September, which of the following services have you used or have you been in touch with ? Read the list and check all that apply
Emergency shelter ( Ex: Old Brewery Mission, La Maison Marguerite, Auberge du Coeur)
Day centre / Soup kitchen ( Ex: Accueil Bonneau, Chez Doris, Les Amis du Plateau )
Food bank ( Food basket )
Medical clinic CLSC – physical health
Medical clinic CLSC – mental health Hospital or emergency room – physical health Hospital or emergency room – mental health Detox or therapy centre ( For alcoholism or drug addiction ) Ambulance
Harm reduction and prevention ( Ex: Cactus, Stella, Dopamine ) Crisis centre Police Prison or penitentiary Other : ___________________________ None Refused to answer
Q6 - How long has it been since you were last in your own apartment or sharing an apartment with someone else, not including rooming houses ?
______________ years ( if more than 3 years, go to Q8 ) ______________ months Does not know ______________ days Refused to answer
Q7 - Over the course of the last three years, how many times have you been without a fixed residence or in a rooming house ?
First time without a fixed residence or in a rooming house ( go to Q 8 ) Does not know ( go to Q 8 )
______(# of times) ( go to Q 8 ) Refused to answer ( go to Q 7.1 )
Q7.1 If the person does not know exactly, ask :
1 – 3 times 4 – 10 times +10 times Does not know Refused to answer
Q8 - Why did you lose your last fixed residence ? Do not read the list, check all possible responses according to what the person says
Financial problem Evicted by the landlord Evicted by family or other residents Left a youth centre Imprisonment Housing was unhealthy or infested
Hospitalisation Violence/abuse Physical health problem Mental health problem Gambling problem Drug or alcohol addiction
Personal choice Other : ___________________________ Does not know Refused to answer

MARCH 25-26, 2015 NAME OF DAY CENTRE / SOUP KITCHEN ______________________________________
Q9 - How do you self-identify : Read the list
Female Transgender or Transsexual Does not know Male Other : _____________________________ Refused to answer
Q10 - Can you tell me your approximate age ?
________ years Does not know Refused to answer
Q11 - Where were you born ?
If in Canada ( go to Q 12 ) : If in another country ( go to Q 11.1 ) :Province : ________________________________________________ Country : _______________________________________________City : ____________________________________________________ Year arrived in Canada : __________________________________
Q11.1 - Are you a : Read the list
Canadian citizen Temporary foreign worker Does not know Permanent resident International student Refused to answer Refugee claimant Other : _________________________________________________________________
Q12 - Do you self-identify as aboriginal ( including First Nations, Métis, Inuit ) ? Do not read the list, select all possible responses according to what the person says
Yes ( go to Q 12.1 ) Does not know ( go to Q 13 ) No ( go to Q 13 ) Refused to answer ( go to Q 13 )
Q12.1 - With which do you self-identify : Read the list
First Nations ( status ) Métis Does not know First Nations ( non-status ) Inuit Refused to answer Other : ________________________________________________________________________________________________________
Q13 - Have you ever served in the Canadian armed forces ?
Yes Does not know No Refused to answer
Q14 - Are there any children under the age of 18 staying with you tonight ?
Yes ( go to Q 14.1 ) Does not know ( go to Q 15 ) No ( go to Q 15 ) Refused to answer ( go to Q 15 )
Q14.1 - How many children will be staying with you tonight ?
_________ ( # of children ) Does not know Refused to answer
Q15 - Without mentioning any amounts, what are your sources of income ? Remember that your answers will remain strictly confidential Check all that apply, read list if necessary
No income Social assistance Disability assistance Old Age Security / Income supplement Pension Full-time employment (declared/legal)
Part-time employment (declared/legal) Full-time employment (undeclared/illegal) Part-time employment (undeclared/illegal) EI (unemployment)
Panhandling Do not know Refused to answer Other : ___________________________
THANK YOU. CAN I OFFER YOU A CARD THAT YOU CAN EXCHANGE FOR A COFFEE AT TIM HORTONS
THANK YOU VERY MUCH. THE QUESTIONNAIRE IS FINISHED.

59
APPENDIX B: Organizations and facilities we contacted
B.1 Shelters that took part in the March 24 count
� Carrefour d’alimentation et de partage St-Barnabé � Chaînon (Le) � Maison de l'Espérance (La) � Maison du Père � Welcome Hall Mission � Old Brewery Mission - Patricia Mackenzie Pavilion � Old Brewery Mission – Webster Pavilion � Aboriginal Projects, Quebec � Refuge des Jeunes (Le)
B.2 Transitional housing facilities that took part in the count from March 24 to 26
� Abri d'Espoir (L’) – The Salvation Army � Accueil Bonneau - Maison Claire-Ménard � Arrêt-Source (L') � Assistance aux Femmes de Montréal � Auberge Madeleine � Avenue (L’) - Auberge du cœur � Chaînon (Le) � Chrysalide (La) � Dauphinelle (La) � Escalier (L') � Foyer des jeunes travailleurs et travailleuses de Montréal � Logis Rose-Virginie � Maison Amaryllis � Maisons de l'Ancre (Les) � Maison du Père - Transit � Maison Grise de Montréal (La) � Maison l'Éclaircie � Maison Marguerite � Carrefour Familial Hochelaga – Maison Oxygène � Maison Passages � Maison Tangente � Herstreet � Tournant (Le) - Auberge du cœur � YWCA Montreal

60
B.3 Day centres that that took part in the count on March 25 or 26
� Accueil Bonneau � Action Santé de Pointe Saint-Charles � Cactus Montréal � Café 1818 Gilford - Dîners-St-Louis � Café Deuxième Chance � Carrefour d'Alimentation et de Partage Saint-Barnabé � Centre d'amitié Aboriginal de Montréal � Centre De Formation Générale Adulte Place Cartier � Centre de Jour St-James � Centre de soir Denise-Massé � Centre d'Écoute et d'Intervention Face à Face � Centre d'éducation des adultes Jeanne-Sauvé � Centre Wellington � Chez Doris � Chez Pops - Dans la rue � Chic Resto Pop (Le) � Club AMI � Comité social Centre-Sud � Dopamine � Femmes du monde � Fourchettes de l'Espoir � GEIPSI (Groupe d'entraide à l'intention des people séropositives, itinérantes et
toxicomanes) � Groupe d'entraide Lachine � L'Itinéraire � Mains tendues/ Extended hands � Maison Benoît Labre (La) � Maison des Amis du Plateau Mont-Royal (La) � Maison l’Échelon � Maison l’exode � Saint Columba House � Marie Debout (La), Centre d’éducation de femmes � Méta d’Âme � Welcome Hall Mission � Mission Communautaire Mile-End � Old Brewery Mission – Café Mission � Missionnaires de la Charité � Multicaf � Œuvre Soupe Maison � Open Door (The) / La porte ouverte

61
� PAS de la rue (Le) � Phare de Montréal (Le) – The Salvation Army � Phare (Le) - Les Œuvres de Saint-Jacques � Plein Milieu � P'tite maison Saint-Pierre (La) � RAP Jeunesse � Refuge des Jeunes (Le) � Resto Plateau � RÉZO � ROC (Le), Aide aux jeunes – Welcome Hall Mission � Herstreet � Sac à Dos (Le) � Saint-Willibrord - Soupe populaire � Spectre de rue � St. Michael's Mission – The Red Roof � Stella � Table Ronde de Saint-Léonard (La)
B.4 Organizations and facilities we contacted after March 26
Facility Type Administrative region
Autre maison (L’) - centre de crise Crisis centre Montreal
Centre d'intervention de crise l'Appoint Crisis centre Montreal
Centre de crise de l'Ouest de l'Île Crisis centre Montreal
Centre de crise L'Entremise Crisis centre Montreal
Centre de crise Le Transit Crisis centre Montreal
Centre de crise Tracom Crisis centre Montreal
Centre de détention de Montréal (Prison de Bordeaux) Detention centre Montreal
Centre de détention de Rivière-des-Prairies Detention centre Montreal
Centre de détention Tanguay Detention centre Montreal
Centres opérationnels du Service de police de la Ville de Montréal Detention cells Montreal
Sidalys - Centre Sida Secours Respite centre Montreal
Aube de la Paix Therapy centre outside Montreal Chaudière-Appalaches

62
Centre d'Aide et de Réhabilitation pour Alcooliques et Toxicomanes - CARAT
Therapy centre outside Montreal Montérégie
Carrefour de l'Espoir Therapy centre outside Montreal Eastern Townships
Carrefour Le Point Tournant Therapy centre outside Montreal Montérégie
Centre Caroline Roy Therapy centre outside Montreal Eastern Townships
Centre Corps, Âme et Esprit Therapy centre outside Montreal Eastern Townships
Centre de réadaptation en dépendance Domrémy-de-la-Mauricie Centre-du-Québec
Therapy centre outside Montreal
Mauricie-et-Centre-du-Québec
Foster Addiction Rehabilitation Centre (CRD Foster) Therapy centre outside Montreal Montérégie
Centre de traitement des dépendances Science de la vie
Therapy centre outside Montreal Montérégie
Centre Domrémy des Appalaches Therapy centre outside Montreal Chaudière-Appalaches
Centre l'Envolé de Granby Therapy centre outside Montreal Montérégie
Centre Nouveau Regard Therapy centre outside Montreal Lanaudière
Centre Nouvelle-Vie Therapy centre outside Montreal Lanaudière
Centre NuHab Therapy centre outside Montreal Eastern Townships
Centre Sur l'Autre Rive Therapy centre outside Montreal Montérégie
Dianova - Centre de Terrebonne Therapy centre outside Montreal Lanaudière
Domaine Perce-Neige Therapy centre outside Montreal Eastern Townships
Heritage Home Foundation Therapy centre outside Montreal Montérégie
L'Autre Côté de l'Ombre Therapy centre outside Montreal
Mauricie-et-Centre-du-Québec
La Croisée des chemins Therapy centre outside Montreal Chaudière-Appalaches
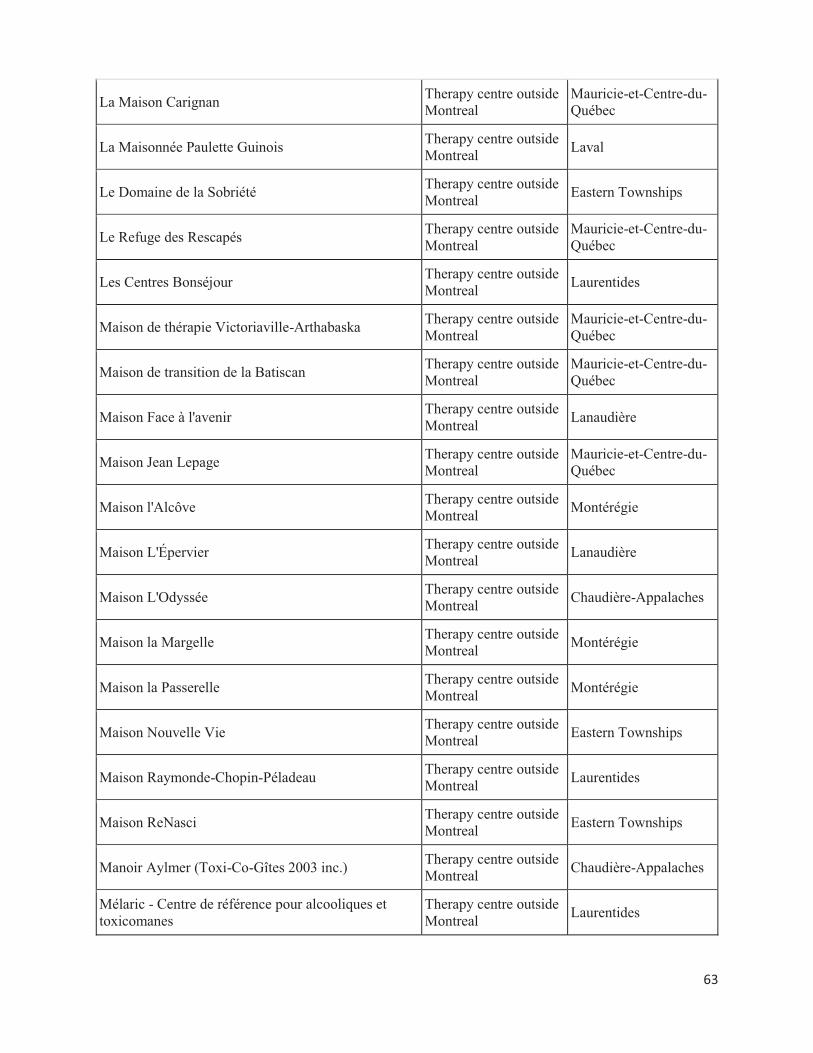
63
La Maison Carignan Therapy centre outside Montreal
Mauricie-et-Centre-du-Québec
La Maisonnée Paulette Guinois Therapy centre outside Montreal Laval
Le Domaine de la Sobriété Therapy centre outside Montreal Eastern Townships
Le Refuge des Rescapés Therapy centre outside Montreal
Mauricie-et-Centre-du-Québec
Les Centres Bonséjour Therapy centre outside Montreal Laurentides
Maison de thérapie Victoriaville-Arthabaska Therapy centre outside Montreal
Mauricie-et-Centre-du-Québec
Maison de transition de la Batiscan Therapy centre outside Montreal
Mauricie-et-Centre-du-Québec
Maison Face à l'avenir Therapy centre outside Montreal Lanaudière
Maison Jean Lepage Therapy centre outside Montreal
Mauricie-et-Centre-du-Québec
Maison l'Alcôve Therapy centre outside Montreal Montérégie
Maison L'Épervier Therapy centre outside Montreal Lanaudière
Maison L'Odyssée Therapy centre outside Montreal Chaudière-Appalaches
Maison la Margelle Therapy centre outside Montreal Montérégie
Maison la Passerelle Therapy centre outside Montreal Montérégie
Maison Nouvelle Vie Therapy centre outside Montreal Eastern Townships
Maison Raymonde-Chopin-Péladeau Therapy centre outside Montreal Laurentides
Maison ReNasci Therapy centre outside Montreal Eastern Townships
Manoir Aylmer (Toxi-Co-Gîtes 2003 inc.) Therapy centre outside Montreal Chaudière-Appalaches
Mélaric - Centre de référence pour alcooliques et toxicomanes
Therapy centre outside Montreal Laurentides

64
Pavillon Alternatif Therapy centre outside Montreal
Mauricie-et-Centre-du-Québec
Pavillon de l'assuétude Therapy centre outside Montreal
Mauricie-et-Centre-du-Québec
Pavillon Hamford Therapy centre outside Montreal Laurentides
Pavillon L’Essence Ciel Therapy centre outside Montreal Montérégie
Pavillon Louis-Cyr Therapy centre outside Montreal Lanaudière
Pavillon Pierre-Péladeau Therapy centre outside Montreal Laurentides
Pavillons du Nouveau Point de Vue Therapy centre outside Montreal Lanaudière
Portage - Prévost Therapy centre outside Montreal Laurentides
Réhabilitation de Beauce Therapy centre outside Montreal Chaudière-Appalaches
Sentier du Nouveau Jour Therapy centre outside Montreal Laurentides
Toxi-Co-Gîte - Domaine Orford Therapy centre outside Montreal Eastern Townships
Toxi-Co-Gîte - Upton Therapy centre outside Montreal Montérégie
Un foyer pour toi Therapy centre outside Montreal Laval
Villa de la Paix II Therapy centre outside Montreal Lanaudière
BonSecours Therapy centre in Montreal Montreal
Booth Centre – The Salvation Army – The Ancrage Therapy centre in Montreal Montreal
Centre de réadaptation en dépendance de Montréal - Institut universitaire
Therapy centre in Montreal Montreal
Centre Toxico-Stop Therapy centre in Montreal Montreal
Foundation Center of Addington House Therapy centre in Montreal Montreal

65
Escale Notre-Dame (L’) Therapy centre in Montreal Montreal
Escale pour Elle (L’) Centre for victims of violence Montreal
Maison le Pharillon (La) Therapy centre in Montreal Montreal
Maison Jean Lapointe Therapy centre in Montreal Montreal
Maison L'Exode Therapy centre in Montreal Montreal
Pavillon Chatsworth Therapy centre in Montreal Montreal
Pavillon Foster Therapy centre in Montreal Montreal
Portage - Montréal Therapy centre in Montreal Montreal
Welcome Hall Residences – Addiction Treatment Program
Therapy centre in Montreal Montreal
Auberge Shalom women’s shelters Centre for victims of violence Montreal
Inter-Val 1175 Centre for victims of violence Montreal
Maison Dalauze Centre for victims of violence Montreal
Shield of Athena emergency shelter Centre for victims of violence Montreal
Maison Flora Tristan - Première étape 3 mois Centre for victims of violence Montreal
Maison secours aux femmes de Montréal Centre for victims of violence Montreal
Multi-Femmes Centre for victims of violence Montreal
Parados (Le) Centre for victims of violence Montreal
West Island Women’s Shelter Centre for victims of violence Montreal
Soutien et abri aux aînés victimes d'abus - SAVA Centre-Ouest
Centre for victims of violence Montreal

66
Transit 24 Centre for victims of violence Montreal
Auberge Transition Centre for victims of violence Montreal
Scalabrini Centre of Montreal for Refugees and Immigrants Shelter for new arrivals Montreal
Native Women’s Shelter of Montreal Shelter for new arrivals Montreal
St. Mary Hospital Centre Hospital Montreal
CHUM Hospital Montreal
MUHC – Lachine Hospital Hospital Montreal
MUHC – Montreal General Hospital Hospital Montreal
MUHC – Royal Victoria Hospital Hospital Montreal
LaSalle Hospital Hospital Montreal
Verdun Hospital Hospital Montreal
Hôpital du Sacré-Coeur de Montréal - including Pavillon Albert Prévost Hospital Montreal
Hôpital Fleury Hospital Montreal
Lakeshore General Hospital Hospital Montreal
Jewish General Hospital Hospital Montreal
Jean-Talon Hospital Hospital Montreal
Hôpital Maisonneuve-Rosemont Hospital Montreal
Hôpital Rivière-des-Prairies Hospital Montreal
Santa Cabrini Hospital Hospital Montreal
Institut Philippe-Pinel de Montréal Hôpital Montreal
Institut universitaire en santé mentale de Montréal Hospital Montreal
Douglas Hospital Mental Health Institute Hospital Montreal
Alternat'Elle Transitional housing Montreal
Auberge communautaire du Sud-Ouest (L’) Transitional housing Montreal
Carrefour communautaire de Rosemont - L'Entre-Gens Transitional housing Montreal

67
Booth Centre – The Salvation Army – The Gouvernail Transitional housing Montreal
Centre NAHA Transitional housing Montreal
Dîners St-Louis - Logement de transition Transitional housing Montreal
En Marge 12-17 (logement social) Transitional housing Montreal
En Marge 12-17 (moyen terme) Transitional housing Montreal
Héberjeune de Parc-Extension Transitional housing Montreal
Logifem Transitional housing Montreal
Elizabeth House Transitional housing Montreal
Maison Flora Tristan - Deuxième étape 11 mois Transitional housing Montreal
Maison L'Océane Transitional housing Montreal
Mères avec pouvoir - MAP Montréal Transitional housing Montreal
Méta d'Âme Transitional housing Montreal
Welcome Hall Mission – Transitional housing Transitional housing Montreal
Nouvelle Étape Transitional housing Montreal
Passerelle Transitional housing Montreal
Welcome Hall Mission Residences – transitional housing Transitional housing Montreal
Ressources Jeunesse de St-Laurent Transitional housing Montreal
Service d'hébergement St-Denis Transitional housing Montreal
YMCA - residences Transitional housing Montreal
Dans la Rue - The Bunker Emergency shelter Montreal
En Marge 12-17 (hébergement d'urgence) Emergency shelter Montreal
68
APPENDIX C: Method for estimating the number of people who spent the night of March 24 unsheltered
Our estimate of the number of people who spent the night of March 24 unsheltered was calculated as follows:
a) Add the 280 who answered a questionnaire to the 110 clearly homeless, to get a total of 390.
b) Out of 184 outdoor locations, 44 were not covered. The average of the number of people
identified (questionnaires + clearly homeless) by sector in each borough was calculated and then multiplied by the number of sectors in the borough that were not covered. That gave us an estimate of the number of additional people who would have been identified in each borough. The Table below has the adjusted figures, which show that if all sectors had been covered we might have been able to find an additional 67 people, bringing the total to 457.
c) We then made an adjustment for the number of decoys who were not found. Of the 46 decoys stationed in places where they might have been found (because volunteers went to that sector), 31 or 67.4% were actually found. That indicates that 67 out of 100 actually homeless people in any given territory would have been found by the volunteer teams. Dividing 457 by 0.674, we obtained an estimate of 678 people who could have been identified if all the sectors had been covered and all the actual homeless people in all the sectors had been identified
d) Lastly, we note that although 280 people filled in the questionnaires, once we had reclassified them only 177 people, or 63.2% of the 280, could be considered to have passed the night unsheltered. Assuming that the clearly homeless also spent may have spent the night in other places, using the same percentage as for the people who filled in the questionnaires, out of the 678 people who could have been identified if all the sectors had been covered and everyone identified, we may consider that 678 x 0.632 = 429 people actually spent the night unsheltered.
It should be noted that, to our knowledge, we are the only city to have added step d). Toronto is no longer using step b) but that is due in part to the fact that all its highest-density central sectors had been covered and the corresponding adjustment in 2009 had added only 39 people. Only Toronto and New York made the adjustment for decoys. Step d) is based on a reclassification of the questionnaires that we are the only city to have done, as far as we know. Are the 249 (678 – 429) people we withdrew accounted for in the final estimate of the visibly homeless? The answer is yes, because the total number in the other categories (shelters, transitional housing and institutional care) was determined by the total number of people residing in such places on the night of March 24.

69
Table C.1 Estimate of the number of people who would have been identified as homeless if all the sectors had been covered, by borough
Borough Number
of sectors
Number of
missing sectors
Per-centage
of missing sectors
Average by
sector
Estimate of the
number of people
to add
Total before
estimate
Total after
estimate
Ahunstic-Cartierville 5 3 60.00 1.5 4.5 3 8
CDN-NDG 8 1 12.50 0.7 0.7 5 6
Dorval 1 0 0.00 2.0 0.0 2 2
Kirkland 1 1 100.00 0.0 0.0 0 0
Mercier - Hochelaga 18 5 27.78 1.3 6.5 17 24
Montreal West - VSP 1 0 0.00 3.0 0.0 3 3
Montreal North 1 1 100.00 0.0 0.0 0 0
Plateau MR 18 2 11.11 1.6 3.3 26 29
RDP 2 0 0.00 0.5 0.0 1 1
Rosemont - LPP 16 5 31.25 1.4 6.8 15 22
Saint-Laurent 1 0 0.00 2.0 0.0 2 2
Southwest 32 10 31.25 0.4 3.6 8 12
Verdun 5 2 40.00 3.7 7.3 11 18
Ville-Marie 57 9 15.79 2.2 19.7 105 125
Villeray - SMPE 15 3 20.00 0.1 0.3 1 1
Westmount 3 2 66.67 7.0 14.0 7 21
Subtotal (regular sectors) 184 44 23.91 206 273
Subtotal (other sectors) 34 184 184
TOTAL 218 390 457

Centre intégré universitairede santé et de services sociauxde l’Ouest-de-l’Île-de-Montréal
Project financed by