Buchin Thesis
88
1 Assessing the Impact of Automated Path Planning Aids in the Maritime Community by Mariela Buchin Submitted to the Department of EECS On February 3, 2009 in Partial Fulfillment of the Requirements for the Degree of Master of Engineering in Electrical Engineering and Computer Science Abstract In the area of merchant maritime navigation, electronic charts are a relatively new tool. As a result, navigational path planning environments that allow users to manually enter a path onto an electronic chart are becoming popular, especially in high-end civilian vessels. In military naval operations, however, the switch to newer technology for navigation is taking longer, as there is higher risk due to the weapons and sometimes nuclear reactors onboard. There also appears to be a pervasive lack of trust in automation. In order to incorporate automation into both military and commercial navigation tasks, a system must be designed that is not only efficient in aiding the planning, but also trustworthy to a user. Currently in military submarine and surface ship navigation, paths are planned and re-planned using paper charts, pencils, and rulers, and while these paths are adequate, they are often not optimized based on the depth, weather, and surrounding contacts. As part of a larger research project that is developing a tool to bring more situational awareness to a submarine commander, this thesis develops and implements an automation and visualization to aid submarine commanders in surface navigation. To achieve this, this thesis incorporated design requirements for creating such an automated tool in the development of an automated path planning tool, and then tested the resulting product on human subjects. The results showed that the automation was successful at reducing the time required to generate an optimized path for a set of changing input parameters. The results also showed that the tool was trustworthy, promising high potential for use in commercial and military environments. Thesis Supervisor: Mary Cummings Title: Associate Professor of Aeronautics and Astronautics
-
Upload
abdelhakimlimpulsif -
Category
Documents
-
view
217 -
download
0
Transcript of Buchin Thesis

1
Assessing the Impact of Automated Path Planning Aids
in the Maritime Community
by
Mariela Buchin
Submitted to the Department of EECS
On February 3, 2009 in Partial Fulfillment of the Requirements for the Degree of
Master of Engineering in Electrical Engineering and Computer Science
Abstract In the area of merchant maritime navigation, electronic charts are a relatively new
tool. As a result, navigational path planning environments that allow users to manually
enter a path onto an electronic chart are becoming popular, especially in high-end civilian
vessels. In military naval operations, however, the switch to newer technology for
navigation is taking longer, as there is higher risk due to the weapons and sometimes
nuclear reactors onboard. There also appears to be a pervasive lack of trust in automation.
In order to incorporate automation into both military and commercial navigation tasks, a
system must be designed that is not only efficient in aiding the planning, but also
trustworthy to a user.
Currently in military submarine and surface ship navigation, paths are planned
and re-planned using paper charts, pencils, and rulers, and while these paths are adequate,
they are often not optimized based on the depth, weather, and surrounding contacts. As
part of a larger research project that is developing a tool to bring more situational
awareness to a submarine commander, this thesis develops and implements an
automation and visualization to aid submarine commanders in surface navigation. To
achieve this, this thesis incorporated design requirements for creating such an automated
tool in the development of an automated path planning tool, and then tested the resulting
product on human subjects. The results showed that the automation was successful at
reducing the time required to generate an optimized path for a set of changing input
parameters. The results also showed that the tool was trustworthy, promising high
potential for use in commercial and military environments.
Thesis Supervisor: Mary Cummings
Title: Associate Professor of Aeronautics and Astronautics

2
Acknowledgements
Missy: Thank you for having me in your lab. It was a pleasure working with you and
being in your class. I have learned so much through your lab for which I am very
grateful. HAL has been one of my best experiences while being at MIT. Thank you for
making our lab the best lab at MIT.
Birsen: Thank you for all your help during my thesis writing. I appreciate all the hours
and weekends you spent helping me as I wrote.
Mom and Dad: Thank you for your support and love. Thank you for always encouraging
me in every aspect of my life. Thank you for your prayers and for being caring and loving
parents. I love you both!
Jarrod, Anthea, and Lindsey: I couldn't be here without you all. Your love and friendship
has helped carry me through so many obstacles. Thanks for being there for me when I
needed it. You’re the best brother and sisters ever!
Geoff: Thank you for being a great thesis partner. I appreciate your work ethic and your
ability to get things done no matter what the cost. I appreciate our talks and our pranks.
You are a great co-worker and brother in Christ.
Christin: Thanks for being my best buddy for our semester of knowing each other. Your
smiles and words of encouragement always brightened my day.
To all of Hal: Anna, Andrew, Ryan, Brian & Tuco, Carl, Yves, Yale, Sylvain, Jacen,
Jake, Mark, Jonathan, Jackie, & Farzan: Thank you for all the good times. It was great
working with you all this past year.
Mike O: Thank you for always being a source of light in my life. Thank you for always
reminding me to keep my sight on what is most important in life. Thank you for serving
God and others through Chi Alpha. Love is a verb.
Fish (aka Scott): Thank you for being there through the good and bad. Thank you for
teaching me how to tear apart a computer (and how to fry one). Thanks for always
offering support throughout my whole thesis and throughout my whole time at MIT.
Your friendship has meant so much to me.
Most of all, I thank Jesus Christ my Lord. It is in him I live, move, and have my being.

3
Table of Contents
Abstract ........................................................................................................................................... 1
Acknowledgements ......................................................................................................................... 2
Table of Contents ............................................................................................................................ 3
Table of Figures ............................................................................................................................... 5
1. Introduction ................................................................................................................................. 6
1.1 Motivation ............................................................................................................................. 6
1.2 Problem Statement................................................................................................................. 7
1.3 Research Methodology .......................................................................................................... 7
1.4 Thesis Organization ............................................................................................................... 8
2. Background ............................................................................................................................... 10
2.1 Current Manual Path Planning ............................................................................................ 10
2.3 Current Maritime Automated Path Planning Approaches ................................................... 13
2.4 Trust in Decision Aid Systems ............................................................................................ 18
3. Cognitive Task Analysis ............................................................................................................ 21
3.1 Background of CTA and HCTA .......................................................................................... 21
3.2 Hybrid CTA Results ............................................................................................................ 22
3.2 Subject Matter Expert Interviews ........................................................................................ 25
3.3 Lessons Learned .................................................................................................................. 27
4. Design and Implementation ....................................................................................................... 29
4.1 Designing for Trust.............................................................................................................. 30
4.2 General Layout and Program Foundations .......................................................................... 30
4.3 Manual Path Planner............................................................................................................ 34
4.4 Automated Path Planner ...................................................................................................... 38
Line Smoothing ..................................................................................................................... 40
Visibility Uncertainty ............................................................................................................ 41
Contact Uncertainty ............................................................................................................... 42
5. User Testing .............................................................................................................................. 47
5.1 Experimental Protocol ......................................................................................................... 47
Participants ................................................................................................................................ 47
Experimental Test-bed........................................................................................................... 48
Experimental Design ............................................................................................................. 51
Procedure ............................................................................................................................... 52
5.3 Results ................................................................................................................................. 54
5.4 Trust Analysis Tool Feedback ............................................................................................. 56
6. Conclusion ................................................................................................................................. 63
6.2 Future Work ........................................................................................................................ 64
Appendix A ............................................................................................................................... 67

4
Appendix B ................................................................................................................................ 69
Appendix C ................................................................................................................................ 71
Appendix D ............................................................................................................................... 73
Appendix E ................................................................................................................................ 83
References ..................................................................................................................................... 86

5
Table of Figures
Figure 1: Riskier contact regions in red, with clusters of neighboring contacts together into a
unified region. [Rothgeb, 2008] .................................................................................................... 13
Figure 2: Numerical Potential Field visualization ......................................................................... 17
Figure 3: Events flow diagram for avoiding collisions in unrestricted water (Cummings &
Carrigan, 2008) .............................................................................................................................. 23
Figure 4: General View of Navigation Display ............................................................................. 31
Figure 5: Depth and visibility sliders set cutoffs ........................................................................... 32
Figure 6: View selection and defining contact separation ............................................................. 33
Figure 7: Current path in black ...................................................................................................... 33
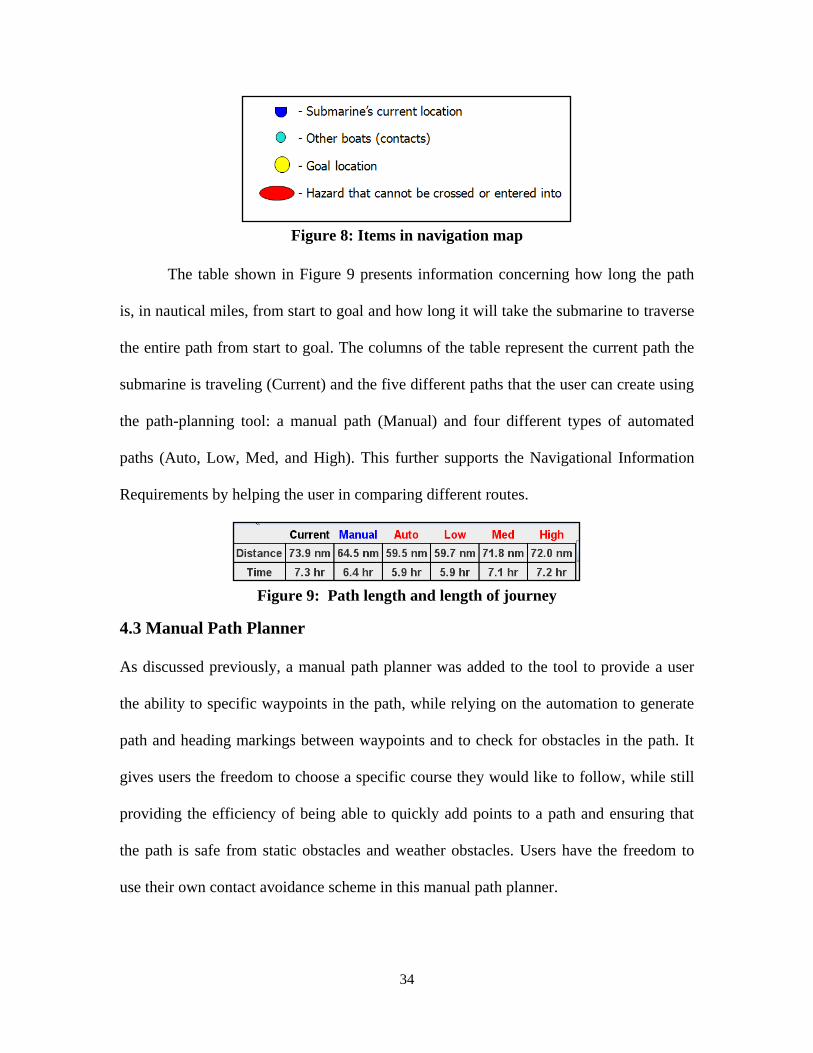
Figure 8: Items in navigation map ................................................................................................. 34
Figure 9: Path length and length of journey ................................................................................. 34
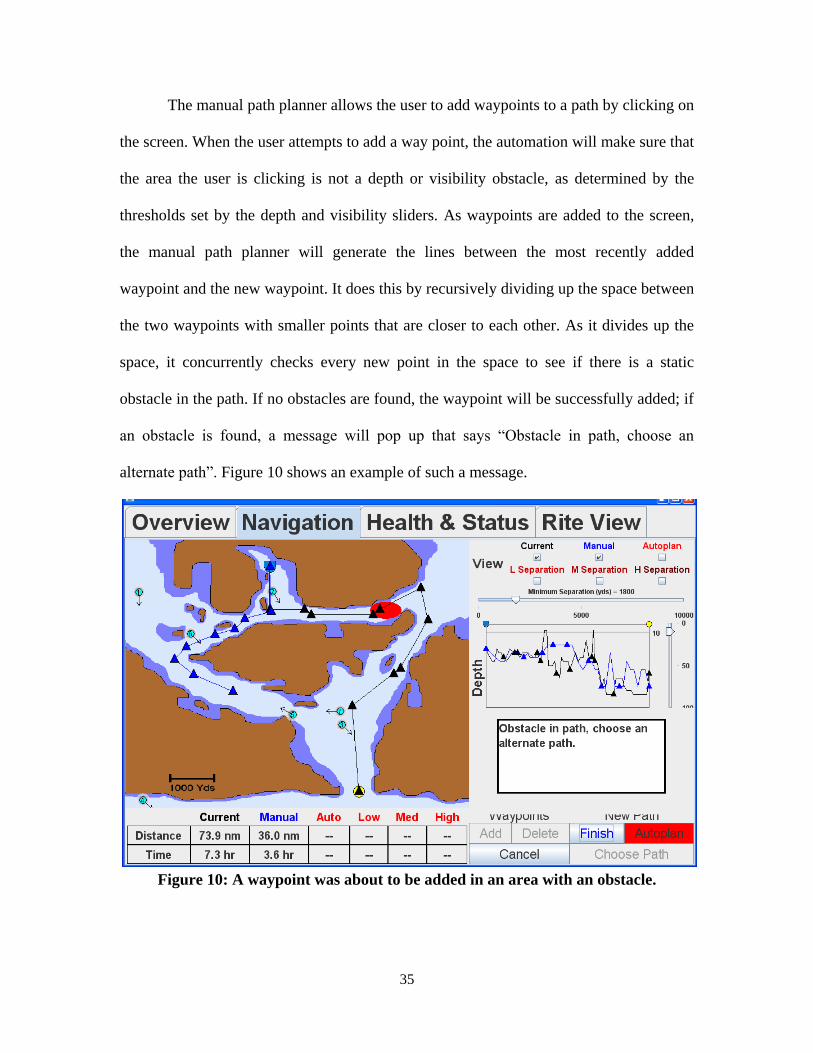
Figure 10: A waypoint was about to be added in an area with an obstacle. .................................. 35
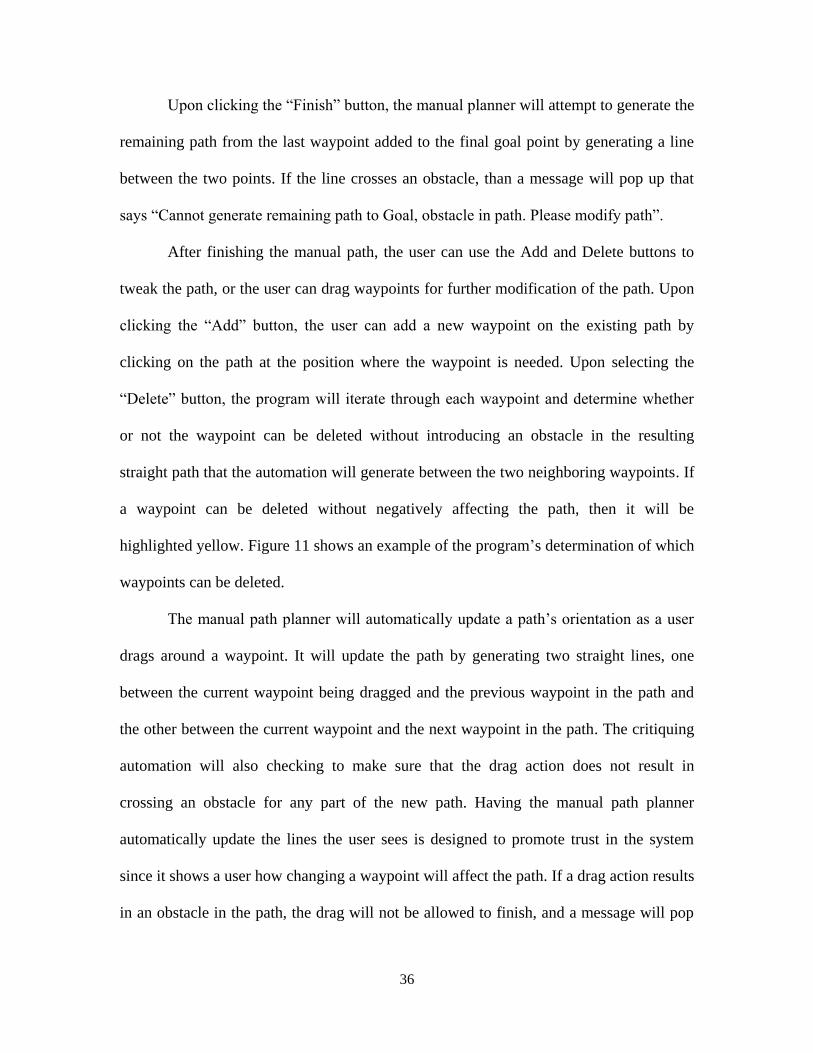
Figure 11: Waypoints that can be deleted are highlighted yellow................................................. 37
Figure 12: Original electronic chart (left) and reconstructed version (right). ............................... 39
Figure 13: Path after 1 (top left), 20 (top right), and 500 (bottom) iterations of the smoothing
algorithm ....................................................................................................................................... 41
Figure 14: Three circles around the contact denote varying degrees of separation. ...................... 44
Figure 15: Automated path planner: High Separation vs. no Separation ...................................... 45
Figure 16: Selection box sets the submarine on a new path. ......................................................... 49
Figure 17: Paper chart with depth values ...................................................................................... 50
Figure 18: Weather/Visibility Chart .............................................................................................. 50
Figure 19: Paper chart plotting tools ............................................................................................. 51
Figure 20: Scenario 1, submarine travels from top of the map to the bottom ............................... 53
Figure 21: Scenario 2, submarine travels from left-side of graph to the right ............................... 54
Figure 22: Time participants took to plan paths ............................................................................ 55
Figure 23: Path length differential of plotted paths to best path ................................................... 56
Figure 24: Question 1, Overall trust in system .............................................................................. 57
Figure 25: Question 2, Reliability of the automation .................................................................... 57
Figure 26: Question 3, Accuracy in creating efficient path ........................................................... 58
Figure 27: Question 4, Understanding behavior and displayed intent of automation. .................. 58
Figure 28: Question 5, Faith in automation for unknown situations ............................................. 59
Figure 29: Question 6, Ease in using the automation .................................................................... 59
Figure 30: Question 7, Robustness of automation. ........................................................................ 60
Figure 31: Question 8, Measurement of Preference in the automation ......................................... 60

6
1. Introduction
1.1 Motivation
With modern technology, a merchant ship navigator can now plan a course on an
electronic map using detailed information about the area to be navigated. Thus, rather
than using paper maps, a navigator can now utilize electronic maps such as the Electronic
Chart Display and Information System (ECDIS©
). Electronic map displays can be
configured to show different layers of detail upon zooming in or out, and one can select
specific pieces of information, for example depth and contour lines to be shown/not
shown at any time. There are also path-planning applications such as the Voyage
Management System (VMS©
), which uses these electronic charts to create path-planning
environments which allow a user to plan and customize their own path for navigation in
an easier and more informative fashion. The path planning aids found in these electronic
charting environments can also include weather information so that a navigator can take
the environment into account while planning a path.
Although these environments greatly improve the path-planning process, they still
require that a human does the cognitive work of calculating and choosing a good path for
their vessel to follow. This work could be expedited and the quality of the paths created
can be improved with the use of an intelligent automation. The computing power of
current day computers can be leveraged to help improve the path-planning process by
incorporating automated path-planners into current day navigation.
Although advanced navigation systems exist, some maritime organizations such
as the U.S. Navy still have not made the switch to this technology for the human-based
path planning process, and both military and commercial sectors of the maritime

7
community have not made the switch to using automation for path planning. Some Navy
ships, both surface and subsurface, use electronic charts for real-time surface navigation;
however, when it comes to path-planning, naval personnel still use the more familiar
paper maps and their own personal notes to plan and re-plan their routes. While
automated path planners can significantly reduce the workload of ship and submarine
navigators, the lack of use of automation in the naval domain suggests there is a lack of
trust in automated path planning technology. This distrust may be inhibiting the
acceptance and success of this potentially revolutionary technology.
1.2 Problem Statement
This thesis investigates ways to design an automated path planner for surface navigation
that can be used as an advisory tool for members of the maritime community, and have
functionality that stakeholders find reliable. It attempts to develop a trustworthy tool that
can help facilitate the maritime industry’s switch to automated navigation, as well as aid
in rapid route re-planning. The focus of this effort is on submarine surface navigation
since the broader research focus is rooted in this domain, but the results are generalizable
to all maritime communities.
1.3 Research Methodology
This thesis is part of a larger project called the Mobile Situational Awareness Tool
(MSAT), which is developing a portable interface that submarine commanders can use
for obtaining global situational awareness of the submarine. The focus of this thesis was
the development of a navigational interface, which is just one of many functionalities the
MSAT supports [Cummings & Carrigan, 2008]. The following are the objectives for this
thesis that will be further described in the following sections.
8
Objective 1: Develop functional and display requirements for manual path generation
and manipulation, and implement them in an actual display.
Objective 2: Develop a trustworthy automated path planner that enables course re-
planning.
Objective 3: Evaluate both human and automation-based methods of planning with
human subject experiments. Functional path planning involving automation and the
relationship between the automation’s design, the interface and algorithm, and the
users’ trust in the automation has not been extensively tested using human subject
experimentation in maritime settings.
Objective 4: Generate recommendations for future work based on civilian and
military personnel responses to the proposed automated path planner and associated
visualization designed to promote trust.
1.4 Thesis Organization
Chapter 2, Background, reviews previous research in maritime path planning,
both manual and automated. It also reviews research addressing trust in
automation.
Chapter 3, Cognitive Task Analysis (CTA), gives a description of the CTA used
to develop the interface design requirements and the lessons learned.
Chapter 4, Design and Implementation, describes the design choices made to
address the manual and automated path planning functionality and display
requirements. The final implementation is presented in detail.

9
Chapter 5, User Testing, presents the experimental protocol and trust analysis
tool used for the human subject testing. It also describes the analysis methods and
results.
Chapter 6, Conclusions, summarizes the key discoveries from this thesis, and
proposes recommendations for future research.

10
2. Background
This chapter presents the research on current technologies used in maritime navigation,
and discusses where there are short comings. It also introduces path-planners designed
for maritime navigation and as well as path-planners that are currently being used in other
domains. Moreover, collision avoidance displays are introduced and research involving
trust in automation is discussed in detail.
2.1 Current Manual Path Planning
A previous observational study conducted onboard the U.S.S. Palau revealed high levels
of cognitive and temporal demand associated with navigation tasks [Hutchins, 1995]. The
tools identified to be commonly used for navigation included: the alidade, which is a
device that sights a landmark and uses the line of sight for measuring the spatial
relationship between the home ship and that landmark, the hoey, which is a one arm
protractor used in translating the angular relationship between the home ship and a
landmark to a bearing on a map, parallel rulers, parallel motion protractors, and
compasses for plotting on charts, and distance scales and dividers for measuring distances
on charts for use in dead reckoning [Hutchins, 1995]. These devices all have degrees of
error to their accuracy. Moreover, the measurements are performed by and communicated
through multiple personnel, introducing the potential for communication errors.
An example Hutchins [1995] uses that shows how multiple people can be required
for a navigational task is the Sea and Anchor Piloting Detail which requires 10 different
roles: the navigator, assistant to the navigator, navigation plotter, navigation bearing
recorder/timer, starboard and port pelorus (a compass attached to a sighting telescope)

11
operators, restricted maneuvering helmsman, quartermaster of the watch, restricted
maneuvering helmsman in after-steering, and fathometer (depth) operator. This example
shows that using an automated path planner could greatly increase the accuracy and
speed of planning a path, since it would replace the physical tools that currently make
path planning slow and error prone. Moreover, such a tool has significant manning
implications since it is likely not as many people would be required.
As mentioned before, electronic charts such as ECDIS©
can be integrated with
programs such as VMS©
to allow a user to plan a course on an electronic map using
detailed information about the area to be navigated. While such path planning
environments allow users to plan and customize their own path for navigation in an easier
and more informative digital fashion, there is still room for the users to make mistakes,
such as a miscalculation of closest point of approach to another vessel, that can place
their course in areas where their ship shouldn’t go.
In addition to electronic charts, there are other aids currently used to support
manual path-planning such as Automatic Radar Plotting Aids (ARPA) which are radar
systems that help navigators by automating the tracking of other vessels in the water and
providing a navigational display for where other vessels are in the water [International
Maritime Organization, 1979]. Other systems include Automatic Identification System
(AIS) for indentifying and locating vessels and Long Range Identification and Tracking
(LRIT) System, both of which are coastal navigational supervising and assisting systems.
Over the past years, maritime navigation has become more reliant on such coastal
navigational supervising and assisting systems [Urbanski et al., 2008]. These systems are
used in addition to ship-borne systems such as ECDIS©
and Global Maritime Distress

12
Safety System (GMDSS), radar and ARPA. However, there is not sufficient integration
between the systems, creating more demand on operators to process and integrate all the
data presented to them [Urbanski et al., 2008].
A current initiative to help improve manual path-planning is research underway in
further automating contact management for collision avoidance in navigation. Two
examples of contact management decision aids are the “Safe Path Advisor” and the
“Avoidance Zone Advisor” developed by the Applied Research Laboratory from
Pennsylvania State University [Rothgeb, M., 2008]. These tools provide a visualization
showing the user where more navigationally risky areas are surrounding a submarine.
They also provide a way of clustering contacts that are close to each other into larger
areas that are denoted as risky.
Figure 1 shows a demonstration of the visualization developed to convey this
information to a user. The information obtained from using such a contact model needs to
be integrated with the other navigational path planning aids previously mentioned.

13
Figure 1: Riskier contact regions in red, with clusters of neighboring contacts
together into a unified region. [Rothgeb, 2008]
2.3 Current Maritime Automated Path Planning Approaches
Little research has investigated the use of automated path planning and re-planning in
maritime navigation. One exception is the work of Smierzchalski, et al. [1998], which
developed an automatic path planner that accounts for surrounding contacts and their
future positions, as well as the size and weight of the ship along with all other variables
affecting motion, such as center of gravity and size of control surfaces, in an effort to
predict accurately the future position of the submarine. The proposed algorithm, EP/N++,
which is a variant of the EP/N (Evolutionary Planner/Nagivator) algorithm for mobile
robots [Xiao et al., 1997], randomly generates paths that are acceptable in getting a ship
from one point to another, and uses an evaluation function to choose the path with the
14
least cost. The EP/N++ algorithm uses a contact model that varies the size of algorithm’s
internal representation of other vessels in the water as a function of their speed, heading,
and safe separation distance. The randomized approach adopted by the algorithm causes
the solutions to be near-optimal at best, with the optimal solution traded for algorithm
speed. This research is somewhat limited, as the proposed algorithm only takes into
account contacts in the vessel’s area of observation, 5-8 nautical miles (NM) in front of
the bow and 2-4 NM behind the stern, and it does not address uncertainties involved with
predicting where a contact will be in the future.
Smierzchalski, et al. [1998] tested their algorithm on scenarios that differed in the
amount of random paths the algorithm was allotted to generate and that differed in the
configuration of two or three contacts in the surrounding water. The length of time to
converge on a solution using the EP/N++ algorithm varied from 5 to 28 seconds
depending on the scenario. The algorithm was not extensively tested on enough scenarios
to show exactly how the run time of the algorithm was affected by the amount of paths
used. Also, there was no analysis on how the quality of the solution path was affected by
the amount of paths used and the configuration of the contacts. Although the algorithm
was tested on a set of different contact configurations, the algorithm was not tested on the
more computationally-expensive scenarios that would use more than just 3 contacts,
which would have better reflected a situation that would occur in real life especially in
the case of going in to port. Another limitation of this research was the lack of testing of
the algorithm with actual human navigators.
Although the automated path planning research in maritime navigation is limited,
there is extensive research in the field of robotic path planning which can provide useful

15
insights to maritime navigation. Path planning in navigation is a large area of research in
the computer science field [Winston, 1992], with significant research conducted in
robotic path planning [Thurn et al., 2002], [LaValle, 2006], [Russell & Norvig, 1995].
In addition to robotic path planning where the cost to travel from one point to
another on a graph is modeled as a definite or certain variable, there has also been
research in robotic path planning where the cost to travel is modeled as an uncertain
variable that changes in value depending on other variable values that are hard to predict
or model, such as congestion from traffic [Nikolova et al., 2006]. Nikolova et al. [2006]
presented two cost models, one with a quadratic cost function and one with a
combination of a quadratic and exponential cost function, for representing travel time and
the reliability/variance of a route that was physically valid. They used a combination of
dynamic programming and partial minimization techniques that when tested on grid
graphs, with up to 1600 nodes for the quadratic cost model and up to 100 nodes for the
quadratic and exponential cost model, had running times that were in the order of a few
seconds. However, memory was a limiting factor in how many nodes the algorithm could
handle.
One algorithm that will be further examined in this thesis that has been used in
some robotic path-planning initiatives, but unlike the previous algorithm, does not
address cost uncertainty, is the A* algorithm, which is an informed search method that
can quickly find an optimal path to a destination [Hart et al., 1968]. Its advantage is its
speed and its ability to calculate an optimal solution for the graph that it is presented with
as compared to the EP/N++ algorithm, which generates suboptimal solutions for its given
graph. Although the granularity of the graph affects how efficient a solution is for the A*

16
and EP/N++ algorithms, given the same graph and information, the A* algorithm will
return a better solution. Other algorithms such as Iterative Deepening A* (IDA*) and
Breadth-First Heuristic Search (BFHS) reduce the amount of memory used by their
algorithm at the expense of speed, which is useful for handling large data sets in
situations which are not time critical [Zhou & Hansen, 2004]. Although there has been a
lot of research in path-planning in the robotic field, there is a lack of research that uses
the knowledge gained from that field and applies it to maritime navigation.. The strengths
and weakness of some of the algorithms previously mentioned will be further analyzed in
Chapter 4 as part of the process of choosing an algorithm to be the backbone of the
automated path-planner.
In addition to creating an automated path-planner algorithm that is accurate and
fast, an intuitive operator interface should be designed to support operator interaction
with the automated path planner. Previous path-planning research that investigated
human interaction with an automated path planner examined developing path planning
support tools with visualizations for Lunar and planetary exploration [Marquez, 2007].
Figure 2 shows an example of a Numerical Potential Field (NPF) visualization, with the
darker colors representing higher cost areas for travel, that can be used to help a user plot
a low cost path with little cognitive work. Marquez [2007] examined how the use of
partial automatic path generation combined with the use of a Levels of Equal Cost
(LOEC) visualization, affected a users’ path planning performance. The results showed
that the users could use the LOEC visualization to quickly plan least-cost paths for
scenarios that required complex cost functions. This suggests that the human operator can

17
help the automated path planner to quickly come up with a least cost solution if an
intuitive interface is provided.
Figure 2: Numerical Potential Field visualization
The algorithm Marquez (2007) used to find a least-costly path was the Numerical
Potential Field Method, NPFM [Barraquand et al., 1992], [Marquez, 2007], [Rimon &
Koditschek, 1992], which is a form of gradient descent search. This method is
computationally expensive as it requires that a minimum total path cost from a cell to the
goal is calculated for every cell in the grid space being used. Calculating the minimum
total path cost for every cell is particularly expensive as all possible paths from a grid cell
to the goal cell are calculated in order to find the minimum cost for that cell. While this
algorithm provides means to create a potential field visualization, the overhead from
calculating the cost, or potential, for every cell makes the algorithm significantly slower
than a search method such as A*.
In summary, there is a general lack of research investigating human interaction
with automated path planners, especially in the maritime setting. Such a tool should
quickly generate an optimal path while taking into account a large amount of contacts in

18
the surrounding area. Also, there is a need to develop an interface that will allow users to
use this automation effectively.
2.4 Trust in Decision Aid Systems
New technologies in complex systems such as an automated path planner face the
challenge of gaining a level of trust from the operator of the system before the system is
accepted. When an operator has a low level of trust or too much trust in a system, the
system has the potential to be dangerous [Atoyan, D., R., 2006]. Distrust may lead to
system disuse, and over-trust may lead to inappropriate reliance on a system
[Parasuraman & Riley 1997].
There are six main components that are necessary to build trust [Muir & Morray,
1996]: predictability, dependability, faith, competence, responsibility, and reliability.
Where predictability is the degree to which one can predict the system’s state,
dependability is the degree to which one can rely on the performance of the system. Faith
is the degree to which one can believe in the system in unknown situations, and
competence is the degree to which the system sufficiently meets necessary requirements.
Responsibility is the degree to which the system is accountable for its performance, and
reliability is the degree to which the system yields the same performance for repeated
trials.
Trust is mainly affected by the reliability of the automation [Parasuraman et al.,
2000], [Lee & Moray, 1992], and the perceived reliability that a user attributes to
automation is often related to how the information from the automation is conveyed to
the user [Parasuraman & Riley 1997]. Most people expect automation to perform
perfectly as opposed to an imperfect human, and thus, there is a higher expectation for

19
what automation should accomplish than what a human should accomplish [Dzindolet et
al., 2002]. If automation is imperfect, it is important that its interface conveys when its
solutions are less reliable or uncertain. Research has also found that automation is trusted
more during unfamiliar situations as opposed to familiar situations [Muir, 1987], thus in
designing an automated path planner, one needs to consider how to help users understand
situations that are unfamiliar to them so that they can build more appropriate trust in the
system rather than just rely on the automation when they don’t know how to handle a
situation.
One area of interest concerning trust in automation is how to prevent a user from
over trusting automation which can lead to inappropriate reliance on automation. Since
unforeseen failures in a system can occur, it is important that a user can detect when a
system is failing to produce the proper output. One suggestion to help this problem is to
make automation state indicators more evident to users, with the purpose of enhancing
monitoring [Parasuraman & Riley, 1997]. Since enhancing monitoring helps prevent
failures, it consequently improves reliability, and as previously mentioned, increasing
reliability will promote more trust in the system.
Another concern with trust in automation is the distrust in automation, which can
lead to disuse and loss of potential benefits offered by automation. Research has shown
that when automation reliability is in doubt, users’ trust in the automation significantly
drops, causing more reliance in manual methods [Ruff et al., 2002].
Given the significant cultural trust issues that will likely be faced in the attempt to
introduce automated path planning technology into the maritime domain, design

20
interventions to promote trust were a significant focus of this thesis, which will be further
discussed in Chapter 4.

21
3. Cognitive Task Analysis
Previous work done by Cummings and Carrigan [2008] discusses the application of a
Hybrid Cognitive Task Analysis (HCTA) to the task of surface collision avoidance. This
process, its results, and interviews conducted with subject matter experts (SME) are
discussed in this chapter. The comprehensive results obtained and lessons learned
through the HCTA and SME interviews are used as the motivation for the design of the
navigation assistance.
3.1 Background of CTA and HCTA
A cognitive task analysis (CTA) is performed in order to yield information about the
knowledge, thought processes, and goal structures underlying task performance
[Schraagen et al., 2000]. Conducting a CTA can come in the form of analyzing an
existing system or interviewing subject matter experts. Both approaches were used to
develop a design for the navigation tool.
While a CTA is commonly accomplished by analyzing existing systems, a
Hybrid CTA (HCTA) can be used when no predecessor systems exist [Nehme et al.,
2006]. A HCTA creates design requirements by creating scenario task overviews,
generating event flow diagrams, generating situational awareness requirements, and
generating decision trees [Nehme et al., 2006]. Since an automated navigational tool is
not currently implemented, the HCTA approach was also used for developing
navigational information requirements.

22
3.2 Hybrid CTA Results
The Hybrid CTA previously performed helped to uncover the information requirements
for surface navigation [Cummings & Carrigan, 2008]. These results were obtained
through a four step process, starting with the task scenario overview. This information
was then used to develop an event flow diagram, which puts the tasks into a temporal
order. The processes in this event flow diagram were then assessed to determine the
situational awareness requirements, and the key decisions from the event flow diagram
were expanded using decision trees to determine the different knowledge states. Finally,
display requirements were determined for the knowledge states, and these were added to
the situational awareness requirements to comprise an overall list of informational
requirements. This list of requirements for surface navigation is shown in Appendix A.
One of the insights gained from the CTA was the number of processes involved in
safe navigation. Before a submarine leaves port, in addition to plotting the main path that
the submarine will travel, the navigator develops a contingency plan for handling events
that may alter their course, such as contacts or weather changes. A contingency plan is a
set of rules that will be used by the navigator when an event occurs that may require the
submarine to move off course. The contingency plan considers depth, shipping lanes, and
destination to develop the best course of action. If a contingency plan does not address a
problem that occurs while the submarine is in motion, the submarine is slowed down
while the navigator must quickly find an open area to move to and then re-evaluate the
situation.
While navigating in real time, if a submarine is on a collision course with another
ship, the navigator must re-plan using the contingency plan. Depending on the situation,

23
multiple iterations of re-planning may be required to get to a suitable solution. Error!
Reference source not found. shows the typical process navigators will follow for handling
a contact that could result in a possible collision. As the figure shows, a navigator may
have to plan an alternate course, calculate variance, and compare the result against
allowable tolerances multiple times before a solution path is found that will handle a
contact. In addition, planning an alternate course will also require the labor involved in
choosing a path with good visibility and adequate depth.
NoYes
NoYes
No
Yes
Yes
No
Yes
Yes
Set desired
path
Check for
contacts
Navigate along
path
Acquire
available AIS
info
Plot most likely
course based
on speed and
heading
Check desired
path vs.
contacts
coursesAlter course
Determine
allowed course
variance
No
No
Are there
any contacts
in area?
Is course
within allowed
tolerances?
Is
collision
possible?
Are there
any crafts with
no AIS data?
Apply rules of
the road and
determine
privileged
vessel
Is
ownship
burdened
vessel?
Was
potential
collision
averted?
Figure 3: Events flow diagram for avoiding collisions in unrestricted water
(Cummings & Carrigan, 2008)

24
The information gained in the requirements analysis through the HCTA provided
the starting point for understanding submarine surface operations. Of the overall list of
requirements, those specific to navigation can be found in Table 1. These requirements
were used to design a display that would give the user the necessary situational awareness
and tools to plan a path. The design of the display will be further discussed in Chapter 4.
These requirements provided a baseline, which was augmented through interviews with
SMEs, discussed in the next section.
Table 1: Navigation Informational Requirements
Type Requirement Description
Geo
-sp
ati
al
info
Geo-spatial boundaries
Visual navigation lanes
Hazardous/restricted areas
Planned course, highlighted red if blocked, green if clear
Visual indication of allowable paths when helpful
Mark final destination or goal location on map
Areas where collision is possible or uncertain
Co
nta
ct I
nfo
Geo-spatial location of all surrounding contacts
Contacts course and speed
Contact path: past, present and future
Contact location on path
Marking to distinguish contacts with Automatic Identification System (AIS) data
List of contacts, with name, bearing, speed, and whether course is opening/closing
When craft is on a collision course with a contact
When path is inaccessible, also list why
Da
ta/M
isc Current speed and heading
Ability to compare different routes

25
3.2 Subject Matter Expert Interviews
With the basic requirements defined, interviews with SMEs were scheduled to
supplement the HCTA. The first involved doing a cognitive walkthrough with a Navy
Lieutenant (a junior officer) while plotting and re-planning a path. A cognitive
walkthrough consists of a user verbalizing the sequence of steps or actions required to
accomplish a task while performing it. Next, two Navy Captains (senior officers) and two
more Lieutenants (junior officers) were interviewed to assess how they conducted the
navigation task and their attitudes towards a mobile path planning tool. Finally, 4
members of the civilian maritime community were interviewed at the Northeast Maritime
Institute to obtain a broader understanding of surface navigation operations.
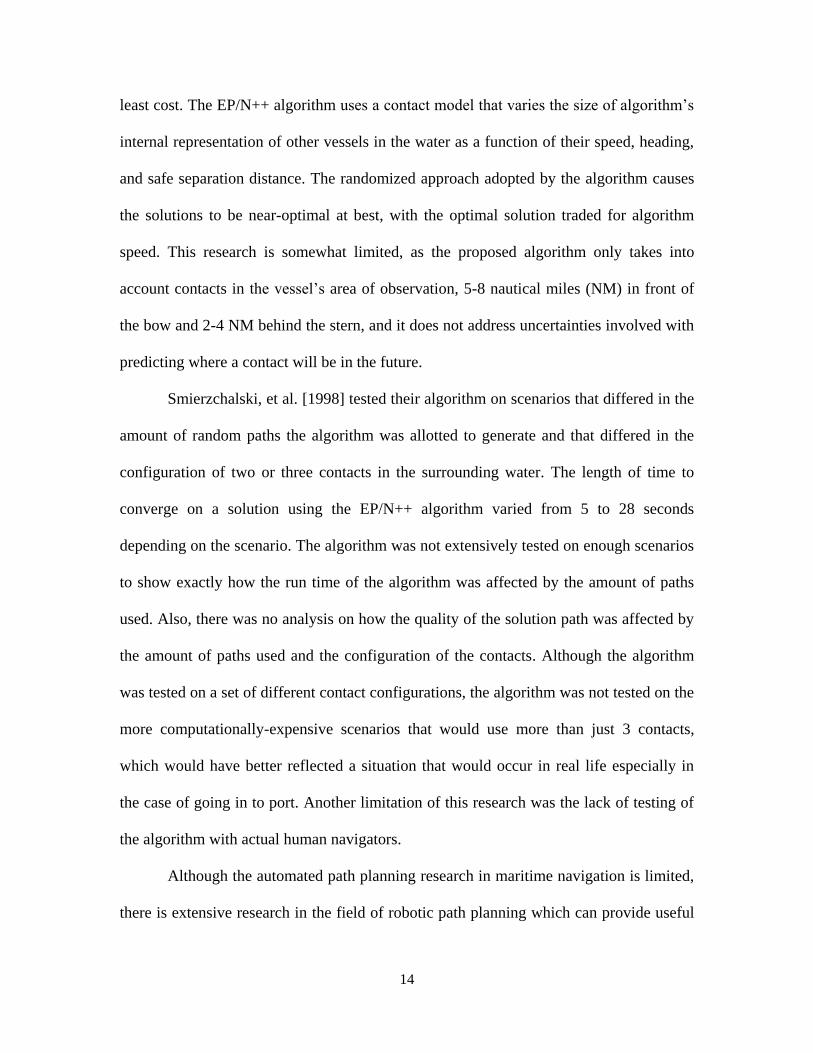
During the cognitive walkthrough, the steps involved in plotting on paper charts
were observed in real time. From this process, it was easy to see that even a skilled crew
member took between 3-5 min to complete a path. Each leg had to be measured and
compared to the scale on the chart, as well as being compared to the compass rose to
determine heading. During the re-planning, all of these same steps (Table 2) were
repeated, and even in a time critical situation, a small change in the plans took about a
minute to create. The tools involved, such as the bulky chart and the rolling ruler, took
up a significant amount of space as well. Finally, due to the many steps involved in
maneuvering a submarine, the number of legs on the path was minimized to prevent
constant course changes if possible. These drawbacks were noted as areas that could be
improved through the use of a mobile path planning aid.
26
Table 2: Steps to re-plan a path
1 Determine acceptable navigational routes
2 Choose a route
3 Draw straight route on the map
4 Measure route with compass to determine heading
5 Measure route with scale to determine path length
The next step was the interviews. Through interviews with the Navy personnel, it
was determined that there was a potentially dangerous time delay in the information flow
process. When a contact was acquired, its information was passed along to both the
plotter and fire control to be tracked. A contact could be acquired through sonar, radar,
visual, or Automatic Identification System (AIS) information. AIS data is electronic
information concerning a vessel’s identification and location. When AIS information is
available, the contact course and heading has to be manually added to the plot. In
general, both Navy Captains were willing to accept a mobile electronic tool to aid in the
navigation process, but the 2 junior officers interviewed mentioned that they would be
unlikely to trust any type of automation that assisted with path planning. If used, the
junior officers stated that they would want to have some way to view uncertainty in the
system, so that they could make accurate decisions.
During the interviews with the civilian operators, it was found that the technology
available on most commercial ships is further along than many of the Navy systems.
Electronic Chart Displays (ECDIS) are seen in the majority of commercial vessels, and it
is typical to do path planning using these electronic systems, albeit still using manual
planning methods with no automated planning. With more electronics on board already,

27
it was not surprising to hear that the civilian interviewees were more willing to trust
automation in planning a path.
Through the interview process, additional insight was gained into what important
criteria needs to be met for a mobile navigation assistant. If the tool is going to be used,
it needs to help decrease the amount of time taken to plan and re-plan paths. It must also
be seen as trustworthy by the user, and be accurate based on the information provided.
Finally, in order to increase the trustworthiness, the tool should be able to display
uncertainty in information, specifically with regards to the contact picture. If accurate
information is not available, then the information displayed must convey this picture.
3.3 Lessons Learned
Based on the results obtained from HCTA and SME interviews , it was decided that the
automatic path planner needed to not only provide an efficient path that avoided
obstacles, but it also needed to provide a path that didn’t require a lot of heading changes.
Also, since it was cognitively demanding and time consuming for a navigator to plan a
course around a contact, it was decided that the automated path planner should generate a
path which avoids collisions with other contacts in the water by predicting the future
positions of these contacts. In addition, although specific questions pertaining to trust
were not surveyed across the SME’s, there seemed to be a general reluctance on the part
of military SME’s to trust a navigation decision support tool’s automation enough to
incorporate it in current navigational methods. Moreover, because of the foreseen trust
issues with using automation for navigation, the information pertaining to how a
contact’s future position is predicted by the algorithm should be modeled in a way such
that the visualization for that model can convey its uncertainties to the user. For example,

28
enabling the operator to adjust the algorithm’s uncertainty/risk threshold in choosing a
path can help navigators better understand the operation of the path-planning algorithm,
and thus induce appropriate trust. By designing to these requirements, a trustworthy tool
that is useful for surface navigation can be developed.

29
4. Design and Implementation
The navigation display developed in this thesis provides the user capabilities to manually
plan a path or to use an automated path planner to generate a path. It provides a rich
interface for manipulating a manual path, and it includes a visualization that helps
support a user in making navigation decisions. Additionally, it provides an automated
path planner that attempts to present trustworthy solutions to the user.
Since the SME interviews showed that sometimes experienced navigators find it
useful to use personal knowledge that a computer may not have access to, it was decided
that a manual path planner would help give users the freedom to make a path that a
computer may not necessarily generate, given that the user has additional information
that may not be in the computer database. However, even in this manual model,
automation can still be leveraged as a “critic” [Guerlain et al., 1999] so that it can prevent
user mistakes in the manual mode while still giving the user freedom.
An automated path planner was included in this decision support tool to leverage
fast search methods to derive a quick solution for a navigational problem, since current
methods are very time-consuming, even when occurring in a digital environment like
ECDIS. As will be described in more detail, the automated path planning tool
incorporates knowledge of static obstacles to provide a path that is not only efficient, but
also safe. It predicts where other ships in the water will be and takes preventative
cautions to avoid other ships while still maintaining an efficient path. The automation is
also customizable to the user’s preferences of obstacle avoidance, to allow for both
flexibility and increased trust in the tool.

30
4.1 Designing for Trust
As mentioned in Chapter 2, when a system derives a solution and there is some
uncertainty to how exact or correct the solution is, the system should not present its
solution as if there were no uncertainties in its correctness. Presenting an uncertain
solution as if it were certain to a user would only hurt the user’s trust in the system
[Dzindolet et al., 2002]. Thus, when a system recommendation contains uncertainty in the
correctness of its answer, it must display its solution to the user in a way that conveys its
uncertainties.
The most uncertain part in planning a path for a submarine comes from the
contact avoidance. Depending on what type of vessel the contact is, the amount of
variance in the future position of the contact will change. Using radar and periscopes and
other sensors, one can detect where a contact is and where it is heading, and depending
on the vessel, one might be able to predict where the contact will be in the future. With
larger vessels that are known to stay on a seaway, it is relatively easy to predict where the
vessel will be in the future, however, with a small boat such as a sailboat, it is extremely
difficult to predict where the boat’s future position will be. Thus one design hypothesis in
this research is that displaying likely contact positions in the future will improve users’
trust in the path planning decision support tool.
4.2 General Layout and Program Foundations
Given the information and display requirements discussed previously, a prototype display
was developed to aid submarine personnel in both manual and automated path planning
(Figure 4). This navigation re-planning display allows the user to re-plan their path by
using either the automation via the “Autoplan” button or the manual planning tools from

31
the “Manual” button. The “Autoplan” button generates multiple obstacle-free paths
between the submarine’s current position and the goal by taking user input about what
separations, depths and visibilities should be the cutoff for defining un-navigable areas.
The “Manual” tools allow the user to create their own path by adding, deleting, and
dragging waypoints in the map while also taking user input about what depths and
visibilities should be the cutoff for defining where waypoints and points along the path
can exist on the map. Figure 4 shows a screen capture of the Navigation re-planning
display before any path planning/re-planning has taken place.
Figure 4: General View of Navigation Display
The following figures and descriptions show how the navigation display used in this
thesis meets the information requirements presented in Table 1.

32
The sliders on the right hand side of the screen (Figure 5) allow the navigator to
set threshold values for acceptable depth and visibility values. The graphs give the users
information about where a path may be inaccessible and how close their paths comes to
hazardous/restricted areas. The graphs also allow the users to compare different paths in
terms of obstacle avoidance.
Figure 5: Depth and visibility sliders set cutoffs
The upper right-hand side of the display (Figure 6) allows the user to hide or
select a path to be displayed in the map and graphs; this functionality helps meet the
Informational Requirements by helping the user compare different routes. The minimum
separation slider, located directly under the checkboxes, adjusts how close (separation) a
submarine can come to another vessel. As the separation is adjusted, the map will adjust
to show where the contact obstacles or areas of possible collision are and it gives a better
representation of the geo-spatial location of the surrounding contacts.

33
Figure 6: View selection and defining contact separation
The black path in Figure 7 is the current path. Figure 8 describes the items that are
also on the main map: the red circle represents a hazard that needs to be avoided, the aqua
blue circles in the water are other ships that need to be avoided, the arrows coming out of
the blue circles are the last known trajectories of the vessels, the yellow circle is the goal,
and the blue inverted bullet shaped object at the top of the map is the submarine’s current
location. This meets the Informational Requirements by showing the user the planned
course, the blocked regions, the hazardous/restricted areas, the Geo-spatial boundaries,
the final destination, other contacts, contact headings, and the Geo-spatial location of all
surrounding contacts.
Figure 7: Current path in black
34
Figure 8: Items in navigation map
The table shown in Figure 9 presents information concerning how long the path
is, in nautical miles, from start to goal and how long it will take the submarine to traverse
the entire path from start to goal. The columns of the table represent the current path the
submarine is traveling (Current) and the five different paths that the user can create using
the path-planning tool: a manual path (Manual) and four different types of automated
paths (Auto, Low, Med, and High). This further supports the Navigational Information
Requirements by helping the user in comparing different routes.
Figure 9: Path length and length of journey
4.3 Manual Path Planner
As discussed previously, a manual path planner was added to the tool to provide a user
the ability to specific waypoints in the path, while relying on the automation to generate
path and heading markings between waypoints and to check for obstacles in the path. It
gives users the freedom to choose a specific course they would like to follow, while still
providing the efficiency of being able to quickly add points to a path and ensuring that
the path is safe from static obstacles and weather obstacles. Users have the freedom to
use their own contact avoidance scheme in this manual path planner.
35
The manual path planner allows the user to add waypoints to a path by clicking on
the screen. When the user attempts to add a way point, the automation will make sure that
the area the user is clicking is not a depth or visibility obstacle, as determined by the
thresholds set by the depth and visibility sliders. As waypoints are added to the screen,
the manual path planner will generate the lines between the most recently added
waypoint and the new waypoint. It does this by recursively dividing up the space between
the two waypoints with smaller points that are closer to each other. As it divides up the
space, it concurrently checks every new point in the space to see if there is a static
obstacle in the path. If no obstacles are found, the waypoint will be successfully added; if
an obstacle is found, a message will pop up that says “Obstacle in path, choose an
alternate path”. Figure 10 shows an example of such a message.
Figure 10: A waypoint was about to be added in an area with an obstacle.
36
Upon clicking the “Finish” button, the manual planner will attempt to generate the
remaining path from the last waypoint added to the final goal point by generating a line
between the two points. If the line crosses an obstacle, than a message will pop up that
says “Cannot generate remaining path to Goal, obstacle in path. Please modify path”.
After finishing the manual path, the user can use the Add and Delete buttons to
tweak the path, or the user can drag waypoints for further modification of the path. Upon
clicking the “Add” button, the user can add a new waypoint on the existing path by
clicking on the path at the position where the waypoint is needed. Upon selecting the
“Delete” button, the program will iterate through each waypoint and determine whether
or not the waypoint can be deleted without introducing an obstacle in the resulting
straight path that the automation will generate between the two neighboring waypoints. If
a waypoint can be deleted without negatively affecting the path, then it will be
highlighted yellow. Figure 11 shows an example of the program’s determination of which
waypoints can be deleted.
The manual path planner will automatically update a path’s orientation as a user
drags around a waypoint. It will update the path by generating two straight lines, one
between the current waypoint being dragged and the previous waypoint in the path and
the other between the current waypoint and the next waypoint in the path. The critiquing
automation will also checking to make sure that the drag action does not result in
crossing an obstacle for any part of the new path. Having the manual path planner
automatically update the lines the user sees is designed to promote trust in the system
since it shows a user how changing a waypoint will affect the path. If a drag action results
in an obstacle in the path, the drag will not be allowed to finish, and a message will pop
37
up, as before, saying “Obstacle in path, choose an alternate path”. Not only does the user
see this feedback, but the user can also confirm the message’s validity by seeing from the
automatically-updated path how an obstacle is interfering with the path. This type of
feedback helps the user understand how the manual path planner is working, and thus
should promote trust in the system.
Figure 11: Waypoints that can be deleted are highlighted yellow.
In summary, the manual path planner tool provides the user a method for carefully
planning a path that is more efficient than using paper charts, while also giving the user
the freedom to choose their own method for avoiding paths that come close to other ships
in the water or even come close to shallow water. It also gives the user the liberty to
avoid paths that may go through obstacles that are not documented in the electronic
charts.

38
4.4 Automated Path Planner
The automated path planner was implemented in this tool to provide a fast method of
path planning that the user could utilize while at sea. It reduces the user’s cognitive
workload by making safe and efficient choices, particularly in time-constrained settings.
for the user as to where to place waypoints and by providing schemes for avoiding other
contacts in the surrounding area.
After analyzing algorithms that can be used for navigation path planning, the A*
algorithm [Hart et al., 1968] was chosen to be the backbone of this maritime planning/re-
planning advisory tool since a fast solution is critical for the user in this application,
especially in the case of re-planning. The A* algorithm was also preferable because of its
use of a cost function that can be configured to take into account factors such as changing
speeds and restricted areas of water. A* was also preferable for its ability to calculate a
fast and optimal solution given an admissible heuristic [Winston, 1992], where an
admissible heuristic is a heuristic function that generates values that never overestimate
the cost of traveling from any point in the map to the goal [Winston, 1992]. Other
algorithms such as Iterative Deepening A*(IDA*) and Breadth-First Heuristic Search
(BFHS) were not chosen since these algorithms reduce the amount of memory used by
the program at the expense of speed, which is useful for handling large data sets in
situations which are not time critical [Zhou & Hansen, 2004]. However, given that the
size of the grid was relatively small (and will be discussed in a subsequent section), the
amount of memory needed to solve the problem did not warrant using one of these
optimization schemes, at the expense of the algorithm’s speed to calculate a solution. The
implemented A* algorithm in this research effort at required just 40 MB of stack space
39
and did not run out of memory. Although the algorithm is memory-intensive, because this
is a re-planning tool, its primary use would be to calculate paths for only relatively short
distances, which requires less memory on the part of the algorithm and supports the need
for having a speedy algorithm. Thus, the speed of the algorithm was more important since
a fast solution is critical for the user in this situation, especially in the case of re-planning.
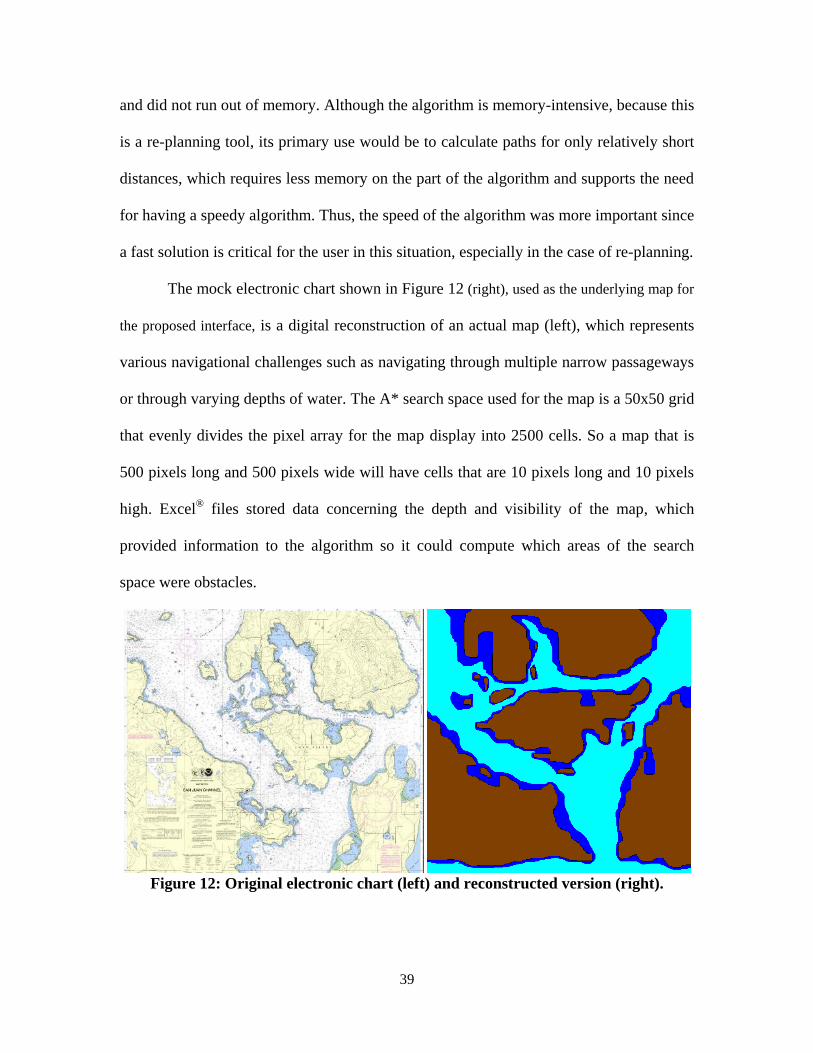
The mock electronic chart shown in Figure 12 (right), used as the underlying map for
the proposed interface, is a digital reconstruction of an actual map (left), which represents
various navigational challenges such as navigating through multiple narrow passageways
or through varying depths of water. The A* search space used for the map is a 50x50 grid
that evenly divides the pixel array for the map display into 2500 cells. So a map that is
500 pixels long and 500 pixels wide will have cells that are 10 pixels long and 10 pixels
high. Excel®
files stored data concerning the depth and visibility of the map, which
provided information to the algorithm so it could compute which areas of the search
space were obstacles.
Figure 12: Original electronic chart (left) and reconstructed version (right).

40
For the case of this tool, the heuristic is simply the straight-line distance from the
ship’s current position to the goal. Also, for each point in the map that the algorithm
considers, it expands to the 8 neighboring cells, and examines each cell for insertion into
the search queue. A cell for a given map on this tool has a height of (pixel height of map)
50 pixels and a width of (pixel width of map) 50 pixels.
Line Smoothing
Since each node expansion only examines the 8 cells adjacent to that node, the resulting
path is jagged. Since a jagged path means that there are multiple heading changes, it is
desirable to have a smoothing algorithm that will not only remove the jagged lines to
decrease the amount of submarine heading changes, but also to improve the path. The
smoothing algorithm used is a modified version of the Jacobi relaxation algorithm, where
a point in a path is updated to be the average of the value of the previous point in the path
and the next point in the path [Goldstine et al., 1959]. To increase the chances of having a
resulting value that is not an obstacle, an average is taken between the current value and
the Jacobi value to create the smoothed value. The new value is also checked against the
obstacle database to ensure that the new point is safe for the submarine to travel. Multiple
iterations of the smoothing algorithm will make the path smoother and closer to the
optimal solution since the algorithm has the ability to make fine adjustments to the
solution path. Figure 13 shows the path after 1, 20, and 500 iterations of the smoothing
algorithm.

41
Figure 13: Path after 1 (top left), 20 (top right), and 500 (bottom) iterations of the
smoothing algorithm
Visibility Uncertainty
Since weather is a highly uncertain but critical variable, a simple model was developed to
account for weather uncertainty, specifically that of visibility. Using visibility data from
an Excel®
database that simulates a current visibility forecast and using uncertainty
values that are assigned to the 2500 cells to simulate weather variance, cells can be
classified as visibility obstacles depending on the user’s specification via the slider. Thus,
areas below specified visibilities are excluded from the submarines search space. The
uncertainty for each visibility value is represented through a lower and upper bound. It is
assumed that the average visibility values and standard deviations would be available via
some external forecasting source. For this decision support tool, a cell was classified as a

42
visibility obstacle if the cell’s visibility lower bound was less than the cutoff visibility
value specified by the user.
Contact Uncertainty
Since an automated path planner is more useful if it can predict where other contacts
could be in the future, a back-end model was created for predicting a contact’s future
position and presenting it to the A* algorithm. The model utilizes a contact’s current
position, speed, and heading, which can be obtained through technology such as AIS,
sonar, and periscopes. The model employs dead reckoning, calculating future positions of
the contacts over time based on each contact’s last known position, heading, and speed.
Since many factors such as vehicle type or current can introduce a significant amount of
variance in that future position, a circular area is placed around a contact’s predicted
position at a given time in the future to represent possible areas within the algorithm’s
search space that the vessel may end up occupying at that time. Because the area needed
to avoid a contact may vary per contact, the navigation decision support tool calculates
three separate paths, each using a differently sized circular area for variance to be used
for all contacts. The user is then given the opportunity to select a path as per a preferred
variance size.
The three different sizes of variance used to produce the three paths represent
varying levels of uncertainty in predicting the contacts’ future positions. The path
calculated using a smaller sized circular area for variance corresponds to the automation
having less uncertainty in predicting each contact’s future position. Whereas a path
calculated with larger circles for variance corresponds to the automation being more
uncertain in predicting contacts’ future positions.

43
Figure 14 shows the front end visualization of the three values for variance used
by the back end. Contact 1 is shown surrounded by the three circles representing the
three values for variance. To convey this variance or contact uncertainty in a way that is
tangible to the user, the interface uses the word “separation” to signify how close a user
would like their path to come to other contacts. So, a low uncertainty scheme would
signify that the user can have a path that has a lower separation between the home ship
and other contacts since the variance in the contacts’ courses are small, while a high
uncertainty scheme would imply that the home ship would need a higher separation from
other contacts in the water since the contacts’ positions may significantly vary.
A shading scheme for the different levels of contact uncertainty shows the
navigator which areas of the search space correspond to high, medium, or low separation
schemes. The shading represents the three levels of separation, high, medium, and low,
with three shades of grey, with dark grey representing the low separation areas and light
grey representing the high separation areas.
One design hypothesis is that this visualization makes the display more
trustworthy, since it shows the user where the ship is in the current time and what the
three separation areas around it are, which reinforces the concept of the automation
calculating separate paths based on the separation settings. This is expected to improve
trust in the automation since it gives the user more understanding of how the back-end of
the display works.
44
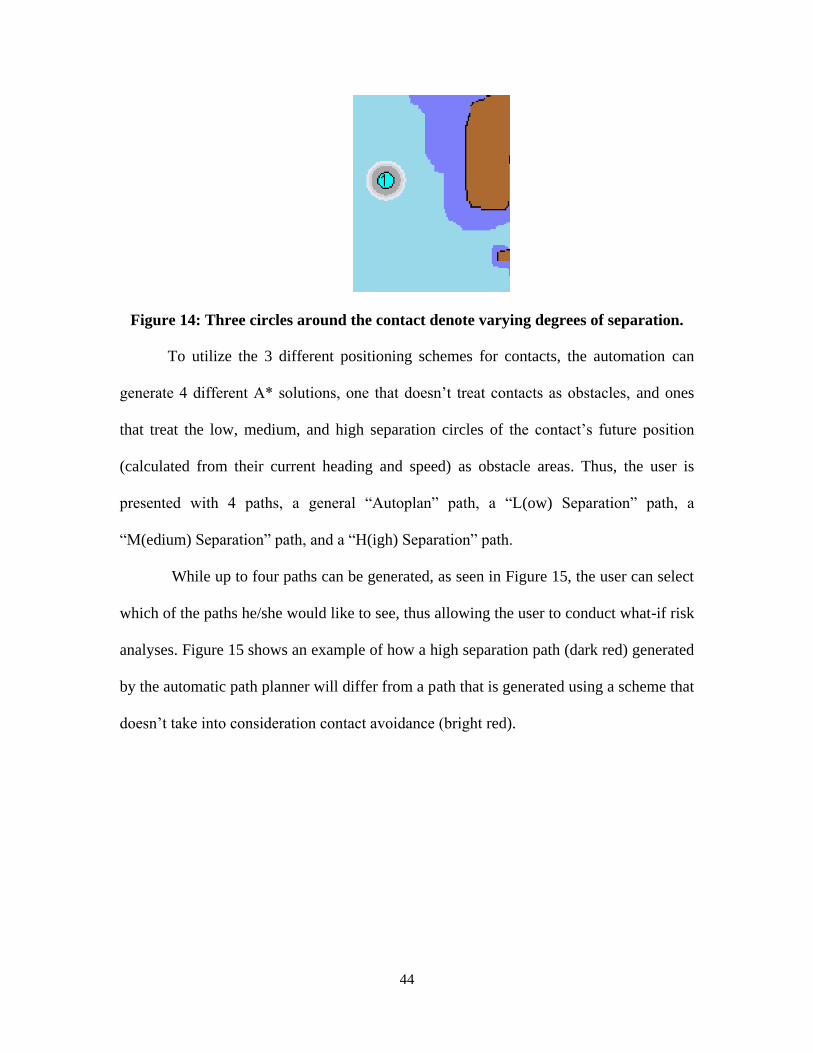
Figure 14: Three circles around the contact denote varying degrees of separation.
To utilize the 3 different positioning schemes for contacts, the automation can
generate 4 different A* solutions, one that doesn’t treat contacts as obstacles, and ones
that treat the low, medium, and high separation circles of the contact’s future position
(calculated from their current heading and speed) as obstacle areas. Thus, the user is
presented with 4 paths, a general “Autoplan” path, a “L(ow) Separation” path, a
“M(edium) Separation” path, and a “H(igh) Separation” path.
While up to four paths can be generated, as seen in Figure 15, the user can select
which of the paths he/she would like to see, thus allowing the user to conduct what-if risk
analyses. Figure 15 shows an example of how a high separation path (dark red) generated
by the automatic path planner will differ from a path that is generated using a scheme that
doesn’t take into consideration contact avoidance (bright red).

45
Figure 15: Automated path planner: High Separation vs. no Separation
While the manual path planner gives the user freedom to choose any method to
handle contacts, the automated path planner attempts to still give the user some freedom
in choosing how to handle contacts by providing the user with multiple paths to choose
from by generating different contact avoidance schemes. Additionally, the automated
path planner takes precautionary steps in creating paths by utilizing user-set cutoff values
to determine which areas should not be included in the search space for the algorithm. It
also uses the cutoff separation value with its capabilities of predicting a contact’s future
position to prevent a user from running into a contact.
The two methods of path planning presented in this chapter are predicted to
improve the quality and speed of path planning for maritime applications. The manual
path-planner gives the user an easy to use interface for quickly planning a safe path to a
goal. It automates the tedious work of drawing straight lines on the map and it automates

46
the work of measuring heading while still giving the user the freedom to plan a path
wherever they wish it to go. The automated path-planner utilizes the speed of the A*
algorithm, combined with the contact prediction model to quickly plan a path that
effectively avoids obstacles. The next chapter will measure how effective these path
planning methods are as compared to the traditional pencil and paper method.
47
5. User Testing
This chapter describes the human-in-the-loop experiment conducted to assess how
effective the navigation decision support tool is in re-planning a course as compared to
the traditional paper and pencil method. In addition to traditional performance metrics,
trust was also measured.
5.1 Experimental Protocol
The main research question to be addressed was: How does using the navigation decision
support tool affect surface navigation performance in comparison to paper charts, and
how trustworthy is the automated tool? In addition, whether a sizable difference in the
amount of trust exists between civilian and military personnel was investigated.
The participants in this experiment used both the paper and pencil method as well
as the navigation display to re-plan a path. The length of each path created and the time it
took to plot a path were measured to determine which navigational tool provides the best
results. The participants were also asked a series of trust questions to help determine
whether or not the tool is trustworthy, and whether it could be relied upon for navigation.
Participants
Eight military personnel, both Coast Guard and Navy, and eight civilians from the MIT
sailing pavilion and the Massachusetts Maritime Institute with experience in navigating
in open waters were tested. The average age of the military personal was 31 years old,
with a standard deviation of 7 years, and a range of 23-47 years. The average age of the
civilians was 41 years old, with a standard deviation of 10 years, and a range of 27-59
years. Only male participants were used in the experiment since the submarine

48
community is only composed of men. The navigation decision support tool was tested
among both civilian and military personnel.
Compensation was provided to non-military personnel at a rate of $10 for doing
the experiment. Military personal were given a small gift that was priced less than $10 for
compensation since military personal are not allowed to accept cash. A pre-experiment
questionnaire was given to determine eligibility. A sample of the questionnaire is shown
in Appendix B.
Experimental Test-bed
Navigational Display
The computer system that ran the navigation decision support tool was a Sony Vaio
UX390N Micro PC. The UX has a touch screen and a stylus pointing device. It has a
4.5in screen and a resolution of 1024 x 600.
One feature added to the navigation display described in detail in Chapter 4 so
that final path selection was unambiguous was the “Select Current” button. The “Select
Current” button displays a selection box, shown in Figure 16, which allows the users to
make their final decision. It only allows the user to select a path that currently exists in
the navigation display. Clicking the “ok” in the selection box is the signal that the test
scenario ended. It will cause the path that was selected to turn black to signify that it is
the new current path, and the tables and graphs will also show the new current path in
black.

49
Figure 16: Selection box sets the submarine on a new path. Paper Charts
The paper charts used for the hand plotting were 12in x 12in sheets of paper with a
blown-up image of the map being navigated. The depth values for the map were depicted
on the map similar to how charts have depth markings (Figure 17). The paper charts were
covered with clear tracing paper, as is normally done in the field to prevent marking the
charts. The corresponding weather charts for the map were also given to the participant
on a 12in x 12in sheet of paper to simulate a weather station (Figure 18). A ruler, parallel
ruler, compass, slide ruler, and pencil were provided to plot the path, similar to those
shown in Figure 19.

50
Figure 17: Paper chart with depth values
Figure 18: Weather/Visibility Chart

51
Figure 19: Paper chart plotting tools
Experimental Design
The independent variable for this within-subjects experiment was the navigation aid: the
navigation decision support tool or the paper charts. A blocking factor: military or
civilian, was also used. The dependent variables included path length, obstacle
avoidance, and time to generate a new path, summarized in Table 3.
Table 3: Performance Dependent Variables
Metric Interpretation
Path Length Length from start to goal, translated into
nautical miles
Obstacle Avoidance
Avoiding collisions with the given
contacts, shallow water, and low
visibility regions (this is a binary value)
Time to Generate Path
Time from when the obstacle was
presented to when the submarine is
given a new path
A trust analysis tool, shown in Appendix C, was used to measure participant’s
trust in the automation. It was adapted from the trust test from the European Organization

52
for the Safety of Air Navigation [EUROCONTROL, 2003], but the questions were
modified so as to gain more insight to this specific automation. Additional questions were
added to gain more information about what aspects of the automation influenced
participant ratings.
A mixed factorial design with participant experience (military or civilian) as a
between-subject variable and a within-subjects decision support factor were used;
participants were randomly assigned to one of four combinations of scenario and
navigational tool groupings listed below. The two scenarios that were used are described
in more detail in the next section.
1) Scenario 1 with navigation decision support tool, Scenario 2 with Paper
2) Scenario 1 with Paper, Scenario 2 with navigation decision support tool
3) Scenario 2 with navigation decision support tool, Scenario 1 with Paper
4) Scenario 2 with Paper, Scenario 1 with navigation decision support tool
Procedure
Participants were observed by a member of the research team at all times and the
experiment was held in the location where the participant worked. A PowerPoint tutorial,
shown in Appendix D was provided to familiarize the participants with the navigation
decision support tool interface.
After the tutorial was completed, participants were given the chance to complete a
15-minute test session to practice using the navigation decision support tool and the paper
charts. Participants were encouraged to ask the research team observer questions during
the tutorial and practice session as well as during the actual experiment if necessary.

53
After the tutorial and practice sessions were completed, each participant was
given a map with a current path already planned between the submarine’s current
position and its goal. An obstacle, such as an oil spill or restricted water notice, was
presented that required the participant to create a new path to the goal.
Each participant completed two test scenarios, one with the navigation decision
support tool and one with a paper chart. The order of presentation was counterbalanced
across subjects as discussed previously. Each participant was asked to re-plan a path for
two separate scenarios using a different tool for each scenario.
Scenario 1 required that the submarine traveled from the top middle of the screen
to the middle to the bottom of the screen (Figure 20). Scenario 2 required that the
submarine traveled from the top left hand corner of the screen to the top right hand corner
of the screen (Figure 21). An experimental session consisted of the participant re-
planning paths for two separate scenarios, which together, took approximately 15 min.
Figure 20: Scenario 1, submarine travels from top of the map to the bottom

54
Figure 21: Scenario 2, submarine travels from left-side of graph to the right
The main tasks for each participant during the experiment were to generate one or more
paths, examine and/or compare paths, and select one path to follow. With the navigation
decision support tool, generating paths could be accomplished using the manual path
planning tool or the autoplan path planning tool, examining the paths could be done by
using the tables and graphs in the interface, and selecting a path was done with the
“selection button”. With the paper charts, generating one or more paths could be done
using traditional paper charting methods, examining paths could be done using the depth
chart, weather chart and contact information sheet, and selecting a path could be done by
just erasing everything but the desired path. After the test scenarios, each participant was
asked to complete the Trust Analysis Tool (Appendix C).
5.3 Results
After analyzing the data and comparing the solutions using a 2x2 ANOVA (α=.05) (all
descriptive statistics are found in Appendix E, it was found that there was a statistical
difference between the navigation decision support tool and the paper chart with respect

55
to how long it takes to plan the path (F(1,14)=92.47, p<.0001). There was no significant
difference between the civilian and military solutions with respect to time, and there was
no interaction effect (p>.05). Figure 22 shows the relevant plots for time.
With respect to path length, there was again a statistical difference between using
the navigation decision support tool to plot a path and using paper to plot a path
(F(1,14)= 13.21,p=.003). In this case, there was also a significant difference between the
Military and Civilian solutions with respect to path distance (F(1,14)=18.26, p=.001) and
there was no interaction effect. The military participants tended to plan longer paths.
Their solutions were not necessarily worse, they were just more conservative. Figure 23
shows the relevant plots for path length.
All of the paths plotted were examined by an expert user to determine if the paths
went through any obstacles, and all paths were satisfactory.
Figure 22: Time participants took to plan paths

56
Figure 23: Path length differential of plotted paths to best path
5.4 Trust Analysis Tool Feedback
This section reviews the feedback that was received through the Trust Analysis
Questioner. The first part of this section assesses the numerical ratings that the
participants assigned to certain aspects of the navigation decision support tool and the
second half reviews the responses participants gave in the follow up questions that
allowed the participants to explain their previous ratings.
When asked to indicate overall trust in the systems on a scale of 1 to 5, where 1
denotes no trust and a 5 denotes complete trust, participants in general found the
automation somewhat trustworthy, but not completely trustworthy (Figure 24). Military
personnel seemed to have more overall trust in the system than the civilians, which was
not expected given the feedback from HCTA and SME interviews.

57
Figure 24: Question 1, Overall trust in system
For question 2, where participants were asked to rate how reliable they believed
the automation is in terms of obstacle avoidance, participants found the automation to be
very reliable (Figure 25).
Figure 25: Question 2, Reliability of the automation
When asked how accurate the automation was in terms of plotting an efficient
path, the results were also positive, as the participants overall rated the automation as
being accurate (Figure 26).
0
2
4
6
1 2 3 4 5 MoreFr
eq
ue
ncy
Bin
Overall Trust
Civilian
Military
0
2
4
6
1 2 3 4 5 More
Fre
qu
en
cy
Bin
Reliability of Automation
Civilian
Military

58
Figure 26: Question 3, Accuracy in creating efficient path
Question 4, which asked how well the participant understood the behavior and
displayed intent of the automation, also had positive results. The majority of participants
found the automated path planner to be understandable (Figure 27). The military
participants perceived a higher level of understanding than the civilians.
Figure 27: Question 4, Understanding behavior and displayed intent of automation.
Participants also showed that they believed in the automation in unknown
situations, although their response wasn’t as optimistic as in the previous questions
(Figure 28 ).
0
2
4
6
1 2 3 4 5 MoreFr
eq
ue
ncy
Bin
Accuracy
Civilian
Military
0
2
4
6
8
1 2 3 4 5 More
Fre
qu
en
cy
Bin
Understandable
Civilian
Military

59
Figure 28: Question 5, Faith in automation for unknown situations
When asked about how easy it was to use the automation, again the majority of
participants showed that they found the automation very easy to use (Figure 29).
Figure 29: Question 6, Ease in using the automation
Question 7, which asked the participants how robust they found the path planner,
showed that most of the participants found the automation very robust. The one
participant that gave the automation a low robustness rating actually discovered a small
flaw in the system while running the test. The participant tried to “Select” a path while he
was still in the process of creating a manual path, which resulted in a logic error within
the system, causing him to not be able to select the path that he wanted at the time. Figure
30 shows the results for question 7.
0
2
4
6
1 2 3 4 5 MoreFr
eq
ue
ncy
Bin
Faith in Automation
Civilian
Military
0
2
4
6
1 2 3 4 5 More
Fre
qu
en
cy
Bin
Usability of Automation
Civilian
Military

60
Figure 30: Question 7, Robustness of automation.
When asked how much the participants liked the automated path planner, the
responses were overwhelmingly positive, as many rated the automated path planner as
very likable (Figure 31).
Figure 31: Question 8, Measurement of Preference in the automation
In general, there were no trends towards a difference in trust between civilian and
military participants. The higher ratings that the military participants gave to the
automation for the “overall trust” question and the “understandable” question may
possibly be related to age, since the military participants were considerably younger than
the civilian participants.
When analyzing which planning tool in the navigation decision support tool the
participants used the most, 11 of the participants used the autoplan path planner more, 4
0
2
4
6
1 2 3 4 5 MoreFr
eq
ue
ncy
Bin
Robustness of Automation
Civilian
Military
0
2
4
6
1 2 3 4 5 More
Fre
qu
en
cy
Bin
Preference in the Automation
Civilian
Military

61
used the manual path planner more, and 1 participant used both equally. Most of the
participants considered using both methods, although 2 participants only considered
using the manual tool since they felt they weren’t familiar enough with the automation,
and 1 participant used only the autoplan path planner since speed was more of a concern
for him.
When participants did use the autoplan button, whether in the training session or
in the real session, approximately two thirds of them double checked the autoplan path to
make sure that it didn’t look like it was going through an obstacle, while about a third of
the participants didn’t check at all and mentioned that they trusted the system enough to
generate a valid path. In general, participants mentioned that they trusted the system, but
they still would have liked to see more information on the map, such as depth values or a
measurement that shows how narrow a channel is. Some would have also liked to see a
measurement stating how close their ship came to shoal water.
Two participants mentioned that using the automation in an area that they are
already familiar with would help them trust the system more since they would be able to
compare the automation’s solution to their own experiences. In addition, just seeing the
automation in more environments and being able to use it in the field was also mentioned
as something that could help them trust it more. Some participants mentioned also that
they didn’t want to rely too much on the system and lose their own navigational skills.
When asked what the participants liked about the navigation decision support
tool, a quality of the tool that stood out was its intuitive and user-friendly design. Others
liked how fast it was in generating routes and how it could generate routes that were
based on the future position of other contacts. Participants also appreciated the different

62
levels of separation that the navigation decision support tool allows the user to select.
Other positive aspects that were mentioned were the tool’s ability to consolidate data
effectively, its immediate feedback in the manual mode when adding waypoints, the
projection of the contacts, and the functionality for user input. One participant mentioned
that it was “surprisingly easy” to use, and another said he had “never seen anything like
it”, and one more mentioned that it was “cool”.
Concerning the question that asked participants what they would change about the
navigation decision support tool, participants mentioned how they would prefer a larger
and more detailed map and the ability to zoom in to see more detail. One participant
wanted the ability to read distances between individual waypoints, other participants
wanted to see more specific information about the contacts in the surrounding area, and
one participant wanted more variance in the colors of the different autoplan paths.
In summary, the user testing showed that the navigation decision support tool was
effective in improving the overall performance of participants in re-planning a course.
Additionally the tool successfully engendered trust from both civilian as well as military
participants. Contrary to the initial prediction that the military personnel would trust the
tool less than civilians, the results showed very similar acceptance of the tool by both
groups.

63
6. Conclusion
In summary, this thesis developed an automated decision support tool for surface
navigation path planning that is not only functional and efficient, but also reliable to the
extent that users would like to see this technology implemented onboard their vessels.
The design of the navigation decision support was based on a hybrid cognitive task
analysis, which showed that current navigational techniques are very cumbersome from
both a technology and cognition perspective, especially in path re-planning and contact
avoidance procedures. It showed the need for a new method of path re-planning that
would expedite the process of calculating a path while also ensuring that a safe and
contact free path was chosen. It also revealed what the most relevant functionalities
would be needed for designing a new path re-planning tool.
Based on the insights gained through the HCTA and SME interviews, a path re-
planning tool was designed with a manual and an automatic path planner. The manual
path planner provided functionalities that allowed a user “point and click” ,to easily
create and modify a path while also ensuring that the path was free of obstacles such as
shallow water or bad weather. An A* automatic path planner further reduced cognitive
workload by providing a fully automated method for generating a path that not only
avoided static obstacles, but also dynamic obstacles. The automatic path planner was
designed to promote user trust by presenting its uncertainties to the user, such as the
uncertainty associated with predicting other vessels’ positions.
The user testing showed that the new navigational decision support tool improved
the efficiency of the re-planning process. It also showed that the design steps taken as a
result of the HCTA and SME interviews helped make the tool so user-friendly and

64
effective that users could easily make the transition to using it as a path-planning aid. It
also showed that the tool promoted trust in both civilian and military environments.
6.2 Future Work
While the navigation decision support tool was generally very effective, it has a
few shortcomings in the current design, which could be addressed in future work. One
improvement that can significantly benefit the current design is to specifically account for
vessel type in order to determine more accurate separation estimates. Giving the user the
freedom to modify the separation for an individual vessel can also provide additional
benefits. This would allow the automation to differentiate between vessels such as
sailboats, which need more separation because of unpredictable behavior, or a barge,
which is significantly constrained in maneuverability. One also might consider using
learning classifiers to create predictions of what type of separation the submarine would
have to take with a certain type of vessel. This would require a method for the user to
confirm the classification or to correct it.
Another addition to the tool that may help improve trust is a visualization that
represents future contact positions at pertinent locations in the navigation display. This
would help users see how their paths avoid or don’t avoid contacts in the future. It would
also show users visually how the paths they plan using the automated path planner avoid
potential hazardous areas.
In terms of additional functionality, the user should also be able to visualize and
adjust what the minimum separation is between the submarine and shoal water, this
would require a modification to the search algorithm so that it would make sure the
submarine never moves to a cell that is too close to shoal water. This would help improve

65
the user’s degree of freedom in manipulating the automation to create a more desirable
path.
While the manual path gives users the functionality to plan a path that avoids
obstacles that may not be documented in a paper chart or an electronic chart, that
functionality does not exist for the automated path-planner. Further work should give
users a method for inputting undocumented obstacles onto the map so that the automation
will know to avoid those areas when it is calculating a path.
One important limitation in this thesis is the assumption that submarine always
moved at a constant rate when generating the autoplan path. Thus, variable ownship
speed as well as currents, tide, and rate and radius of turn would be possible additions to
the algorithm, which would make the navigation decision support tool more accurately
model the real world. Not only would this make the algorithm even more accurate, but
hopefully more trustworthy.
One operational implementation issue is how to interface such a navigation
decision support tool to an electronic chart display system such as ECDIS©
, which has an
available software development kit, EC2007 ECDIS Kernel, that can be found online
(www.sevencs.com). This would greatly improve the system as it would add more detail
and accuracy to the map. It would also allow for effective zooming capability. It would
provide finer resolution of data for the automation to use while generating a path, which
in turn would increase the accuracy and correctness of the autoplan and manual path
planning tools. This would also help users examine their course and check for correctness
with more ease, which would help generate trust in the automation as indicated by
participant responses to the trust analysis tool. Such an implementation would likely need
66
to happen on a display larger than a handheld, so one other area that deserves additional
consideration is the scalability of the navigation decision support tool, i.e., how could
such a tool be used is different display environments.
Along these same lines, it might be useful to interface with or to follow a similar
display model of the “Safe Path Advisor” and the “Avoidance Zone Advisor” tools since
they provided a contact model that could take clusters of many contacts and represent
their information to a user in a simple display [Rothgeb, M., 2008]. Again, display size
would be a consideration.

67
Appendix A
Informational Requirements for Surface Navigation
Type Requirement Description
Geo
-sp
ati
al
info
Geo-spatial boundaries
Visual navigation lanes
Hazardous/restricted areas
Highlight any areas that have not been searched for contacts
Tide, current, weather, marked on display
Future weather information
Future tide/current information
Planned course, highlighted red if blocked, green if clear
Variance of actual path versus planned path
Visual indication of allowable paths when helpful
Mark final destination or goal location on map
Ability to determine range from ownship to other points of interest
Position of escort/tug boats
Areas where collision is possible or uncertain
Indicate allowed variance of ownship path
Mark location of pilot pick-up and drop-off
Most likely paths for commercial vessels (shipping lanes, port roadways)
Co
nta
ct I
nfo
Geo-spatial location of all surrounding contacts
Contacts course and speed
Specific sensor data available for review
Highlight sensor data that most likely represents a contact
Popup asking whether to analyze current data for contacts or continue monitoring
Indication of privileged vessel, flag status
Contact path: past, present and future
Contact location on path
Marking to distinguish contacts with AIS data
List of contacts, with name, bearing, speed, and whether course is opening/closing
Alert when contact enters area
Deviations of contact path versus what AIS data says
Ale
rts
an
d
Fee
db
ack
When craft is free from dock
When path would overstress vessel (maneuvering limitation)
When craft is on a collision course with a contact
When planned course violates limits or set restrictions
When systems are not in final position and heading for port
When path is inaccessible, also list why

68
When time constraints are not being met
When Tug assistance is available/helpful
Rules of the road: ability to display when unsure
Highlight tug boat if it cannot arrive in time
Status of Pilot
Data
/Mis
cell
an
eou
s
Current speed and heading
Current time
Mission timeline
Predicted ability of meeting timeline
Availability of tug boats
Current structural stress on craft
ETA of escort/tug boats
Recommended course changes
Information on local tug boats (contact info, number of boats, position, ETA)
List of tug boats allowing user to add/remove
Ability to compare different routes

69
Appendix B
MSAT Demographic Survey
1. Age: ____________________
2. Gender: Male Female
3. Please indicate the type of Maritime experience you have?
□ Commercial
□ Military
Number of years? ________
4. Please indicate what vehicle types and number of years:
□ Surface
□ Submarine
Specific vessel type_______________
Number of years? ________________
5. Do you have previous charting experience?
□ Yes
□ No
If yes, please indicate what platform and number of hours:
Platform: □ Paper Charts
□ ECDIS©
□ VMS
□ other (please specify):
Number of hours? ________

70
When was the last time you used these skills?____________
6. Are you color blind?
□ Yes
□ No
If yes:
Which type of color blindness (if known)
_____________________________________________

71
Appendix C
Trust Analysis Tool
Trust Analysis
1. For this system, please indicate your overall amount of trust.
1 2 3 4 5
No Trust Somewhat trustworthy Complete Trust
2. Please indicate the strength of your feeling for the MSAT for each of the factors by circling
the corresponding number.
3. How reliable (in terms of avoiding obstacles) is the automation tool?
1 2 3 4 5
Not reliable Reliable
4. How accurate (in terms of plotting the most efficient path) is the functioning of the automated
path planner?
1 2 3 4 5
Not accurate Accurate
5. Do you understand the behavior and displayed intent of the automated path planner?
1 2 3 4 5
Not Understand Understand
6. How much do you believe the automated path planner in unknown situations, such as choosing
a path without seeing weather information?

72
1 2 3 4 5
No faith Faith
7. How easy is the automated path planner to use?
1 2 3 4 5
Not familiar Familiar
8. How robust (in terms of recovery from path errors) is the automated path planner?
1 2 3 4 5
Not robust Robust
9. How much do you like the automated path planner?
1 2 3 4 5
Dislike Like
When using this tool, did you focus on the automatic path planner or the manual mode?
Did you ever think about using both?
Did the graphs on the right showing path comparisons prove useful for planning?
Did you ever check the plot of an auto planned path to check for obstacles, or did you
trust that the path would be acceptable?
If you did not trust the system, why not?
What did you like about the MSAT?
What do you dislike about the MSAT?
What would you change about the MSAT?
Did you enjoy the method of interaction with the tool?

73
Appendix D
Tutorial Slides

74

75

76

77

78

79

80

81

82

83
Appendix E
Descriptive Statistics for Dependent Variables: Time and Distance
Time: with paper (sec)
Experience Average Standard Deviation
Civilian 224.63 94.52
Military 241.00 73.84
Time: with navigation decision support tool (sec)
Experience Average Standard Deviation
Civilian 81.50 51.93
Military 109.48 42.61
Additional Distances: with paper (nm)
Experience Average Standard Deviation
Civilian 6.84 2.68
Military 8.98 2.27
Additional Distances: with navigation decision support tool (nm)
Experience Average Standard Deviation
Civilian 1.92 1.78
Military 5.11 3.76
84
References
1. Atoyan, H., Duquet, J. R., & Robert, J. M. (2006). Trust in new decision aid
systems. Paper presented at the 18th International Conference of the Association
Francophone d'Interaction Homme-Machine, Montreal, Canada.
2. Barraquand, J., Langlois, B., & Latombe, J. C. (1992). Numerical Potential Field
Techniques for Robot Path Planning. IEEE Transactions on Systems, Man, and
Cybernetics, Vol. 22(2), pp. 224 - 241
3. Chen, H., Cardone, V. & Lacey, P. (1998). Use of Operation Support Information
Technology to Increase Ship Safety and Efficiency. SNAME Transactions, Vol.
106, pp. 106-127.
4. Cummings, M.L. & Carrigan, G. (2008). Hybrid Cognitive Task Analysis for
Submarine Collision Avoidance. Report HAL2008-01, Humans & Automation
Lab, Massachusetts Institute of Technology, Cambridge, MA.
5. Cummings, M. L. & Guerlain, S. (2006). Developing Operator Capacity
Estimates for Supervisory Control of Autonomous Vehicles. Human Factors, Vol.
49, pp. 1‐15.
6. Dzindolet, M.T., Pierce, L.G., Beck, H.P. & Dawe, L.A. (2002). The perceived
utility of human and automated aids in a visual detection task. Human Factors,
Vol. 44, pp. 79–94.

85
7. Kelly, C., Boardman, M., Goillau, P., & Jeannot, E. (2003). Guidelines for Trust
in Future ATM Systems: Measures (HRS/HSP-005-GUI-02). Brussels: EATMP,
EUROCONTROL Headquarters.
8. Goldstine, H. H., Murray, F. J. & von Neumann, J. (1959). The Jacobi method for
real symmetric matrices. J. Assoc. Comp. Mach., pp. 59--96. (Also in von
Neumann, J. (1973)). Collected Works. Pergamon Press, Vol. 5, pp. 573-610)
9. Guerlain, S., Smith, P., Obradovich, J., Rudmann, S., Strohm, P., Smith, J.,
Svirbely, J., & Sachs, L. (1999). Interactive Critiquing as a Form of Decision
Support: An Empirical Evaluation. Human Factors, Vol. 41.
10. Hart, P., Nilsson, N., & Raphael, B. (1968) A formal basis for the heuristic
determination of minimum cost paths. IEEE Transactions of Systems Science and
Cybernetics, Vol. 4(2), pp. 100-107.
11. Hutchins, E. (1995). Cognition in the Wild. MIT Press, Cambridge, MA.
12. LaValle, S. M. (2006). Planning algorithms. Cambridge Academic Press,
Cambridge; New York.
13. Lee, J. & Moray, N. (1992). Trust and the allocation of function in the control of
automatic systems. Ergonomics, Vol. 35, pp. 1243-1270.
14. Marquez, J.J., (2007) Human-Automation Collaboration: Decision Support for
Lunar and Planetary Exploration, MIT Aeronautics and Astronautics, Cambridge,
MA

86
15. Muir, B. M. & Moray, N. (1996). Trust in automation. Part II. Experimental
studies of trust and human intervention in a process control simulation.
Ergonomics, Vol. 39(3), pp. 429-460.
16. Muir, B. M. (1987). Trust between humans and machines, and the design of
decision aids, International Journal of Man-Machine Studies, Vol. 27, pp. 527-
539.
17. Nehme, C.E., Scott, S.D., Cummings, M.L., Furusho, C.Y. (2006). Generating
Requirements for Futuristic Heterogeneous Unmanned Systems. Proceedings of
HFES 2006: 50th Annual Meeting of the Human Factors and Ergonomic Society,
San Francisco, CA, USA, October 16-20.
18. Nikolova, E., Brand, M., & Karger, D. (2006). Optimal Route Planning under
Uncertainty. In Proceedings International Conference on Automated Planning and
Scheduling, Lake District, England.
19. Parasuraman, R., Sheridan, T.B. & Wickens, C. D. (2000). A model for types and
levels of human interaction with automation. IEEE Transactions on Systems,
Man, and Cybernetics – Part A: Systems and Humans, Vol. 30(3), pp. 286-297.
20. Parasuraman, R. & Riley, V. (1997). Humans and automation: Use, misuse,
disuse, abuse. Human Factors, Vol. 39(2), pp. 230-253.
21. Preference Standards for Automatic Radar Plotting Aids (ARPA). (1979).
International Maritime Organization. Resolution A. Vol. 422(11).
87
22. Rimon, E., & Koditschek, D. (1992). Exact Robot Navigation Using Artificial
Potential Functions. IEEE Transactions on Robotics and Automation, Vol. 8(5),
pp. 501 - 518.
23. Rothgeb, M., (2008). Course and Contact Advisory Agent to Manage Contacts.
Paper presented at the Undersea Human Systems Integration (HSI) Symposium
2008, Bremerton, Washington.
24. Ruff, H. A., Narayanan, S., & Draper, M. H. (2002). Human Interaction with
Levels of Automation and Decision - Aid Fidelity in the Supervisory Control of
Multiple Simulated Unmanned Air Vehicles. Presence, Vol. 11(4), pp. 335-351.
25. Russell, S. J. & Norvig, P. (1995). Artificial Intelligence: A Modern Approach.
Prentice-Hall, Upper Saddle River, NJ.
26. Schraagen, J. M., Chipman, S., & Shalin, V. E. (2000). Cognitive Task Analysis.
Mahwah, NJ: Erlbaum.
27. Setliff, J., Burnham, G., Smith, M., & Hoffman, R. (1984). U.S. Patent No.
4,428,057. Washington, D.C.: U.S. Patent and Trademark Office.
28. Smierzchalski, R., & Michalewicz, Z. (1998). Adaptive Modeling of a Ship
Trajectory in Collision Situations at Sea. 2nd IEEE World Congress on
Computational Intelligence, Alaska, USA.
29. Thrun, S., Burgard, W., & Fox, D. (2005). Probabilistic Robotics. The MIT press,
Cambridge, MA.

88
30. Urbanski, J., Morgas, W., & Czaplewski, K. (2008). The Ship’s Navigation
System for the XXI Century. Transport Problems: an International Scientific
Journal, Vol. 3, pp. 45-49.
31. Winston, P. H. (1992). Artificial Intelligence (3rd
Edition), Addison-Wesley.
32. Xiao, J., Michalewicz, Z., Zhang, L., & Trojanowski, K. (1997). Adaptive
Evolutionary Planner/Navigator for Mobile Robots. IEEE Transactions on
Evolutionary Computation, Vol.1, pp. 18-28.
33. Zhou, R. & Hansen, E. (2004). Breadth-first heuristic search. In Proceedings of
the 14th International Conference on Automated Planning and Scheduling,
Whistler, British Columbia, pp. 92-100.