
Broward County Near-Road Monitoring – Pilot Study Monitoring – Pilot Study Presenter ... 862500...
26
Broward County Florida Near-Road Monitoring – Pilot Study Presenter - Monica K. Pognon Ambient Air Monitoring Section - Pollution Prevention Remediation and Air Quality Division National Air Quality Conference – Ambient Monitoring 2012 May 15, 2012 – Denver, Colorado
Transcript of Broward County Near-Road Monitoring – Pilot Study Monitoring – Pilot Study Presenter ... 862500...

Broward County Florida
Near-Road Monitoring – Pilot Study
Presenter - Monica K. Pognon
Ambient Air Monitoring Section - Pollution Prevention Remediation and
Air Quality Division
National Air Quality Conference – Ambient Monitoring 2012
May 15, 2012 – Denver, Colorado

Broward County, Florida
• Population : 1.75 million
residents; over 10 million visitors
• Five major interstates
• I-95 – running north and
south east side of the county.
• I-595 – running east and west
• 1-75 – west side of the
county
• Florida Turnpike – running
north and south parallel to I-
95.
• Sawgrass expressway – east
of the everglades
• Miami/Fort Lauderdale/Palm
Beaches CBSA

Near Roadway Monitoring
New Monitoring Requirement
Strategy
◦ Contact the Local FDOT Office in Fort
Lauderdale
Discuss project, rule, concerns, process
◦ Contact Broward County Construction
Management
Bring all the players to the table
County Attorney, Purchasing, Real Properties, Risk
Management
Near Roadway Monitoring
Pre-planning started in January 2011
◦ Estimate cost of equipment
◦ Cost of construction
◦ Develop a “realistic” timeline
Secure funding from EPA
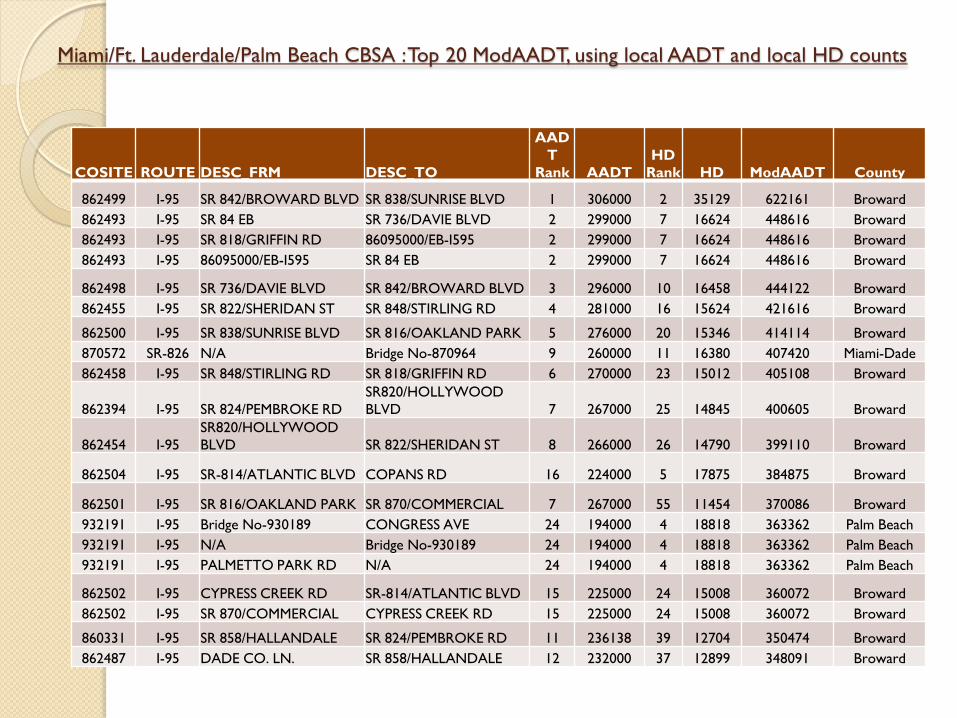
Miami/Ft. Lauderdale/Palm Beach CBSA : Top 20 ModAADT, using local AADT and local HD counts
COSITE ROUTE DESC_FRM DESC_TO
AAD
T
Rank AADT HD
Rank HD ModAADT County
862499 I-95 SR 842/BROWARD BLVD SR 838/SUNRISE BLVD 1 306000 2 35129 622161 Broward
862493 I-95 SR 84 EB SR 736/DAVIE BLVD 2 299000 7 16624 448616 Broward
862493 I-95 SR 818/GRIFFIN RD 86095000/EB-I595 2 299000 7 16624 448616 Broward
862493 I-95 86095000/EB-I595 SR 84 EB 2 299000 7 16624 448616 Broward
862498 I-95 SR 736/DAVIE BLVD SR 842/BROWARD BLVD 3 296000 10 16458 444122 Broward
862455 I-95 SR 822/SHERIDAN ST SR 848/STIRLING RD 4 281000 16 15624 421616 Broward
862500 I-95 SR 838/SUNRISE BLVD SR 816/OAKLAND PARK 5 276000 20 15346 414114 Broward
870572 SR-826 N/A Bridge No-870964 9 260000 11 16380 407420 Miami-Dade
862458 I-95 SR 848/STIRLING RD SR 818/GRIFFIN RD 6 270000 23 15012 405108 Broward
862394 I-95 SR 824/PEMBROKE RD SR820/HOLLYWOOD
BLVD 7 267000 25 14845 400605 Broward
862454 I-95 SR820/HOLLYWOOD
BLVD SR 822/SHERIDAN ST 8 266000 26 14790 399110 Broward
862504 I-95 SR-814/ATLANTIC BLVD COPANS RD 16 224000 5 17875 384875 Broward
862501 I-95 SR 816/OAKLAND PARK SR 870/COMMERCIAL 7 267000 55 11454 370086 Broward
932191 I-95 Bridge No-930189 CONGRESS AVE 24 194000 4 18818 363362 Palm Beach
932191 I-95 N/A Bridge No-930189 24 194000 4 18818 363362 Palm Beach
932191 I-95 PALMETTO PARK RD N/A 24 194000 4 18818 363362 Palm Beach
862502 I-95 CYPRESS CREEK RD SR-814/ATLANTIC BLVD 15 225000 24 15008 360072 Broward
862502 I-95 SR 870/COMMERCIAL CYPRESS CREEK RD 15 225000 24 15008 360072 Broward
860331 I-95 SR 858/HALLANDALE SR 824/PEMBROKE RD 11 236138 39 12704 350474 Broward
862487 I-95 DADE CO. LN. SR 858/HALLANDALE 12 232000 37 12899 348091 Broward
Phase I - Passive Monitoring Selected 6 locations
PSD #1 – I-95 SB north of Atlantic Blvd (High HD Traffic
Counts)
PSD#2 – I-95 SB south of Sunrise Blvd (High ModAADT,
proposed permanent site and transect site).
PSD #3 – I-95 NB south of Sunrise Blvd
PSD #4 – I-95 SB north of Stirling Road
PSD #5 – I-95 SB north of Pembroke Road
PSD #6 – Site 25 Dania Beach (NO2, Ozone, Atox)

Phase I - Passive Monitoring Timeline
◦ Applied for General
Use Permit with
FDOT
Submit March 15th
Received permits May
5th
◦ Constructed and
installed samplers
Installation complete
May 13th
◦ Passive monitoring
May 16th – June 20th

Phase I – Passive Monitoring
5 week study
6 locations (including 1 transect site and 1 collocated) ◦ 2m in height level to
roadway (PSD)
◦ Distance from the roadway 15.24m Transect 15.24m, 19.8m
and 24.38m
NO2 and NOX samples collected ◦ Total 100 samples Collocated
Trip & Field blanks

Phase 1 – Passive Monitoring
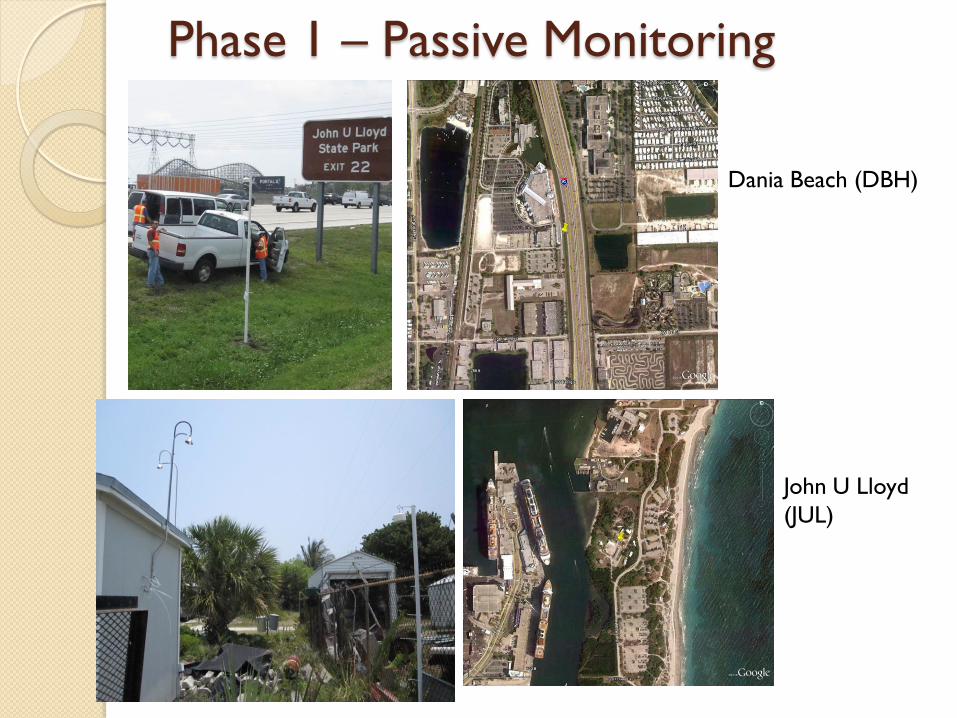
Phase 1 – Passive Monitoring
Dania Beach (DBH)
John U Lloyd
(JUL)

Phase I – Passive Monitoring
Fort
Lauderdale
West – (FLW)
Fort
Lauderdale
East – (FLE)

Phase I – Passive Monitoring
Hollywood
(HOL)
Pompano Beach
(PMB)

Phase I – Passive Monitoring Results
Final Report is posted on EPA website.
◦ http://www.epa.gov/ttn/amtic/nearroad.html

Miami Week 1 Week 2 Week 3 Week 4 Week 5
Wind
Rosea
Average Temperaturea (°C) 27 27 28 28 29
Average RHa (%) 63 65 64 69 69
Site Site Image NO2 (ppb)
DBH 17.1 21.8 14.2 20.9 19.3
FLE 15.4 5.1 3.1 7.2 18.9
FLWb 18.4 24.4 14.6 20.3 19.8
FLWb 17.4 22.1 14.4 18.4 19.2
FLWb 17.2 21.6 14.6 18.7 18.1
HOL 16.0 22.1 15.0 19.4 18.5
PMB 14.8 18.3 11.7 16.4 18.8
JUL 8.6 1.9 2.2 4.6 9.9

Passive Monitoring Data
Site Distance (m) Height (m) Min (ppb) Max (ppb) Average
(ppb) STDEV (ppb)
JUL 1.9 9.9 5.4 3.6
DBH 15 2 14.2 21.8 18.7 3.1
FLE 15 2 3.1 18.9 9.9 6.9
HOL 15 2 15.0 22.1 18.2 2.8
PMB 15 2 11.7 18.8 16.0 2.9
FLW 15 2 14.6 24.4 19.5 3.5
FLW 20 2 14.4 22.1 18.3 2.8
FLW 24 2 14.6 21.6 18.0 2.6
Summary statistics of weekly average NO2 concentrations (ppb) at each
site.

Passive Monitoring Data
Site Distance (m) Height (m) Min (ppb) Max (ppb) Average (ppb) STDEV
(ppb)
JUL 3.6 12.2 7.5 4.0
DBH 15 2 19.5 27.0 23.9 2.8
FLE 15 2 5.3 24.3 13.8 9.0
HOL 15 2 17.7 26.7 22.1 3.3
PMB 15 2 15.6 26.3 21.8 4.2
FLW 15 2 18.3 31.8 25.7 5.1
FLW 20 2 18.4 32.3 24.2 5.1
FLW 24 2 19.7 29.4 23.1 3.7
Summary statistics of weekly average NOx concentrations (ppb) at each site.
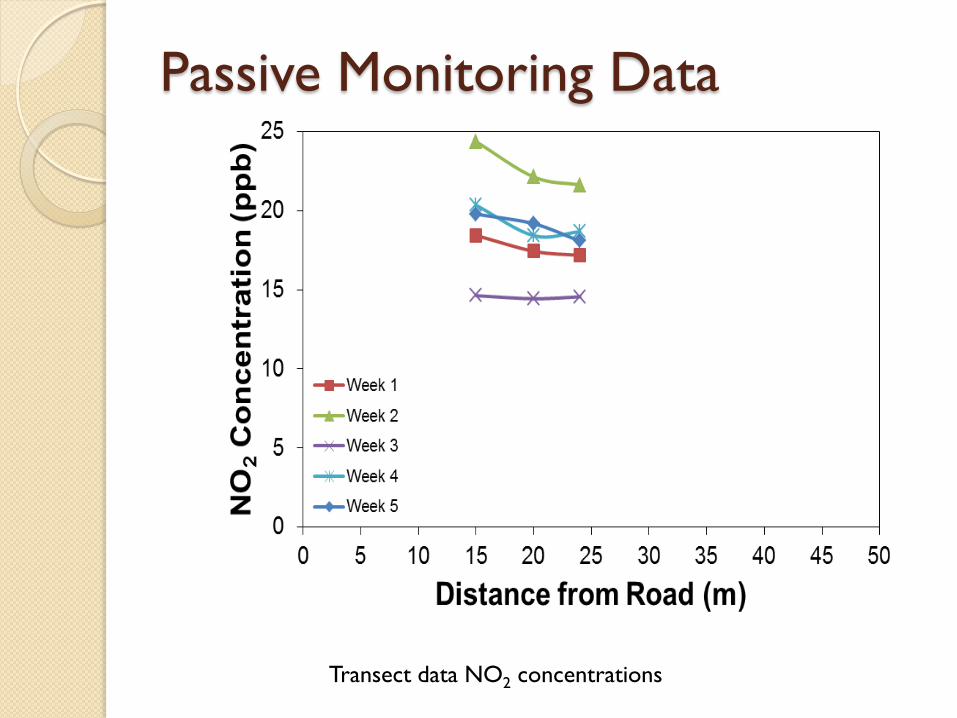
Passive Monitoring Data
Transect data NO2 concentrations

Phase 1 – Passive Monitoring
Best Site Location
◦ Sunrise Blvd and I-95
Meteorology - Important Factor in South
Florida
Ideal probe location within 15-20 meters
from roadway

Phase II – Implementing Near-
Roadway NO2 Monitoring Station Boise and Broward
Multi-pollutant Near Road Monitoring
Station
◦ NO2
◦ COTL
◦ Black Carbon
◦ Ultra Fine Particles
◦ Met suite (wind, RH, Temp)
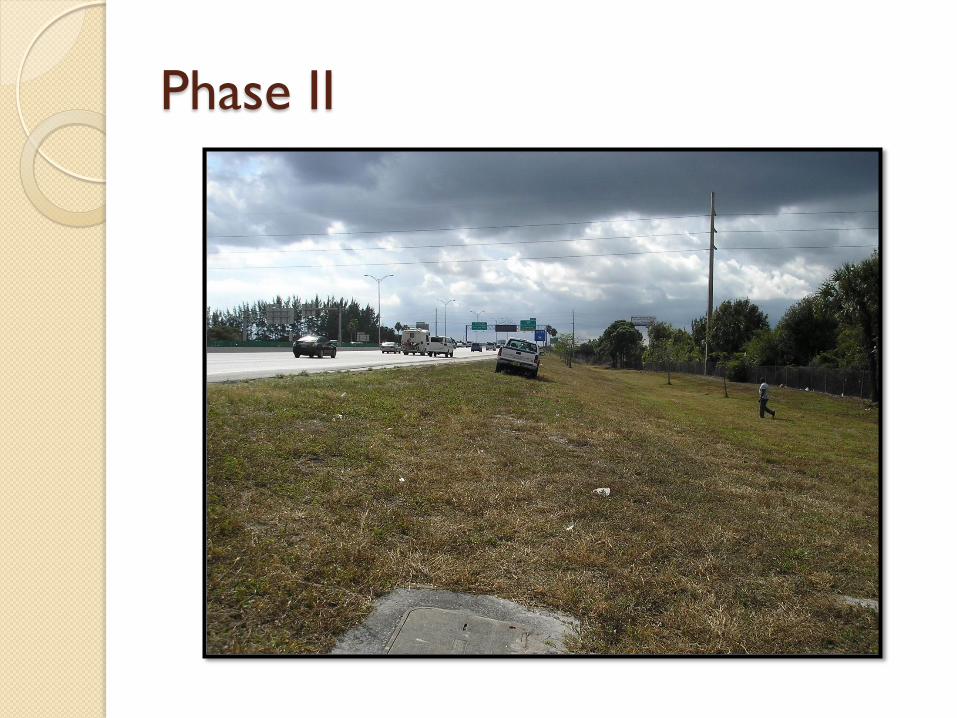
Phase II

Phase II- Near-roadway Monitoring Site
• Highest Traffic Counts
• Ranked #1 AADT Traffic Counts
• Ranked #2 HD Traffic Counts
• Space
• FDOT requires clearance from
their clear zone (36 feet).
• About 100 feet available.
• Less than 50m siting possible
• Meteorology
• Site is West of I-95 (winds are
predominate out of the east).
• Terrain
• Flooding possibilities
• Safety
• Accessible by Sunrise Blvd
• No barriers

Challenges…..
FDOT
◦ Construction Agreement requires a survey
and design drawings.
3 month review and approval process
Purchasing
◦ RLI for architect to complete survey, drawings
and construction agreement
Working on RLI since September 2011
Currently under review from the County Attorney’s Office
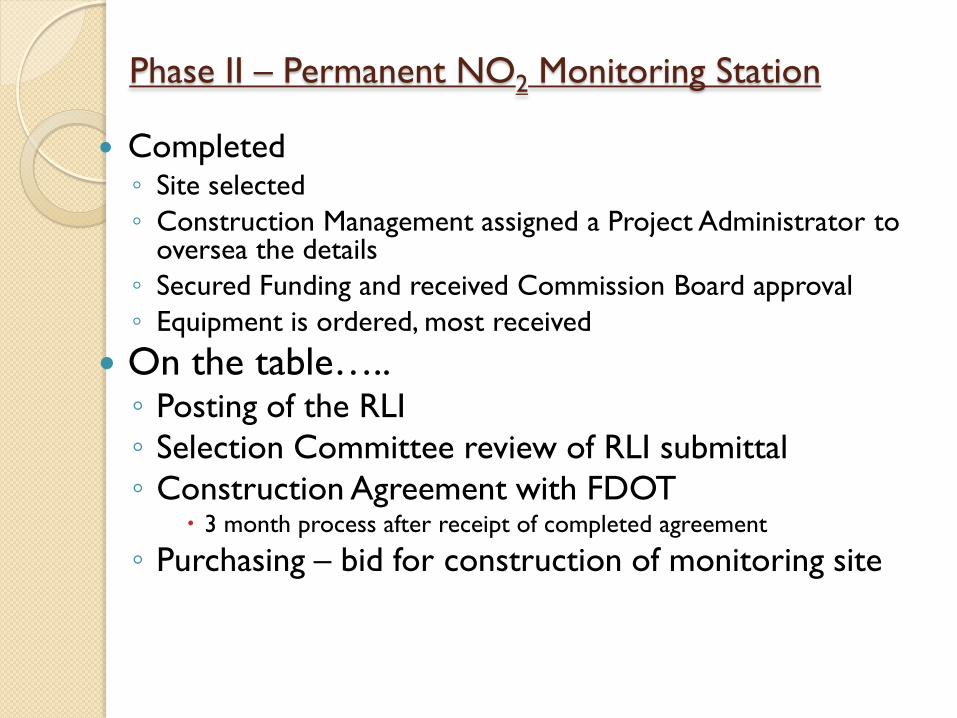
Phase II – Permanent NO2 Monitoring Station
Completed ◦ Site selected
◦ Construction Management assigned a Project Administrator to oversea the details
◦ Secured Funding and received Commission Board approval
◦ Equipment is ordered, most received
On the table….. ◦ Posting of the RLI
◦ Selection Committee review of RLI submittal
◦ Construction Agreement with FDOT 3 month process after receipt of completed agreement
◦ Purchasing – bid for construction of monitoring site

Phase II - Permanent NO2 Monitoring Stations
◦ On the table
Evaluating connectivity with electric and
telecommunications
◦ Continuing Issues
PURCHASING…..PURCHASING……PURCHASING
◦ Anticipating Issues
Permits
Risk Management
Time

Take Home Message….
Plan Early….Plan Early….Plan Early..
Be Flexible
Be Patient

Questions...Comments…Suggestions
Contact Information
◦ Monica Pognon - [email protected]
◦ 954-519-1476


![NAVSAHYADRI EDUCATION SOCIETY S GROUP OF … Intership.pdf · 2019-02-22 · 1 NAVSAHYADRI EDUCATION SOCIETY’S GROUP OF INSTITUTIONS, PUNE Sr. No 69, 70 & 71, Naigaon [Nasarapur],](https://static.fdocuments.us/doc/165x107/5e595c57c5562670660de985/navsahyadri-education-society-s-group-of-intershippdf-2019-02-22-1-navsahyadri.jpg)