Brooklyn Real Estate Report - Q2 2016
28
The Corcoran Report 2Q16 BROOKLYN
-
Upload
charles-zivancev -
Category
Real Estate
-
view
27 -
download
0
Transcript of Brooklyn Real Estate Report - Q2 2016

The Corcoran Report
2Q16 BROOKLYN

Contents
The following members of the The Corcoran Group made significant contributions to this report:
Michele Beaulieu I Adam Eckstein I Kristy Hoffman I Kathleen Mejia I Ryan Schleis I Brie Train I Andrew Wachtfogel
3/7 Market Wide2 Sales3 Inventory4 Prices5 Market Share
12/13 Williamsburg & Greenpoint14/15 Brooklyn Heights, Cobble Hill, Dumbo & Downtown16/17 Park Slope & Gowanus18/19 Fort Greene, Clinton Hill & Prospect Heights20/21 Carroll Gardens, Boerum Hill & Red Hook22/23 Bedford-Stuyvesant, Crown Heights, Lefferts Gardens & Bushwick24/25 Kensington, Windsor Terrace, Ditmas Park, Flatbush & Prospect Park South26/27 South Brooklyn
Neighborhoods12/27
Resale Co-ops8Resale Condos9New Developments 10
Methodology28
Luxury & Townhouse11
Second Quarter 2016
3 Overview
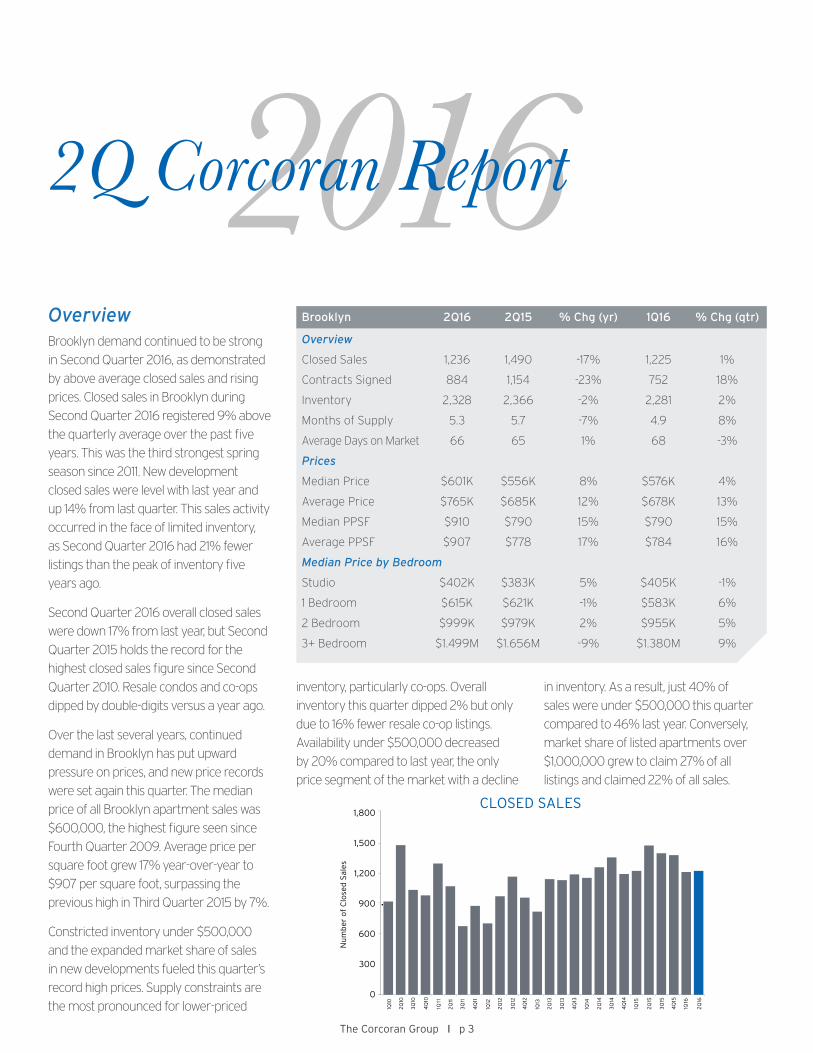
2016 Overview
Brooklyn demand continued to be strong
in Second Quarter 2016, as demonstrated
by above average closed sales and rising
prices. Closed sales in Brooklyn during
Second Quarter 2016 registered 9% above
the quarterly average over the past five
years. This was the third strongest spring
season since 2011. New development
closed sales were level with last year and
up 14% from last quarter. This sales activity
occurred in the face of limited inventory,
as Second Quarter 2016 had 21% fewer
listings than the peak of inventory five
years ago.
Second Quarter 2016 overall closed sales
were down 17% from last year, but Second
Quarter 2015 holds the record for the
highest closed sales figure since Second
Quarter 2010. Resale condos and co-ops
dipped by double-digits versus a year ago.
Over the last several years, continued
demand in Brooklyn has put upward
pressure on prices, and new price records
were set again this quarter. The median
price of all Brooklyn apartment sales was
$600,000, the highest figure seen since
Fourth Quarter 2009. Average price per
square foot grew 17% year-over-year to
$907 per square foot, surpassing the
previous high in Third Quarter 2015 by 7%.
Constricted inventory under $500,000
and the expanded market share of sales
in new developments fueled this quarter’s
record high prices. Supply constraints are
the most pronounced for lower-priced
Brooklyn 2Q16 2Q15 % Chg (yr) 1Q16 % Chg (qtr)
Overview
Closed Sales 1,236 1,490 -17% 1,225 1%
Contracts Signed 884 1,154 -23% 752 18%
Inventory 2,328 2,366 -2% 2,281 2%
Months of Supply 5.3 5.7 -7% 4.9 8%
Average Days on Market 66 65 1% 68 -3%
Prices
Median Price $601K $556K 8% $576K 4%
Average Price $765K $685K 12% $678K 13%
Median PPSF $910 $790 15% $790 15%
Average PPSF $907 $778 17% $784 16%
Median Price by Bedroom
Studio $402K $383K 5% $405K -1%
1 Bedroom $615K $621K -1% $583K 6%
2 Bedroom $999K $979K 2% $955K 5%
3+ Bedroom $1.499M $1.656M -9% $1.380M 9%
inventory, particularly co-ops. Overall
inventory this quarter dipped 2% but only
due to 16% fewer resale co-op listings.
Availability under $500,000 decreased
by 20% compared to last year, the only
price segment of the market with a decline
2Q Corcoran Report
CLOSED SALES
0
300
600
900
1,200
1,500
1,800
Nu
mb
er o
f C
lose
d S
ales
1Q10
2Q
10
3Q
10
4Q
10
1Q11
2Q
11
3Q
11
4Q
11
1Q12
2Q
12
3Q
12
4Q
12
1Q13
2Q
13
3Q
13
4Q
13
1Q14
2Q
14
3Q
14
4Q
14
1Q15
2Q
15
3Q
15
4Q
15
1Q16
2Q
16
The Corcoran Group I p 3
in inventory. As a result, just 40% of
sales were under $500,000 this quarter
compared to 46% last year. Conversely,
market share of listed apartments over
$1,000,000 grew to claim 27% of all
listings and claimed 22% of all sales.

2Q 2016BROOKLYN CORCORAN REPORT
Market WideSalesBuyer demand remains strong in Brooklyn
despite the 17% drop in closed sales
compared to a year ago. However, the
year-over-year decline was exaggerated by
an exceptionally high sales total in Second
Quarter 2015. There were 1,236 closings this
quarter, 9% above the quarterly average
over the past five years. Overall closings
during Second Quarter 2016 were level with
First Quarter, which is atypical since second
quarter sales historically have been higher
than first quarter by double-digits.
Co-op inventory has declined year-over-
year for four consecutive quarters, likely
suppressing sales activity in Second Quarter
compared to both last quarter and last year.
Additionally, resale condo sales were down
14% year-over-year. New development
sales grew 14% from First Quarter 2016 and
maintained last year’s robust pace. New
development sales captured 19% of the
market, slightly more than last year.
Relative to last year, signed contract activity
was down by 23%, a change skewed lower
by a strong Second Quarter 2015. The
pace of contracts signed improved from
First Quarter 2016. There were 18% more
contracts signed this quarter versus last,
a stronger bump in activity than what
occurred from first to second quarter
during 2015.
Days on Market The length of time between list date
and sale date in Brooklyn continued
to remain low. Days on market has
hovered around 65 days for the past
two years. This quarter, listed resale
apartments had buyer commitments
in an average of 66 days. This market
exposure time was nearly level with
both last quarter and last year, but
resale co-op days on market grew
while resale condo days on market
declined. While still a low 60 days,
resale apartments priced between
$1,000,000 and $2,000,000 sat
longer on the market compared to a
year ago. Apartments priced between
$750,000 and $1,000,000 had both
the shortest marketing time of 50
days and largest decrease in days on
market from last year. Two bedroom
residences in Brooklyn found buyers
faster than other types.
The Corcoran Group I p 4
Brooklyn 2Q16 2Q15 % Chg (yr) 1Q16 % Chg (qtr)
Overview
Total Sales 1,236 1,490 -17% 1,225 1%
Resale Co-ops 513 694 -26% 582 -12%
Resale Condo 475 550 -14% 425 12%
New Development 248 246 1% 218 14%
Contracts Signed 884 1,154 -23% 752 18%
Days on Market
Average Days on Market 63 64 -2% 65 -3%
Days on Market by Type
Resale Co-ops 72 64 12% 67 7%
Resale Condo 61 67 -9% 69 -12%
Days on Market by Bedroom
Studio 69 64 7% 68 2%
1 Bedroom 71 65 8% 71 0%
2 Bedroom 59 60 -2% 64 -8%
3+ Bedroom 70 92 -24% 74 -4%
Days on Market by Price
$0 to $350K 115 91 27% 86 34%
$350K to $500K 66 57 16% 70 -6%
$500K to $750K 57 59 -3% 60 -6%
$750K to $1M 50 66 -24% 67 -25%
$1M to 2M 60 57 6% 67 -11%
2M+ 86 88 -2% 61 43%
3+ BRs
2 BR
Studio
1 BR
-30% -25% -20% -15% -10% -5% 0% 5% 10%-20% -10% 10% 20%0%
$0–$350K
$350K–$500K
$500K–$750K
$750K–$1M
$1M–$2M
$2M
30%-30%
DAYS ON MARKET CHANGE (YR) BY PRICE
DAYS ON MARKET CHANGE (YR) BY BED
2Q 2016BROOKLYN CORCORAN REPORT
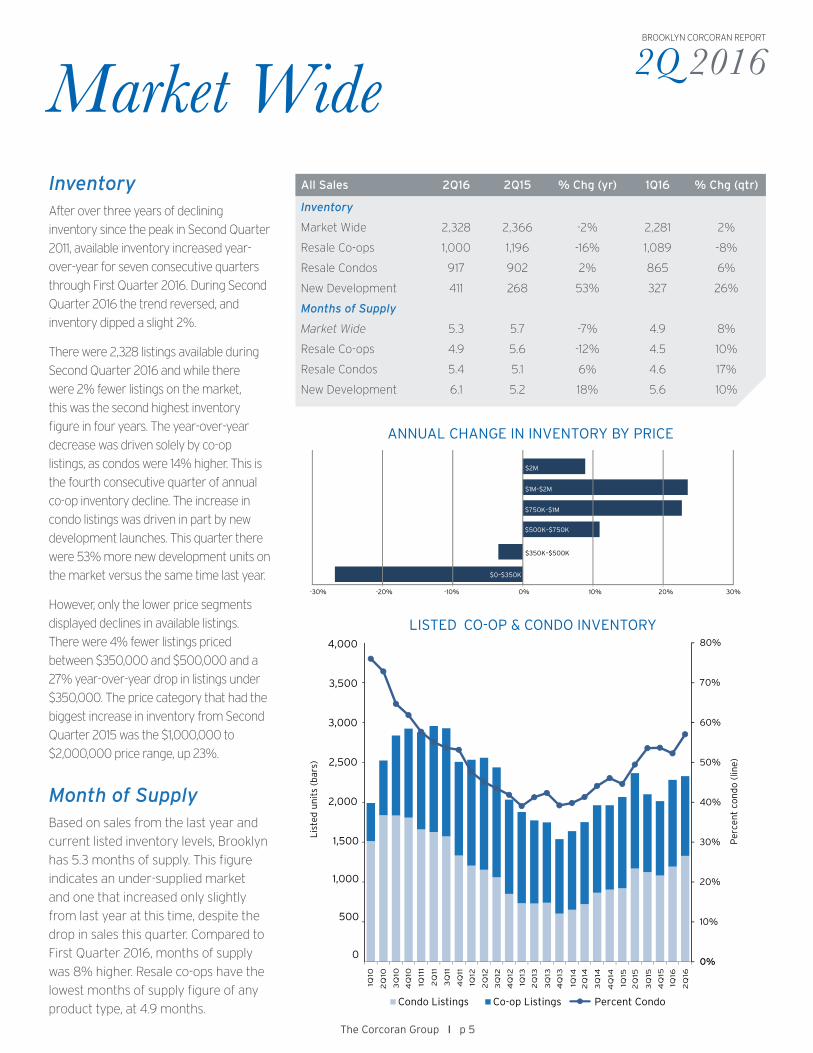
Market WideInventoryAfter over three years of declining
inventory since the peak in Second Quarter
2011, available inventory increased year-
over-year for seven consecutive quarters
through First Quarter 2016. During Second
Quarter 2016 the trend reversed, and
inventory dipped a slight 2%.
There were 2,328 listings available during
Second Quarter 2016 and while there
were 2% fewer listings on the market,
this was the second highest inventory
figure in four years. The year-over-year
decrease was driven solely by co-op
listings, as condos were 14% higher. This is
the fourth consecutive quarter of annual
co-op inventory decline. The increase in
condo listings was driven in part by new
development launches. This quarter there
were 53% more new development units on
the market versus the same time last year.
However, only the lower price segments
displayed declines in available listings.
There were 4% fewer listings priced
between $350,000 and $500,000 and a
27% year-over-year drop in listings under
$350,000. The price category that had the
biggest increase in inventory from Second
Quarter 2015 was the $1,000,000 to
$2,000,000 price range, up 23%.
Month of SupplyBased on sales from the last year and
current listed inventory levels, Brooklyn
has 5.3 months of supply. This figure
indicates an under-supplied market
and one that increased only slightly
from last year at this time, despite the
drop in sales this quarter. Compared to
First Quarter 2016, months of supply
was 8% higher. Resale co-ops have the
lowest months of supply figure of any
product type, at 4.9 months.
The Corcoran Group I p 5
All Sales 2Q16 2Q15 % Chg (yr) 1Q16 % Chg (qtr)
Inventory
Market Wide 2,328 2,366 -2% 2,281 2%
Resale Co-ops 1,000 1,196 -16% 1,089 -8%
Resale Condos 917 902 2% 865 6%
New Development 411 268 53% 327 26%
Months of Supply
Market Wide 5.3 5.7 -7% 4.9 8%
Resale Co-ops 4.9 5.6 -12% 4.5 10%
Resale Condos 5.4 5.1 6% 4.6 17%
New Development 6.1 5.2 18% 5.6 10%
0%
10%
20%
30%
40%
50%
60%
70%
80%
Per
cen
t co
ndo
(lin
e)
Lis
ted
un
its
(bar
s)
2Q
11
3Q
11
4Q
11
1Q12
2Q
12
3Q
12
4Q
12
1Q13
2Q
13
3Q
13
1Q14
2Q
14
3Q
14
4Q
14
1Q15
2Q
15
3Q
15
4Q
15
1Q16
2Q
16
4Q
13
1Q10
2Q
10
3Q
10
4Q
10
1Q11
1
1,500
1,000
500
0
2,000
2,500
3,000
3,500
4,000
Condo Listings Co-op Listings Percent Condo
-30% 10% 20%0%
$0–$350K
$350K–$500K
$500K–$750K
$750K–$1M
$1M–$2M
$2M
30%-20% -10%
LISTED CO-OP & CONDO INVENTORY
ANNUAL CHANGE IN INVENTORY BY PRICE

2Q 2016BROOKLYN CORCORAN REPORT
Market WidePricesFollowing First Quarter’s dip in
prices, Second Quarter 2016 had
significant price gains market wide.
The median price of all Brooklyn
apartment sales in Second Quarter
was $600,000 the highest figure
seen since Fourth Quarter 2009.
Both average and median price
$-
$200
$400
$600
$800
$1,000
$1,200
$-
$0.2
$0.4
$0.6
$0.8
$1.0
$1.2
Pri
ce P
er S
qu
are
Foo
t
Sal
e P
rice
(M
illio
n)
Median Price Average PPSF Median PPSF
2Q16
HISTORICAL PRICES
The Corcoran Group I p 6
Brooklyn 2Q16 2Q15 % Chg (yr) 1Q16 % Chg (qtr)
Prices
Median Price $601K $556K 8% $576K 4%
Average Price $765K $685K 12% $678K 13%
Median PPSF $910 $790 15% $790 15%
Average PPSF $907 $778 17% $784 16%
Median Price by Type
Resale Co-ops $390K $340K 15% $375K 4%
Resale Condo $830K $725K 14% $748K 11%
New Development $780K $755K 3% $725K 8%
Median Price by Bedroom
Studio $402K $383K 5% $405K -1%
1 Bedroom $615K $621K -1% $583K 6%
2 Bedroom $999K $979K 2% $955K 5%
3+ Bedroom $1.499M $1.656M -9% $1.380M 9%
per square foot were the highest
in over eight years. Buyers paid
an average price of $765,000
this quarter, 12% more than last
year and the seventh-consecutive
quarter of year-over-year average
price growth.
The high prices can be attributed
to the 22% share of sales over
$1,000,000 this quarter, the
highest market share of this price
category on record. The gain in new
development sales combined with
shrinking co-op sales also skewed
prices higher. However, all product
types had significant year-over-
year price growth and many figures
surpassed previous record highs.
YEAR-OVER-YEAR CHANGE
MedianPPSF15%
AvgPPSF17%
AvgPrice12%Median
Price8%
0%
4%
8%
12%
16%
20%
The median price change versus
Second Quarter 2015 was mixed.
Studios and two bedroom median
price grew while one and three+
bedroom median prices declined.
Three+ bedroom median price was
9% lower than last quarter due to
fewer penthouse sales.
$-
$200
$400
$600
$800
$1,000
$1,200
$-
$0.2
$0.4
$0.6
$0.8
$1.0
$1.2
Pri
ce P
er S
qu
are
Foo
t
Sal
e P
rice
(M
illio
n)
Median Price Average PPSF Median PPSF
2Q 2016BROOKLYN CORCORAN REPORT
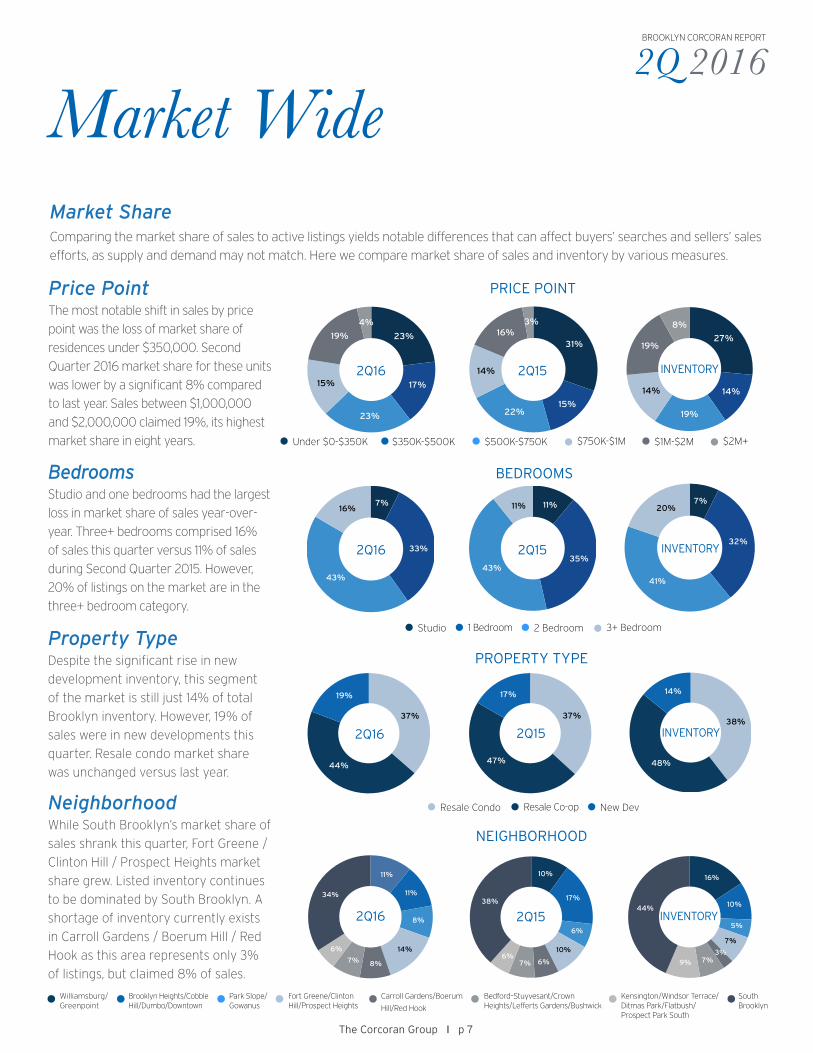
Market WideMarket ShareComparing the market share of sales to active listings yields notable differences that can affect buyers’ searches and sellers’ sales
efforts, as supply and demand may not match. Here we compare market share of sales and inventory by various measures.
The Corcoran Group I p 7
Williamsburg/Greenpoint
Brooklyn Heights/Cobble Hill/Dumbo/Downtown
Fort Greene/Clinton Hill/Prospect Heights
Carroll Gardens/Boerum
Hill/Red Hook Bedford–Stuyvesant/Crown Heights/Lefferts Gardens/Bushwick
Park Slope/Gowanus
NEIGHBORHOOD
PROPERTY TYPE
Price PointThe most notable shift in sales by price
point was the loss of market share of
residences under $350,000. Second
Quarter 2016 market share for these units
was lower by a significant 8% compared
to last year. Sales between $1,000,000
and $2,000,000 claimed 19%, its highest
market share in eight years.
BEDROOMS
23%
17%
23%
15%
19%
4%
1Q16 Price Point Comparison
0-350K
350K-500k
500K-750K
750K-1MM
1MM-2MM
2MM+
31%
15%22%
14%
16%3%
0-350K
350K-500k
500K-750K
750K-1MM
1MM-2MM
2MM+
27%
14%
19%
14%
19%
8%
Inventory Price Point Comparison
0-350K
350K-500k
500K-750K
750K-1MM
1MM-2MM
2MM+
PRICE POINT
7%
33%
43%
16%
4Q15 Bedroom Comparison
Studio
1 Bed
2 Bed
3+ Beds
11%
35%43%
11%
Studio
1 Bed
2 Bed
3+ Beds
7%
32%
41%
20%
Studio
1 Bed
2 Bed
3+ Beds
11%
11%
8%
14%
8%7%
6%
34%
4Q15 Neighborhood Sales Comparison
Zone 1
Zone 2
Zone 3
Zone 4
Zone 5
Zone 6
Zone 7
Zone 8
10%
17%
6%
10%
6%7%6%
38%
4Q14 Neighborhood Sales Comparison
Zone 1
Zone 2
Zone 3
Zone 4
Zone 5
Zone 6
Zone 7
Zone 8
16%
10%
5%
7%
3%7%9%
44%
Inventory Neighborhood Sales Comparison
Zone 1
Zone 2
Zone 3
Zone 4
Zone 5
Zone 6
Zone 7
Zone 8
Under $0-$350K $350K-$500K $750K-$1M$500K-$750K $2M+$1M-$2M
Studio 1 Bedroom 3+ Bedroom2 Bedroom
Resale Condo Resale Co-op New Dev
BedroomsStudio and one bedrooms had the largest
loss in market share of sales year-over-
year. Three+ bedrooms comprised 16%
of sales this quarter versus 11% of sales
during Second Quarter 2015. However,
20% of listings on the market are in the
three+ bedroom category.
Property TypeDespite the significant rise in new
development inventory, this segment
of the market is still just 14% of total
Brooklyn inventory. However, 19% of
sales were in new developments this
quarter. Resale condo market share
was unchanged versus last year.
NeighborhoodWhile South Brooklyn’s market share of
sales shrank this quarter, Fort Greene /
Clinton Hill / Prospect Heights market
share grew. Listed inventory continues
to be dominated by South Brooklyn. A
shortage of inventory currently exists
in Carroll Gardens / Boerum Hill / Red
Hook as this area represents only 3%
of listings, but claimed 8% of sales.
37%
44%
19%
4Q15 Property Type Comparison
Resale Condo
Resale Co-op
New Development
37%
47%
17%
38%
48%
14%
2Q16
2Q16
Kensington/Windsor Terrace/Ditmas Park/Flatbush/ Prospect Park South
South Brooklyn
INVENTORY
23%
17%
23%
15%
19%
4%
1Q16 Price Point Comparison
0-350K
350K-500k
500K-750K
750K-1MM
1MM-2MM
2MM+
31%
15%22%
14%
16%3%
0-350K
350K-500k
500K-750K
750K-1MM
1MM-2MM
2MM+
27%
14%
19%
14%
19%
8%
Inventory Price Point Comparison
0-350K
350K-500k
500K-750K
750K-1MM
1MM-2MM
2MM+
23%
17%
23%
15%
19%
4%
1Q16 Price Point Comparison
0-350K
350K-500k
500K-750K
750K-1MM
1MM-2MM
2MM+
31%
15%22%
14%
16%3%
0-350K
350K-500k
500K-750K
750K-1MM
1MM-2MM
2MM+
27%
14%
19%
14%
19%
8%
Inventory Price Point Comparison
0-350K
350K-500k
500K-750K
750K-1MM
1MM-2MM
2MM+
INVENTORY2Q152Q167%
33%
43%
16%
4Q15 Bedroom Comparison
Studio
1 Bed
2 Bed
3+ Beds
11%
35%43%
11%
Studio
1 Bed
2 Bed
3+ Beds
7%
32%
41%
20%
Studio
1 Bed
2 Bed
3+ Beds
7%
33%
43%
16%
4Q15 Bedroom Comparison
Studio
1 Bed
2 Bed
3+ Beds
11%
35%43%
11%
Studio
1 Bed
2 Bed
3+ Beds
7%
32%
41%
20%
Studio
1 Bed
2 Bed
3+ Beds
INVENTORY2Q152Q16
37%
44%
19%
4Q15 Property Type Comparison
Resale Condo
Resale Co-op
New Development
37%
47%
17%
38%
48%
14%
37%
44%
19%
4Q15 Property Type Comparison
Resale Condo
Resale Co-op
New Development
37%
47%
17%
38%
48%
14%
INVENTORY
11%
11%
8%
14%
8%7%
6%
34%
4Q15 Neighborhood Sales Comparison
Zone 1
Zone 2
Zone 3
Zone 4
Zone 5
Zone 6
Zone 7
Zone 8
10%
17%
6%
10%
6%7%6%
38%
4Q14 Neighborhood Sales Comparison
Zone 1
Zone 2
Zone 3
Zone 4
Zone 5
Zone 6
Zone 7
Zone 8
16%
10%
5%
7%
3%7%9%
44%
Inventory Neighborhood Sales Comparison
Zone 1
Zone 2
Zone 3
Zone 4
Zone 5
Zone 6
Zone 7
Zone 8
11%
11%
8%
14%
8%7%
6%
34%
4Q15 Neighborhood Sales Comparison
Zone 1
Zone 2
Zone 3
Zone 4
Zone 5
Zone 6
Zone 7
Zone 8
10%
17%
6%
10%
6%7%6%
38%
4Q14 Neighborhood Sales Comparison
Zone 1
Zone 2
Zone 3
Zone 4
Zone 5
Zone 6
Zone 7
Zone 8
16%
10%
5%
7%
3%7%9%
44%
Inventory Neighborhood Sales Comparison
Zone 1
Zone 2
Zone 3
Zone 4
Zone 5
Zone 6
Zone 7
Zone 8
2Q15
2Q15
2Q 2016BROOKLYN CORCORAN REPORT
Resale Co-opsResale co-op closings were 26%
lower year-over-year and 12% lower
than First Quarter 2016. The decline
in sales was skewed partially by last
year’s sales total, which was the
second highest figure in over eight
years, but was also due to declining
inventory. Resale co-op inventory
has declined year-over-year for four
consecutive quarters and is now 29%
below the peak in Second Quarter
2012. Despite the dip in sales, the
resale co-op market remained under-
supplied at 4.9 months of supply. The
days on market increase is likely due
to low inventory levels, which caused
lingering listings to finally sell.
$0
$200
$400
$600
$800
$-
$0.2
$0.4
$0.6
$0.8
Pri
ce P
er S
qu
are
Foo
t
Sal
e P
rice
(M
illio
n)
Median Price Average PPSF Median PPSF
2Q16
RESALE CO-OP HISTORICAL PRICES
8 Pierrepont Street I WEB# 3672206 459 5th Street I WEB# 3692077
The Corcoran Group I p 8
Resale Co-ops 2Q16 2Q15 % Chg (yr) 1Q16 % Chg (qtr)
Overview
Sales 513 694 -26% 582 -12%
Average Days on Market 72 64 12% 67 7%
Inventory 1,000 1,196 -16% 1,089 -8%
Months of Supply 4.9 5.6 -12% 4.5 10%
Prices
Median Price $390K $340K 15% $375K 4%
Average Price $514K $452K 14% $487K 6%
Median PPSF $699 $617 13% $658 6%
Average PPSF $746 $661 13% $691 8%
Median Price by Bedroom
Studio $339K $339K 0% $363K -7%
1 Bedroom $480K $449K 7% $493K -3%
2 Bedroom $749K $770K -3% $725K 3%
3+ Bedroom $1.400M $1.495M -6% $1.330M 5%
Average price was 14% higher
than last year, reaching $514,000.
The market share of sales over
$1,000,000 was larger this quarter
versus Second Quarter 2015; 10% of
all resale co-ops versus 7% a year
ago, boosting median price up to the
highest level in five years. Average
and median price per square foot
both increased 13% year-over-year.
The 7% annual rise in one bedroom
median price countered the decline
of two and three+ bedroom median
prices.
ANNUAL MEDIAN PRICE CHANGE BY BEDROOM
1 BR
7%
2 BR
-3%
3+ BR
-6%0%
10%
5%
Studio
0%
-10%
-5%
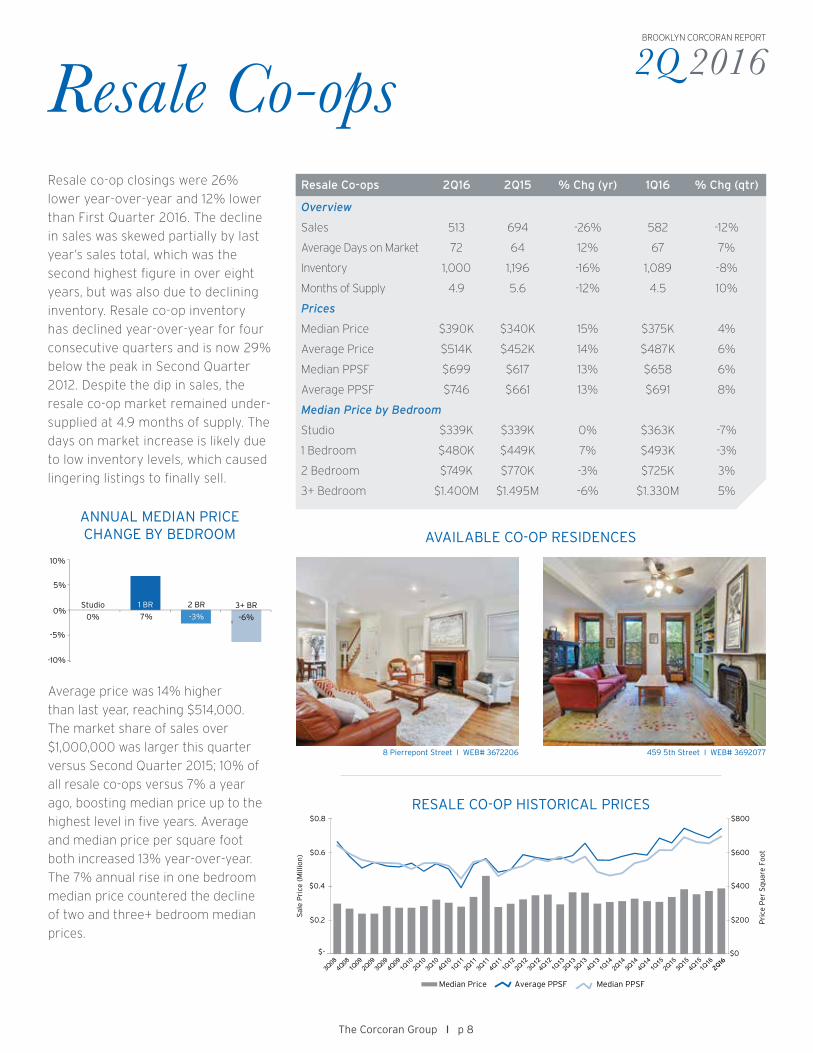
AVAILABLE CO-OP RESIDENCES
2Q 2016BROOKLYN CORCORAN REPORT
Resale CondosClosed sale activity in the resale
condo market was 14% lower than
Second Quarter 2015, a notable trend
considering resale condo available
listings remained nearly level with last
year. Resale condo sales did improve
relative to the first quarter of the
year, which is a typical seasonal trend,
increasing by 12%.
RESALE CONDOS HISTORICAL PRICES
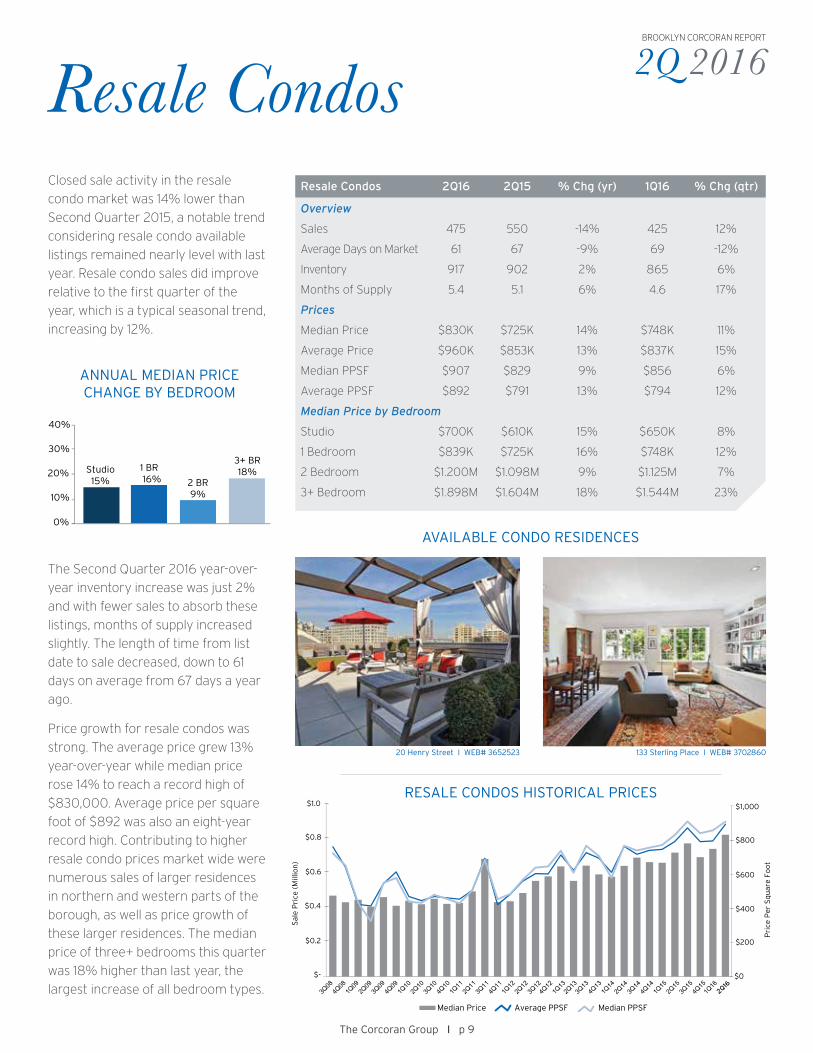
20 Henry Street I WEB# 3652523 133 Sterling Place I WEB# 3702860
The Corcoran Group I p 9
Resale Condos 2Q16 2Q15 % Chg (yr) 1Q16 % Chg (qtr)
Overview
Sales 475 550 -14% 425 12%
Average Days on Market 61 67 -9% 69 -12%
Inventory 917 902 2% 865 6%
Months of Supply 5.4 5.1 6% 4.6 17%
Prices
Median Price $830K $725K 14% $748K 11%
Average Price $960K $853K 13% $837K 15%
Median PPSF $907 $829 9% $856 6%
Average PPSF $892 $791 13% $794 12%
Median Price by Bedroom
Studio $700K $610K 15% $650K 8%
1 Bedroom $839K $725K 16% $748K 12%
2 Bedroom $1.200M $1.098M 9% $1.125M 7%
3+ Bedroom $1.898M $1.604M 18% $1.544M 23%
The Second Quarter 2016 year-over-
year inventory increase was just 2%
and with fewer sales to absorb these
listings, months of supply increased
slightly. The length of time from list
date to sale decreased, down to 61
days on average from 67 days a year
ago.
Price growth for resale condos was
strong. The average price grew 13%
year-over-year while median price
rose 14% to reach a record high of
$830,000. Average price per square
foot of $892 was also an eight-year
record high. Contributing to higher
resale condo prices market wide were
numerous sales of larger residences
in northern and western parts of the
borough, as well as price growth of
these larger residences. The median
price of three+ bedrooms this quarter
was 18% higher than last year, the
largest increase of all bedroom types.$0
$200
$400
$600
$800
$-
$0.2
$0.4
$0.6
$0.8
Pri
ce P
er S
qu
are
Foo
t
Sal
e P
rice
(M
illio
n)
Median Price Average PPSF Median PPSF
$1,000 $1.0
2Q16
Studio15%
1 BR 16% 2 BR
9%
3+ BR18%
10%
30%
20%
40%
0%
ANNUAL MEDIAN PRICE CHANGE BY BEDROOM
AVAILABLE CONDO RESIDENCES

2Q 2016BROOKLYN CORCORAN REPORT
New DevelopmentsThere was very little change in new
development closed sales compared
to last year, however versus First
Quarter 2016 the number of closed
sales was 14% higher. During Second
Quarter 2015 new development sales
were concentrated in a few large scale
properties, such as 388 Bridge Street.
Sales this quarter were not weighed
heavily in one project, but rather
spread throughout several boutique
projects within the borough.
The Corcoran Group I p 10
New Developments 2Q16 2Q15 % Chg (yr) 1Q16 % Chg (qtr)
Sales 248 246 1% 218 14%
Inventory 411 268 53% 327 26%
Months of Supply 6.1 5.2 18% 5.6 10%
Prices
Median Price $780K $755K 3% $725K 8%
Average Price $972K $965K 1% $880K 10%
Median PPSF $1,013 $825 23% $825 23%
Average PPSF $1,054 $817 29% $803 31%
Median Price by Bedroom
Studio $572K $639K -10% $631K -9%
1 Bedroom $681K $899K -24% $735K -7%
2 Bedroom $1.168M $1.249M -6% $995K 17%
3+ Bedroom $1.435M $2.379M -40% $1.018M 41%
This also explains the mixed price
changes in new developments this
quarter. Average and median price
rose only slightly year-over-year but
average and median price per square
foot were both over 20% higher
versus Second Quarter 2015. Both
figures were the second highest in
nearly eight years. Median prices for
each bedroom type were all lower
than a year ago, particularly due to the
composition of sold residences at 388
Bridge Street.
Listed inventory in new developments
increased versus both last quarter and
last year. New development inventory
was 53% higher than Second Quarter
2015. Fueling the rise in inventory were
more large-scale new development
introductions such as Austin Nichols
House, which is the largest project to
launch for sale in Brooklyn since 2008.
NEW DEVELOPMENT HISTORICAL PRICES
$0
$200
$400
$600
$800
$-
$0.2
$0.4
$0.6
$0.8
Pri
ce P
er S
qu
are
Foo
t
Sal
e P
rice
(M
illio
n)
Median Price Average PPSF Median PPSF
$1,000 $1.0
$1.2 $1,200
2Q16
The Boerum Baltic Park Slope
Studio-10%
1 BR-24%
2 BR-6% 3+ BR
-40%
-30%
-10%
-20%
0%
10%
-40%
ANNUAL MEDIAN PRICE CHANGE BY BEDROOM
AVAILABLE NEW DEVELOPMENT RESIDENCES

2Q 2016BROOKLYN CORCORAN REPORT
Luxury
With fewer high priced single-family
townhouses sales, average and
median price dipped below last years’
figures but both were higher than
last quarter. Median price decreased
15% versus Second Quarter 2015,
while average price declined 12%
versus the same time period. Half
of the neighborhoods in Brooklyn
had annual average and median
price gains, but these sales were in
neighborhoods east and south of
Prospect Park.
Multi-family townhouse median and
TownhouseTownhouse 2Q16 2Q15 % Chg (yr) 1Q16 % Chg (qtr)
Single-Family
Median Price $1.450M $1.700M -15% $1.255M 15%
Average Price $1.614M $1.829M -12% $1.482M 9%
Multi-Family
Median Price $1.350M $1.330M 2% $1.450M -7%
Average Price $1.587M $1.704M -7% $1.728M -8%
The luxury market is defined as
the top 10% of sales in terms of
price, which this quarter included
all sales over $1,488,000.The luxury
threshold was 9% higher than last
year and 15% above the figure from
First Quarter 2016. The median price
for a luxury sale this quarter was
$1,850,000, 7% higher than a year
ago. The average price for a luxury
sale increased 4% year-over-year,
surpassing $2,000,000. Average and
median price per square foot both
rose slightly versus the same period a
year ago.
New development market share of
luxury sales shrank compared to
both last quarter and last year to
22%. Resale condos claimed 57% of
all luxury sales.
Luxury 2Q16 2Q15 % Chg (yr) 1Q16 % Chg (qtr)
Prices
Median Price $1.850M $1.725M 7% $1.551M 19%
Average Price $2.083M $1.995M 4% $1.752M 19%
Median PPSF $1,310 $1,296 1% $1,217 8%
Average PPSF $1,291 $1,270 2% $1,183 9%
Luxury Threshold $1.488M $1.365M 9% $1.295M 15%
The Corcoran Group I p 11
average sale price changes were
mixed. Median price rose 2% year-
over-year but average price declined
7% versus last year and both figures
0%
20%
40%
60%
80%
100% 31%34% 22%
New Dev
20% 23%
Resale Condo Resale Coop
46% 57%
18%
48%
2Q16 2Q15 1Q16
MARKET SHARE OF LUXURY SALES
were lower than last quarter. Bedford-
Stuyvesant and Crown Heights was
the only area to see significant year-
over-year price growth.
360 Furman Street I WEB# 3644762
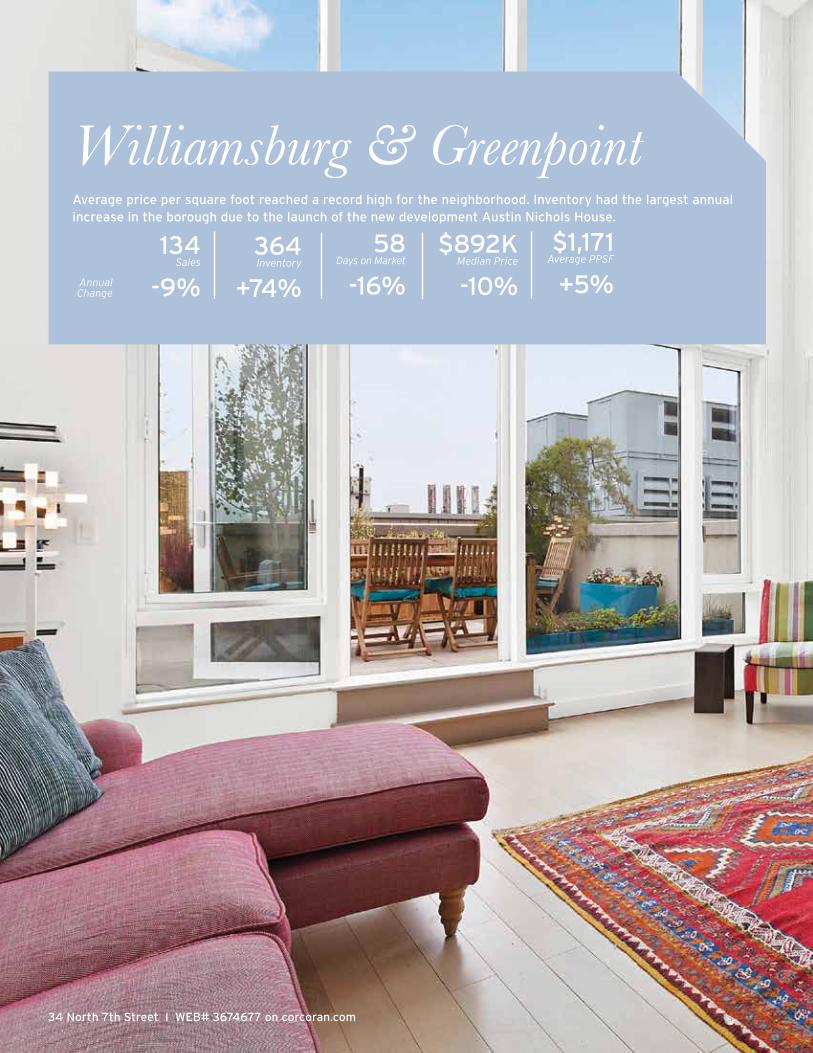
34 North 7th Street I WEB# 3674677 on corcoran.com
Williamsburg & Greenpoint134
Sales
-9%
58 Days on Market
-16%
$892K Median Price
-10%
$1,171 Average PPSF
+5%Annual Change
Average price per square foot reached a record high for the neighborhood. Inventory had the largest annual increase in the borough due to the launch of the new development Austin Nichols House.
364Inventory
+74%

2Q 2016BROOKLYN CORCORAN REPORT
Williamsburg and Greenpoint sales
were down 9% this quarter to
134 closings. However this activity
remained on par with sales activity
last quarter. Inventory increased by
a significant 74% in Second Quarter
2016, mainly due to new development
listings. The market remains tight as
average days on market decreased to
58 days this quarter, below the average
for the borough.
Williamsburg & Greenpoint
2Q16 2Q15 % Chg (yr) 1Q16 % Chg (qtr)
Overview
Sales 134 148 -9% 133 1%
Average Days on Market 58 69 -16% 74 -22%
Inventory 364 209 74% 215 69%
Co-op 2Q16 2Q15 % Chg (yr) 1Q16 % Chg (qtr)
Prices
Median Price $395K $417K -5% $280K 41%
Average Price $314K $569K -45% $303K 4%
Median PPSF NA $740 NA NA NA
Average PPSF NA $782 NA NA NA
Median Price by Bedroom
Studio $408K NA NA NA NA
1 Bedroom NA $454K NA $268K NA
2 Bedroom NA $428K NA $323K NA
3+ Bedroom NA NA NA NA NA
Condo 2Q16 2Q15 % Chg (yr) 1Q16 % Chg (qtr)
Prices
Median Price $900K $997K -10% $875K 3%
Average Price $1.081M $1.246M -13% $1.000M 8%
Median PPSF $1,195 $1,158 3% $1,181 1%
Average PPSF $1,171 $1,119 5% $1,026 14%
Median Price by Bedrooms
Studio $656K $740K -11% $650K 1%
1 Bedroom $893K $861K 4% $795K 12%
2 Bedroom $1.611M $1.195M 35% $1.325M 22%
3+ Bedroom $2.750M $3.035M -9% $2.376M 16%
Townhouse 2Q16 2Q15 % Chg (yr) 1Q16 % Chg (qtr)
Single-Family
Median Price $2.063M $1.825M 13% $1.725M 20%
Average Price $2.063M $2.163M -5% $2.000M 3%
Multi-Family
Median Price $2.050M $2.200M -7% $2.310M -11%
Average Price $2.109M $2.492M -15% $2.369M -11%
Average condo price reached an eight-year
record high
The Corcoran Group I p 13
Median price for condominiums dipped
10% year-over-year to $900,000
this quarter. Average price was also
down 13% from Second Quarter
2015. Yet, both median and average
prices were up from last quarter. The
condominium average price per square
foot hit an eight-year record high of
$1,171, increasing 5% from last year
and 14% from last quarter. The annual
decrease in median and average price,
despite an increase in price per square
foot, was the result of more small
apartments selling this quarter.
Pricing by bedroom was varied in
Second Quarter 2016 when compared
to last year, with increases in one
and two bedroom residences, and
decreases in studios and three-plus
bedrooms. Two bedroom pricing
increased 35% year-over-year,
reaching a median price of $1,611,000.

90 Furman Street I WEB# 3664731 on corcoran.com
139Sales
-45%
67 Days on Market
+19%
$995K Median Price
+8%
$1,255 Average PPSF
+11%Annual Change
Brooklyn Heights, Cobble Hill, Dumbo & DowntownSales activity in this neighborhood shrank and fewer new developments commenced closings. Average price per square foot grew 11% to reach a new record high. Median price was the second highest seen in over eight years.
234Inventory
-9%

2Q 2016BROOKLYN CORCORAN REPORT
Sales in this neighborhood during Second
Quarter 2015 were dominated by closings
at 388 Bridge, which is now nearly sold
out. As a result, closings dropped 45%
this quarter, the largest year-over-year
decline in the borough. In addition, Second
Quarter 2016 inventory was 9% lower
than last year as currently selling new
developments reached the end of their
selling cycle. The length of time it took
for available listings to enter contract
increased to 67 days, 19% higher than
Second Quarter 2015, but level with the
borough-wide figure.
Co-op average sale price during Second
Quarter 2016 displayed steady price
growth. Compared to last year, co-op
average price was up 11% to $886,000,
5% more than First Quarter 2016. Average
price per square foot rose by 22% relative
to last year, while median price per square
foot declined by a modest 2% versus the
same period.
2Q16 2Q15 % Chg (yr) 1Q16 % Chg (qtr)
Overview
Sales 139 252 -45% 155 -11%
Average Days on Market 67 56 19% 62 8%
Inventory 234 256 -9% 229 2%
Co-op 2Q16 2Q15 % Chg (yr) 1Q16 % Chg (qtr)
Prices
Median Price $600K $640K -6% $685K -12%
Average Price $886K $799K 11% $844K 5%
Median PPSF $892 $908 -2% $944 -6%
Average PPSF $1,100 $905 22% $1,021 8%
Median Price by Bedroom
Studio $349K $375K -7% $430K -19%
1 Bedroom $602K $625K -4% $605K 0%
2 Bedroom $1.195M $1.113M 7% $1.190M 0%
3+ Bedroom $1.775M $2.110M -16% $1.950M -9%
Condo 2Q16 2Q15 % Chg (yr) 1Q16 % Chg (qtr)
Prices
Median Price $1.375M $1.170M 18% $1.145M 20%
Average Price $1.558M $1.194M 30% $1.315M 18%
Median PPSF $1,206 $1,200 0% $1,165 3%
Average PPSF $1,299 $1,190 9% $1,167 11%
Median Price by Bedroom
Studio $710K $650K 9% $715K -1%
1 Bedroom $987K $920K 7% $899K 10%
2 Bedroom $1.410M $1.428M -1% $1.195M 18%
3+ Bedroom $2.493M $2.189M 14% $2.075M 20%
Townhouse 2Q16 2Q15 % Chg (yr) 1Q16 % Chg (qtr)
Single-Family
Median Price NA $6.250M NA $1.888M NA
Average Price NA $6.250M NA $2.243M NA
Multi-Family
Median Price $2.550M $4.000M -36% $3.850M -34%
Average Price $2.550M $5.212M -51% $4.400M -42%
Brooklyn Heights,Cobble Hill,Dumbo & Downtown
The Corcoran Group I p 15
Average condo price per square foot was the highest
in Brooklyn Compared to the Second Quarter of last
year, median and average price for condo
units displayed double-digit increases. The
median condo price of $1,375,000 was
18% above last year’s figure and was the
highest in over eight years. Average price
per square foot rose 9% to $1,299 per
square foot, also a new record and the
highest such figure in the borough. New
developments such as 210 Pacific Street,
along with high priced resales in Dumbo,
fueled these gains.
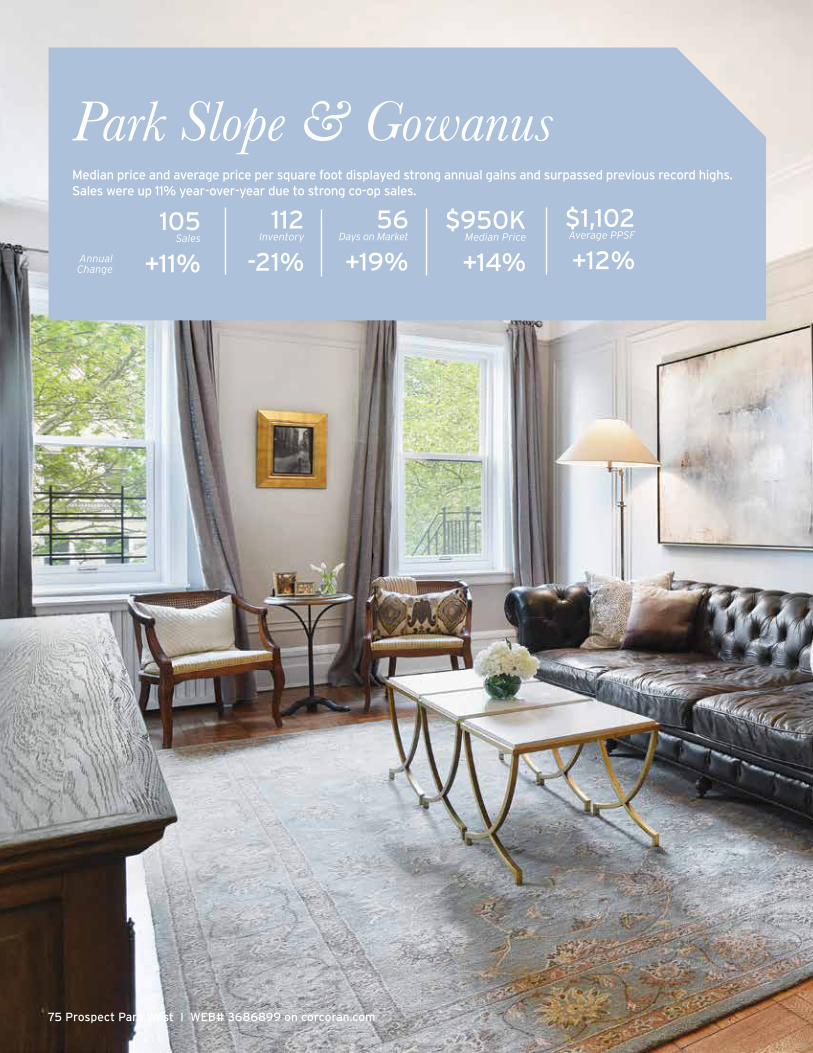
75 Prospect Park West I WEB# 3686899 on corcoran.com
Park Slope & Gowanus105
Sales
+11%
56 Days on Market
+19%
$950K Median Price
+14%
$1,102 Average PPSF
+12%Annual Change
Median price and average price per square foot displayed strong annual gains and surpassed previous record highs. Sales were up 11% year-over-year due to strong co-op sales.
112Inventory
-21%
2Q 2016BROOKLYN CORCORAN REPORT
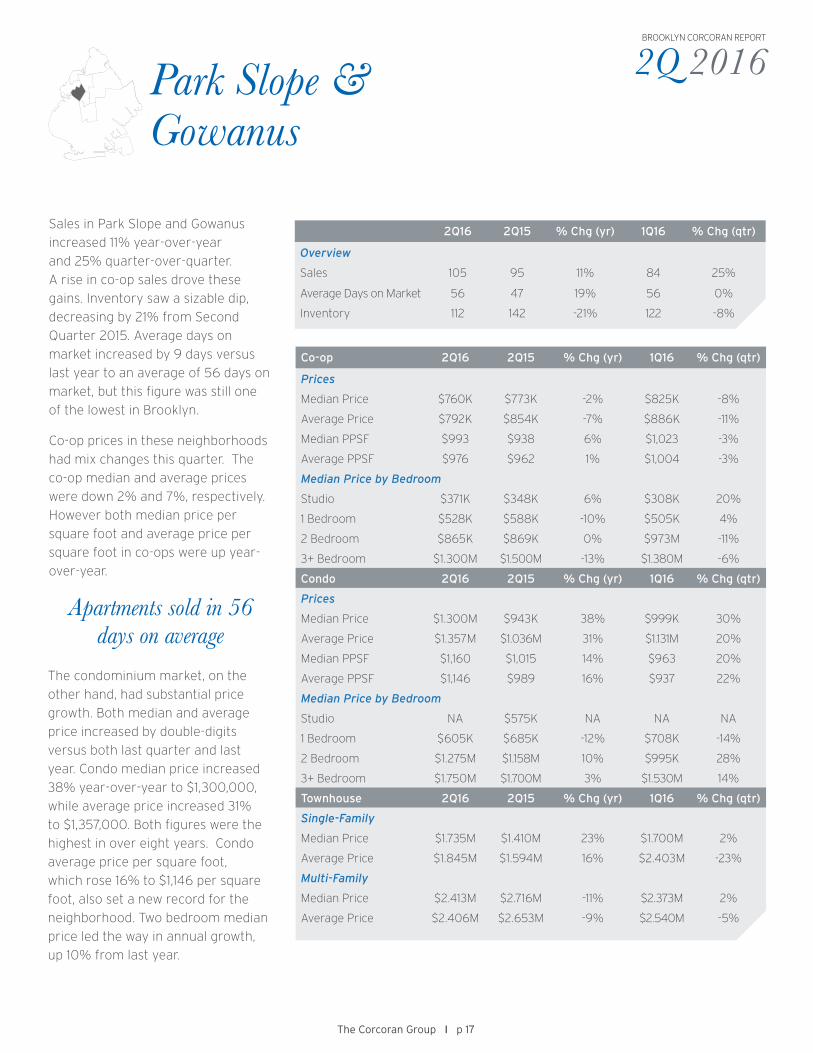
Sales in Park Slope and Gowanus
increased 11% year-over-year
and 25% quarter-over-quarter.
A rise in co-op sales drove these
gains. Inventory saw a sizable dip,
decreasing by 21% from Second
Quarter 2015. Average days on
market increased by 9 days versus
last year to an average of 56 days on
market, but this figure was still one
of the lowest in Brooklyn.
Co-op prices in these neighborhoods
had mix changes this quarter. The
co-op median and average prices
were down 2% and 7%, respectively.
However both median price per
square foot and average price per
square foot in co-ops were up year-
over-year.
2Q16 2Q15 % Chg (yr) 1Q16 % Chg (qtr)
Overview
Sales 105 95 11% 84 25%
Average Days on Market 56 47 19% 56 0%
Inventory 112 142 -21% 122 -8%
Co-op 2Q16 2Q15 % Chg (yr) 1Q16 % Chg (qtr)
Prices
Median Price $760K $773K -2% $825K -8%
Average Price $792K $854K -7% $886K -11%
Median PPSF $993 $938 6% $1,023 -3%
Average PPSF $976 $962 1% $1,004 -3%
Median Price by Bedroom
Studio $371K $348K 6% $308K 20%
1 Bedroom $528K $588K -10% $505K 4%
2 Bedroom $865K $869K 0% $973M -11%
3+ Bedroom $1.300M $1.500M -13% $1.380M -6%
Condo 2Q16 2Q15 % Chg (yr) 1Q16 % Chg (qtr)
Prices
Median Price $1.300M $943K 38% $999K 30%
Average Price $1.357M $1.036M 31% $1.131M 20%
Median PPSF $1,160 $1,015 14% $963 20%
Average PPSF $1,146 $989 16% $937 22%
Median Price by Bedroom
Studio NA $575K NA NA NA
1 Bedroom $605K $685K -12% $708K -14%
2 Bedroom $1.275M $1.158M 10% $995K 28%
3+ Bedroom $1.750M $1.700M 3% $1.530M 14%
Townhouse 2Q16 2Q15 % Chg (yr) 1Q16 % Chg (qtr)
Single-Family
Median Price $1.735M $1.410M 23% $1.700M 2%
Average Price $1.845M $1.594M 16% $2.403M -23%
Multi-Family
Median Price $2.413M $2.716M -11% $2.373M 2%
Average Price $2.406M $2.653M -9% $2.540M -5%
Park Slope & Gowanus
The Corcoran Group I p 17
The condominium market, on the
other hand, had substantial price
growth. Both median and average
price increased by double-digits
versus both last quarter and last
year. Condo median price increased
38% year-over-year to $1,300,000,
while average price increased 31%
to $1,357,000. Both figures were the
highest in over eight years. Condo
average price per square foot,
which rose 16% to $1,146 per square
foot, also set a new record for the
neighborhood. Two bedroom median
price led the way in annual growth,
up 10% from last year.
Apartments sold in 56 days on average

45 Madison Street I WEB# 3692735 on corcoran.com
175Sales
+23%
53 Days on Market
-17%
$765K Median Price
+14%
$900 Average PPSF
+44%Annual Change
Fort Greene, Clinton Hill & Prospect HeightsSales activity and prices both rose versus last year. Sales were 23% above Second Quarter 2015, the largest year-over-year increase in the borough. Median price and average price per square foot both set new records due to several new development sales throughout the neighborhood.
172Inventory
+15%

2Q 2016BROOKLYN CORCORAN REPORT
Sales in Second Quarter 2016
increased significantly in Fort
Greene, Clinton Hill, and Prospect
Heights, up 23% year-over-year. New
development sales mainly drove the
increase. Inventory increased by 15%
from Second Quarter 2015, but was
down slightly versus First Quarter
2016. Average days on market, at
53 days, decreased by double-digits
versus last year and last quarter.
2Q16 2Q15 % Chg (yr) 1Q16 % Chg (qtr)
Overview
Sales 175 142 23% 141 24%
Average Days on Market 53 63 -17% 62 -15%
Inventory 172 149 15% 179 -4%
Co-op 2Q16 2Q15 % Chg (yr) 1Q16 % Chg (qtr)
Prices
Median Price $614K $550K 12% $585K 5%
Average Price $669K $597K 12% $724K -8%
Median PPSF $803 $697 15% $788 2%
Average PPSF $800 $772 4% $828 -3%
Median Price by Bedroom
Studio $353K $400K -12% $375K -6%
1 Bedroom $524K $539K -3% $551K -5%
2 Bedroom $743K $780K -5% $900K -18%
3+ Bedroom $1.600M NA NA $1.473M 9%
Condo 2Q16 2Q15 % Chg (yr) 1Q16 % Chg (qtr)
Prices
Median Price $902K $720K 25% $835K 8%
Average Price $969K $821K 18% $898K 8%
Median PPSF $963 $728 32% $839 15%
Average PPSF $910 $600 52% $781 16%
Median Price by Bedroom
Studio $539K $583K -7% $460K 17%
1 Bedroom $650K $725K -10% $702K -7%
2 Bedroom $1.168M $1.040M 12% $1.007M 16%
3+ Bedroom $1.140M $980K 16% $1.175M -3%
Townhouse 2Q16 2Q15 % Chg (yr) 1Q16 % Chg (qtr)
Single-Family
Median Price $2.675M $2.400M 11% $1.750M 53%
Average Price $2.675M $2.529M 6% $1.809M 48%
Multi-Family
Median Price $2.300M $2.400M -4% $1.890M 22%
Average Price $2.229M $2.147M 4% $2.058M 8%
The Corcoran Group I p 19
Fort Greene, Clinton Hill & Prospect Heights
Co-op prices rose relative to a year
ago as a higher number of sales
this quarter were located in close
proximity to Prospect Park. Both
median and average price increased
12% year-over-year. Co-op median
price per square foot rose 15%
versus last year, while average price
per square foot increased by a more
modest 4% versus the same period.
The median price for condominiums
rose by 25% year-over-year to
an eight-year high of $902,000.
Average condo price, which rose
18% from last year to $969,000,
also reached an eight-year high.
These gains were joined by double-
digit annual increases in both the
median and average price per square
foot, which were up 32% and 52%,
respectively. Prices were bolstered by
strong median price increases in two
and three-plus bedrooms.
Closed sales increased 23% versus a year ago
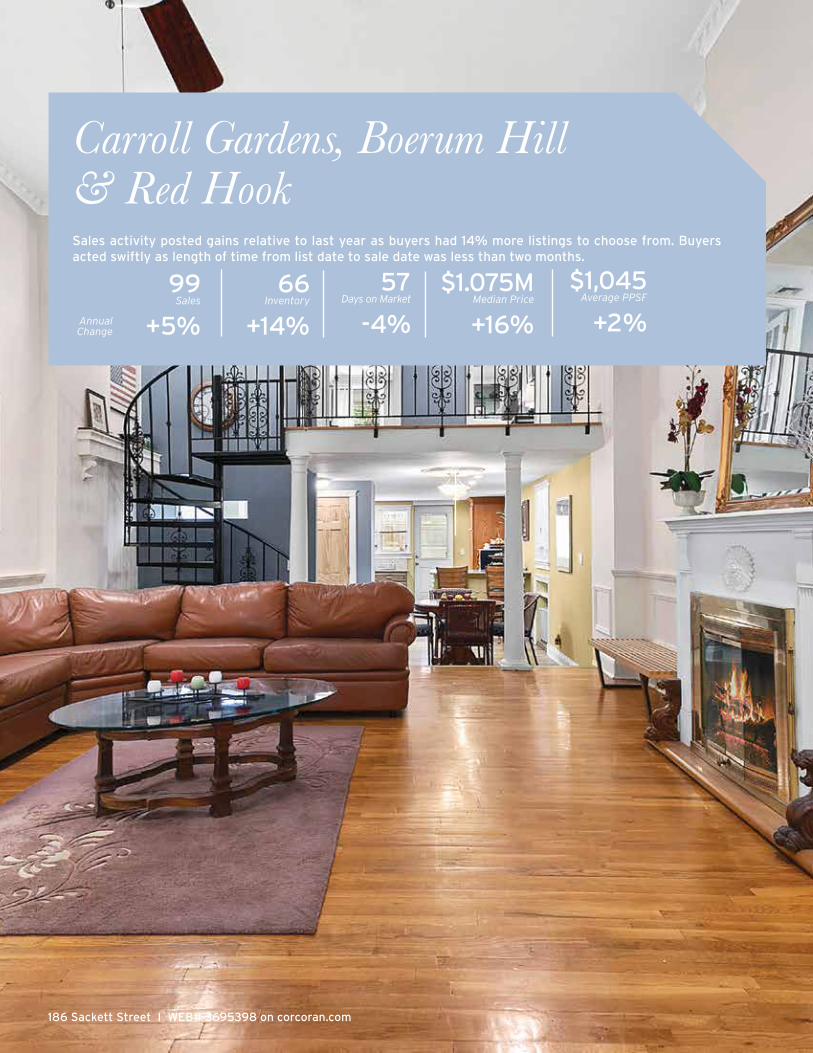
99Sales
+5%
57 Days on Market
-4%
$1.075M Median Price
+16%
$1,045 Average PPSF
+2%Annual Change
Carroll Gardens, Boerum Hill & Red Hook
186 Sackett Street I WEB# 3695398 on corcoran.com
Sales activity posted gains relative to last year as buyers had 14% more listings to choose from. Buyers acted swiftly as length of time from list date to sale date was less than two months.
66Inventory
+14%
2Q 2016BROOKLYN CORCORAN REPORT
Co-op 2Q16 2Q15 % Chg (yr) 1Q16 % Chg (qtr)
Prices
Median Price $985K $683K 44% $754K 31%
Average Price $980K $785K 25% $761K 29%
Median PPSF $1,006 $880 14% $959 5%
Average PPSF $1,030 $1,047 -2% $956 8%
Median Price by Bedroom
Studio NA $384K NA $359K NA
1 Bedroom $583K $625K -7% $690K -16%
2 Bedroom $1.095M $979K 12% $914K 20%
3+ Bedroom $1.925M $2.350M -18% NA NA
Condo 2Q16 2Q15 % Chg (yr) 1Q16 % Chg (qtr)
Prices
Median Price $1.085M $1.175M -8% $1.100M -1%
Average Price $1.189M $1.188M 0% $1.169M 2%
Median PPSF $1,046 $1,046 0% $1,055 -1%
Average PPSF $1,047 $1,025 2% $1,042 1%
Median Price by Bedroom
Studio NA NA NA NA NA
1 Bedroom $742K $699K 6% $745K 0%
2 Bedroom $1.135M $1.200M -5% $1.138M 0%
3+ Bedroom $1.275M $1.752M -27% $2.037M -37%
Townhouse 2Q16 2Q15 % Chg (yr) 1Q16 % Chg (qtr)
Single-Family
Median Price $2.278M $3.756M -39% $3.950M -42%
Average Price $2.739M $3.756M -27% $3.536M -23%
Multi-Family
Median Price $3.100M $2.838M 9% $2.995M 4%
Average Price $2.805M $2.996M -6% $2.975M -6%
The Corcoran Group I p 21
Carroll Gardens,Boerum Hill & Red Hook
2Q16 2Q15 % Chg (yr) 1Q16 % Chg (qtr)
Overview
Sales 99 95 5% 68 46%
Average Days on Market 57 60 -4% 91 -37%
Inventory 66 58 14% 36 83%
Median price had the strongest annual gain
in Brooklyn
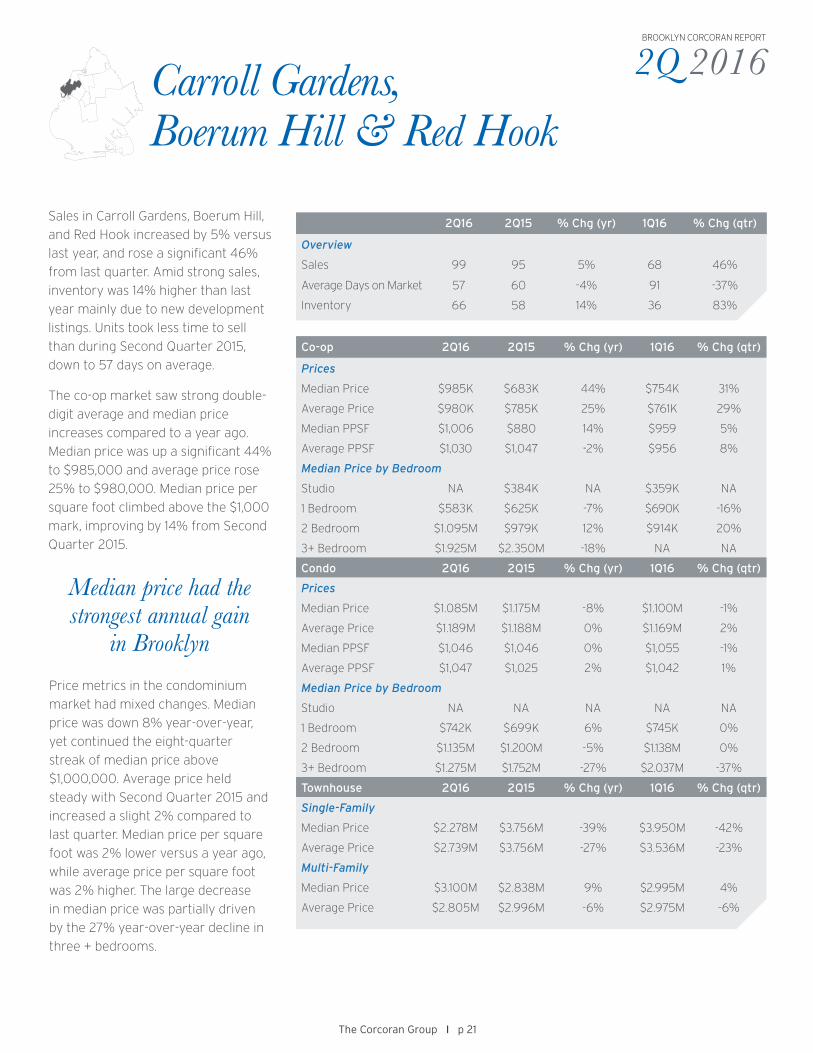
Sales in Carroll Gardens, Boerum Hill,
and Red Hook increased by 5% versus
last year, and rose a significant 46%
from last quarter. Amid strong sales,
inventory was 14% higher than last
year mainly due to new development
listings. Units took less time to sell
than during Second Quarter 2015,
down to 57 days on average.
The co-op market saw strong double-
digit average and median price
increases compared to a year ago.
Median price was up a significant 44%
to $985,000 and average price rose
25% to $980,000. Median price per
square foot climbed above the $1,000
mark, improving by 14% from Second
Quarter 2015.
Price metrics in the condominium
market had mixed changes. Median
price was down 8% year-over-year,
yet continued the eight-quarter
streak of median price above
$1,000,000. Average price held
steady with Second Quarter 2015 and
increased a slight 2% compared to
last quarter. Median price per square
foot was 2% lower versus a year ago,
while average price per square foot
was 2% higher. The large decrease
in median price was partially driven
by the 27% year-over-year decline in
three + bedrooms.
326-328 Menahan Street I WEB# 3676284 on corcoran.com
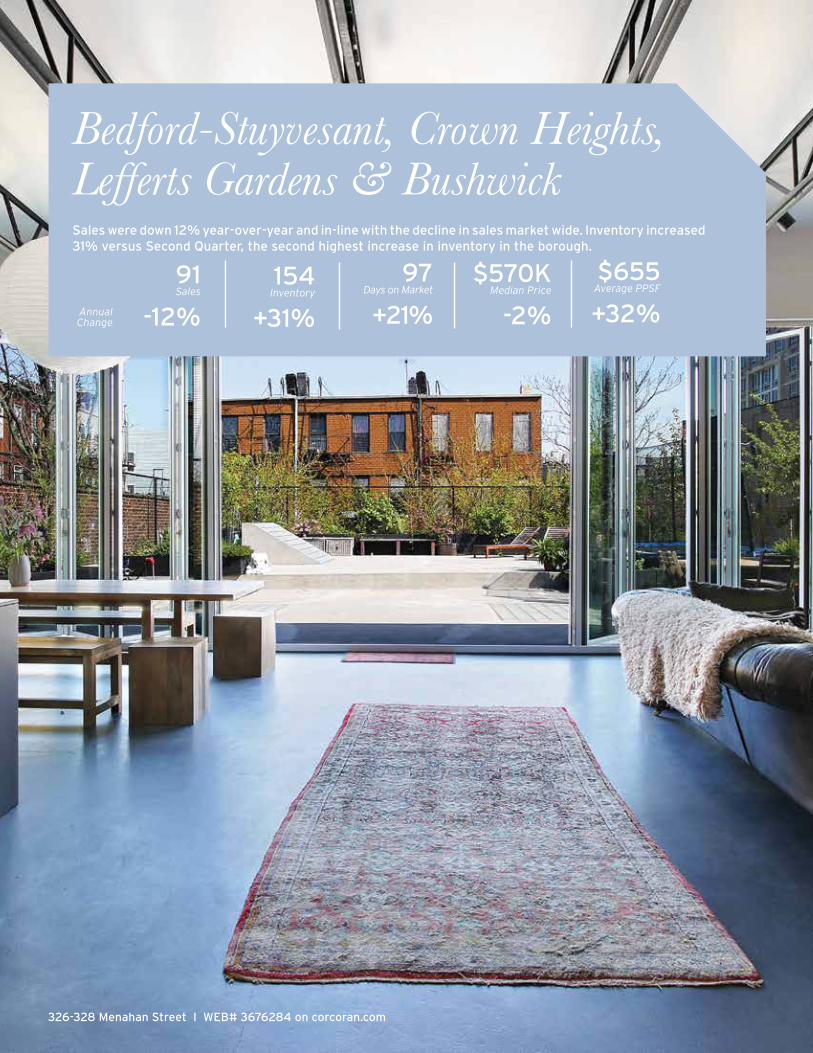
91Sales
-12%
97 Days on Market
+21%
$570K Median Price
-2%
$655 Average PPSF
+32%Annual Change
Bedford-Stuyvesant, Crown Heights,Lefferts Gardens & BushwickSales were down 12% year-over-year and in-line with the decline in sales market wide. Inventory increased 31% versus Second Quarter, the second highest increase in inventory in the borough.
154Inventory
+31%

2Q 2016BROOKLYN CORCORAN REPORT
Sales this quarter were 12% lower
than a year ago, but increased 5%
versus First Quarter 2016. Inventory
in this neighborhood grew 31%
year-over-year, fueled mainly by the
15-plus new developments currently
on the market. Time from list date to
sale date also lengthened versus last
year, to 97 days, the highest in the
borough.
Bedford-Stuyvesant, Crown Heights, Lefferts Gardens & Bushwick
2Q16 2Q15 % Chg (yr) 1Q16 % Chg (qtr)
Overview
Sales 91 103 -12% 87 5%
Average Days on Market 97 81 21% 71 37%
Inventory 154 118 31% 125 23%
Co-op 2Q16 2Q15 % Chg (yr) 1Q16 % Chg (qtr)
Prices
Median Price $408K $280K 46% $340K 20%
Average Price $473K $325K 46% $351K 35%
Median PPSF $477 $406 17% $383 25%
Average PPSF $577 $429 35% $432 34%
Median Price by Bedroom
Studio $170K $265K -36% NA NA
1 Bedroom $370K $330K 12% $207K 79%
2 Bedroom $768K $619K 24% $618K 24%
3+ Bedroom NA NA NA NA NA
Condo 2Q16 2Q15 % Chg (yr) 1Q16 % Chg (qtr)
Prices
Median Price $580K $622K -7% $500K 16%
Average Price $684K $610K 12% $568K 20%
Median PPSF $725 $672 8% $706 3%
Average PPSF $659 $504 31% $583 13%
Median Price by Bedroom
Studio NA $460K NA $552K NA
1 Bedroom $581K $660K -12% $475K 22%
2 Bedroom $822K $735K 12% $762K 8%
3+ Bedroom $859K $819K 5% $849K 1%
Townhouse 2Q16 2Q15 % Chg (yr) 1Q16 % Chg (qtr)
Single-Family
Median Price $1.250M $1.563M -20% $1.450M -14%
Average Price $1.486M $1.701M -13% $1.445M 3%
Multi-Family
Median Price $1.250M $1.085M 15% $1.375M -9%
Average Price $1.284M $1.094M 17% $1.456M -12%
The Corcoran Group I p 23
Average condo price was up 12% to $684,000
Co-op median and average price had
the largest year-over-year increase in
Brooklyn. Versus First Quarter 2016,
prices also displayed the greatest
gains. Both one and two bedroom
residences had price gains compared
to last quarter and last year.
Condo average price was 12% above
last year’s figure and was the second
highest in eight years. Average price
per square foot grew 31% to $659
per square foot and also reached
its second highest figure in eight
years. Median price was 7% below
last year’s record high figure of
$622,000. The median price of two
and three+ bedrooms both rose
versus last quarter and last year.
The average single-family townhouse
in this neighborhood sold for
$1,486,000 this quarter, equal to last
quarter’s figure, but 13% below last
year’s unusually high average.

404 Caton Avenue I WEB# 3682912 on corcoran.com
70Sales
-15%
73 Days on Market
+41%
$475K Median Price
+14%
$575Average PPSF
+7%Annual Change
Kensington,Windsor Terrace, Ditmas Park, Flatbush & Prospect Park SouthMedian price rose 14% versus last year and average price per square foot increased 7% relative to the same period. Price gains were driven by the co-op market.
211Inventory
-6%

2Q 2016BROOKLYN CORCORAN REPORT
Sales activity shrank by double-digits
relative to last quarter and last year.
Sales were driven lower by a steep
drop in co-op sales. Overall inventory
was 6% lower compared to Second
Quarter 2015. Average days on
market, at 73 days, increased 41%
compared to last year, the largest
annual change in Brooklyn.
Co-op sales median price rose by
14% over last year and remained
level with last quarter. At $545 per
square foot, median price per square
foot was 11% higher than Second
Quarter 2015. The median price of
studio apartments displayed the
largest year-over-year gain out of all
bedroom types.
Kensington, Windsor Terrace, Ditmas Park, Flatbush & Prospect Park South
2Q16 2Q15 % Chg (yr) 1Q16 % Chg (qtr)
Overview
Sales 70 82 -15% 85 -18%
Average Days on Market 73 52 41% 61 19%
Inventory 211 224 -6% 218 -3%
Co-op 2Q16 2Q15 % Chg (yr) 1Q16 % Chg (qtr)
Prices
Median Price $450K $395K 14% $449K 0%
Average Price $460K $420K 10% $466K -1%
Median PPSF $545 $490 11% $513 6%
Average PPSF $553 $513 8% $520 6%
Median Price by Bedroom
Studio $275K $233K 18% $298K -8%
1 Bedroom $424K $404K 5% $425K 0%
2 Bedroom $559K $600K -7% $525K 6%
3+ Bedroom $553K $608K -9% $763K -28%
Condo 2Q16 2Q15 % Chg (yr) 1Q16 % Chg (qtr)
Prices
Median Price $580K $627K -7% $730K -21%
Average Price $577K $616K -6% $687K -16%
Median PPSF $673 $655 3% $751 -10%
Average PPSF $602 $581 4% $674 -11%
Median Price by Bedroom
Studio NA NA NA NA NA
1 Bedroom $325K NA NA $543K -40%
2 Bedroom $615K $650K -5% $850K -28%
3+ Bedroom $699K $675K 4% $1.270M -45%
Townhouse 2Q16 2Q15 % Chg (yr) 1Q16 % Chg (qtr)
Single-Family
Median Price $1.827M $1.410M 30% $1.652M 11%
Average Price $1.808M $1.395M 30% $1.652M 9%
Multi-Family
Median Price $1.027M $1.428M -28% $1.145M -10%
Average Price $1.032M $1.348M -23% $975K 6%
The Corcoran Group I p 25
Average co-op price increased 16% to
$450,000
Median and average condo price
were both lower year-over-year. The
lack of sales of larger residences
likely skewed overall condo prices
lower. Versus Second Quarter 2015,
the two bedroom median price
dipped 5%.
Buyers paid an average of
$1,808,000 for a single-family
townhouse this quarter, 30% more
than a year ago due to high sale
prices just south of Prospect Park.
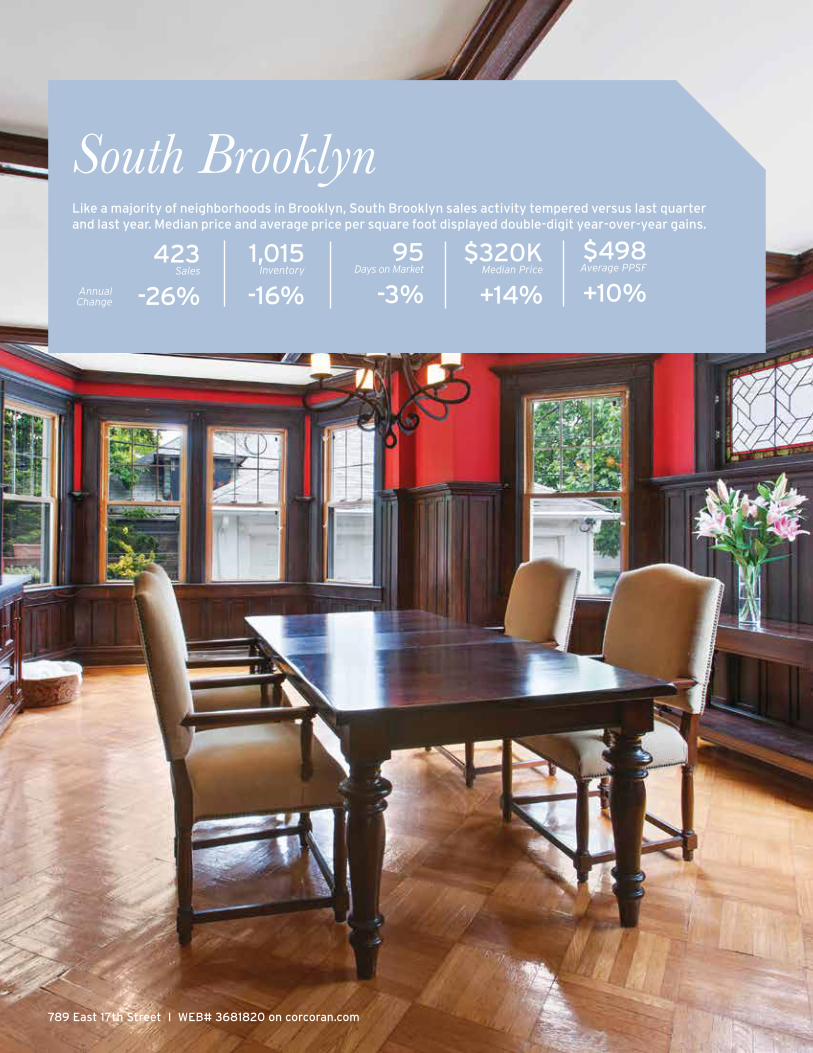
789 East 17th Street I WEB# 3681820 on corcoran.com
South Brooklyn423
Sales
-26%
95 Days on Market
-3%
$320K Median Price
+14%
$498 Average PPSF
+10%Annual Change
Like a majority of neighborhoods in Brooklyn, South Brooklyn sales activity tempered versus last quarter and last year. Median price and average price per square foot displayed double-digit year-over-year gains.
1,015Inventory
-16%

2Q 2016BROOKLYN CORCORAN REPORT
South Brooklyn sales activity was
lower compared to both last quarter
and last year. Available listings also
declined, likely driving sales figures
lower. Listings lingered the longest
compared to other areas of the
borough at 95 days on market.
South Brooklyn
2Q16 2Q15 % Chg (yr) 1Q16 % Chg (qtr)
Overview
Sales 423 573 -26% 472 -10%
Average Days on Market 95 98 -3% 82 16%
Inventory 1,015 1,210 -16% 1,157 -12%
Co-op 2Q16 2Q15 % Chg (yr) 1Q16 % Chg (qtr)
Prices
Median Price $260K $220K 18% $238K 9%
Average Price $282K $246K 15% $261K 8%
Median PPSF $395 $296 33% $367 8%
Average PPSF $417 $328 27% $401 4%
Median Price by Bedroom
Studio $142K $150K -5% $150K -5%
1 Bedroom $241K $209K 15% $250K -4%
2 Bedroom $365K $354K 3% $349K 5%
3+ Bedroom $575K $608K -5% $625K -8%
Condo 2Q16 2Q15 % Chg (yr) 1Q16 % Chg (qtr)
Prices
Median Price $540K $473K 14% $550K -2%
Average Price $569K $510K 12% $552K 3%
Median PPSF $496 $483 3% $530 -6%
Average PPSF $522 $477 9% $497 5%
Median Price by Bedroom
Studio NA $128K NA $410K NA
1 Bedroom $319K $466K -32% $355K -10%
2 Bedroom $703K NA NA $650K 8%
3+ Bedroom NA $531K NA $725K NA
Townhouse 2Q16 2Q15 % Chg (yr) 1Q16 % Chg (qtr)
Single-Family
Median Price $1.265M $879K 44% $895K 41%
Average Price $1.429M $950K 50% $892K 60%
Multi-Family
Median Price $852K $953K -11% $803K 6%
Average Price $1.034M $1.095M -6% $888K 17%
The Corcoran Group I p 27
However, days on market was slightly
lower than the same time last year.
Co-op median price rose by 18%, and
average price by 15% relative to last
year. Both average and median price
per square foot increased significantly
versus Second Quarter 2015. One
bedroom co-ops saw the most
significant price growth, with median
prices rising by 15% to $241,000.
However, the figure was 4% lower
than First Quarter 2016.
Condo prices reached record highs
this quarter. Median price grew 14%
year-over-year to $540,000 while
average price leapt 12% to $569,000.
Fueling the price gains were new
development sales scattered in
various neighborhoods of South
Brooklyn, including Sheepshead Bay
and Coney Island.
Single-family townhouses sold for a
median price of $1,429,000 during
Second Quarter 2016, rising 44%
relative to last year. The average sale
price of 2- to 4-family townhouses
dipped 6% year-over-year but was
17% above last quarter’s figure.
Days on market decreased 3% versus last year

2Q 2016BROOKLYN CORCORAN REPORT
Methodology
Metrics Closed Sales figures for the current
quarter are based on known closings
recorded at the time the report is
prepared and projected through the end
of the quarter taking into account typical
seasonality and public
reporting timing.
Contracts Signed figures for the current
quarter are based on reported signed
contracts at the time the report is
prepared and projected through the end
of the quarter taking into account typical
seasonality.
Days on market averages how long a
unit takes to sell and is calculated by
subtracting contract date from list date.
Units on the market longer than three
years and shorter than one day are
considered outliers and removed from
the data to prevent significant skewing.
New developments are excluded because
many available, unsold units are held off
the market for long periods of time.
Average Price per Square Foot is the
average price divided by the average
square footage. In prior Corcoran Reports
this was calculated as an average of all
prices per square foot, which gives a
number less skewed by high price sales
and more similar to a median price per
square foot. The two metrics are now
separated to give more insight to market
dynamics.
Median Price and Price per Square Foot
are the middle or midpoint price where
half of sales fall below and half fall above
this number.
Inventory is a count of all currently
listed units and is measured two weeks
before the end of the quarter. It does not
include unsold yet unlisted units in new
developments (“shadow” inventory).
Source – Sales counts and figures in this report are based on publicly reported closed sales information via The Automated
City Register Information System (ACRIS) and compiled using PropertyShark, an independent research firm, as well as
from Corcoran’s proprietary listings database.
Real estate agents affiliated with The Corcoran Group are independent contractors and are not employees of The Corcoran Group. The Corcoran Group is a licensed real estate broker located at 660 Madison Ave, NY, NY 10065. All material presented herein is intended for information purposes only and has been compiled from sources deemed reliable. Though information is believed to be correct, it is presented subject to errors, omissions, changes or withdrawal notice
The Corcoran Group I p 28
Months of Supply is an estimate of how
long it would take to sell all currently listed
units based on the average closed sales
per month over the last twelve months.
Six to nine months is considered supply-
demand equilibrium.
Previous Quarter statistics for
sales and prices are revised in the
subsequent report once data is
available for the full quarter period.
Average unit sales per square foot (SF):
Above $2,500 SF $2,000 - $2,500 SF $1,500 - $2,000 SF $1,250 - $1,500 SF $1,000 - $1,250 SF $750 - $1,000 SF $500 - $750 SF Below $500 SF No SF Available
Number of unit sales per building:
Above 20 Units 10 to 20 Units 3 to 9 Units 1 to 2 Units