Brenda Meery Lori Jordan Kate Dirga - asd5.org 4 PDF .pdfBrenda Meery Lori Jordan Kate Dirga ......
45
Writing Equations Of Lines Brenda Meery Lori Jordan Kate Dirga Say Thanks to the Authors Click http://www.ck12.org/saythanks (No sign in required)
Transcript of Brenda Meery Lori Jordan Kate Dirga - asd5.org 4 PDF .pdfBrenda Meery Lori Jordan Kate Dirga ......
Writing Equations Of Lines
Brenda MeeryLori JordanKate Dirga
Say Thanks to the AuthorsClick http://www.ck12.org/saythanks
(No sign in required)
To access a customizable version of this book, as well as otherinteractive content, visit www.ck12.org
CK-12 Foundation is a non-profit organization with a mission toreduce the cost of textbook materials for the K-12 market bothin the U.S. and worldwide. Using an open-content, web-basedcollaborative model termed the FlexBook®, CK-12 intends topioneer the generation and distribution of high-quality educationalcontent that will serve both as core text as well as provide anadaptive environment for learning, powered through the FlexBookPlatform®.
Copyright © 2014 CK-12 Foundation, www.ck12.org
The names “CK-12” and “CK12” and associated logos and theterms “FlexBook®” and “FlexBook Platform®” (collectively“CK-12 Marks”) are trademarks and service marks of CK-12Foundation and are protected by federal, state, and internationallaws.
Any form of reproduction of this book in any format or medium,in whole or in sections must include the referral attribution linkhttp://www.ck12.org/saythanks (placed in a visible location) inaddition to the following terms.
Except as otherwise noted, all CK-12 Content (including CK-12Curriculum Material) is made available to Users in accordancewith the Creative Commons Attribution-Non-Commercial 3.0Unported (CC BY-NC 3.0) License (http://creativecommons.org/licenses/by-nc/3.0/), as amended and updated by Creative Com-mons from time to time (the “CC License”), which is incorporatedherein by this reference.
Complete terms can be found at http://www.ck12.org/terms.
Printed: October 13, 2014
AUTHORSBrenda MeeryLori JordanKate Dirga
www.ck12.org Chapter 1. Writing Equations Of Lines
CHAPTER 1 Writing Equations Of LinesCHAPTER OUTLINE
1.1 Linear Equations in Slope-Intercept Form1.2 Linear Equations in Point-Slope Form1.3 Linear Equations in Standard Form1.4 Equations of Parallel and Perpendicular Lines1.5 Scatter Plots1.6 Plotting a Scatterplot and Finding the Equation of Best Fit
1
1.1. Linear Equations in Slope-Intercept Form www.ck12.org
1.1 Linear Equations in Slope-Intercept Form
Previously, you learned how to graph solutions to two-variable equations in slope-intercept form. This lesson focuseson how to write an equation for a graphed line. There are two things you will need from the graph to write theequation in slope-intercept form:
1. The y�intercept of the graph2. The slope of the line
Having these two pieces of information will allow you to make the appropriate substitutions in the slope-interceptformula. Recall from the last chapter,
Slope-intercept form: y = (slope)x+(y� intercept) or y = mx+b
Example 1: Write the equation for a line with a slope of 4 and a y�intercept (0, –3).
Solution: Slope-intercept form requires two things: the slope and y�intercept. To write the equation, you substitutethe values into the formula.
y = (slope)x+(y� intercept)y = 4x+(�3)y = 4x�3
You can also use a graphed line to determine the slope and y�intercept.
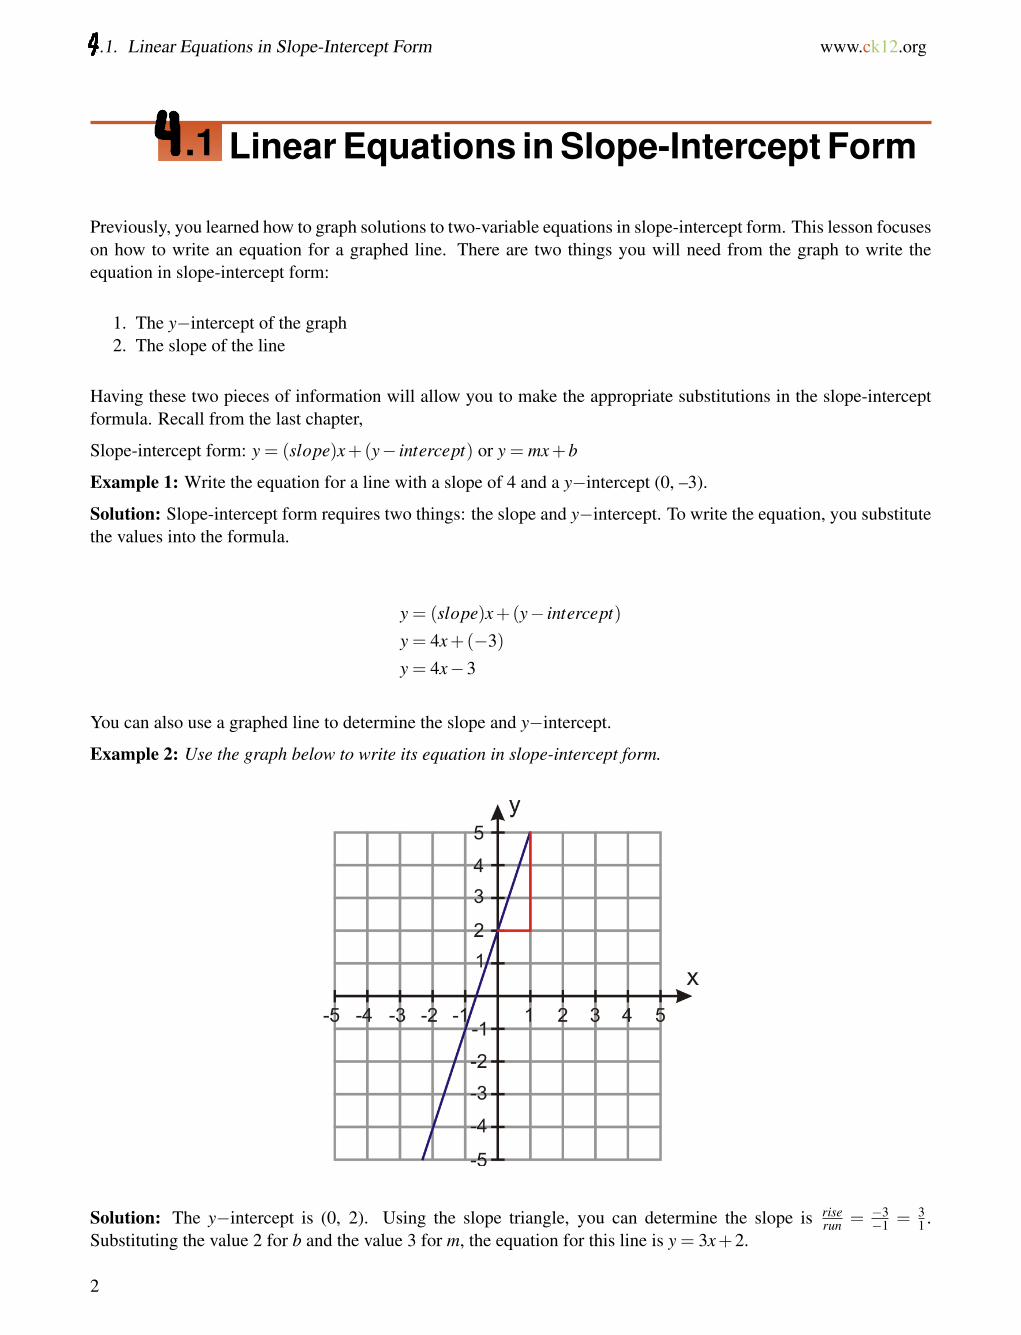
Example 2: Use the graph below to write its equation in slope-intercept form.
Solution: The y�intercept is (0, 2). Using the slope triangle, you can determine the slope is riserun = �3
�1 = 31 .
Substituting the value 2 for b and the value 3 for m, the equation for this line is y = 3x+2.
2
www.ck12.org Chapter 1. Writing Equations Of Lines
Writing an Equation Given the Slope and a Point
Sometimes it may be difficult to determine the y�intercept. Perhaps the y�intercept is rational instead of an integer.Maybe you don’t know the y�intercept. All you have is the slope and an ordered pair. You can use this informationto write the equation in slope-intercept form. To do so, you will need to follow several steps.
Step 1: Begin by writing the formula for slope-intercept form y = mx+b.
Step 2: Substitute the given slope for m.
Step 3: Use the ordered pair you are given (x,y) and substitute these values for the variables x and y in the equation.
Step 4: Solve for b (the y�intercept of the graph).
Step 5: Rewrite the original equation in Step 1, substituting the slope for m and the y�intercept for b.
Example 3: Write an equation for a line with slope of 4 that contains the ordered pair (–1, 5).
Solution:
Step 1: Begin by writing the formula for slope-intercept form.
y = mx+b
Step 2: Substitute the given slope for m.
y = 4x+b
Step 3: Use the ordered pair you are given (–1, 5) and substitute these values for the variables x and y in the equation.
5 = (4)(�1)+b
Step 4: Solve for b (the y�intercept of the graph).
5 =�4+b5+4 =�4+4+b
9 = b
Step 5: Rewrite y = mx+b, substituting the slope for m and the y�intercept for b.
y = 4x+9
Example 4: Write the equation for a line with a slope of –3 containing the point (3, –5).
Solution: Using the five-steps from above:
3
1.1. Linear Equations in Slope-Intercept Form www.ck12.org
y = (slope)x+(y� intercept)y =�3x+b
�5 =�3(3)+b�5 =�9+b
4 = by =�3x+4
Writing an Equation Given Two Points
In many cases, especially real-world situations, you are given neither the slope nor the y�intercept. You might haveonly two points to use to determine the equation of the line.
To find an equation for a line between two points, you need two things:
1. The y�intercept of the graph2. The slope of the line
Previously, you learned how to determine the slope between two points. Let’s repeat the formula here.
The slope between any two points (x1,y1) and (x2,y2) is: slope = y2�y1x2�x1
.
The procedure for determining a line given two points is the same five-step process as writing an equation given theslope and a point.
Example 5: Write the equation for the line containing the points (3, 2) and (–2, 4).
Solution: You need the slope of the line. Find the line’s slope by using the formula. Choose one ordered pair torepresent (x1,y1) and the other ordered pair to represent (x2,y2).
slope =y2 � y1
x2 � x1=
4�2�2�3
=�25
Now use the five-step process to find the equation for this line.
Step 1: Begin by writing the formula for slope-intercept form.
y = mx+b
Step 2: Substitute the given slope for m.
y =�25
x+b
Step 3: Use one of the ordered pairs you are given (–2, 4) and substitute these values for the variables x and y in theequation.
4 =
✓�25
◆(�2)+b
4
www.ck12.org Chapter 1. Writing Equations Of Lines
Step 4: Solve for b (the y�intercept of the graph).
4 =45+b
4� 45=
45� 4
5+b
165
= b
Step 5: Rewrite y = mx+b, substituting the slope for m and the y�intercept for b.
y =�25
x+165
Example 6: Write the equation for a line containing the points (–4, 1) and (–2, 3).
Solution:
1. Start with the slope–intercept form of the line y = mx+b.2. Find the slope of the line: m = y2�y1
x2�x1= 3�1
�2�(�4) =22 = 1.
3. Substitute the value of slope for m : y = (1)x+b.4. Substitute the coordinate (–2, 3) into the equation for the variables x and y : 3 =�2+b ) b = 5.5. Rewrite the equation, substituting the slope for m and the y�intercept for b: y = x+5.
Writing a Function in Slope-Intercept Form
Remember that a linear function has the form f (x) = mx+ b. Here f (x) represents the y values of the equation orthe graph. So y = f (x) and they are often used interchangeably. Using the functional notation in an equation oftenprovides you with more information.
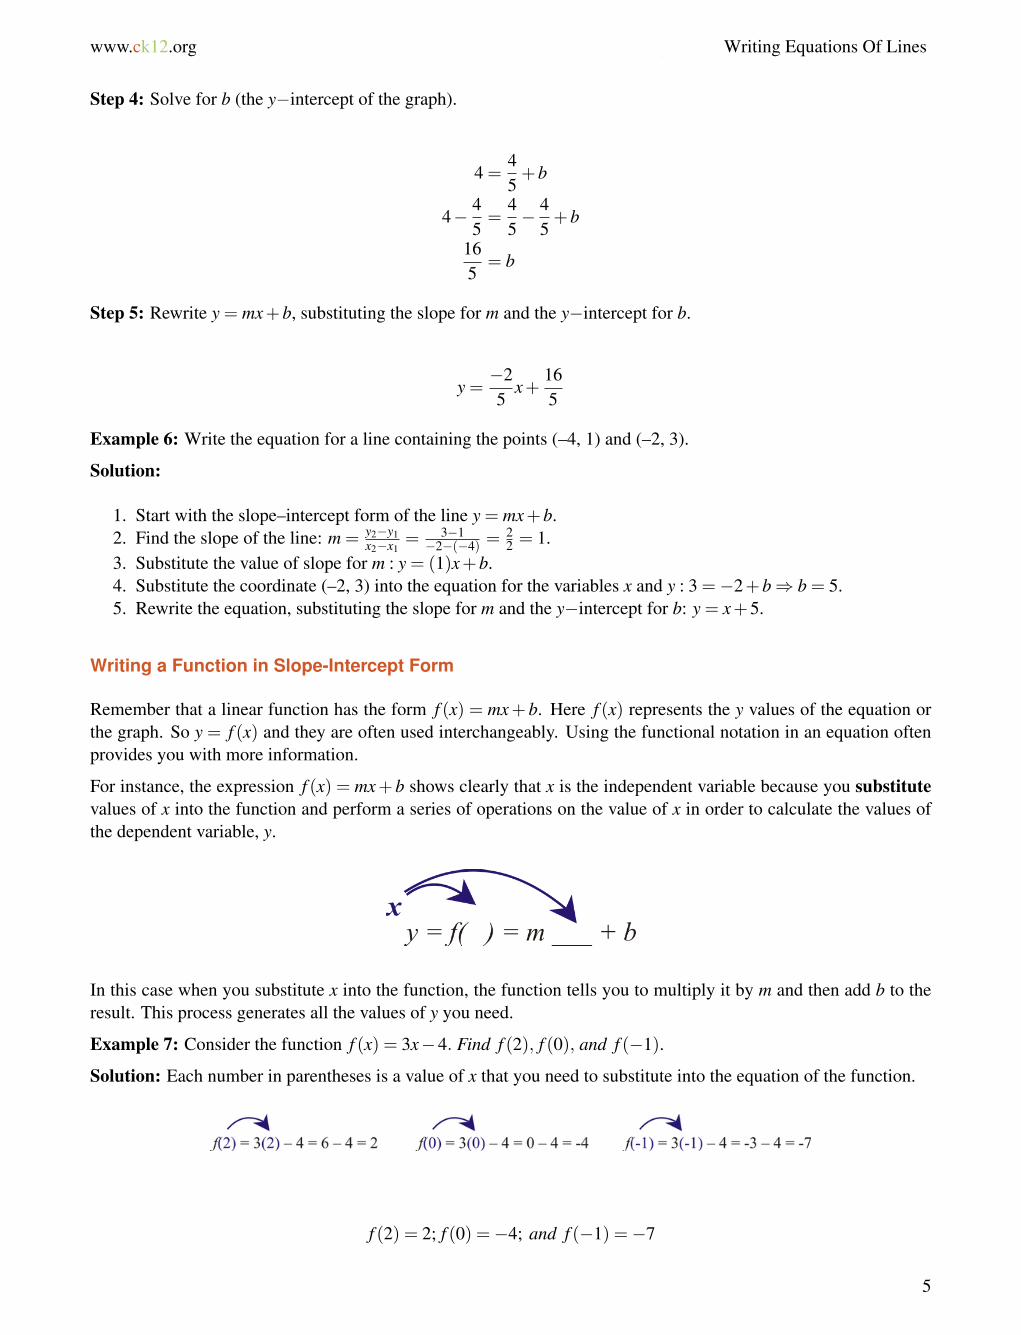
For instance, the expression f (x) = mx+b shows clearly that x is the independent variable because you substitutevalues of x into the function and perform a series of operations on the value of x in order to calculate the values ofthe dependent variable, y.
In this case when you substitute x into the function, the function tells you to multiply it by m and then add b to theresult. This process generates all the values of y you need.
Example 7: Consider the function f (x) = 3x�4. Find f (2), f (0), and f (�1).
Solution: Each number in parentheses is a value of x that you need to substitute into the equation of the function.
f (2) = 2; f (0) =�4; and f (�1) =�7
5
1.1. Linear Equations in Slope-Intercept Form www.ck12.org
Function notation tells you much more than the value of the independent variable. It also indicates a point on thegraph. For example, in the above example, f (�1) = �7. This means the ordered pair (–1, –7) is a solution tof (x) = 3x�4 and appears on the graphed line. You can use this information to write an equation for a function.
Example 8: Write an equation for a line with m = 3.5 and f (�2) = 1.
Solution: You know the slope and you know a point on the graph (–2, 1). Using the methods presented in thislesson, write the equation for the line.
Begin with slope-intercept form.
y = mx+bSubstitute the value for the slope. y = 3.5x+b
Use the ordered pair to solve for b. 1 = 3.5(�2)+bb = 8
Rewrite the equation. y = 3.5x+8or f (x) = 3.5x+8
Solve Real-World Problems Using Linear Models
Let’s apply the methods we just learned to a few application problems that can be modeled using a linear relationship.
Example 9: Nadia has $200 in her savings account. She gets a job that pays $7.50 per hour and she deposits allher earnings in her savings account. Write the equation describing this problem in slope–intercept form. How manyhours would Nadia need to work to have $500 in her account?
Solution: Begin by defining the variables:
y = amount of money in Nadia’s savings account
x = number of hours
The problem gives the y�intercept and the slope of the equation.
We are told that Nadia has $200 in her savings account, so b = 200.
We are told that Nadia has a job that pays $7.50 per hour, so m = 7.50.
By substituting these values in slope–intercept form y = mx+b, we obtain y = 7.5x+200.
To answer the question, substitute $500 for the value of y and solve.
500 = 7.5x+200 ) 7.5x = 300 ) x = 40
Nadia must work 40 hours if she is to have $500 in her account.
6
www.ck12.org Chapter 1. Writing Equations Of Lines
Example 10: A stalk of bamboo of the family Phyllostachys nigra grows at steady rate of 12 inches per day andachieves its full height of 720 inches in 60 days. Write the equation describing this problem in slope–intercept form.How tall is the bamboo 12 days after it started growing?
Solution: Define the variables.
y = the height of the bamboo plant in inches
x = number of days
The problem gives the slope of the equation and a point on the line.
The bamboo grows at a rate of 12 inches per day, so m = 12.
We are told that the plant grows to 720 inches in 60 days, so we have the point (60, 720).
Start with the slope-intercept form of the line. y = mx+bSubstitute 12 for the slope. y = 12x+b
Substitute the point (60,720). 720 = 12(60)+b ) b = 0Substitute the value of b back into the equation. y = 12x
To answer the question, substitute the value x = 12 to obtain y = 12(12) = 144 inches.
Homework Problems
Sample explanations for some of the practice exercises below are available by viewing the following video. Notethat there is not always a match between the number of the practice exercise in the video and the number of thepractice exercise listed in the following exercise set. However, the practice exercise is the same in both.
CK-12 Basic Algebra: Linear Equations in Slope-Intercept Form (14:58)
MEDIA
Click image to the left for use the URL below.
URL: http://www.ck12.org/flx/render/embeddedobject/83
1. What is the formula for slope-intercept form? What do the variables m and b represent?2. What are the five steps needed to determine the equation of a line given the slope and a point on the graph (not
the y�intercept)?3. What is the first step in finding the equation of a line given two points?
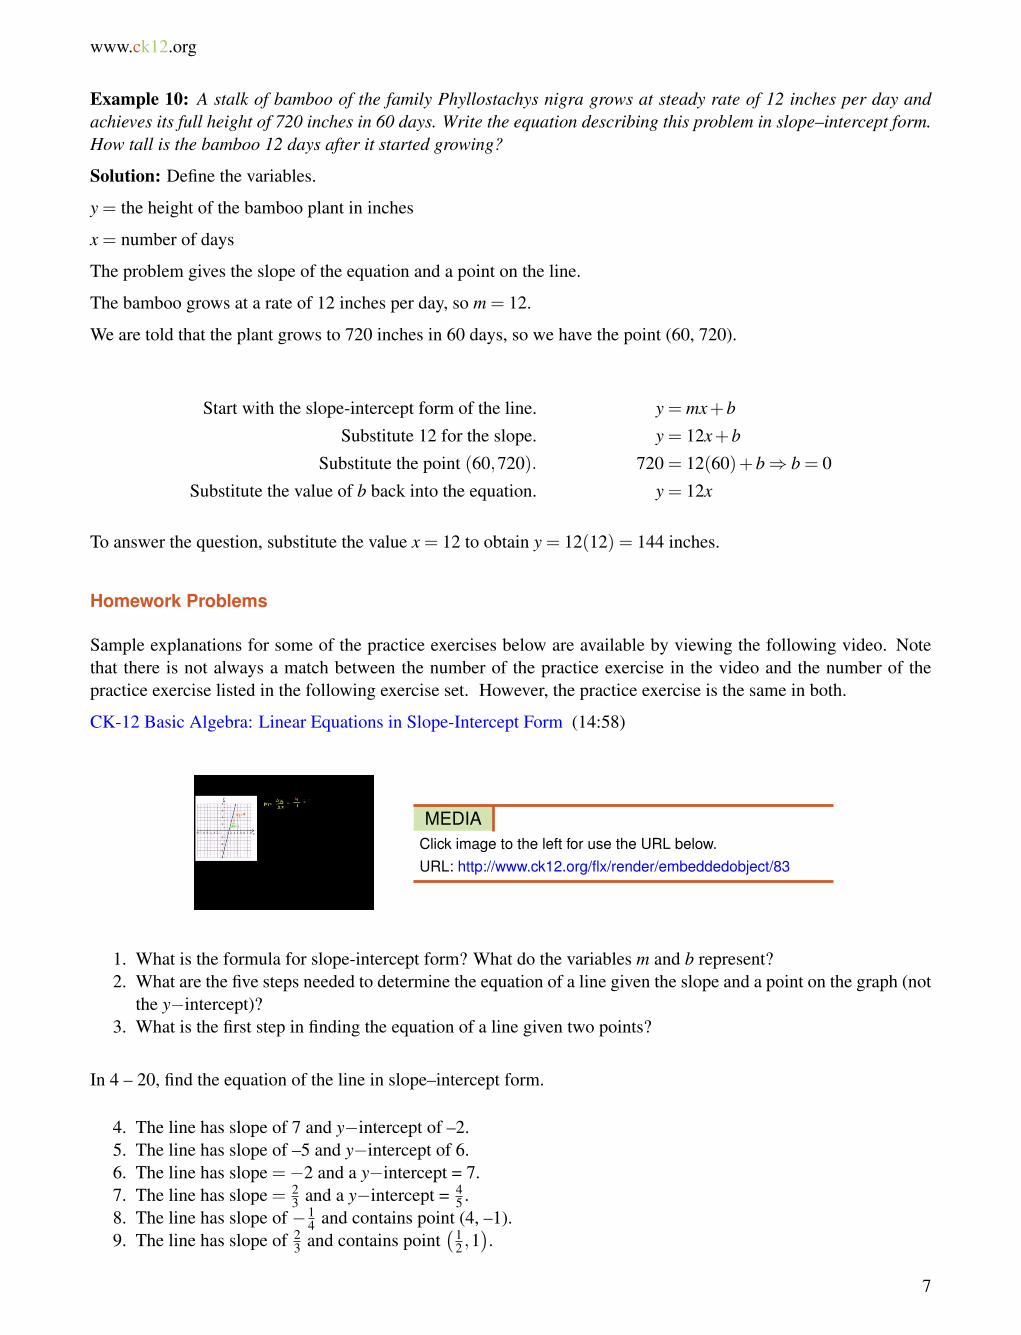
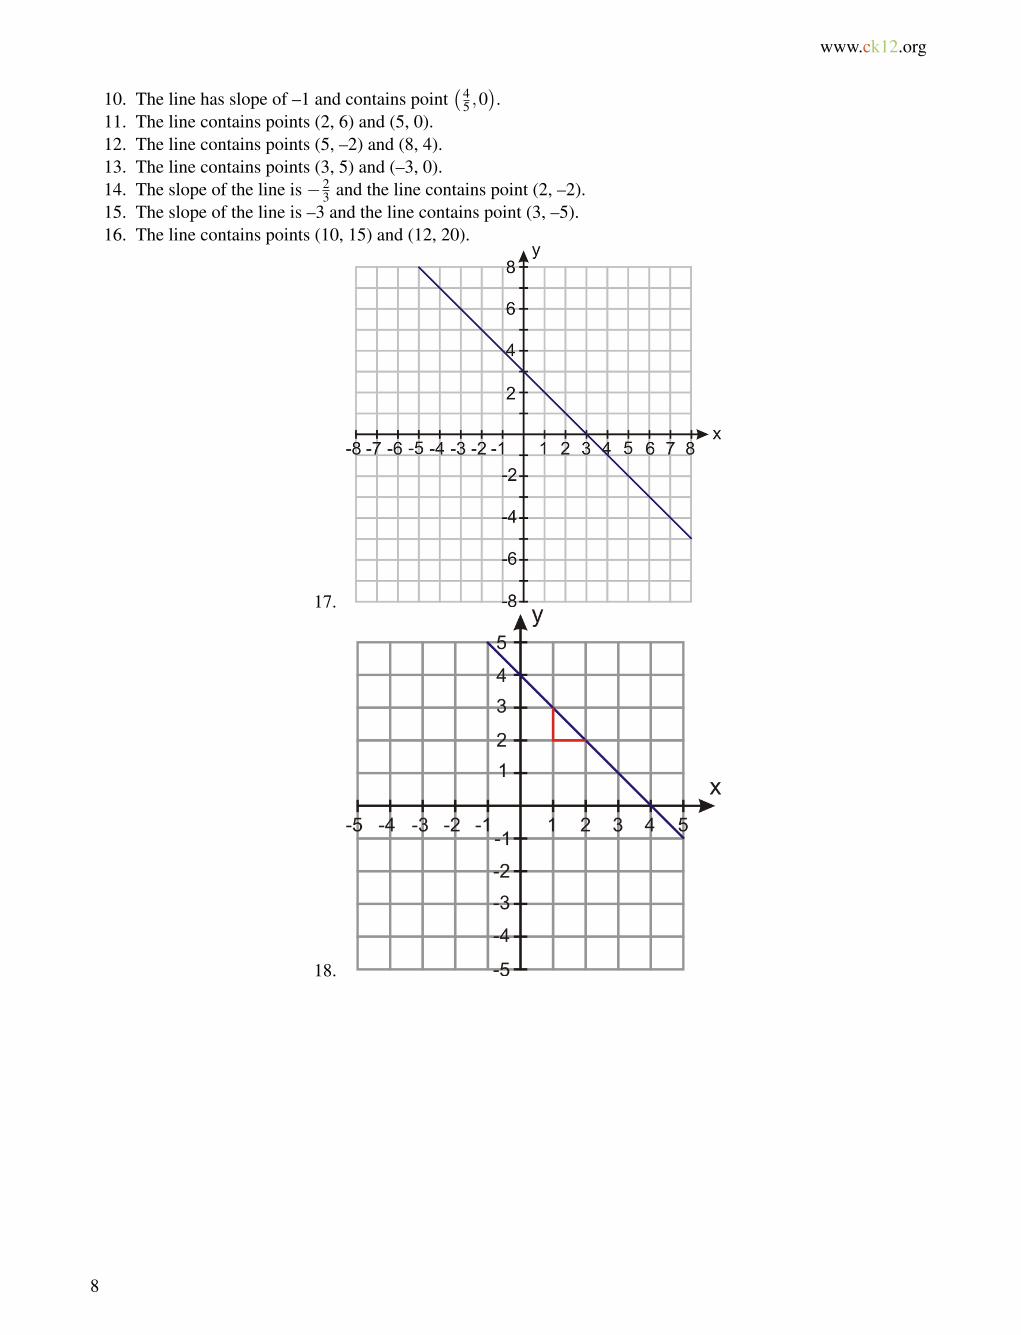
In 4 – 20, find the equation of the line in slope–intercept form.
4. The line has slope of 7 and y�intercept of –2.5. The line has slope of –5 and y�intercept of 6.6. The line has slope =�2 and a y�intercept = 7.7. The line has slope = 2
3 and a y�intercept = 45 .
8. The line has slope of � 14 and contains point (4, –1).
9. The line has slope of 23 and contains point
�12 ,1
�.
7
1.1. Linear Equations in Slope-Intercept Form www.ck12.org
10. The line has slope of –1 and contains point�4
5 ,0�.
11. The line contains points (2, 6) and (5, 0).12. The line contains points (5, –2) and (8, 4).13. The line contains points (3, 5) and (–3, 0).14. The slope of the line is � 2
3 and the line contains point (2, –2).15. The slope of the line is –3 and the line contains point (3, –5).16. The line contains points (10, 15) and (12, 20).
17.
18.
8
www.ck12.org Chapter 1. Writing Equations Of Lines
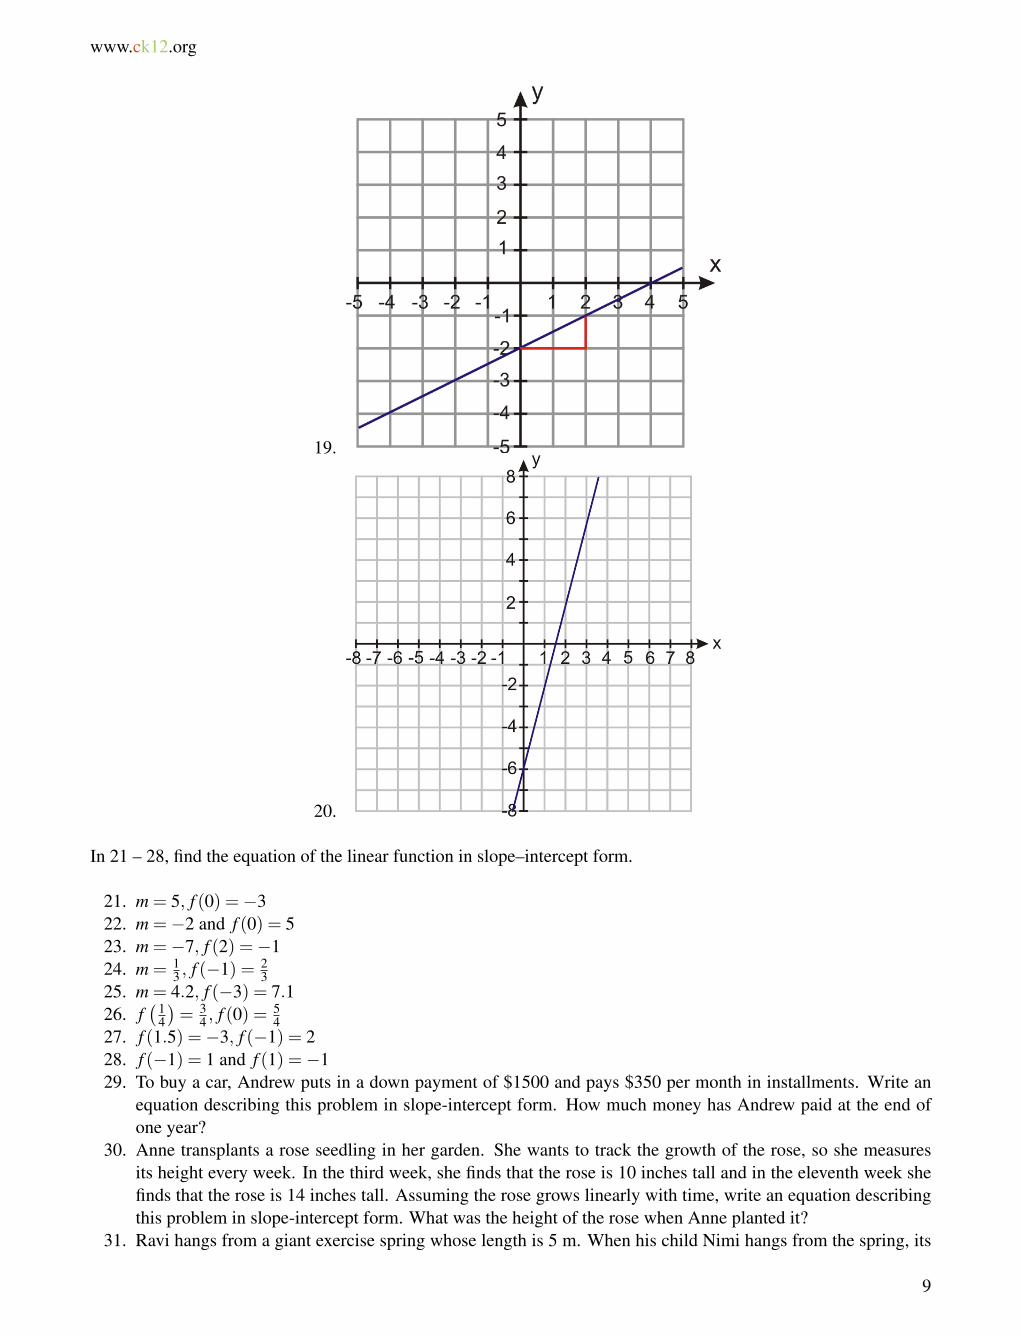
19.
20.
In 21 – 28, find the equation of the linear function in slope–intercept form.
21. m = 5, f (0) =�322. m =�2 and f (0) = 523. m =�7, f (2) =�124. m = 1
3 , f (�1) = 23
25. m = 4.2, f (�3) = 7.126. f
�14�= 3
4 , f (0) = 54
27. f (1.5) =�3, f (�1) = 228. f (�1) = 1 and f (1) =�129. To buy a car, Andrew puts in a down payment of $1500 and pays $350 per month in installments. Write an
equation describing this problem in slope-intercept form. How much money has Andrew paid at the end ofone year?
30. Anne transplants a rose seedling in her garden. She wants to track the growth of the rose, so she measuresits height every week. In the third week, she finds that the rose is 10 inches tall and in the eleventh week shefinds that the rose is 14 inches tall. Assuming the rose grows linearly with time, write an equation describingthis problem in slope-intercept form. What was the height of the rose when Anne planted it?
31. Ravi hangs from a giant exercise spring whose length is 5 m. When his child Nimi hangs from the spring, its
9
1.1. Linear Equations in Slope-Intercept Form www.ck12.org
length is 2 m. Ravi weighs 160 lbs. and Nimi weighs 40 lbs. Write the equation for this problem in slope-intercept form. What should we expect the length of the spring to be when his wife Amardeep, who weighs140 lbs., hangs from it?
32. Petra is testing a bungee cord. She ties one end of the bungee cord to the top of a bridge and to the other endshe ties different weights. She then measures how far the bungee stretches. She finds that for a weight of 100lbs., the bungee stretches to 265 feet and for a weight of 120 lbs., the bungee stretches to 275 feet. Physics tellsus that in a certain range of values, including the ones given here, the amount of stretch is a linear function ofthe weight. Write the equation describing this problem in slope–intercept form. What should we expect thestretched length of the cord to be for a weight of 150 lbs?
Mixed Review
33. Translate into an algebraic sentence: One-third of a number is seven less than that number.34. The perimeter of a square is 67 cm. What is the length of its side?35. A hockey team played 17 games. They won two more than they lost. They lost 3 more than they tied. How
many games did they win, lose, and tie?36. Simplify (30�4+4÷2)÷(21÷3)
2 .37. What is the opposite of 16.76?38. Graph the following on a number line:
�6, 11
3 ,�5.65, 217
.39. Simplify: [(�4+4.5)+(18� |�13|)+(�3.3)].
10
www.ck12.org Chapter 1. Writing Equations Of Lines
1.2 Linear Equations in Point-Slope Form
Equations can be written in many forms. The last lesson taught you how to write equations of lines in slope-interceptform. This lesson will provide a second way to write an equation of a line: point-slope form.
The line between any two points (x1,y1) and (x2,y2) can be written in the following equation: y� y1 = m(x� x1).
To write an equation in point-slope form, you need two things:
1. The slope of the line2. A point on the line
Example 1: Write an equation for a line containing (9, 3) and (4, 5).
Solution: Begin by finding the slope.
slope =y2 � y1
x2 � x1=
5�34�9
=�25
Instead of trying to find b (the y�intercept), you will use the point-slope formula.
y� y1 = m(x� x1)
y�3 =�25(x�9)
It doesn’t matter which point you use.
You could also use the other ordered pair to write the equation:
y�5 =�25(x�4)
These equations may look completely different, but by solving each one for y, you can compare the slope-interceptform to check your answer.
y�3 =�25(x�9)) y =
�25
x+185+3
y =�25
x+335
y�5 =�25(x�4)
y =�25
x+85+5
y =�25
x+335
This process is called rewriting in slope-intercept form.
11
1.2. Linear Equations in Point-Slope Form www.ck12.org
Example 2: Rewrite y�5 = 3(x�2) in slope-intercept form.
Solution: Use the Distributive Property to simplify the right side of the equation.
y�5 = 3x�6
Solve for y:
y�5+5 = 3x�6+5y = 3x�1
Graphing Equations Using Point-Slope Form
If you are given an equation in point-slope form, it is not necessary to re-write it in slope-intercept form in order tograph it. The point-slope form of the equation gives you enough information so you can graph the line.
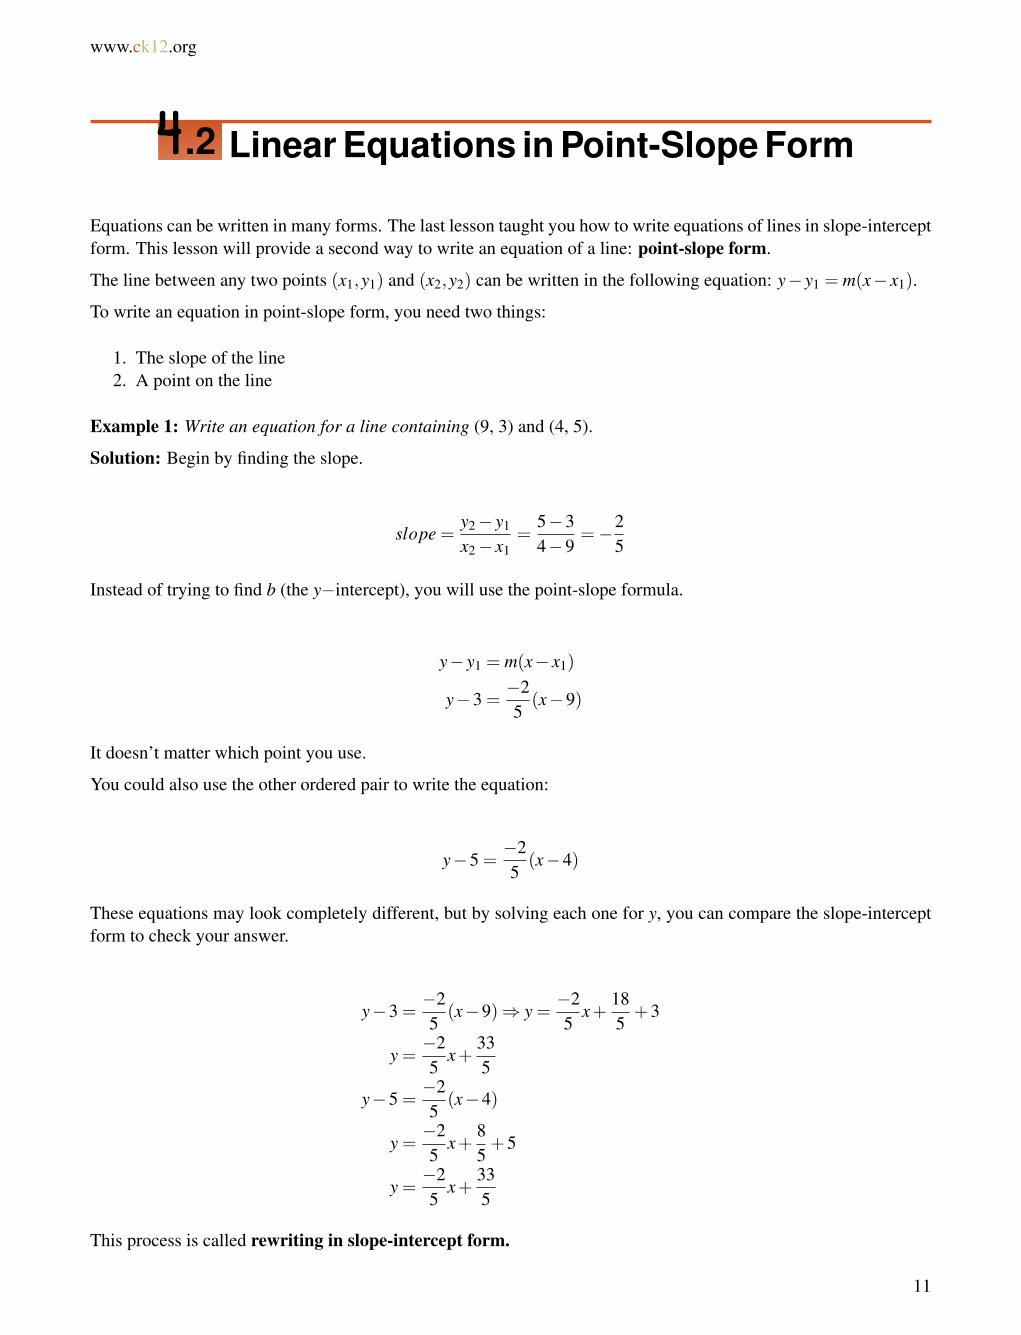
Example 3: Make a graph of the line given by the equation y�2 = 23(x+2)
Solution: Begin by rewriting the equation to make point-slope form: y� 2 = 23(x� (�2)) Now we see that point
(–2, 2) is on the line and that the slope = 23 . First plot point (–2, 2) on the graph.
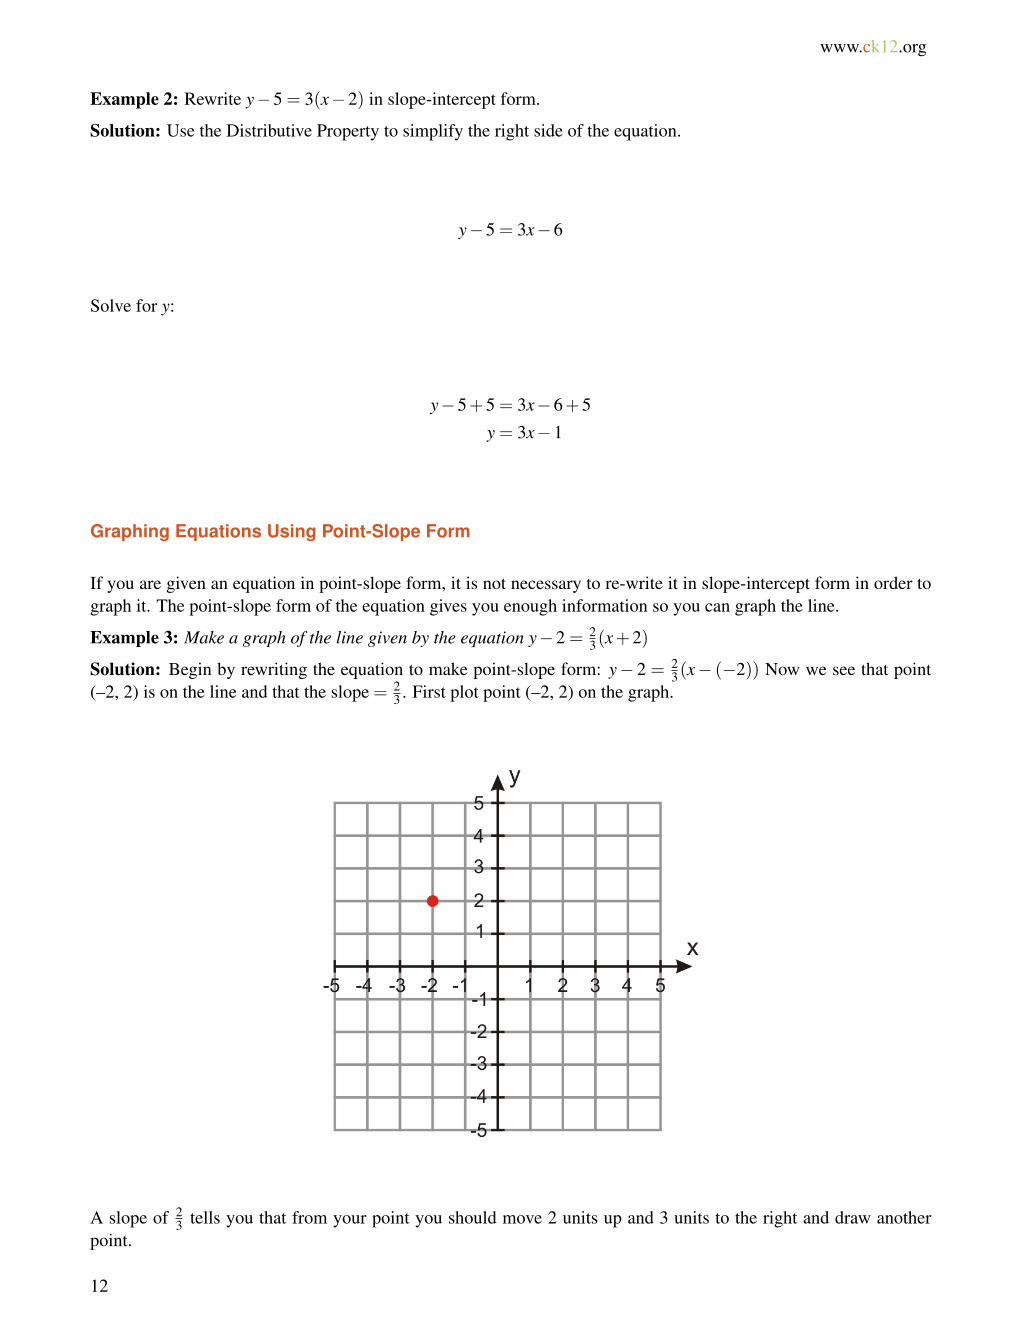
A slope of 23 tells you that from your point you should move 2 units up and 3 units to the right and draw another
point.
12
www.ck12.org Chapter 1. Writing Equations Of Lines
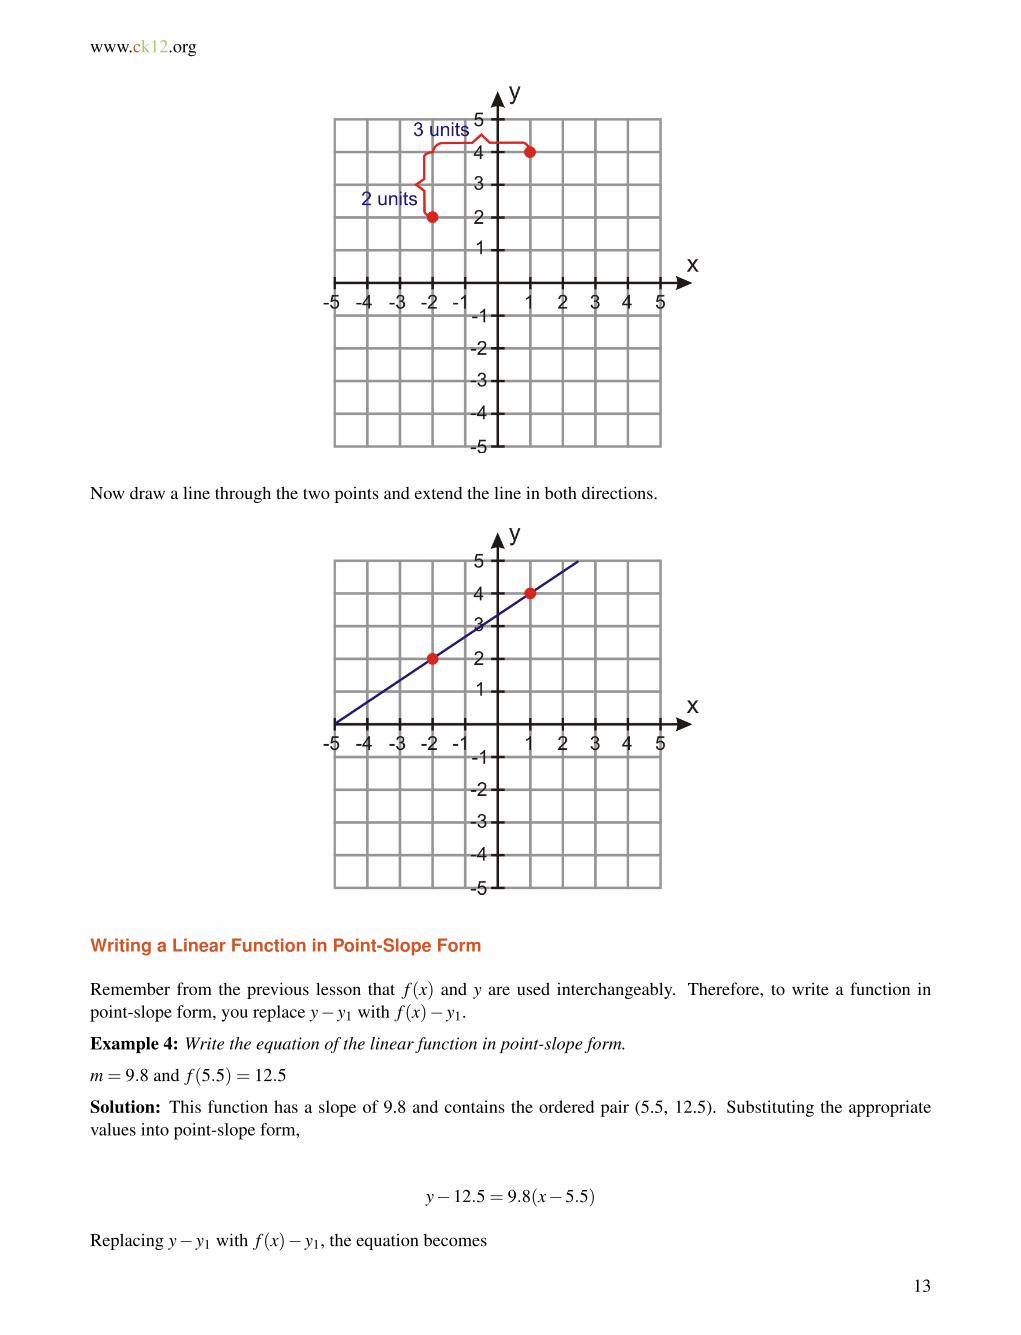
Now draw a line through the two points and extend the line in both directions.
Writing a Linear Function in Point-Slope Form
Remember from the previous lesson that f (x) and y are used interchangeably. Therefore, to write a function inpoint-slope form, you replace y� y1 with f (x)� y1.
Example 4: Write the equation of the linear function in point-slope form.
m = 9.8 and f (5.5) = 12.5
Solution: This function has a slope of 9.8 and contains the ordered pair (5.5, 12.5). Substituting the appropriatevalues into point-slope form,
y�12.5 = 9.8(x�5.5)
Replacing y� y1 with f (x)� y1, the equation becomes
13
1.2. Linear Equations in Point-Slope Form www.ck12.org
f (x)�12.5 = 9.8(x�5.5)f (x)�12.5 = 9.8x�53.9
f (x) = 9.8x�41.4
Solving Situations Involving Point-Slope Form
Let’s solve some word problems where point-slope form is needed.
Example 5: Marciel rented a moving truck for the day. Marciel remembers only that the rental truck companycharges $40 per day and some amount of cents per mile. Marciel drives 46 miles and the final amount of the bill(before tax) is $63. What is the amount per mile the truck rental company charges? Write an equation in point-slopeform that describes this situation. How much would it cost to rent this truck if Marciel drove 220 miles?
Solution: Define the variables: x = distance in miles; y = cost of the rental truck in dollars. There are two orderedpairs: (0, 40) and (46, 63).
Step 1: Begin by finding the slope: 63�4046�0 = 23
46 = 12 .
Step 2: Substitute the slope for m and one of the coordinates for (x1,y1).
y�40 =12(x�0)
To find out how much will it cost to rent the truck for 220 miles, substitute 220 for the variable x.
y�40 =12(220�0)
y�40 = 0.5(220)) y = $150
Homework Problems
Sample explanations for some of the practice exercises below are available by viewing the following video. Notethat there is not always a match between the number of the practice exercise in the video and the number of thepractice exercise listed in the following exercise set. However, the practice exercise is the same in both.
CK-12 Basic Algebra: Linear Equations in Point-Slope Form (9:38)
14
www.ck12.org Chapter 1. Writing Equations Of Lines
MEDIA
Click image to the left for use the URL below.
URL: http://www.ck12.org/flx/render/embeddedobject/84
1. What is the equation for a line containing the points (x1,y1) and (x2,y2) in point-slope form?2. In what ways is it easier to use point-slope form rather than slope-intercept form?
Write the equation for the line in point-slope form.
3. Slope is 13 ; y�intercept –4.
4. Slope is � 110 and contains (10, 2).
5. Slope is –75 and contains point (0, 125).6. Slope is 10 and contains point (8, –2).7. The line contains points (–2, 3) and (–1, –2).8. The line contains the points (0, 0) and (1, 2).9. The line contains points (10, 12) and (5, 25).
10. The line contains points (2, 3) and (0, 3).11. The line has slope 3
5 and y�intercept –3.12. The line has slope –6 and y�intercept 0.5.13. The line contains the points (–4, –2) and (8, 12).
Write each equation in slope-intercept form.
14. y�2 = 3(x�1)15. y+4 = �2
3 (x+6)16. 0 = x+517. y = 1
4(x�24)
In 18 – 25, write the equation of the linear function in point-slope form.
18. m =�15 and f (0) = 7
19. m =�12 and f (�2) = 520. f (�7) = 5 and f (3) =�421. f (6) = 0 and f (0) = 622. m = 3 and f (2) =�923. m =�9
5 and f (0) = 3224. m = 25 and f (0) = 25025. f (32) = 0 and f (77) = 2526. Nadia is placing different weights on a spring and measuring the length of the stretched spring. She finds that
for a 100 gram weight the length of the stretched spring is 20 cm and for a 300 gram weight the length ofthe stretched spring is 25 cm. Write an equation in point-slope form that describes this situation. What is theunstretched length of the spring?
27. Andrew is a submarine commander. He decides to surface his submarine to periscope depth. It takes him20 minutes to get from a depth of 400 feet to a depth of 50 feet. Write an equation in point-slope form thatdescribes this situation. What was the submarine’s depth five minutes after it started surfacing?
28. Anne got a job selling window shades. She receives a monthly base salary and a $6 commission for eachwindow shade she sells. At the end of the month, she adds up her sales and she figures out that she sold 200window shades and made $2500. Write an equation in point-slope form that describes this situation. Howmuch is Anne’s monthly base salary?
15
1.2. Linear Equations in Point-Slope Form www.ck12.org
Mixed Review
29. Translate into a sentence: 4( j+2) = 400.30. Evaluate 0.45 ·0.25�24÷ 1
4 .31. The formula to convert Fahrenheit to Celsius is C(F) = F�32
1.8 . What is the Celsius equivalent to 35�F?32. Find the rate of change: The diver dove 120 meters in 3 minutes.33. What percent of 87.4 is 106?34. Find the percent of change: The original price was $25.00. The new price is $40.63.35. Solve for w : 606 = 0.045(w�4000)+0.07w.
16
www.ck12.org Chapter 1. Writing Equations Of Lines
1.3 Linear Equations in Standard Form
As the past few lessons of this chapter have shown, there are several ways to write a linear equation. This lessonintroduces another method: standard form. You have already seen examples of standard form equations in aprevious lesson. For example, here are some equations written in standard form.
0.75(h)+1.25(b) = 307x�3y = 212x+3y =�6
The standard form of a linear equation has the form Ax+By =C, where A,B, and C are integers and A and B arenot both zero.
Equations written in standard form do not have fractional coefficients and the variables are written on the same sideof the equation.
You should be able to rewrite any of the formulas into an alternate form.
Slope� intercept f orm $ Standard f ormSlope� intercept f orm $ Point � slope f orm
Point � slope f orm $ Standard f orm
Example 1: Rewrite 34(h)+
54(b) = 30 in standard form.
Solution: According to the definition of standard form, the coefficients must be integers. So we need to clear thefractions of the denominator using multiplication.
34
h+54
b = 30 ! 4✓
34
h+54
b◆= 4(30)
3h+5b = 120
This equation is now in standard form, A = 3,B = 5, and C = 120.
Example 2: Rewrite y�5 = 3(x�2) in standard form.
Solution: Use the Distributive Property to simplify the right side of the equation
y�5 = 3x�6
Rewrite this equation so the variables x and y are on the same side of the equation.
y�5+6 = 3x�6+6y� y+1 = 3x� y
1 = 3x� y, where A=3, B=-1, and C=1.
17
1.3. Linear Equations in Standard Form www.ck12.org
Example 3: Rewrite 5x�7 = y in standard form.
Solution: Rewrite this equation so the variables x and y are on the same side of the equation.
5x�7+7 = y+75x� y = y� y+75x� y = 7, where A=5, B=-1, and C=7.
Finding Slope and
Slope-intercept form and point-slope form of a linear equation both contain the slope of the equation explicitly, butthe standard form does not. Since the slope is such an important feature of a line, it is useful to figure out how youwould find the slope if you were given the equation of the line in standard form.
Begin with standard form: Ax+By =C.
If you rewrite this equation in slope-intercept form, it becomes:
Ax�Ax+By =C�AxByB
=�Ax+C
B
y =�AB
x+CB
When you compare this form to slope-intercept form, y = mx+ b, you can see that the slope of a standard formequation is �A
B and the y�intercept is CB .
The standard form of a linear equation Ax+By =C has the following:
slope = �AB and y� intercept = C
B .
Example 4: Find the slope and y�intercept of 2x�3y =�8.
Solution: Using the definition of standard form, A = 2,B =�3, and C =�8.
slope =�AB
=�2�3
! 23
y� intercept =CB=
�8�3
! 83
The slope is 23 and the y�intercept is 8
3 .
Applying Standard Form to Real-World Situations
Example 5: Nimitha buys fruit at her local farmer’s market. This Saturday, oranges cost $2 per pound and cherriescost $3 per pound. She has $12 to spend on fruit. Write an equation in standard form that describes this situation.If she buys 4 pounds of oranges, how many pounds of cherries can she buy?
18
www.ck12.org Chapter 1. Writing Equations Of Lines
Solution: Define the variables: x = pounds of oranges and y = pounds of cherries.
The equation that describes this situation is: 2x+3y = 12
If she buys 4 pounds of oranges, we substitute x = 4 in the equation and solve for y.
2(4)+3y = 12 ) 3y = 12�8 ) 3y = 4 ) y = 43 . Nimitha can buy 1 1
3 pounds of cherries.
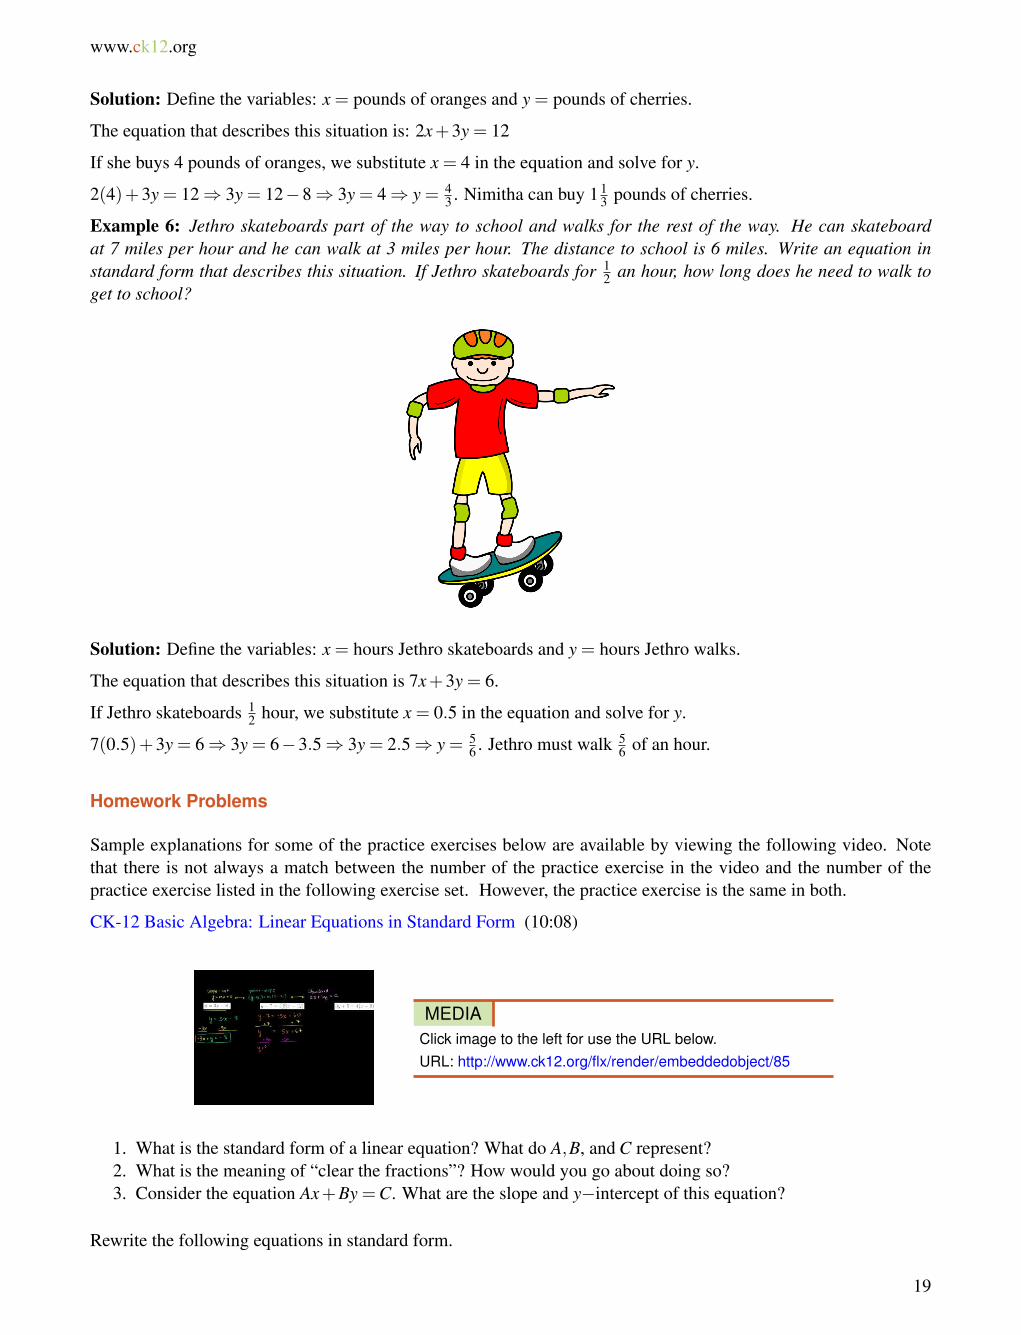
Example 6: Jethro skateboards part of the way to school and walks for the rest of the way. He can skateboardat 7 miles per hour and he can walk at 3 miles per hour. The distance to school is 6 miles. Write an equation instandard form that describes this situation. If Jethro skateboards for 1
2 an hour, how long does he need to walk toget to school?
Solution: Define the variables: x = hours Jethro skateboards and y = hours Jethro walks.
The equation that describes this situation is 7x+3y = 6.
If Jethro skateboards 12 hour, we substitute x = 0.5 in the equation and solve for y.
7(0.5)+3y = 6 ) 3y = 6�3.5 ) 3y = 2.5 ) y = 56 . Jethro must walk 5
6 of an hour.
Homework Problems
Sample explanations for some of the practice exercises below are available by viewing the following video. Notethat there is not always a match between the number of the practice exercise in the video and the number of thepractice exercise listed in the following exercise set. However, the practice exercise is the same in both.
CK-12 Basic Algebra: Linear Equations in Standard Form (10:08)
MEDIA
Click image to the left for use the URL below.
URL: http://www.ck12.org/flx/render/embeddedobject/85
1. What is the standard form of a linear equation? What do A,B, and C represent?2. What is the meaning of “clear the fractions”? How would you go about doing so?3. Consider the equation Ax+By =C. What are the slope and y�intercept of this equation?
Rewrite the following equations in standard form.
19
1.3. Linear Equations in Standard Form www.ck12.org
4. y = 3x�85. y =�x�66. y = 5
3 x�47. 0.30x+0.70y = 158. 5 = 1
6 x� y9. y�7 =�5(x�12)
10. 2y = 6x+911. y = 9
4 x+ 14
12. y+ 35 = 2
3(x�2)13. 3y+5 = 4(x�9)
Find the slope and y�intercept of the following lines.
14. 5x�2y = 1515. 3x+6y = 2516. x�8y = 1217. 3x�7y = 2018. 9x�9y = 419. 6x+ y = 320. x� y = 921. 8x+3y = 1522. 4x+9y = 1
In 23 – 27, write each equation in standard form by first writing it in point-slope form.
23. Slope =�1 through point (–3, 5)24. Slope =� 1
4 through point (4, 0)25. Line through (5, –2) and (–5, 4)26. Line through (–3, –2) and (5, 1)27. Line through (1, –1) and (5, 2)28. The farmer’s market sells tomatoes and corn. Tomatoes are selling for $1.29 per pound and corn is selling
for $3.25 per pound. If you buy 6 pounds of tomatoes, how many pounds of corn can you buy if your totalspending cash is $11.61?
29. The local church is hosting a Friday night fish fry for Lent. They sell a fried fish dinner for $7.50 and a bakedfish dinner for $8.25. The church sold 130 fried fish dinners and took in $2,336.25. How many baked fishdinners were sold?
30. Andrew has two part-time jobs. One pays $6 per hour and the other pays $10 per hour. He wants to make$366 per week. Write an equation in standard form that describes this situation. If he is only allowed to work15 hours per week at the $10 per hour job, how many hours does he need to work per week at his $6 per hourjob in order to achieve his goal?
31. Anne invests money in two accounts. One account returns 5% annual interest and the other returns 7% annualinterest. In order not to incur a tax penalty, she can make no more than $400 in interest per year. Write anequation in standard form that describes this problem. If she invests $5000 in the 5% interest account, howmuch money does she need to invest in the other account?
Mixed Review
32. Write the following equation in slope-intercept form: y�2 = 6(x�3).33. Solve for p : p�2
7 = p+16 .
34. Describe the graph x = 1.5.35. Tell whether (4, –3) is a solution to 5x+3y = 9.
20
www.ck12.org Chapter 1. Writing Equations Of Lines
36. Give the coordinates of a point located in quadrant III.37. Find the slope between (6, 6) and (16, 6).38. Graph the equation y = 5
9 x�7.
21
1.4. Equations of Parallel and Perpendicular Lines www.ck12.org
1.4 Equations of Parallel and PerpendicularLines
In a previous lesson, you learned how to identify parallel lines.
Parallel lines have the same slope.
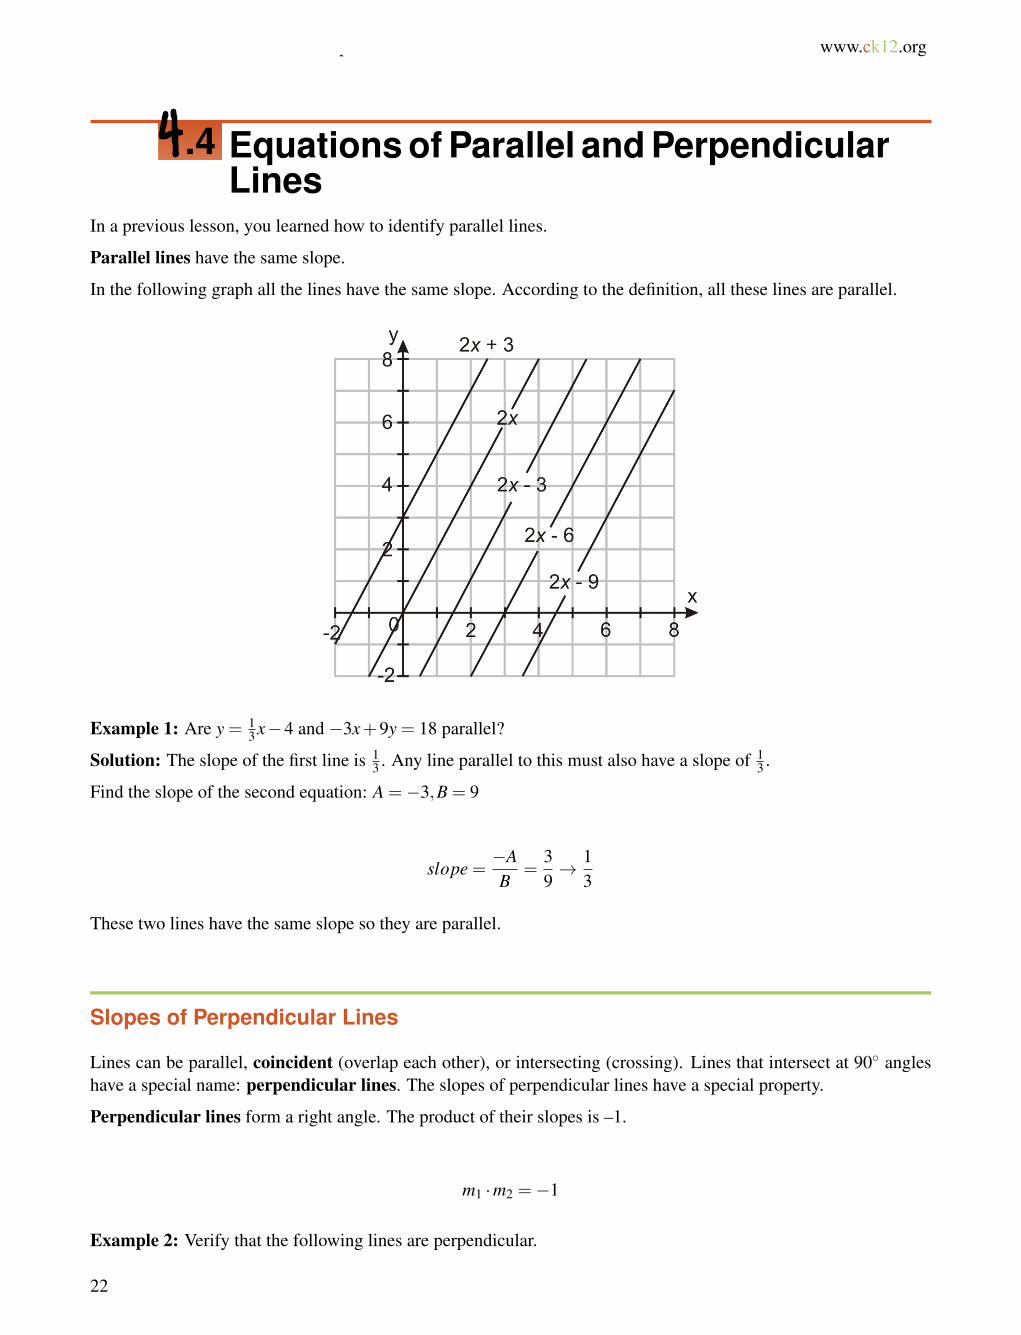
In the following graph all the lines have the same slope. According to the definition, all these lines are parallel.
Example 1: Are y = 13 x�4 and �3x+9y = 18 parallel?
Solution: The slope of the first line is 13 . Any line parallel to this must also have a slope of 1
3 .
Find the slope of the second equation: A =�3,B = 9
slope =�AB
=39! 1
3
These two lines have the same slope so they are parallel.
Slopes of Perpendicular Lines
Lines can be parallel, coincident (overlap each other), or intersecting (crossing). Lines that intersect at 90� angleshave a special name: perpendicular lines. The slopes of perpendicular lines have a special property.
Perpendicular lines form a right angle. The product of their slopes is –1.
m1 ·m2 =�1
Example 2: Verify that the following lines are perpendicular.
22
www.ck12.org Chapter 1. Writing Equations Of Lines
Line a: passes through points (–2, –7) and (1, 5)
Line b: passes through points (4, 1) and (–8, 4)
Solution: Find the slopes of each line.
Line a :5� (�7)1� (�2)
=123
=41
Line b :4�1�8�4
=3
�12=
�14
To verify that the lines are perpendicular, the product of their slopes must equal –1.
41⇥ �1
4=�1
Because the product of their slopes is �1, lines a and b are perpendicular.
Example 3: Determine whether the two lines are parallel, perpendicular, or neither:
Line 1: 2x = y�10; Line 2: y =�2x+5
Solution: Begin by finding the slopes of lines 1 and 2.
2x+10 = y�10+102x+10 = y
The slope of the first line is 2.
y =�2x+5
The slope of the second line is –2.
These slopes are not identical, so these lines are not parallel.
To check if the lines are perpendicular, find the product of the slopes. 2⇥�2 =�4. The product of the slopes is not–1, so the lines are not perpendicular.
Lines 1 and 2 are neither parallel nor perpendicular.
Writing Equations of Parallel Lines
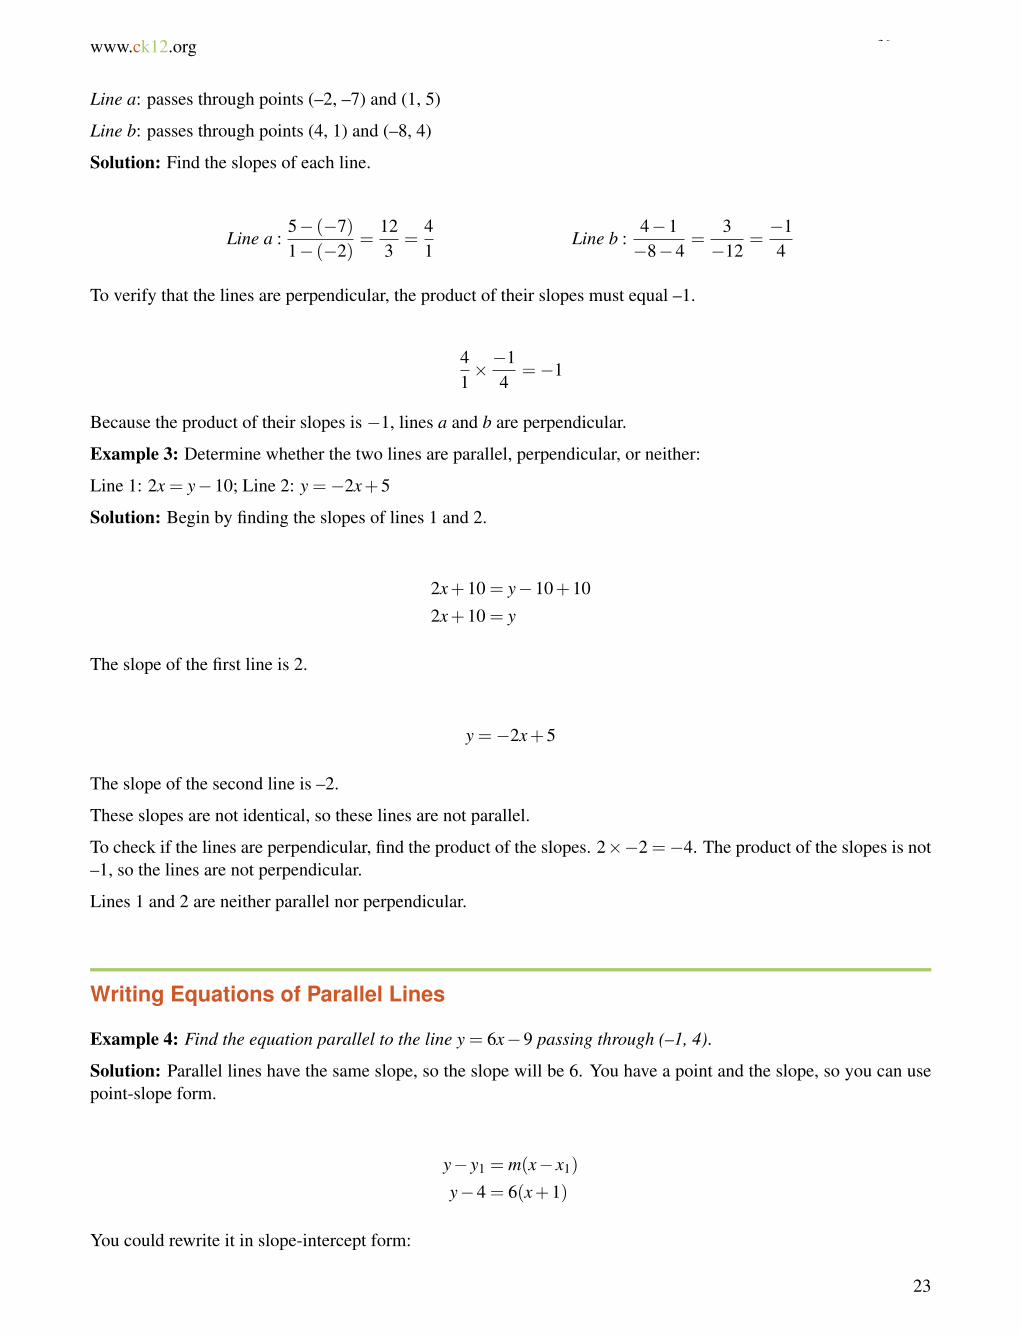
Example 4: Find the equation parallel to the line y = 6x�9 passing through (–1, 4).
Solution: Parallel lines have the same slope, so the slope will be 6. You have a point and the slope, so you can usepoint-slope form.
y� y1 = m(x� x1)
y�4 = 6(x+1)
You could rewrite it in slope-intercept form:
23
1.4. Equations of Parallel and Perpendicular Lines www.ck12.org
y = 6x+6+4y = 6x+10
Writing Equations of Perpendicular Lines
Writing equations of perpendicular lines is slightly more difficult than writing parallel line equations. The reason isbecause you must find the slope of the perpendicular line before you can proceed with writing an equation.
Example: Find the equation perpendicular to the line y =�3x+5 that passes through point (2, 6).
Solution: Begin by finding the slopes of the perpendicular line. Using the perpendicular line definition, m1 ·m2 =�1.The slope of the original line is –3. Substitute that for m1.
�3 ·m2 =�1
Solve for m2, the slope of the perpendicular line.
�3m2
�3=
�1�3
m2 =13
The slope of the line perpendicular to y =�3x+5 is 13 .
You now have the slope and a point. Use point-slope form to write its equation.
y�6 =13(x�2)
You can rewrite this in slope-intercept form: y = 13 x� 2
3 +6.
y =13
x+163
Example 4: Find the equation of the line perpendicular to the line y = 5 and passing through (5, 4).
Solution: The line y = 5 is a horizontal line with slope of zero. The only thing that makes a 90� angle with ahorizontal line is a vertical line. Vertical lines have undefined slopes.
Since the vertical line must go through (5, 4), the equation is x = 5.
Multimedia Link: For more help with writing lines, visit AlgebraLab.
Families of Lines
A straight line has two very important properties, its slope and its y� intercept. The slope tells us how steeply theline rises or falls, and the y�intercept tells us where the line intersects the y�axis. In this section, we will look attwo families of lines.
24
www.ck12.org Chapter 1. Writing Equations Of Lines
A family of lines is a set of lines that have something in common with each other. Straight lines can belong to twotypes of families: where the slope is the same and where the y�intercept is the same.
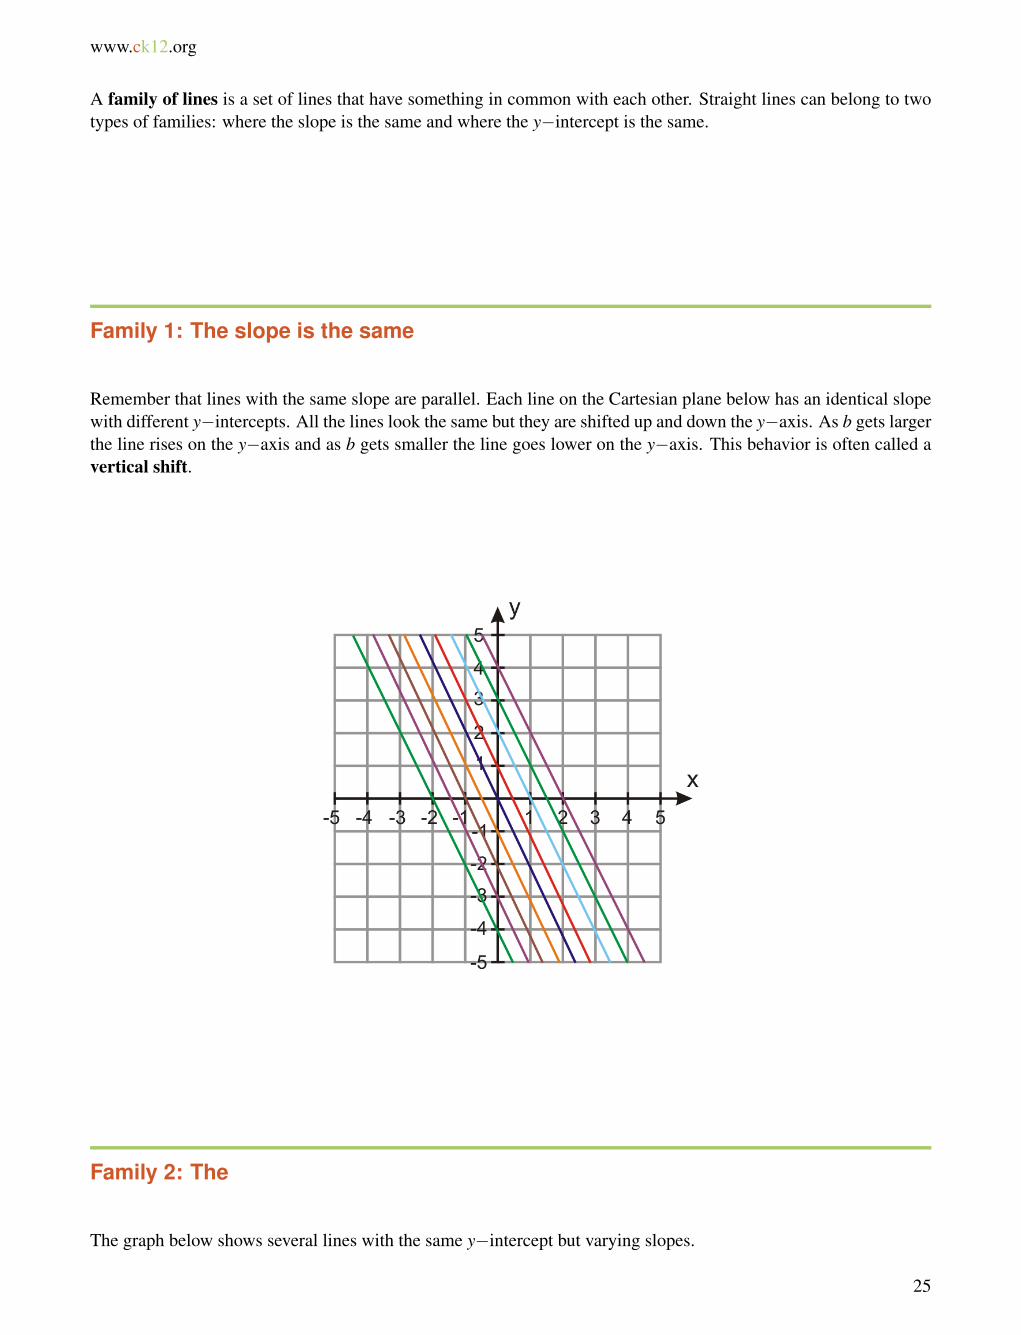
Family 1: The slope is the same
Remember that lines with the same slope are parallel. Each line on the Cartesian plane below has an identical slopewith different y�intercepts. All the lines look the same but they are shifted up and down the y�axis. As b gets largerthe line rises on the y�axis and as b gets smaller the line goes lower on the y�axis. This behavior is often called avertical shift.
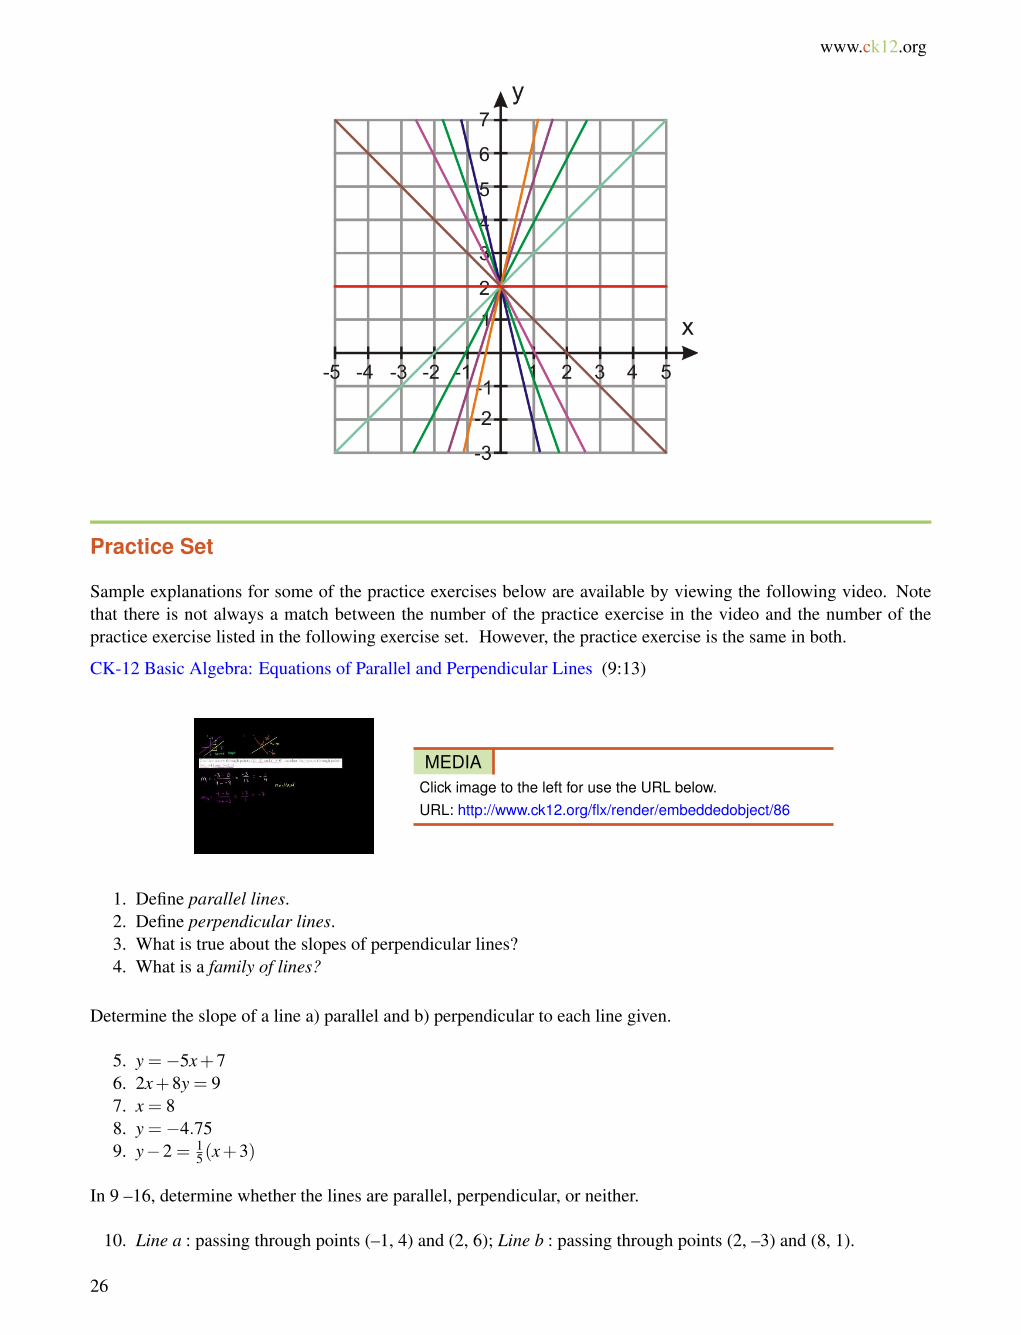
Family 2: The
The graph below shows several lines with the same y�intercept but varying slopes.
25
1.4. Equations of Parallel and Perpendicular Lines www.ck12.org
Practice Set
Sample explanations for some of the practice exercises below are available by viewing the following video. Notethat there is not always a match between the number of the practice exercise in the video and the number of thepractice exercise listed in the following exercise set. However, the practice exercise is the same in both.
CK-12 Basic Algebra: Equations of Parallel and Perpendicular Lines (9:13)
MEDIA
Click image to the left for use the URL below.
URL: http://www.ck12.org/flx/render/embeddedobject/86
1. Define parallel lines.2. Define perpendicular lines.3. What is true about the slopes of perpendicular lines?4. What is a family of lines?
Determine the slope of a line a) parallel and b) perpendicular to each line given.
5. y =�5x+76. 2x+8y = 97. x = 88. y =�4.759. y�2 = 1
5(x+3)
In 9 –16, determine whether the lines are parallel, perpendicular, or neither.
10. Line a : passing through points (–1, 4) and (2, 6); Line b : passing through points (2, –3) and (8, 1).
26
www.ck12.org Chapter 1. Writing Equations Of Lines
11. Line a : passing through points (4, –3) and (–8, 0); Line b : passing through points (–1, –1) and (–2, 6).12. Line a : passing through points (–3, 14) and (1, –2); Line b : passing through points (0, –3) and (–2, 5).13. Line a : passing through points (3, 3) and (–6, –3); Line b : passing through points (2, –8) and (–6, 4).14. Line 1: 4y+ x = 8; Line 2: 12y+3x = 115. Line 1: 5y+3x+1; Line 2: 6y+10x =�316. Line 1: 2y�3x+5 = 0; Line 2: y+6x =�317. Find the equation of the line parallel to 5x�2y = 2 that passes through point (3, –2).18. Find the equation of the line perpendicular to y =� 2
5 x�3 that passes through point (2, 8).19. Find the equation of the line parallel to 7y+2x�10 = 0 that passes through the point (2, 2).20. Find the equation of the line perpendicular to y+5 = 3(x�2) that passes through the point (6, 2).21. Find the equation of the line through (2, –4) perpendicular to y = 2
7 x+3.22. Find the equation of the line through (2, 3) parallel to y = 3
2 x+5.
In 23 –26, write the equation of the family of lines satisfying the given condition.
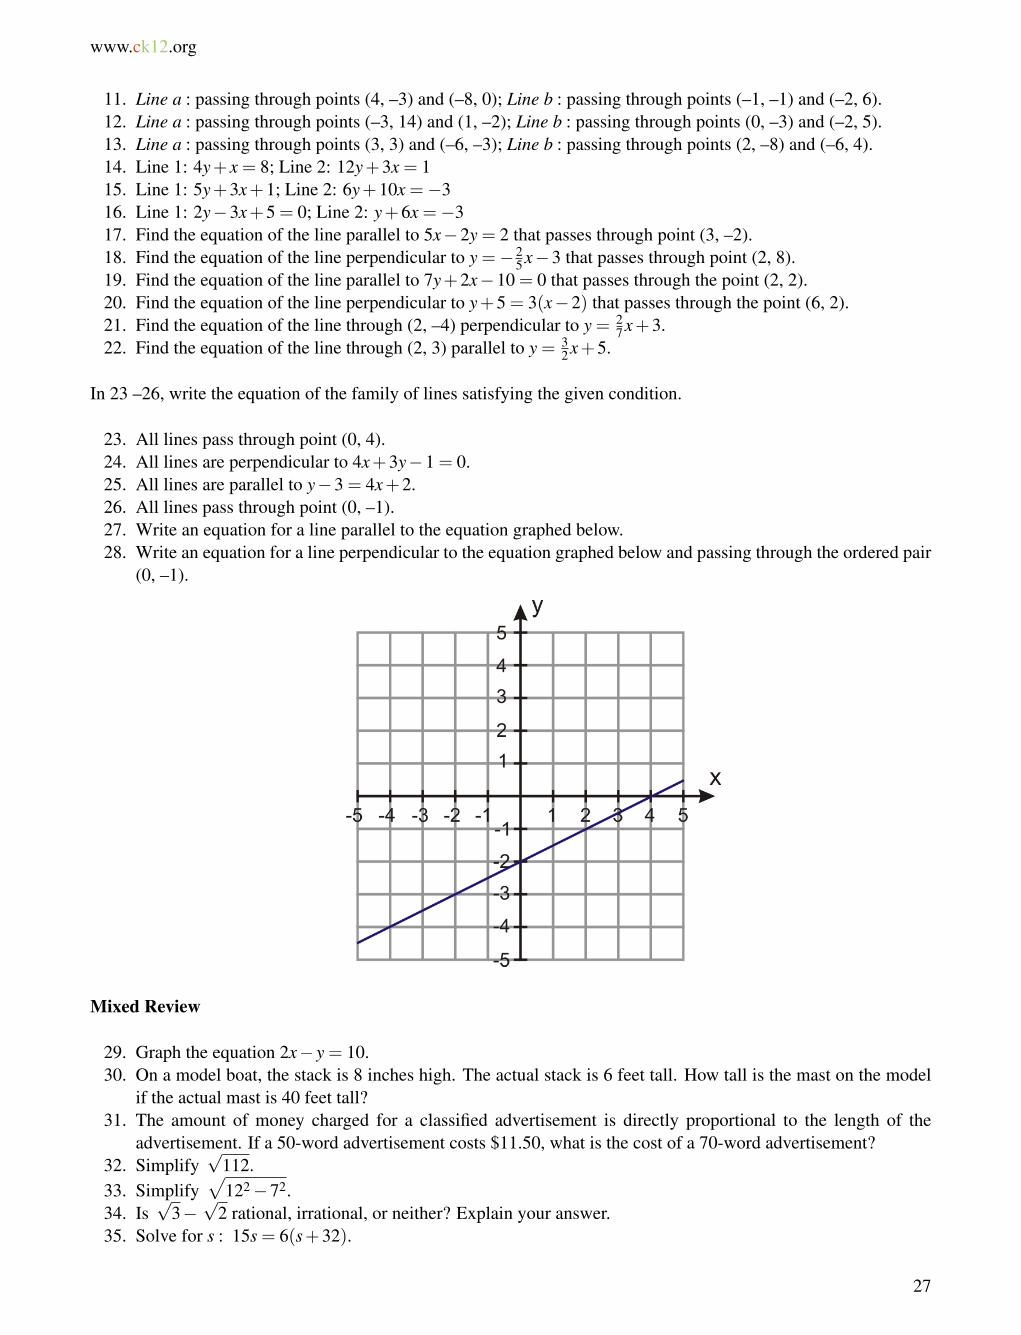
23. All lines pass through point (0, 4).24. All lines are perpendicular to 4x+3y�1 = 0.25. All lines are parallel to y�3 = 4x+2.26. All lines pass through point (0, –1).27. Write an equation for a line parallel to the equation graphed below.28. Write an equation for a line perpendicular to the equation graphed below and passing through the ordered pair
(0, –1).
Mixed Review
29. Graph the equation 2x� y = 10.30. On a model boat, the stack is 8 inches high. The actual stack is 6 feet tall. How tall is the mast on the model
if the actual mast is 40 feet tall?31. The amount of money charged for a classified advertisement is directly proportional to the length of the
advertisement. If a 50-word advertisement costs $11.50, what is the cost of a 70-word advertisement?32. Simplify
p112.
33. Simplifyp
122 �72.34. Is
p3�
p2 rational, irrational, or neither? Explain your answer.
35. Solve for s : 15s = 6(s+32).
27
1.4. Equations of Parallel and Perpendicular Lines www.ck12.org
Quick Quiz
1. Write an equation for a line with slope of 43 and y�intercept (0, 8).
2. Write an equation for a line containing (6, 1) and (7, –3).
3. A plumber charges $75 for a 2.5-hour job and $168.75 for a 5-hour job.
Assuming the situation is linear, write an equation to represent the plumber’s charge and use it to predict the cost ofa 1-hour job.
4. Rewrite in standard form: y = 65 x+11.
5. Sasha took tickets for the softball game. Student tickets were $3.00 and adult tickets were $3.75. She collected atotal of $337.50 and sold 75 student tickets. How many adult tickets were sold?
28

www.ck12.org Chapter 1. Writing Equations Of Lines
1.5 Scatter Plots
Here you’ll learn how to represent data that has no definite pattern as a scatter plot and how to draw a line of best fitfor the data. You’ll also learn how to make predictions using a line of best fit.
You’ve been exercising every week and when you go for your next doctor’s visit the doctor says that the reading foryour resting heart rate has changed. You start taking your own resting heart rate once a week on Mondays and relateit to the numbers of hours per week you’ve been exercising. How would you represent this data? Do you expect tosee a correlation between the number of hours you exercise per week and your resting heart rate? How would youknow if there is a correlation?
Watch This
First watch this video to learn about scatter plots.
MEDIA
Click image to the left for use the URL below.
URL: http://www.ck12.org/flx/render/embeddedobject/52704
CK-12 Foundation: Chapter7ScatterPlotsA
Then watch this video to see some examples.
MEDIA
Click image to the left for use the URL below.
URL: http://www.ck12.org/flx/render/embeddedobject/52705
CK-12 Foundation: Chapter7ScatterPlotsB
Watch this video for more help.
MEDIA
Click image to the left for use the URL below.
URL: http://www.ck12.org/flx/render/embeddedobject/1395
Khan Academy Correlation and Causality
29
1.5. Scatter Plots www.ck12.org
Guidance
Often, when real-world data is plotted, the result is a linear pattern. The general direction of the data can be seen,but the data points do not all fall on a line. This type of graph is called a scatter plot. A scatter plot is often used toinvestigate whether or not there is a relationship or connection between 2 sets of data. The data is plotted on a graphsuch that one quantity is plotted on the x-axis and one quantity is plotted on the y-axis. The quantity that is plottedon the x-axis is the independent variable, and the quantity that is plotted on the y-axis is the dependent variable. If arelationship does exist between the 2 sets of data, it will be easy to see if the data is plotted on a scatter plot.
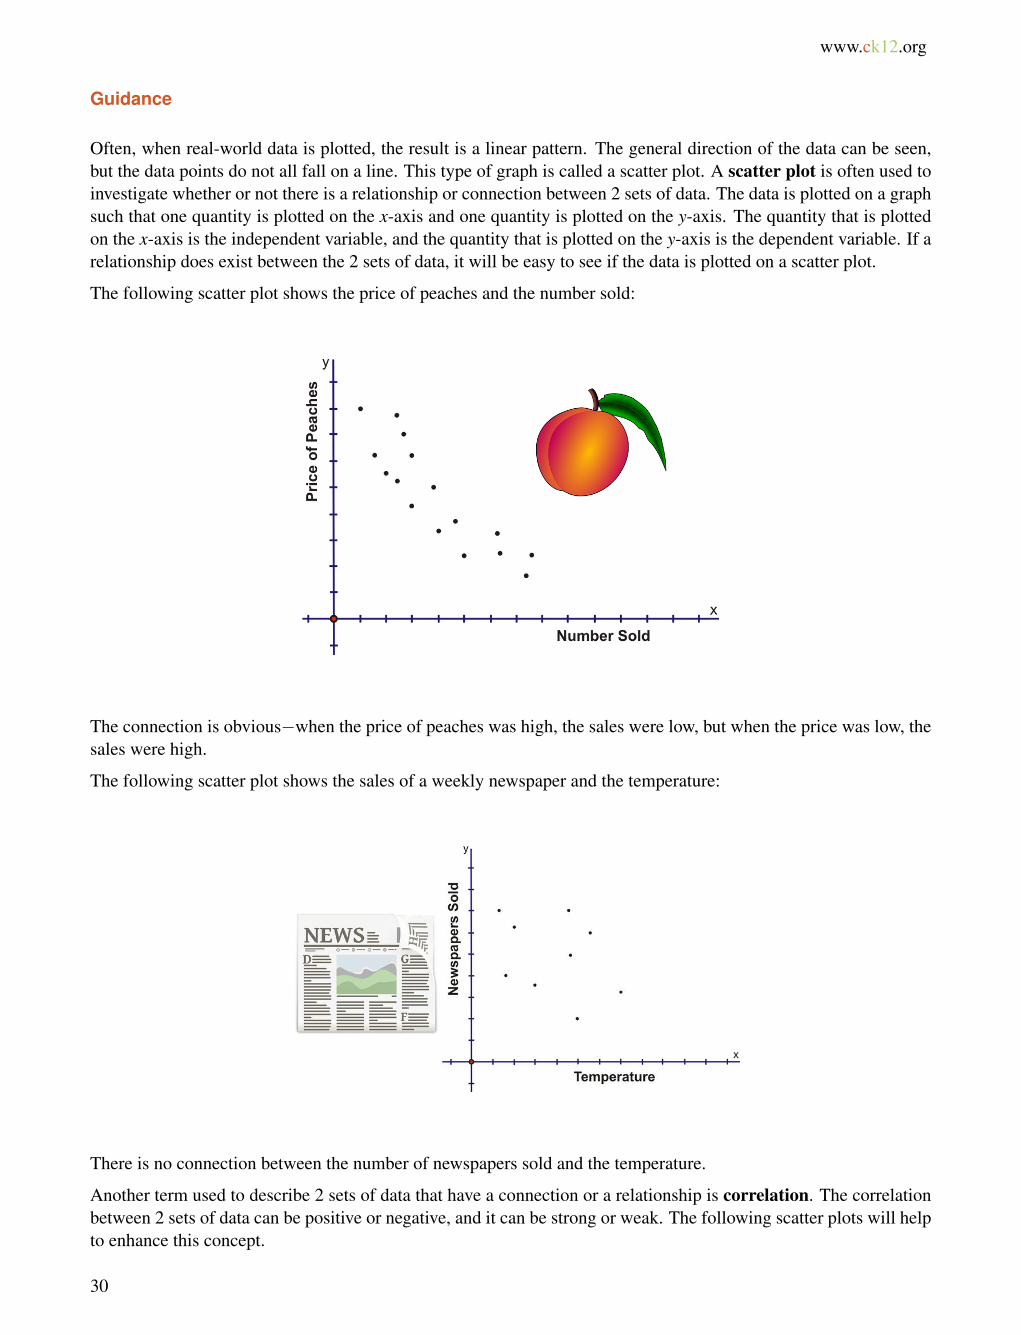
The following scatter plot shows the price of peaches and the number sold:
The connection is obvious�when the price of peaches was high, the sales were low, but when the price was low, thesales were high.
The following scatter plot shows the sales of a weekly newspaper and the temperature:
There is no connection between the number of newspapers sold and the temperature.
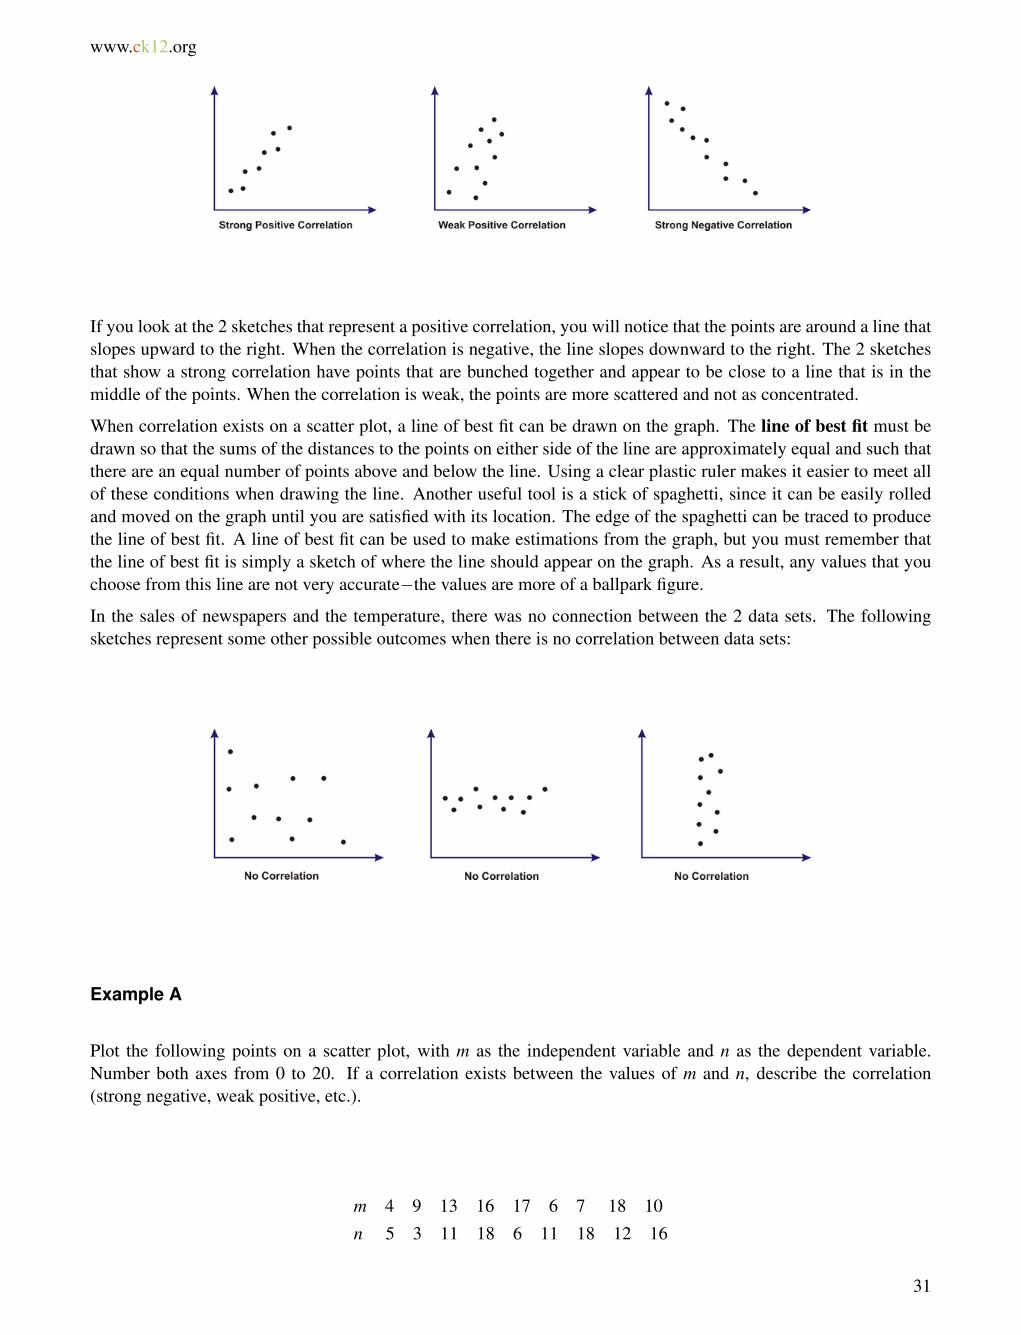
Another term used to describe 2 sets of data that have a connection or a relationship is correlation. The correlationbetween 2 sets of data can be positive or negative, and it can be strong or weak. The following scatter plots will helpto enhance this concept.
30
www.ck12.org Chapter 1. Writing Equations Of Lines
If you look at the 2 sketches that represent a positive correlation, you will notice that the points are around a line thatslopes upward to the right. When the correlation is negative, the line slopes downward to the right. The 2 sketchesthat show a strong correlation have points that are bunched together and appear to be close to a line that is in themiddle of the points. When the correlation is weak, the points are more scattered and not as concentrated.
When correlation exists on a scatter plot, a line of best fit can be drawn on the graph. The line of best fit must bedrawn so that the sums of the distances to the points on either side of the line are approximately equal and such thatthere are an equal number of points above and below the line. Using a clear plastic ruler makes it easier to meet allof these conditions when drawing the line. Another useful tool is a stick of spaghetti, since it can be easily rolledand moved on the graph until you are satisfied with its location. The edge of the spaghetti can be traced to producethe line of best fit. A line of best fit can be used to make estimations from the graph, but you must remember thatthe line of best fit is simply a sketch of where the line should appear on the graph. As a result, any values that youchoose from this line are not very accurate�the values are more of a ballpark figure.
In the sales of newspapers and the temperature, there was no connection between the 2 data sets. The followingsketches represent some other possible outcomes when there is no correlation between data sets:
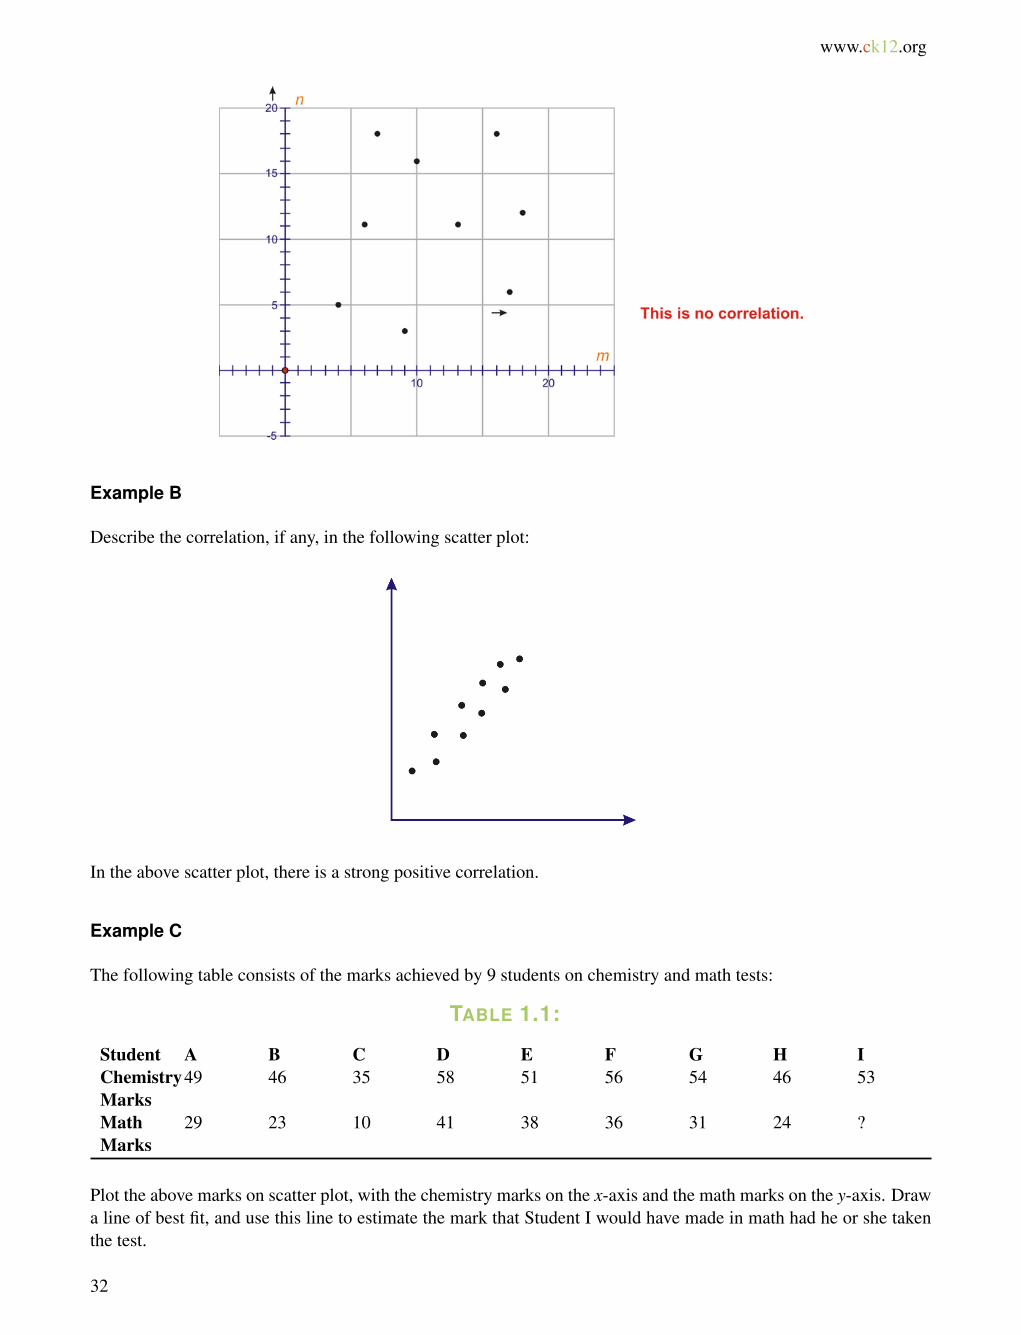
Example A
Plot the following points on a scatter plot, with m as the independent variable and n as the dependent variable.Number both axes from 0 to 20. If a correlation exists between the values of m and n, describe the correlation(strong negative, weak positive, etc.).
m 4 9 13 16 17 6 7 18 10n 5 3 11 18 6 11 18 12 16
31
1.5. Scatter Plots www.ck12.org
Example B
Describe the correlation, if any, in the following scatter plot:
In the above scatter plot, there is a strong positive correlation.
Example C
The following table consists of the marks achieved by 9 students on chemistry and math tests:
TABLE 1.1:
Student A B C D E F G H IChemistryMarks
49 46 35 58 51 56 54 46 53
MathMarks
29 23 10 41 38 36 31 24 ?
Plot the above marks on scatter plot, with the chemistry marks on the x-axis and the math marks on the y-axis. Drawa line of best fit, and use this line to estimate the mark that Student I would have made in math had he or she takenthe test.
32
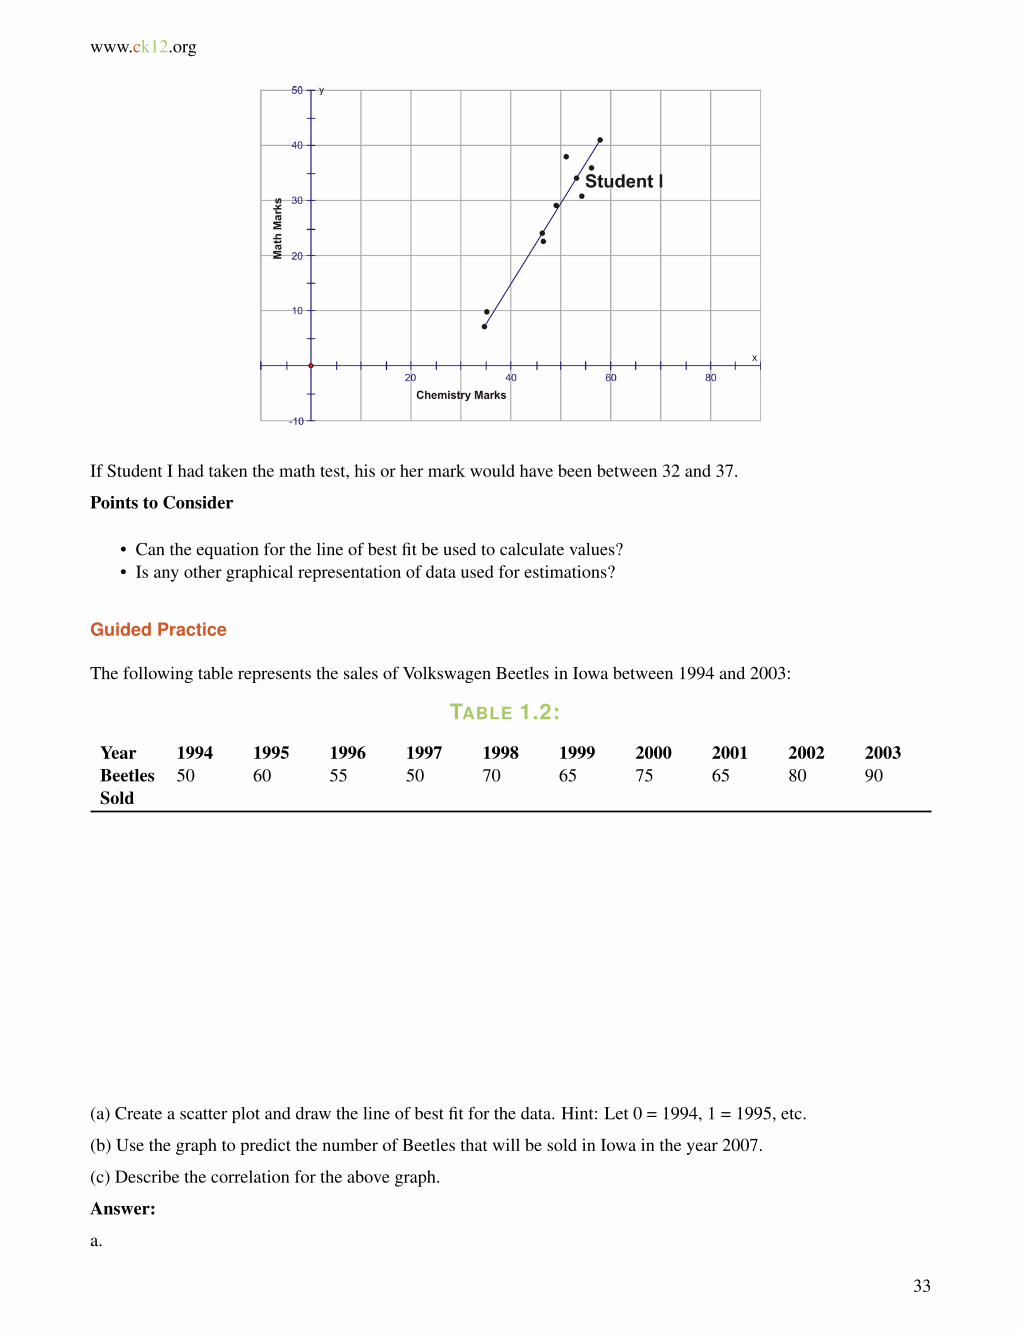
www.ck12.org Chapter 1. Writing Equations Of Lines
If Student I had taken the math test, his or her mark would have been between 32 and 37.
Points to Consider
• Can the equation for the line of best fit be used to calculate values?• Is any other graphical representation of data used for estimations?
Guided Practice
The following table represents the sales of Volkswagen Beetles in Iowa between 1994 and 2003:
TABLE 1.2:
Year 1994 1995 1996 1997 1998 1999 2000 2001 2002 2003BeetlesSold
50 60 55 50 70 65 75 65 80 90
(a) Create a scatter plot and draw the line of best fit for the data. Hint: Let 0 = 1994, 1 = 1995, etc.
(b) Use the graph to predict the number of Beetles that will be sold in Iowa in the year 2007.
(c) Describe the correlation for the above graph.
Answer:
a.
33
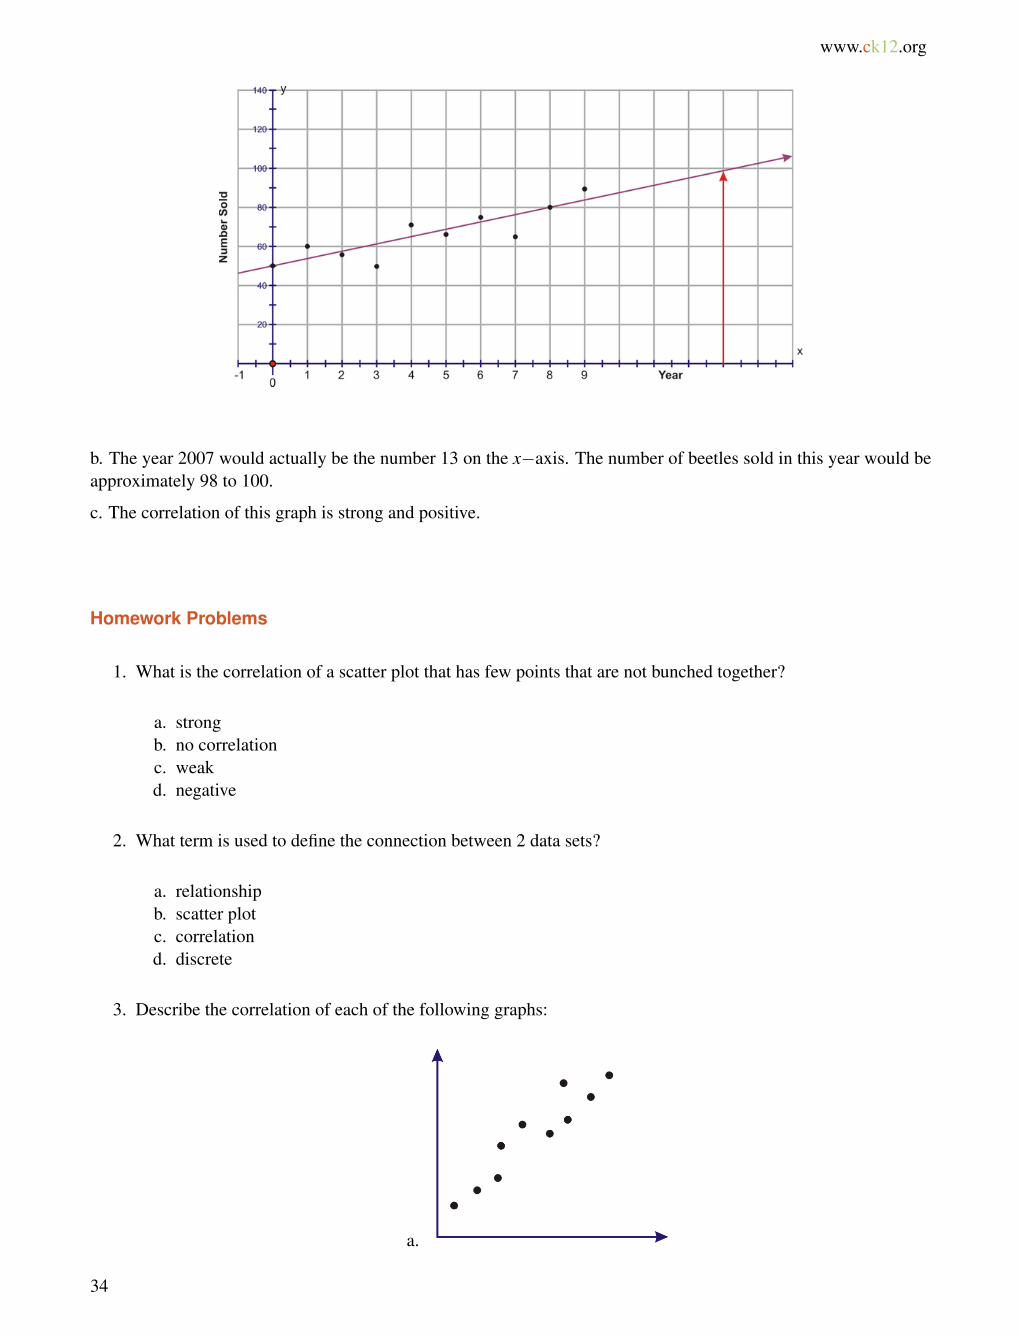
1.5. Scatter Plots www.ck12.org
b. The year 2007 would actually be the number 13 on the x�axis. The number of beetles sold in this year would beapproximately 98 to 100.
c. The correlation of this graph is strong and positive.
Homework Problems
1. What is the correlation of a scatter plot that has few points that are not bunched together?
a. strongb. no correlationc. weakd. negative
2. What term is used to define the connection between 2 data sets?
a. relationshipb. scatter plotc. correlationd. discrete
3. Describe the correlation of each of the following graphs:
a.
34
www.ck12.org Chapter 1. Writing Equations Of Lines
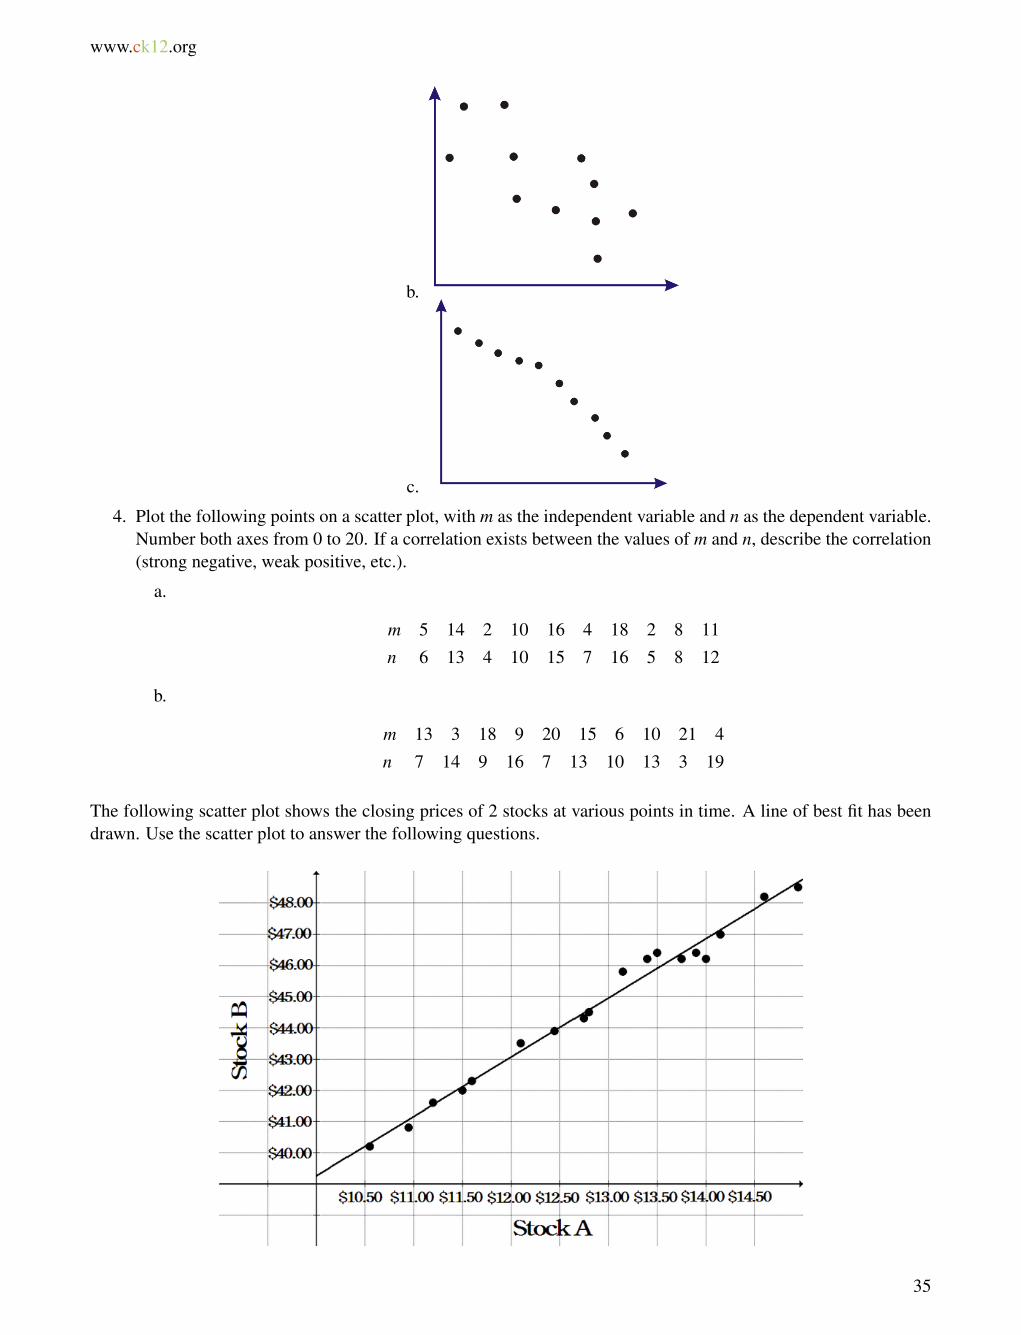
b.
c.
4. Plot the following points on a scatter plot, with m as the independent variable and n as the dependent variable.Number both axes from 0 to 20. If a correlation exists between the values of m and n, describe the correlation(strong negative, weak positive, etc.).
a.
m 5 14 2 10 16 4 18 2 8 11n 6 13 4 10 15 7 16 5 8 12
b.
m 13 3 18 9 20 15 6 10 21 4n 7 14 9 16 7 13 10 13 3 19
The following scatter plot shows the closing prices of 2 stocks at various points in time. A line of best fit has beendrawn. Use the scatter plot to answer the following questions.
35
1.5. Scatter Plots www.ck12.org
5. How would you describe the correlation between the prices of the 2 stocks?6. If the price of stock A is $12.00, what would you expect the price of stock B to be?7. If the price of stock B is $47.75, what would you expect the price of stock A to be?
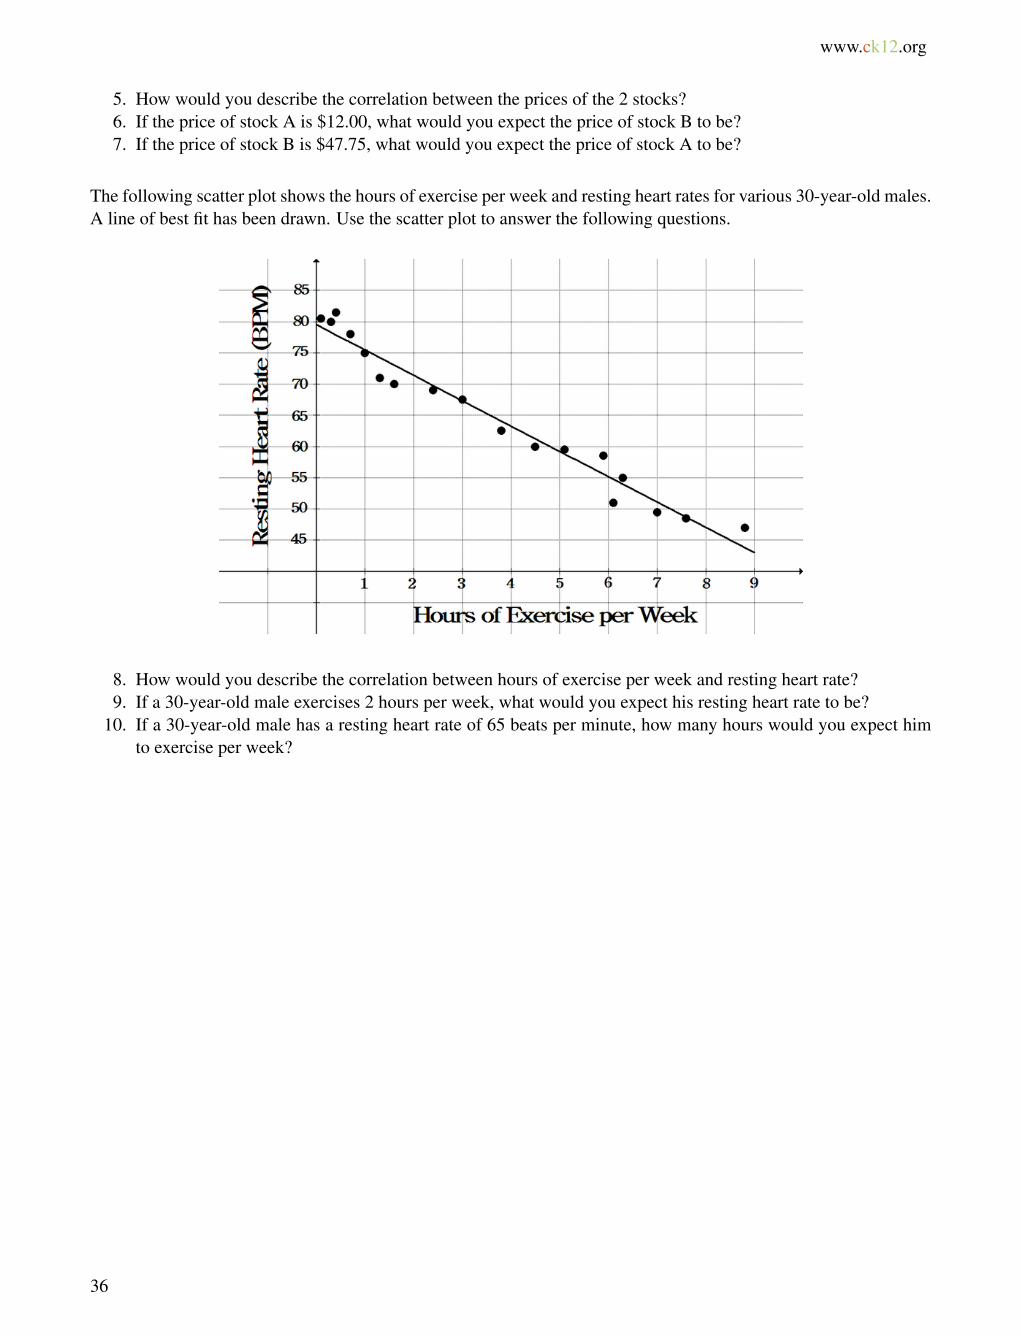
The following scatter plot shows the hours of exercise per week and resting heart rates for various 30-year-old males.A line of best fit has been drawn. Use the scatter plot to answer the following questions.
8. How would you describe the correlation between hours of exercise per week and resting heart rate?9. If a 30-year-old male exercises 2 hours per week, what would you expect his resting heart rate to be?
10. If a 30-year-old male has a resting heart rate of 65 beats per minute, how many hours would you expect himto exercise per week?
36
www.ck12.org Chapter 1. Writing Equations Of Lines
1.6 Plotting a Scatterplot and Finding theEquation of Best Fit
Here you’ll learn how to find a linear equation that best fits a set of data or points.
The calorie requirements for males is shown in the table below. What type of correlation is exhibited by the data?
Calorie Requirements (Male), 1-59 years
TABLE 1.3:
Variable ValuesAge Range, x 1-3 4-6 7-10 11-14 15-18 19-59CalorieNeeds, y
1230 1715 1970 2220 2755 2550
The age is measured in years. Source: www.fatfreekitchen.com
Guidance
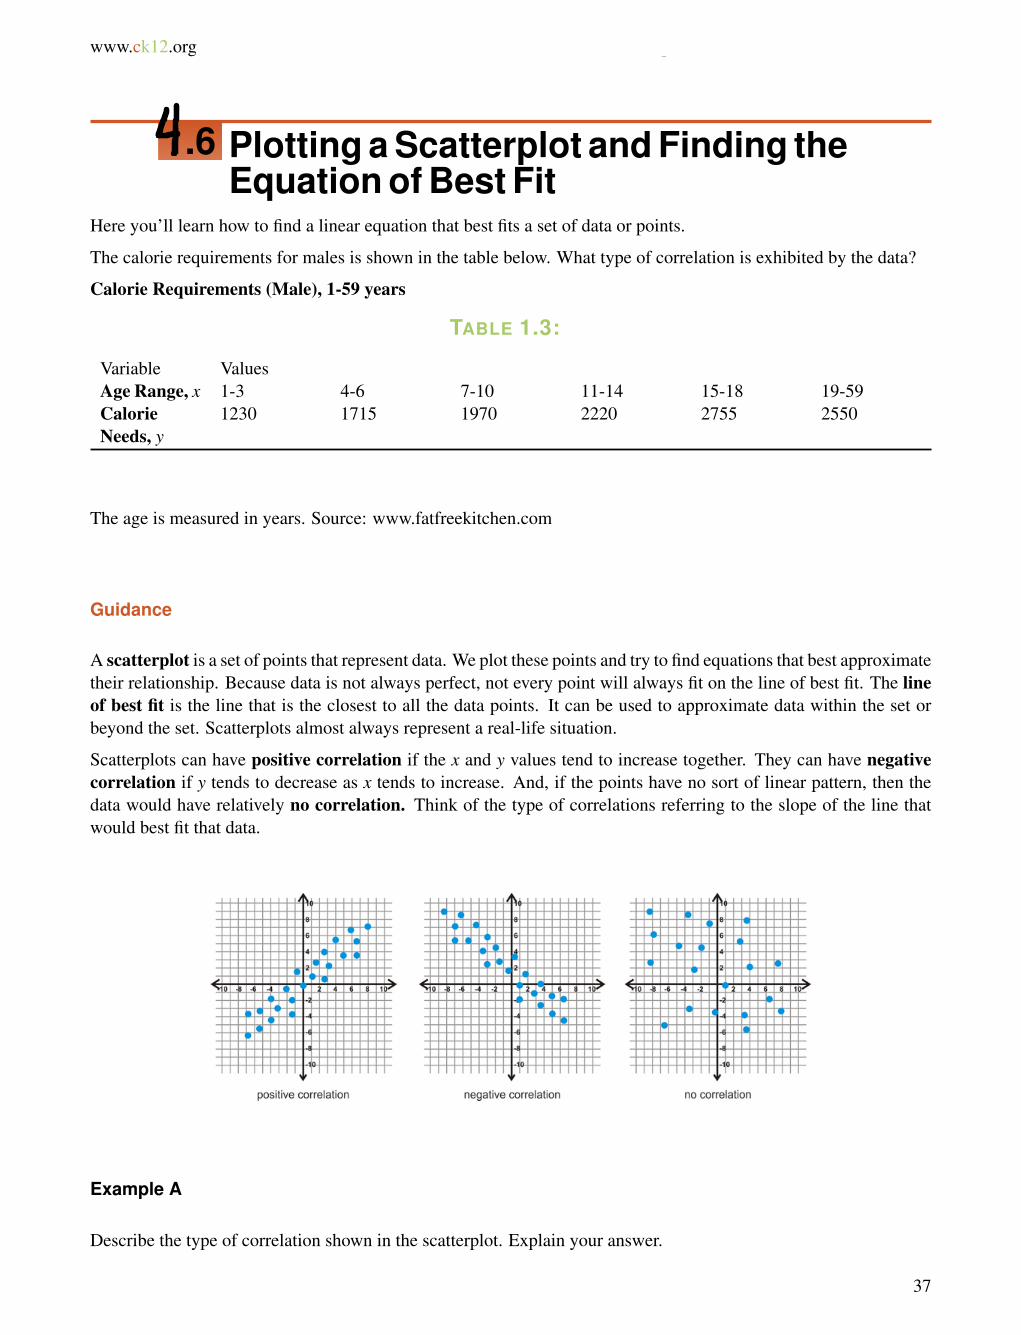
A scatterplot is a set of points that represent data. We plot these points and try to find equations that best approximatetheir relationship. Because data is not always perfect, not every point will always fit on the line of best fit. The lineof best fit is the line that is the closest to all the data points. It can be used to approximate data within the set orbeyond the set. Scatterplots almost always represent a real-life situation.
Scatterplots can have positive correlation if the x and y values tend to increase together. They can have negativecorrelation if y tends to decrease as x tends to increase. And, if the points have no sort of linear pattern, then thedata would have relatively no correlation. Think of the type of correlations referring to the slope of the line thatwould best fit that data.
Example A
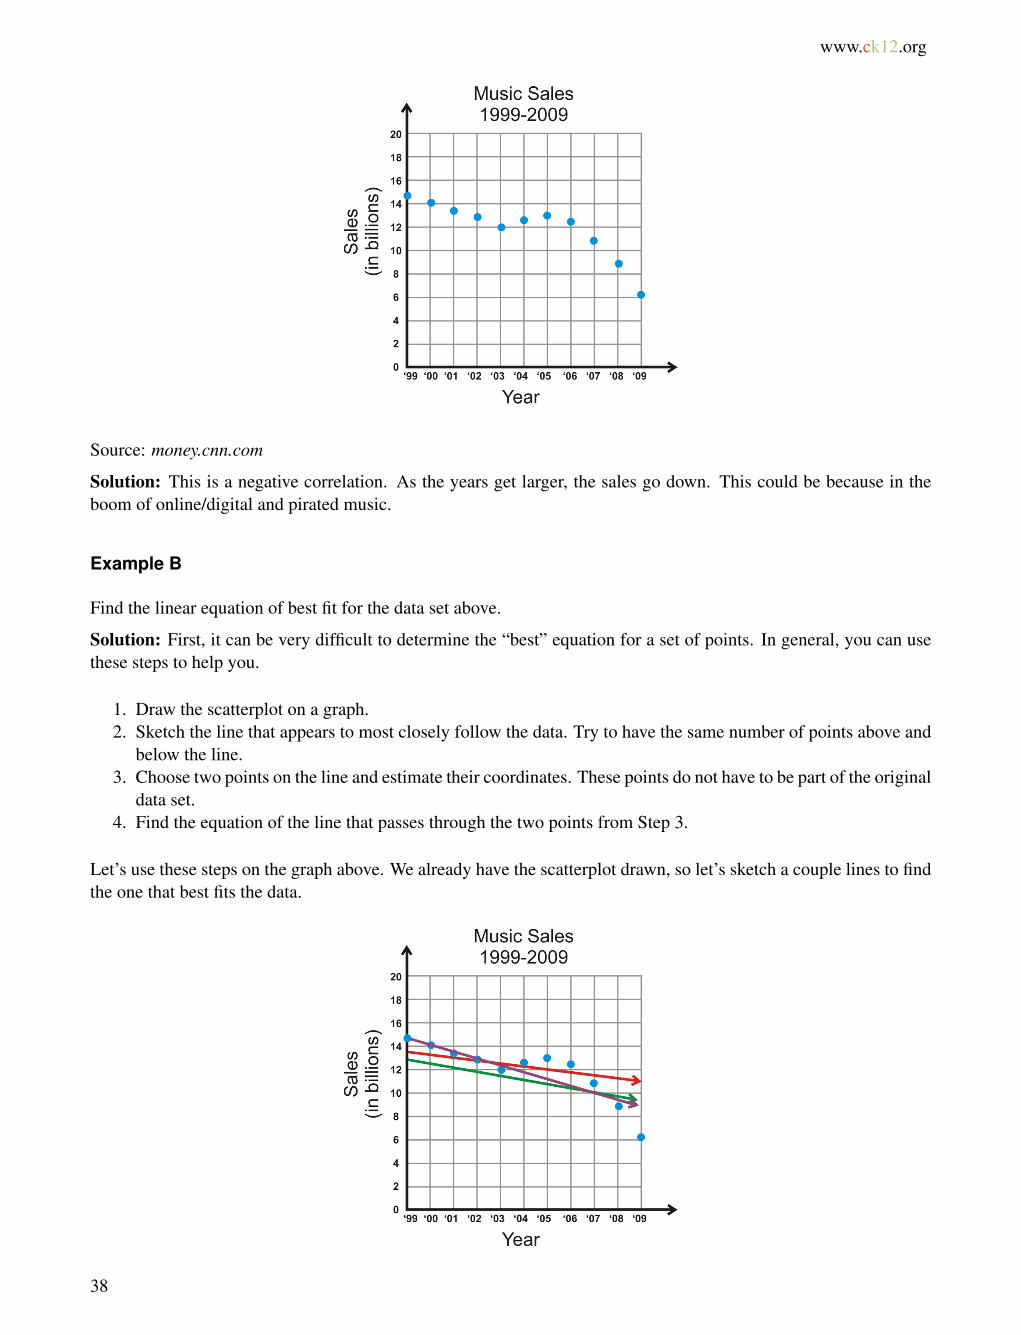
Describe the type of correlation shown in the scatterplot. Explain your answer.
37
1.6. Plotting a Scatterplot and Finding the Equation of Best Fit www.ck12.org
Source: money.cnn.com
Solution: This is a negative correlation. As the years get larger, the sales go down. This could be because in theboom of online/digital and pirated music.
Example B
Find the linear equation of best fit for the data set above.
Solution: First, it can be very difficult to determine the “best” equation for a set of points. In general, you can usethese steps to help you.
1. Draw the scatterplot on a graph.2. Sketch the line that appears to most closely follow the data. Try to have the same number of points above and
below the line.3. Choose two points on the line and estimate their coordinates. These points do not have to be part of the original
data set.4. Find the equation of the line that passes through the two points from Step 3.
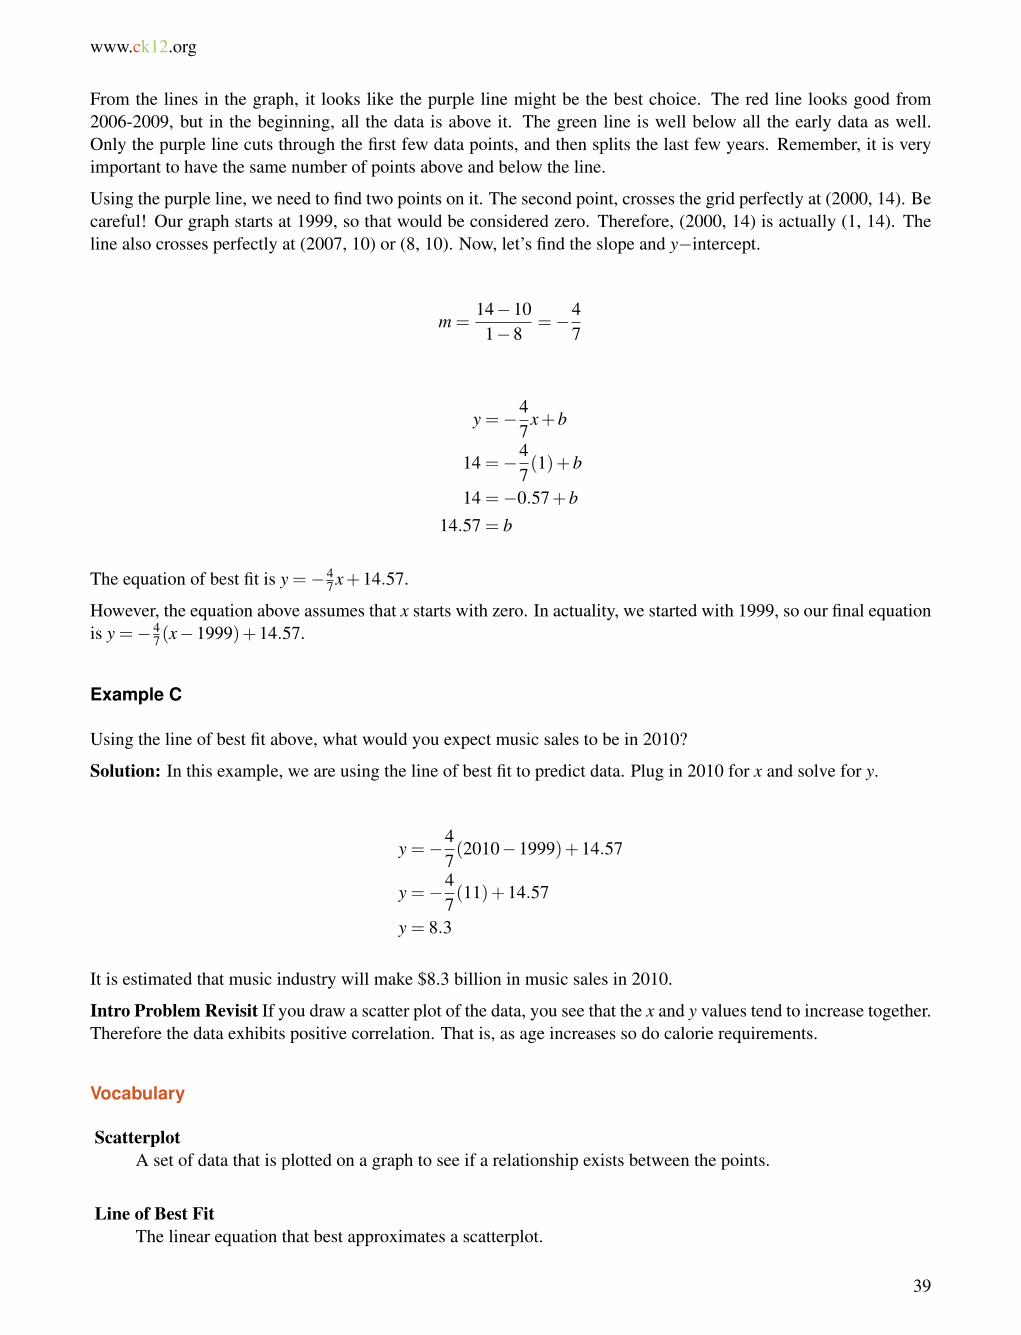
Let’s use these steps on the graph above. We already have the scatterplot drawn, so let’s sketch a couple lines to findthe one that best fits the data.
38
www.ck12.org Chapter 1. Writing Equations Of Lines
From the lines in the graph, it looks like the purple line might be the best choice. The red line looks good from2006-2009, but in the beginning, all the data is above it. The green line is well below all the early data as well.Only the purple line cuts through the first few data points, and then splits the last few years. Remember, it is veryimportant to have the same number of points above and below the line.
Using the purple line, we need to find two points on it. The second point, crosses the grid perfectly at (2000, 14). Becareful! Our graph starts at 1999, so that would be considered zero. Therefore, (2000, 14) is actually (1, 14). Theline also crosses perfectly at (2007, 10) or (8, 10). Now, let’s find the slope and y�intercept.
m =14�101�8
=�47
y =�47
x+b
14 =�47(1)+b
14 =�0.57+b14.57 = b
The equation of best fit is y =� 47 x+14.57.
However, the equation above assumes that x starts with zero. In actuality, we started with 1999, so our final equationis y =�4
7(x�1999)+14.57.
Example C
Using the line of best fit above, what would you expect music sales to be in 2010?
Solution: In this example, we are using the line of best fit to predict data. Plug in 2010 for x and solve for y.
y =�47(2010�1999)+14.57
y =�47(11)+14.57
y = 8.3
It is estimated that music industry will make $8.3 billion in music sales in 2010.
Intro Problem Revisit If you draw a scatter plot of the data, you see that the x and y values tend to increase together.Therefore the data exhibits positive correlation. That is, as age increases so do calorie requirements.
Vocabulary
ScatterplotA set of data that is plotted on a graph to see if a relationship exists between the points.
Line of Best FitThe linear equation that best approximates a scatterplot.
39
1.6. Plotting a Scatterplot and Finding the Equation of Best Fit www.ck12.org
Guided Practice
Use the table below to answer the following questions.
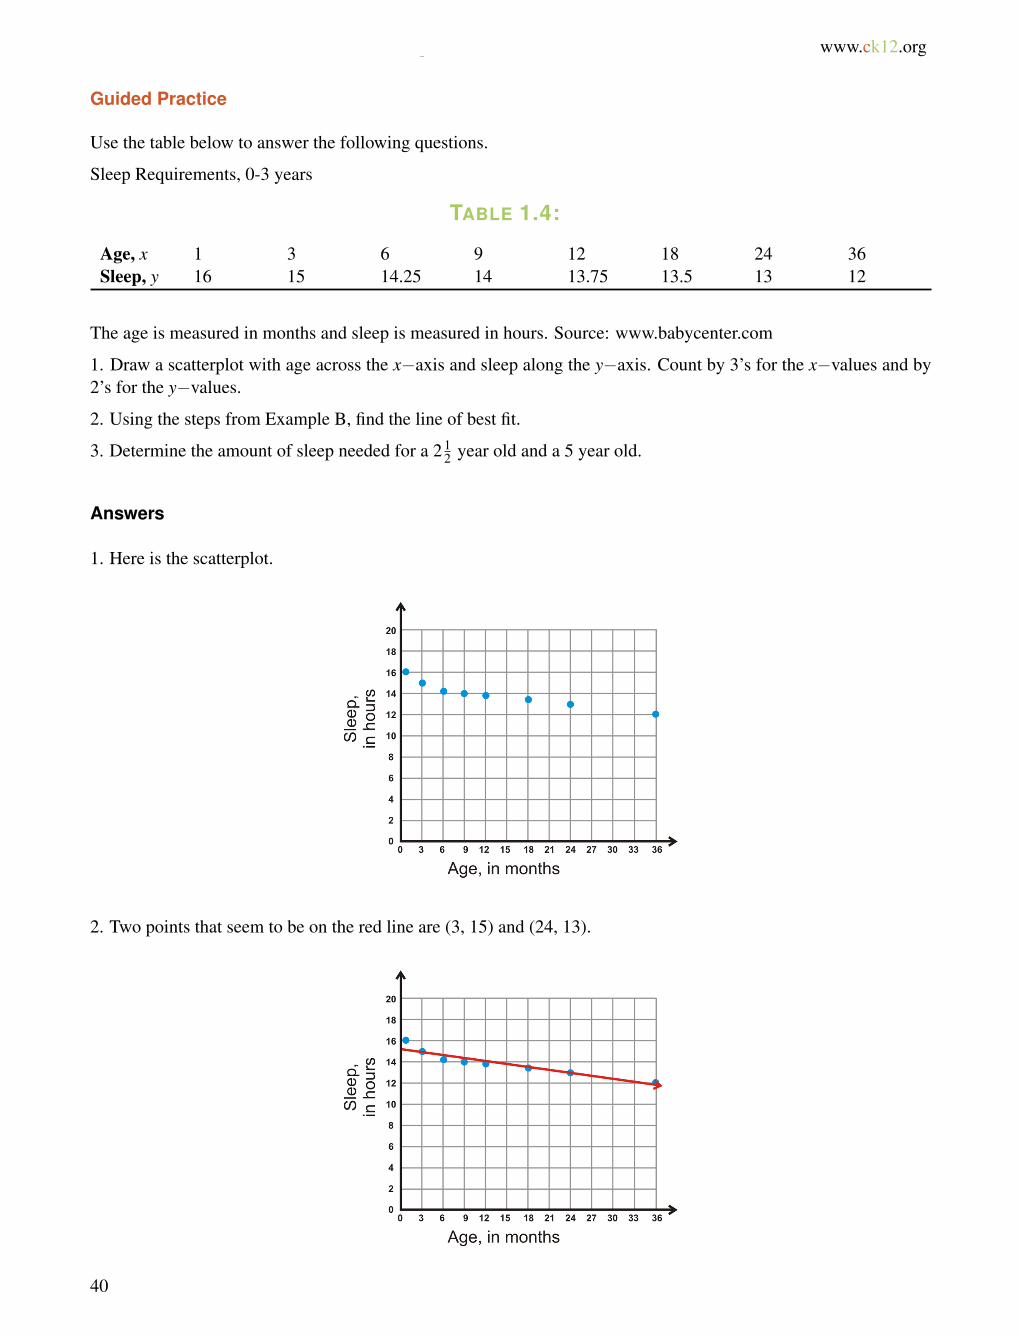
Sleep Requirements, 0-3 years
TABLE 1.4:
Age, x 1 3 6 9 12 18 24 36Sleep, y 16 15 14.25 14 13.75 13.5 13 12
The age is measured in months and sleep is measured in hours. Source: www.babycenter.com
1. Draw a scatterplot with age across the x�axis and sleep along the y�axis. Count by 3’s for the x�values and by2’s for the y�values.
2. Using the steps from Example B, find the line of best fit.
3. Determine the amount of sleep needed for a 2 12 year old and a 5 year old.
Answers
1. Here is the scatterplot.
2. Two points that seem to be on the red line are (3, 15) and (24, 13).
40
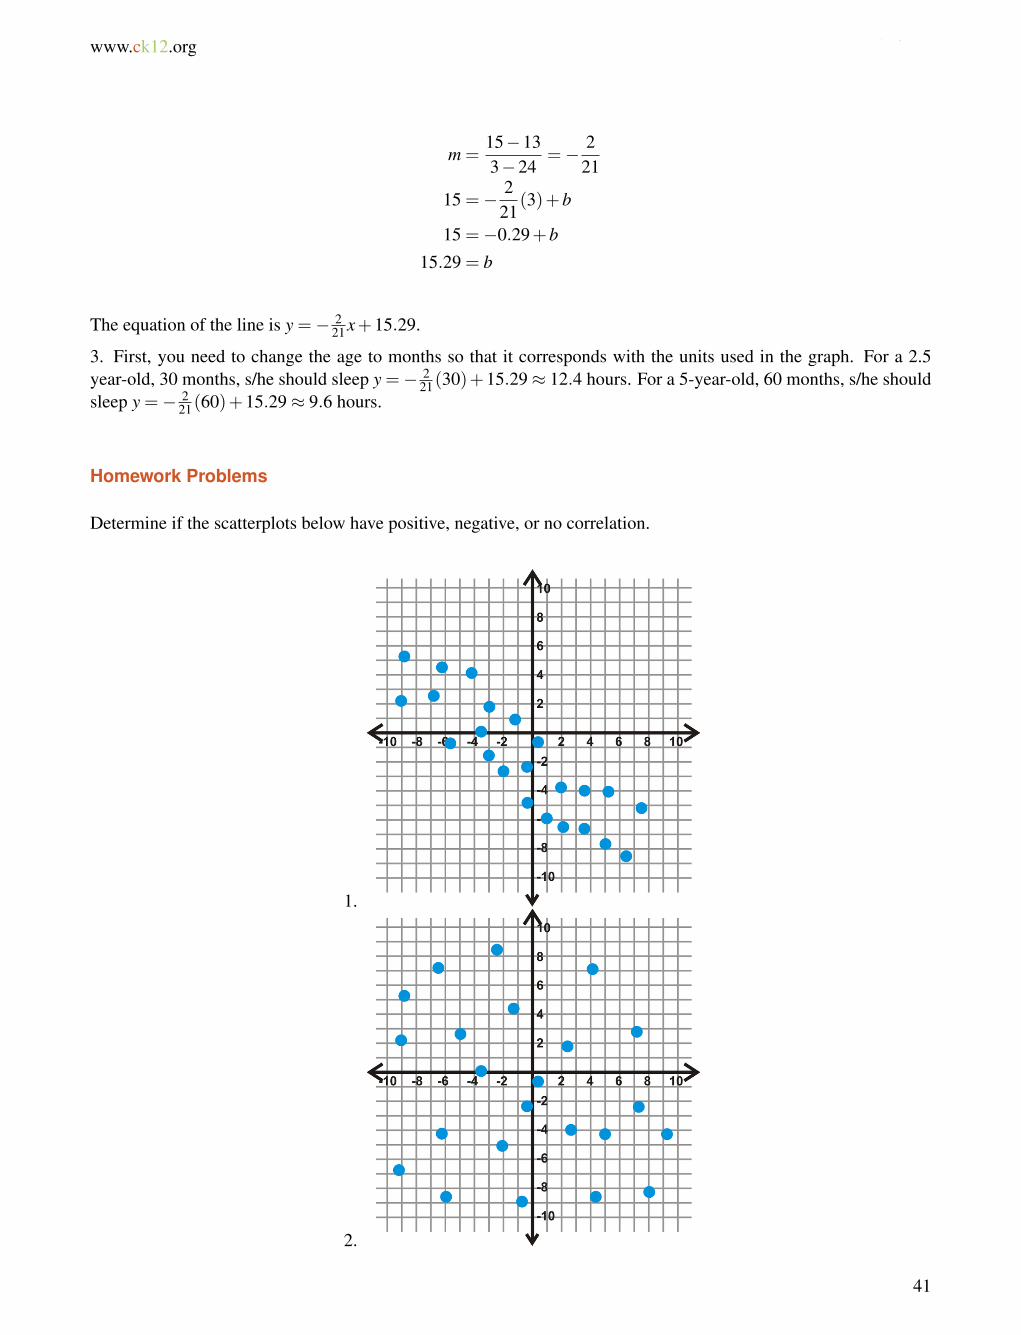
www.ck12.org Chapter 1. Writing Equations Of Lines
m =15�133�24
=� 221
15 =� 221
(3)+b
15 =�0.29+b15.29 = b
The equation of the line is y =� 221 x+15.29.
3. First, you need to change the age to months so that it corresponds with the units used in the graph. For a 2.5year-old, 30 months, s/he should sleep y =� 2
21(30)+15.29 ⇡ 12.4 hours. For a 5-year-old, 60 months, s/he shouldsleep y =� 2
21(60)+15.29 ⇡ 9.6 hours.
Homework Problems
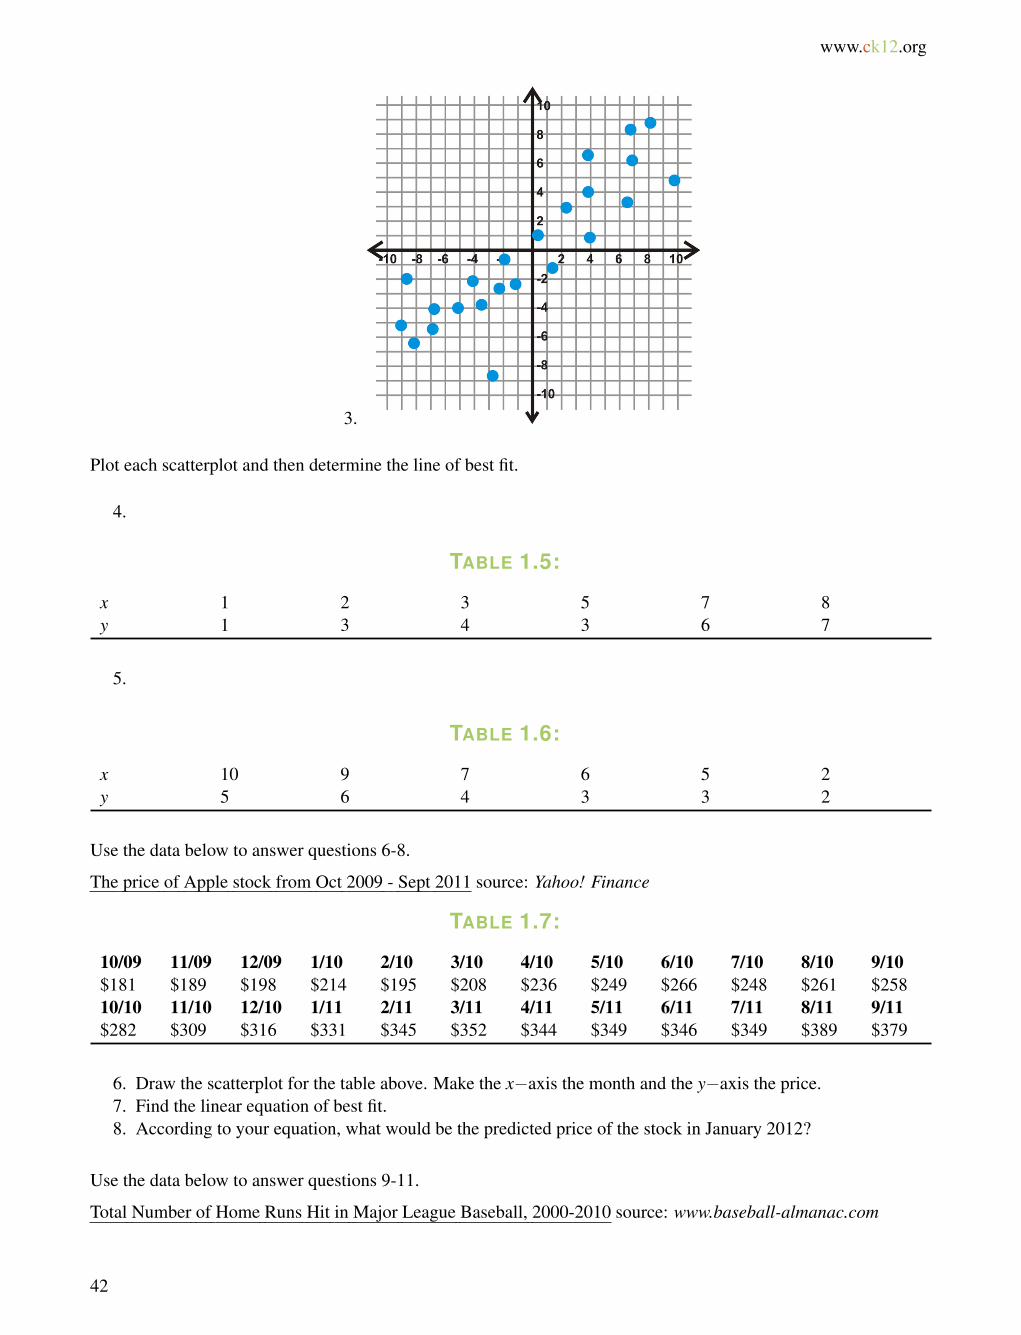
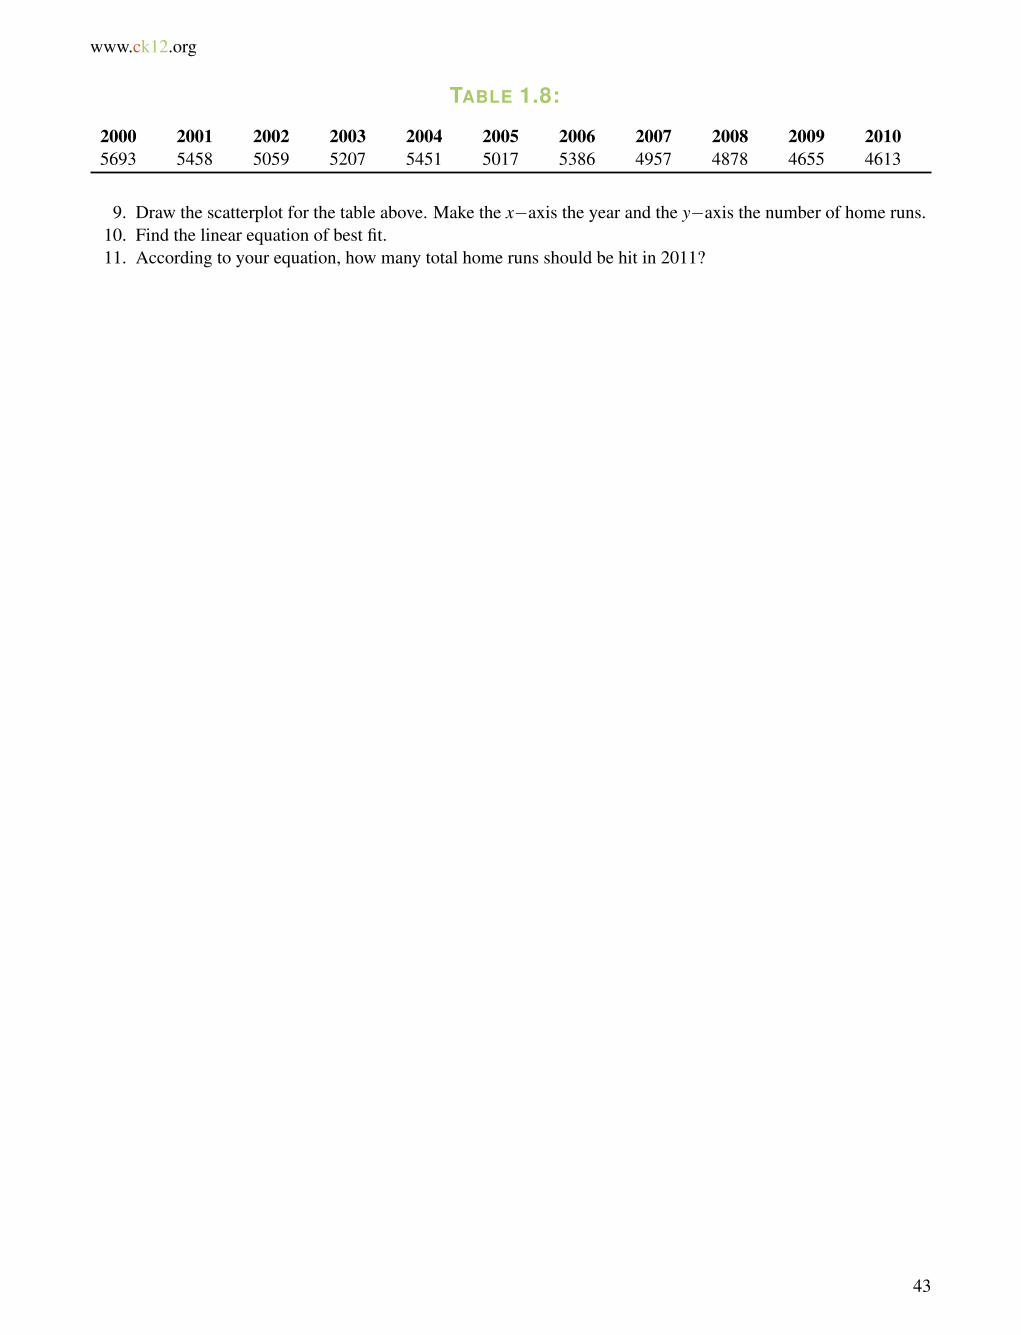
Determine if the scatterplots below have positive, negative, or no correlation.
1.
2.
41
1.6. Plotting a Scatterplot and Finding the Equation of Best Fit www.ck12.org
3.
Plot each scatterplot and then determine the line of best fit.
4. .
TABLE 1.5:
x 1 2 3 5 7 8y 1 3 4 3 6 7
5. .
TABLE 1.6:
x 10 9 7 6 5 2y 5 6 4 3 3 2
Use the data below to answer questions 6-8.
The price of Apple stock from Oct 2009 - Sept 2011 source: Yahoo! Finance
TABLE 1.7:
10/09 11/09 12/09 1/10 2/10 3/10 4/10 5/10 6/10 7/10 8/10 9/10$181 $189 $198 $214 $195 $208 $236 $249 $266 $248 $261 $25810/10 11/10 12/10 1/11 2/11 3/11 4/11 5/11 6/11 7/11 8/11 9/11$282 $309 $316 $331 $345 $352 $344 $349 $346 $349 $389 $379
6. Draw the scatterplot for the table above. Make the x�axis the month and the y�axis the price.7. Find the linear equation of best fit.8. According to your equation, what would be the predicted price of the stock in January 2012?
Use the data below to answer questions 9-11.
Total Number of Home Runs Hit in Major League Baseball, 2000-2010 source: www.baseball-almanac.com
42
www.ck12.org Chapter 1. Writing Equations Of Lines
TABLE 1.8:
2000 2001 2002 2003 2004 2005 2006 2007 2008 2009 20105693 5458 5059 5207 5451 5017 5386 4957 4878 4655 4613
9. Draw the scatterplot for the table above. Make the x�axis the year and the y�axis the number of home runs.10. Find the linear equation of best fit.11. According to your equation, how many total home runs should be hit in 2011?
43