Breaking the Customer Code - Linköping University · Kano model . Kano et al. (1984) developed a...
15
Breaking the Customer Code A Model to Translate Customer Expectations into Specification Limits Ruben Gregorio §* and Peter Cronemyr § § Siemens Industrial Turbomachinery AB, Finspong, Sweden * Division of Quality Technology and Management, Linköping Institute of Technology, Linköping, Sweden Abstract Purpose – The aim of this paper is to develop a model to help service organizations to set the specification limits according to the customer expectations. Design/methodology/approach - A review of relevant literature is used to develop a new integrated model with ideas from the Kano model, SERVQUAL, Taguchi loss function, Importance Performance Analysis (IPA) and a new model, “the Trade-Off Importance”. A survey was carried out for 18 external customers and internal stakeholders of the Service Division of Siemens Industrial Turbomachinery AB in Finspong, Sweden. Findings – The model has demonstrated its robustness and credibility to set the specification limits. Additionally it is a very powerful tool to set the strategic directions and for service quality measurement. Research limitations – First, articles published on this subject are few and there is no similar model in the literature to confirm or compare results. The proposed model must be further validated in future research. Second, this study is applied in a single service division, with a relatively small sample. Ideal research should be conducted using multiple industries in order to ensure that the model is generalizable. Originality/value – As far as we know, this paper is the first attempt to create a roadmap to set the specification limits in services. Researchers should find the proposed model to fill the research gap. From a managerial standpoint, the practical benefits in Siemens Industrial Turbomachinery AB, suggest a new way of communicating to customers. The model will also improve the target setting in the Six Sigma projects. Keywords Customer satisfaction, Service industries, Six Sigma, Specification limits, Kano model, SPC Paper type Research paper Introduction During the last 20 years, there has been steady growth not only in the service sector but also in the service content of most products (Nilsson, 2002). Today some 70% of the GNP is derived from the service sector in the US and most European countries (Bergman and Klefsjö, 2003). Research scholars suggest that firms now compete with services rather than goods (Rust, 1998; Grönroos, 2000; Vargo and Lusch, 2004). Harris and Harrington, (2000) claim that that the opportunity area for the twenty-first century is in the understanding and improvement of the service processes putting the customer in the centre of the issue. Phillips- Donaldson, (2005) in the article “The Rock Stars of Quality” states that the next breakthrough –and rock star (referring to the next guru in quality management)- is likely to come from the service sector. The well-published financial benefits of Six Sigma in manufacturing are beginning to energize large scale application in services (Antony, 11th QMOD Conference. Quality Management and Organizational Development Attaining Sustainability From Organizational Excellence to Sustainable Excellence; 20-22 August; 2008 in Helsingborg; Sweden 583
Transcript of Breaking the Customer Code - Linköping University · Kano model . Kano et al. (1984) developed a...

Breaking the Customer Code A Model to Translate Customer Expectations
into Specification Limits
Ruben Gregorio sect and Peter Cronemyr sect sectSiemens Industrial Turbomachinery AB Finspong Sweden
Division of Quality Technology and Management Linkoumlping Institute of Technology Linkoumlping Sweden
Abstract Purpose ndash The aim of this paper is to develop a model to help service organizations to set the specification limits according to the customer expectations Designmethodologyapproach - A review of relevant literature is used to develop a new integrated model with ideas from the Kano model SERVQUAL Taguchi loss function Importance Performance Analysis (IPA) and a new model ldquothe Trade-Off Importancerdquo A survey was carried out for 18 external customers and internal stakeholders of the Service Division of Siemens Industrial Turbomachinery AB in Finspong Sweden Findings ndash The model has demonstrated its robustness and credibility to set the specification limits Additionally it is a very powerful tool to set the strategic directions and for service quality measurement Research limitations ndash First articles published on this subject are few and there is no similar model in the literature to confirm or compare results The proposed model must be further validated in future research Second this study is applied in a single service division with a relatively small sample Ideal research should be conducted using multiple industries in order to ensure that the model is generalizable Originalityvalue ndash As far as we know this paper is the first attempt to create a roadmap to set the specification limits in services Researchers should find the proposed model to fill the research gap From a managerial standpoint the practical benefits in Siemens Industrial Turbomachinery AB suggest a new way of communicating to customers The model will also improve the target setting in the Six Sigma projects Keywords Customer satisfaction Service industries Six Sigma Specification limits Kano model SPC Paper type Research paper
Introduction During the last 20 years there has been steady growth not only in the
service sector but also in the service content of most products (Nilsson 2002) Today some 70 of the GNP is derived from the service sector in the US and most European countries (Bergman and Klefsjouml 2003) Research scholars suggest that firms now compete with services rather than goods (Rust 1998 Groumlnroos 2000 Vargo and Lusch 2004) Harris and Harrington (2000) claim that that the opportunity area for the twenty-first century is in the understanding and improvement of the service processes putting the customer in the centre of the issue Phillips-Donaldson (2005) in the article ldquoThe Rock Stars of Qualityrdquo states that the next breakthrough ndashand rock star (referring to the next guru in quality management)- is likely to come from the service sector
The well-published financial benefits of Six Sigma in manufacturing are beginning to energize large scale application in services (Antony
11th QMOD Conference Quality Management and Organizational Development Attaining Sustainability From Organizational Excellence to Sustainable Excellence 20-22 August 2008 in Helsingborg Sweden
583
2006) Reported case studies of Six Sigma in services are scattered in a wide range of publications eg Cronemyr (2007) Six Sigma is being used in banking healthcare accounting and finance public utilities shipping and transportation airline industry education (Antony 2006)
An important part of the Six Sigma methodology is the calculation of number of defects in the process ie points outside the specification limits However unlike goods quality which can be measured objectively by number of defects in service processes the setting up of specification limits is a complicated issue because it is marked by the use and expectations among the different customers As Six Sigma was originally created for manufacturing this crucial fact is not contemplated in the Six-Sigma roadmap Define- Measure-Analyze-Improve-Control (DMAIC)
Walter A Shewhart viewed quality from two related perspectives the objective and subjective side of quality (Shewhart 1931) The first perspective views quality as an objective reality independent of the existence of man In contrast the subjective side of quality considers what we think feel and sense as result of the objective quality
Despite differences in expression the two aspects of subjectivity and objectivity have revolved around since the time of Aristotle (350BC) (Kano et al 1984) and some popular models are widely used both by academics and practitioners to link these two sides eg the Kano model Quality Function Deployment Puga-Leal and Pereira (2007) model classification through direct questions Importance Performance Analysis Kansei engineering conjoint experiments However none of these approaches serve to successfully transform the customer expectations into specification limits in services
This paper aims resolve this issue developing a roadmap to systematically set the specification limits in services linking the subjective side of quality with the objective side To do so one integrated model is presented combining ideas from the Kano model SERVQUAL Taguchi loss function Importance Performance Analysis (IPA) and a new model the Trade-Off importance The following section briefly reviews these five methods
Kano model Kano et al (1984) developed a model to categorize the attributes of a
product or service based on how well they are able to meet customer needs The following are the popularly called Kano customer need categories bull Must-be requirements If these requirements are not fulfilled the
customer will be extremely dissatisfied On the other hand as the customer takes these requirements for granted their fulfillment will not increase his satisfaction bull One-dimensional requirements With regard to these requirements
customer satisfaction is proportional to the level of fulfillment - the higher the level of fulfillment the higher the customerrsquos satisfaction and vice versa bull Attractive requirements Also called Whoh or delighters these
requirements are the product criteria which have the greatest influence on how satisfied a customer will be with a given product Attractive
11th QMOD Conference Quality Management and Organizational Development Attaining Sustainability From Organizational Excellence to Sustainable Excellence 20-22 August 2008 in Helsingborg Sweden
584
requirements are neither explicitly expressed nor expected by the customer Fulfilling these requirements leads to more than proportional satisfaction If they are not met however there is no feeling of dissatisfaction
Figure 1 Kano model of customer satisfaction Source Pouliot (1993)
SERVQUAL In 1985 Parasuraman et al developed the SERVQUAL instrument
(refined in 1988 1991 and again in 1994) The instrument consists of two sets of 22 statements the first set aims to determine a customerrsquos expectations of a service firm while the second set seeks to ascertain the customerrsquos perceptions of the firmrsquos performance The results of the survey are then used to identify positive and negative gaps in the firmrsquos performance on five service quality dimensions (Robison 1999) According to Robison 1999 there seems little doubt that in the past decade SERVQUAL has proven to be the most popular instrument for measuring service quality
Berry and Parasuraman (1991) defined the zone of tolerance as the range of service performance that a customer considers satisfactory A performance below the tolerance zone will engender customer frustration and decrease customer loyalty A performance level above the tolerance zone will pleasantly surprise customers and strengthen their loyalty Several authors (eg Johnston 1995 Cronin 2003) consider that levels of service performance within the zone of tolerance are not perceived as different by customers SERVQUAL 3-column format is capable of specifically indicating the position of the zone of tolerance
Figure 2 Variations within the zot are not perceived by the customers
Taguchi loss function Taguchi changed the traditional view that as long as a parameter lies
within the specification limits the financial loss is zero and as soon as a parameter has exceeded one of the tolerance limits the financial loss is large For Taguchi every deviation from the target value means a loss
11th QMOD Conference Quality Management and Organizational Development Attaining Sustainability From Organizational Excellence to Sustainable Excellence 20-22 August 2008 in Helsingborg Sweden
585
which grows as the deviation increases (Bergman and Klefsjouml 2003) This view puts the customer at the centre of the issue (Lofthouse 1999)
Figure 3 a)traditional view b) Taguchi loss function
For further details see Taguchi (1987) or Phadke (1989) for a short
general overview with down-to-earth language see Lofthouse (1999) The Importance Performance Analysis (IPA) The Importance Performance Analysis (IPA) introduced originally by
Martilla and James (1977) and modified by Slack (1994) allows a company to identify which attributes of its products or services should be improved to become more competitive in the market Typically data coming from customer satisfaction surveys are used to build a matrix where the importance is shown by the y-axis and the performance of the attribute by the x-axis Although the IPA model of quality attributes has a simple structure it can provide much useful information about a companyrsquos quality performance (Tontini and Silveria 2007)
The Trade-Off Importance model In the literature there is an agreement about the necessity of analyzing
the relative importance of the attributes (eg Deming 1986 Walker and Baker 2000) When visiting your doctor getting the proper diagnosis and treatment seems more essential than having a good selection of magazines available in the waiting room though both may be necessary for a favorable experience (Walker and Baker 2000) Customers may consider some features of a service as more necessary or essential to their experience than others
The customer tends to consider everything important we call it the ldquoeverything is importantrdquo problem We developed a new approach for relative importance measurement the Importance Trade-Off analysis The basic idea of the model is that when explicit trade-offs between elements of the customer service mix are taken into account different components of relatively importance emerge (Wetzels et al 1995)
The customer is asked three pair wise questions of two attributes (see figure 4) and the questionnaire results are translated into one importance scale from 1 to 10 points The trade off importance model is able of successfully measure the relative attribute importance
Figure 4 The new model tradeoff importance One out of three trade-off questions
-
11th QMOD Conference Quality Management and Organizational Development Attaining Sustainability From Organizational Excellence to Sustainable Excellence 20-22 August 2008 in Helsingborg Sweden
586
Model construction In the literature there is an agreement about the limitations of using the
methods explained previously alone and the need of an integrated approach (eg Tan and Pawitra 2001 Puga-Leal and Pereira 2007 Yang 2003)
Witell and Loumlfgren (2007) made a literature review of 29 research articles they found that the Kano model is often modified or used in combination with other methods
KANO MODEL SERVQUAL TRADE-OFF IMPORTANCE
-No actual performance
- No percived satisfaction
- No ZOT
- Linearity
- Pure qualitative model- Pure quantitative model
- NO IMPORTANCE ATTRIBUTE MEASURE
INTEGRATED MODEL
- More complex
- Largerquestionnaries
TAILORED MODEL
SOLVE
SOLVE
MIXTURE
SOLUTION
SOLVE
SOLVE
- NO IMPROVEMENT AREAS
IPA TAGUCHI
- Just more-is-better attributes
SOLVE
Figure 5 Problem analysis of the different models
Kano model modification and integration in SERVQUAL
The Kano model is a purely qualitative model it does not inform about the actual situation in the curve for example one attribute is classified as ldquomust berdquo but the model does not give any information whether the current performance is for example in the severe dissatisfaction area or in the neutrality area
To solve this problem it is interesting to introduce the zone of tolerance concept into the Kano model According to Pouliot (2003) the ldquoMust berdquo level is only a little above neutral because Must-be is only a weak statement of satisfaction it is more a statement of lack of dissatisfaction though certainly more positive than neutral Symmetrically ldquocan live withrdquo is not a strong statement of dissatisfaction but its grudging acceptance is more negative than neutral
11th QMOD Conference Quality Management and Organizational Development Attaining Sustainability From Organizational Excellence to Sustainable Excellence 20-22 August 2008 in Helsingborg Sweden
587
Figure 6 Proposed lines observe that there is not only one
line for every classification Source (Pouliot 1993) Laveling the vertical levels of the Kano model with the wordings of the
answers of the Kano questionnaire and integrating SERVQUAL into the Kano model in the vertical axis the area between ldquoIt must be like thatrdquo and ldquoI can tolerate itrdquo is the satisfactory service level where we can introduce the subjective zone of tolerance
In the horizontal axis we introduced the actual performance in for example days or months and the plot the box plot from historical data
The satisfaction-performance lines allow to translate the subjective zone of tolerance to the objective zone of tolerance It allows to know the percentage of the points of the service offered that fall into the satisfaction dissatisfaction or delight area
Despite SERVQUALrsquos wide use by academics and practitioners in
various industries and in different countries a number of studies have questioned its conceptual and operational bases (eg Morrison 2004 Lewis and Mitchell 1990 Smith 1995)
According to Tan and Pawitra (2001) three main areas for further improving SERVQUAL can be identified First SERVQUAL assumes that the relationship between customer satisfaction and service attribute is linear ie all the attributes are one-dimensional This is not in line with the Kano ideas In addition SERVQUAL is recognized as a continuous improvement tool There is however no element for innovation Third SERVQUAL provides important information on the gaps between predicted service and perceived service but it is not able to address how the gaps can be closed
Kano model can help address the innovation issue against SERVQUAL Because attractive attributes are a source of customer delight this is one area where efforts for improvement should be targeted (Tan and Pawitra 2001) Introducing Kano model into SERVQUAL can counter the linearity problem
Integrating and modifying SERVQUAL and Kano model some problems have been addressed However there still are some more
11th QMOD Conference Quality Management and Organizational Development Attaining Sustainability From Organizational Excellence to Sustainable Excellence 20-22 August 2008 in Helsingborg Sweden
588
Kano model just considers more-is-better attribute Taguchi (1987) considered four categories of quality characteristics higher-the-better (eg computers performance) lower-the-better (eg waiting time in a queue) nominal-is-best (eg time schedules) and asymmetric
The Kano model can be used just with more-is-better attributes We developed a systematic approach to draw the four categories satisfaction-performance curves without the use of the Kano classification table
The relative importance of the attributes is not analyzed Kano model
and SERVQUAL do not analyze the relative importance of the attributes By integrating the new Trade-Off Importance model the information about the relative importance is obtained
No improvement directions Kano model and SERVQUAL do not have
any strategic direction approach for guiding after the results The Importance Performance Analysis with information from the trade off importance model and SERVQUAL together with the Kano classification helps to guide to the improvement directions
Figure 7 Proposed model
Application in the Service Division Siemens Industrial
Turbomachinery AB (SIT) Cronemyr (2007) developed a model for process management that is
being used in SIT AB According to this approach the first step is mapping processes second run Six Sigma projects and third go for the process control Currently phase 1 and 2 are running successfully and Phase 3 is not used in the right way Analysis and follow-up of Key Performance Indicators (KPIs) are performed with bar charts with monthly average values The decisions are made according to the difference of this value and one target without taking into account the process variation The process control charts were developed in a previous project
The setting up of the specification limits based on the real customer needs will allow the company to use a SPC control loop in the ldquoSix Sigma wayrdquo
Theory of attractive
quality
New model Importance
trade-off
ANALYSIS
HISTORICAL DATA
COMPANY INTERVIEWS (VOE)
NOISE
NOISE
SERVQUAL modified
Taguchiloss
function
- Minimum acceptable
- Percieved performance
-Range acceptable
- Relative importance
- Weakness
USLLSL
Strenghtsweakness
Improvement directions
IPA
Percievedperformance
-Loss function
- Nominal-is-bettersituations
INTEGRATION
Theory of attractive
quality
NOISE NOISE
11th QMOD Conference Quality Management and Organizational Development Attaining Sustainability From Organizational Excellence to Sustainable Excellence 20-22 August 2008 in Helsingborg Sweden
589
Questionnaire design Integrated approaches are normally time-consuming to answer and
analyze see for example Yang (2003) Tan and Pawitra (2001) The most important constraint was that the questionnaire must take maximum 5 minutes to answer It has three parts
i- Kano modified questions for obtaining the satisfaction-performance lines ie to link the subjective quality with the objective quality
ii- SERVQUAL modified the purpose is to measure internal and external customersrsquo perceived performance and minimum service level
iii- Trade-Off Importance model was designed to extract the customer relative importance of the different attributes
Sample and data collection We selected 9 internal stakeholders the process owners of the different
Key Performance Indicators (KPIs) and 9 external customers represented by people from finance and engineering at different companies and countries
It is very important to have a high return rate For example (Yang 2003) made a survey with an integrated approach 1400 persons where mailed randomly resulting in 150 valid questionnaires In this situation the analysis of the questionnaires is useless because it does not represent the general opinion Maybe only the customers that are very satisfied or dissatisfied have answered
Analysis The model was applied for the six main KPIs in the service division
we will illustrate the analysis with an example (because of company confidentiality the real data have been somewhat manipulated) Inspection report delivery time is the time between the site job ends until the customer receives the inspection report
In figure 8 the vertical axis represents the subjective side of quality the customer perceptions of this attribute The zone of tolerance is drawn between the ldquomust berdquo and ldquoI can tolerate itrdquo line in this zone the customers will not feel the variations In the satisfaction area the expectations are met performance higher than the satisfaction area will lead to customer delight and lower to the ZOT will lead to dissatisfaction
The horizontal axis represents the objective side of quality the attribute actual performance represented in a box-plot gathered from historical data The satisfaction-performance lines are drawn with a systematic roadmap based on the questionnaire answers of the customers The satisfaction-performance line represents the customer satisfaction in function of the inspection report delivery time (in days) With the satisfaction-performance lines we can translate the subjective zone of tolerance to the objective ZOT
11th QMOD Conference Quality Management and Organizational Development Attaining Sustainability From Organizational Excellence to Sustainable Excellence 20-22 August 2008 in Helsingborg Sweden
590
Figure 8 Final graphic
Delight
7
8
9
3
6
2
1
4
5Performance (days)
SU
BJE
CTI
VE Q
UAL
ITY
ZOT
Incr
ease
Incr
ease
ddi
ssat
isfa
ctio
n
e
Must-be
Tolerate
Dislike
Dissatisfaction
dsa
tisfa
ctio
n
LikOne-dimensiona
INSPECTION REPORT TIMEl
USL=45
IMPORTANCE 510
ADEQUATE
INCR SATISFACTION
OBJECTIVE QUALITY
LOSS FUNCTION
IMPROVE
ZOTacute INCR DISSATISFACTION
IndifferentAttractive
BOX PLOT
45 6030 7515
In the graphic above there are three different areas Satisfaction area Inspection reports between 20 and 45 days are in the
indifferent area the expectations are met the variations within this zone would have marginal effect in the customersrsquo perceptions of the service
Delight area Inspections in less than 20 days is a delighter This differentiates from the competitors
Dissatisfaction area Inspections in more than 45 days lead to external customer dissatisfaction it is a bad performance in the process
According to Bergman and Klefsjouml (2003) the quality of a product or service is its ability to satisfy or preferably exceed the needs and expectations of the customers As long as the satisfaction-performance line is within the satisfaction and delight area the organization is offering a high quality service With more than 45 days of inspection report delivery time the customers start to be dissatisfied The specification limit is marked in 45 days
Capability analysis and target value With the specification limits set by the customers the real number of
defects in the process can be calculated To perform the capability analysis we assume that the distribution is normal In services where the human is the main player it is difficult to have normal distributions with 95 confidence level it is needed to transform the data Instead we propose to calculate the percentage of conformance with specifications There are tables to transform the yield into a sigma value
Defining the quality loss as the customer dissatisfaction by inverting the satisfaction-performance lines the associated qualitative loss function can be drawn in the histogram The loss function is very useful to understand that it is not just important to meet the specification limits It is also important to center the distribution in the right area to maximize the customer satisfaction and minimize the associated cost
This way of thinking was first introduced by Genichi Taguchi in the 1950s and early 1960s Taguchi methods are claimed to have provided as much as 80 per cent of Japanese quality gains (Lofthouse 1999)
11th QMOD Conference Quality Management and Organizational Development Attaining Sustainability From Organizational Excellence to Sustainable Excellence 20-22 August 2008 in Helsingborg Sweden
591
Figure 9 Capability analysis
05
10152025303540
0 20 40 60 80 100
120
140
160
180
200
220
240
260
280
300
DEFECTS
LOSS FUNCTION
USL = 45 days DAYS
Improvement directions The Importance Performance Analysis is a very simple visual and
useful tool The vertical axis represents the attribute importance obtained from the ldquotrade off importance modelrdquo and the horizontal axis the attribute perceived performance from SERVQUAL
To enhance customer satisfaction improvement efforts must be targeted in the attribute A Improving attribute C will have a marginal effect in the customer service perception
Figure 10 IPA analysis
1 2 3 4 5 6 7 8 9
10
9
8
7
6
5
4
3
2
1
Percieved performance
EXCESS
APPROPIATE
IMPROVE
URGENT ACTION
Impo
rtanc
e
Attribute A
Inspection report time
Attribute C
DesiredOverall Perceived
Practical implications Every service organization uses the experience and Know-How for
service excellence However this does not give any real competitive advantage Other organizations besides this experience they monitor the historical data to detect problems in the processes The next step for the organizations is to listen to the customers to link the experience with the historical data and with the customer expectations
The Service Division SIT AB uses the experience Know-How and the historical data in Six Sigma projects with very good results It is currently between STAGE 1 and STAGE 2 of the proposed model (see figure 11)
11th QMOD Conference Quality Management and Organizational Development Attaining Sustainability From Organizational Excellence to Sustainable Excellence 20-22 August 2008 in Helsingborg Sweden
592
Figure 11 Proposed 3-Stage model for
service excellence
EXPERIENCE
HISTORICAL DATA ANALYSIS
CUSTOMER
STAGE 1 STAGE 2 STAGE 3
Detect problems Offer customers what they want
Non competitive advantage
INCREASING COMPETITIVENESS
But why does the organization hide the historical data in excel sheets with a lot of non relevant information Why is only KPIs monitored The historical data well presented and interpreted can give extremely valuable information The application of SPC would bring the company to STAGE 2 ie to detect problems in the process
In this paper we have introduced a new way to communicate to customers To know what they want how they want it what is really important for them and which are their perceptions about the service The presented model links the three dimensions experience historical data and customer expectations and will allow the organization to go to STAGE 3 and offer the customers what they want
Conclusions and recommendations Today firms compete with services rather than goods Large service
organizations are beginning to use Six Sigma as continuous improvement tool An important part of the Six Sigma methodology is the calculation of number of defects in the process ie points outside the specification limits Unlike goods quality which can be measured objectively by number of defects in service goods the setting up of specification limits is a complicated issue because it is marked by the use and expectations among the different customers As Six Sigma was originally created for manufacturing this crucial fact is not contemplated in the Six-Sigma roadmap Define- Measure-Analyze-Improve-Control (DMAIC)
In this paper we presented a model to solve this issue and set the specification limits according to the customer expectations in services organizations A review of relevant literature has been used to develop a new integrated model with ideas from Kano model SERVQUAL Taguchi loss function Importance Performance Analysis (IPA) and a new model the Trade-Off importance A survey was carried out for 18 external and internal customers of the service division of Siemens Industrial Turbomachinery AB
The output of the model is a chart that analyzes the most important KPIs in the Service Division from a general and objective perspective The visual representation in the model of the Voice Of the Customer the Voice Of the Data (VOD) and the Voice Of the Experience (VOE) creates value out of the data in one single graphic that cannot be attained
11th QMOD Conference Quality Management and Organizational Development Attaining Sustainability From Organizational Excellence to Sustainable Excellence 20-22 August 2008 in Helsingborg Sweden
593
through the use of either method alone It makes this model a credible robust and very powerful tool not just to set the specification limits but also to set strategic directions for a comprehensive service quality measurement and to improve the target setting in the Six Sigma projects
The line that separates black (defect) and white (non-defect) in service processes is diffuse because is market by the customers This paper is a contribution of a better understanding of what the customers think that is white what the customers think that is black and which is the approximate line that separates black and white
Figure 12 Managerial implications This study is of interest for Siemens Industrial Turbomachinery AB
managers It will close the control loop and will allow the change of the traditional KPI bar charts for an SPC continuous health check The real process sigma of the process can be calculated and the organization will use Six Sigma in its full potential
The benefits in the SIT AB Service Division of the present study have a number of practical applications for service managers mainly in organizations using Six Sigma or SPC policies
Limitations and avenues for further research This research has two main limitations first this is the first attempt to
create a model to transform customer expectations into specification limits there are a few articles published about this issue We used for the first time the trade-off importance model and the Kano line drawing with more than 2 points The proposed model must be further validated in future research
Second this study is applied in a single service division with a relatively small sample Ideal research should be conducted using multiple industries in order to ensure that the model is generalizable
References Aristotle O II (350 BC) Section 5 (translation EM Edghill)
available at httpclassicsmiteduAristotlecategories11html Antony J (2006) ldquoSix sigma for service processesrdquo Business
Process Management Journal Vol 12 No 2 2006 pp 234-248 Bergman B Klefsjouml B (2003) Quality from Customer Needs to
Customer Satisfaction 2nd ed Studentlitteratur Lund
11th QMOD Conference Quality Management and Organizational Development Attaining Sustainability From Organizational Excellence to Sustainable Excellence 20-22 August 2008 in Helsingborg Sweden
594
Berry LL Parasuraman A (1993) Prescriptions for a service quality revolution in America Organizational Dynamics Vol 37 No4
Cronemyr P (2007) ldquoSix Sigma Management Action Research With Some Contributions To Theories And Methodsrdquo PhD Thesis Division of Quality Sciences Department of Technology Management and Economics Chalmers University of Technology Goumlteborg Sweden
Cronin JJ Jr (2003) Looking back to see forward in services marketing some ideas to consider Managing Service Quality Vol 13 No5 pp332-7
Deming WE (1986) Out of the Crisis Massachusetts Institute of
Technology Cambridge MA
Groumlnroos C (2000) Service marketing comes of age in Schwartz TA Iacobucci D (Eds)Handbook of Services Marketing and Management Sage Thousand Oaks CA
Harris M Harrington HJ (2000) Service quality in the knowledge
age Huge opportunities for the twenty-first century Measuring Business Excellence Vol 4 No4 pp31-6
Johnston R (1995) The determinants of service quality satisfiers
and dissatisfiers International Journal of Service Industry Management Vol 6 No5 pp53-71
Kano N Seraku N Takahashi F Tsuji S (1984) Attractive
quality and must-be quality Hinshitsu (Quality The Journal of the Japanese Society for Quality Control) Vol14 No 2 pp 39-48
Lewis BR Mitchell VW (1990) Defining and measuring the
quality of customer service Marketing Intelligence and Planning Vol 8 No6 pp11-17
Llosa S Chandon J Orsinger C (1998) An empirical study of
SERVQUALrsquos dimensionality The Service Industries Journal Vol 18 No2 pp16-44
Lofthouse T (1999) The Taguchi loss function Work Study Vol
48 No6 pp218-22 Martilla JA James JC (1977) Importance-Performance Analysis
Journal of Marketing NoJanuary Morrison L (2004) Measuring service quality a review and critique
of research using SERVQUAL International Journal of Market Research Vol 46 No4 pp479-97
11th QMOD Conference Quality Management and Organizational Development Attaining Sustainability From Organizational Excellence to Sustainable Excellence 20-22 August 2008 in Helsingborg Sweden
595
Nilsson L (2002) ldquoQuality practice An Empirical Investigation of Product Development and the Goods-to-Services Continuumrdquo PhD Thesis Division of Quality Technology and Management Department of Mechanical Engineering Linkoumlping University Linkoumlping Sweden
Parasuraman A Berry LL Zeithaml V (1991) Refinement and
assessment of the SERVQUAL Journal of Retailing Vol 67 No4 pp420-49
Parasuraman A Zeithaml V Berry L (1994) Reassessment of
expectations as a comparison standard in measuring service quality implications for further research Journal of Marketing Vol 58 NoJanuary pp111-24
Parasuraman A Zeithaml VA Berry LL (1985) A conceptual
model of service quality and its implications for future research Journal of Marketing Vol 49 pp41-50
Parasuraman A Zeithaml VA Berry LL (1988) SERVQUAL a
multi-item scale for measuring consumer perceptions of the service quality Journal of Retailing Vol 64 No1 pp12-40
Phadke S (1989) Quality Engineering Using Robust Design Prentice
Hall Englewood Cliffs NJ Phillips-Donaldson D (1995) ldquoThe Rock Stars of Qualityrdquo Quality
Progress Jul 2005 38 7 pg 6 Pouliot (2003) ldquoA special issue on Kanos Methods for Understanding
Customer-defined Quality ldquo Centre for Quality Management Kanos Method Special Issue Fall 1993 Volume 2 Number 4
Puga-Leal R Lopes Z (2007) ldquoProcess capability in servicesrdquo
International Journal of Quality amp Reliability Management Volume 24 Issue 8 2007
Robinson S (1999) Measuring service quality current thinking and
future requirements Marketing Intelligence amp Planning Vol 17 No1 pp21-32
Rust R (1998) What is the domain of service research Journal of
Service Research Vol 1 No2 pp107 Shewhart WA (1931) Economic Control of Quality of Manufactured
Product D Van Nostrand Inc London Smith P (1995) On the unintended consequences of publishing
performance data in the public sector International Journal of Public Administration Vol 18 No1
11th QMOD Conference Quality Management and Organizational Development Attaining Sustainability From Organizational Excellence to Sustainable Excellence 20-22 August 2008 in Helsingborg Sweden
596
Slack N (1994) The importance-performance matrix as a determinant of improvement priority International Journal of Operations and Production Management Vol 14 No5 pp59-75
Taguchi G Konishi S (1987) Orthogonal Arrays and Linear
Graphs American Supplier Institute Inc Dearborn MI Theresia A Pawitra Kay C Tan (2003) ldquoTourist satisfaction in
Singapore- a perspective from Indonesian touristrdquo Managing Service Quality Volume 13 Issue 5 2003
Tontini G Silveira A (2007) Identification of satisfaction attributes
using competitive analysis of the improvement gap International Journal of Operations amp Production Management Vol27 No 5
Vargo SL Lusch RF (2004) Evolving to a new dominant logic
for marketing Journal of Marketing Vol 68 NoJanuary pp1-17 Walker J Baker J (2000) An exploratory study of a multi-
expectation framework for services Journal of Service Marketing Vol 14 No5 pp411-31
Wetzels M de Ruyter K Lemmink J Koelemeijer K (1995)
Measuring customer service quality in international marketing channels a multimethod approach Journal of Business amp Industrial Marketing Vol 10 No5 pp50-9
Witell L Loumlfgren M (2007) ldquoClassification of quality attributesrdquo
Managing Service Quality Volume 17 Issue 1 2007 Research paper Yang C-C (2003) Establishment and applications of the integrated
model of service quality measurement Managing Service Quality Vol 13 No4 pp310-24
About the authors Ruben Gregorio has recently graduated as a MSc from Linkoumlping
Institute of Technology Sweden and Technical University of Catalonia Barcelona Spain He has been employed in the Service Division of Siemens Industrial Turbomachinery AB Sweden to write his Masters thesis He is currently working as a leanKaizen leader in the assembly area at Delphi Automotive He is the main author of the paper to whom all the correspondence should be addressed rubengreggmailcom
Peter Cronemyr received his PhD in Quality Sciences from Chalmers
University of Technology in Goteborg Sweden He is working as a Process Management Specialist and Six Sigma Program Manager at Siemens Industrial Turbomachinery AB He has guided this research project
11th QMOD Conference Quality Management and Organizational Development Attaining Sustainability From Organizational Excellence to Sustainable Excellence 20-22 August 2008 in Helsingborg Sweden
597
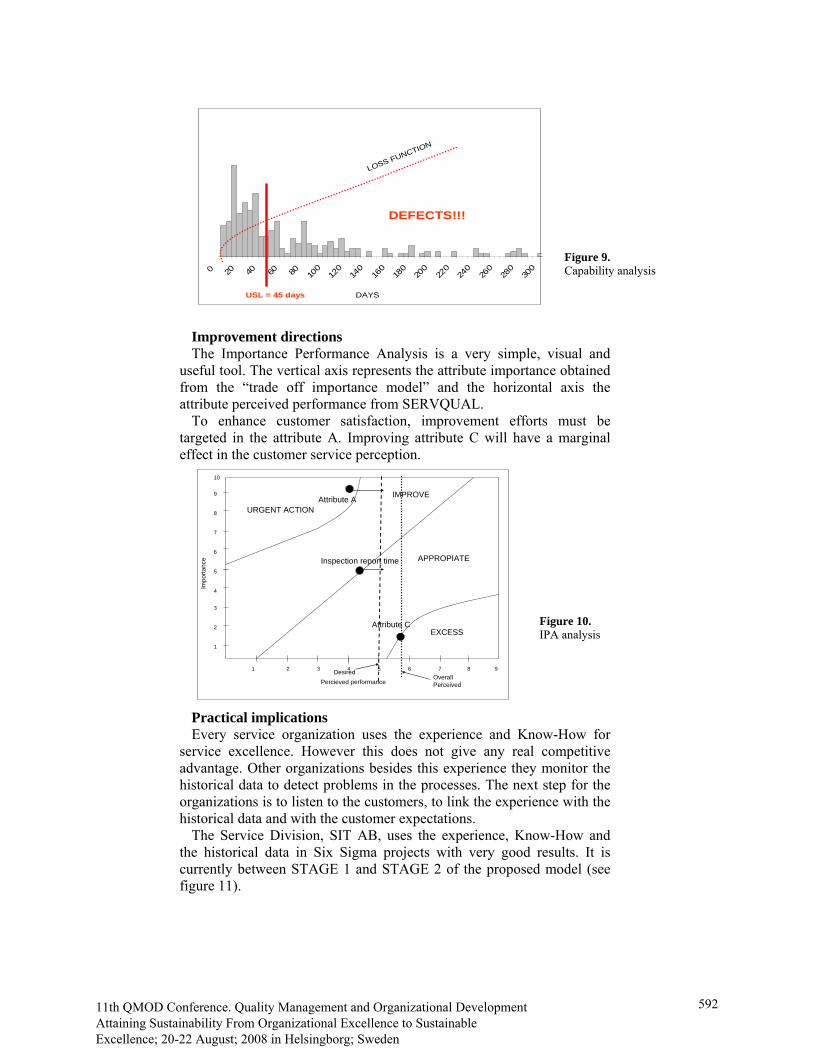