Bread Affects Clinical Parameters and Induces Gut ... and Translational Report Bread Affects...
17
Clinical and Translational Report Bread Affects Clinical Parameters and Induces Gut Microbiome-Associated Personal Glycemic Responses Graphical Abstract Highlights d Crossover trial shows no differential clinical effect of white versus sourdough bread d The microbiome composition was generally resilient to dietary intervention of bread d The glycemic response to the two types of bread varies greatly across people d Microbiome-based classifier accurately predicts glycemic- response-inducing bread type Authors Tal Korem, David Zeevi, Niv Zmora, ..., Avraham A. Levy, Eran Elinav, Eran Segal Correspondence [email protected] (A.A.L.), [email protected] (E.E.), [email protected] (E.S.) In Brief Korem et al. performed a crossover trial of industrial white or artisanal sourdough bread consumption and found no significant difference in clinical effects, with the gut microbiome composition remaining generally stable. They showed the glycemic response to bread type to be person specific and microbiome associated, highlighting the importance of nutrition personalization. Korem et al., 2017, Cell Metabolism 25, 1243–1253 June 6, 2017 ª 2017 Elsevier Inc. http://dx.doi.org/10.1016/j.cmet.2017.05.002
Transcript of Bread Affects Clinical Parameters and Induces Gut ... and Translational Report Bread Affects...

Clinical and Translational Report
Bread Affects Clinical Param
eters and Induces GutMicrobiome-Associated Personal Glycemic ResponsesGraphical Abstract
Highlights
d Crossover trial shows no differential clinical effect of white
versus sourdough bread
d The microbiome composition was generally resilient to
dietary intervention of bread
d The glycemic response to the two types of bread varies
greatly across people
d Microbiome-based classifier accurately predicts glycemic-
response-inducing bread type
Korem et al., 2017, Cell Metabolism 25, 1243–1253June 6, 2017 ª 2017 Elsevier Inc.http://dx.doi.org/10.1016/j.cmet.2017.05.002
Authors
Tal Korem, David Zeevi, Niv Zmora, ...,
Avraham A. Levy, Eran Elinav,
Eran Segal
[email protected] (A.A.L.),[email protected] (E.E.),[email protected] (E.S.)
In Brief
Korem et al. performed a crossover trial of
industrial white or artisanal sourdough
bread consumption and found no
significant difference in clinical effects,
with the gut microbiome composition
remaining generally stable. They showed
the glycemic response to bread type to be
person specific and microbiome
associated, highlighting the importance
of nutrition personalization.

Cell Metabolism
Clinical and Translational Report
Bread Affects Clinical Parameters and Induces GutMicrobiome-AssociatedPersonalGlycemicResponsesTal Korem,1,2,7 David Zeevi,1,2,7 Niv Zmora,3,4,5 Omer Weissbrod,1,2 Noam Bar,1,2 Maya Lotan-Pompan,1,2
Tali Avnit-Sagi,1,2 Noa Kosower,1,2 Gal Malka,1,2 Michal Rein,1,2 Jotham Suez,3 Ben Z. Goldberg,6 Adina Weinberger,1,2
Avraham A. Levy,6,* Eran Elinav,3,* and Eran Segal1,2,8,*1Department of Computer Science and Applied Mathematics2Department of Molecular Cell Biology3Department of Immunology
Weizmann Institute of Science, Rehovot 7610001, Israel4Internal Medicine Department, Tel Aviv Sourasky Medical Center, Tel Aviv 6423906, Israel5Research Center for Digestive Tract and Liver Diseases, Tel Aviv Sourasky Medical Center, Sackler Faculty of Medicine, Tel Aviv University,
Tel Aviv 6423906, Israel6Department of Plant and Environmental Sciences, Weizmann Institute of Science, Rehovot 7610001, Israel7These authors contributed equally8Lead contact
*Correspondence: [email protected] (A.A.L.), [email protected] (E.E.), [email protected] (E.S.)
http://dx.doi.org/10.1016/j.cmet.2017.05.002
SUMMARY
Bread is consumed daily by billions of people, yet ev-idence regarding its clinical effects is contradicting.Here, we performed a randomized crossover trialof two 1-week-long dietary interventions comprisingconsumption of either traditionally made sourdough-leavened whole-grain bread or industrially madewhite bread. We found no significant differential ef-fects of bread type on multiple clinical parameters.The gut microbiota composition remained personspecific throughout this trial and was generallyresilient to the intervention. We demonstrate statisti-cally significant interpersonal variability in the glyce-mic response to different bread types, suggestingthat the lack of phenotypic difference between thebread types stems from a person-specific effect.We further show that the type of bread that inducesthe lower glycemic response in each person can bepredicted based solely on microbiome data priorto the intervention. Together, we present markedpersonalization in both bread metabolism and thegut microbiome, suggesting that understanding die-tary effects requires integration of person-specificfactors.
INTRODUCTION
Bread is a key ingredient of the human diet, is consumed by bil-
lions of people worldwide (FAO, 1998), and makes up roughly
10% of the adult caloric intake (Zeevi et al., 2015). Its relative
ease of preparation from dry ingredients contributes to the cen-
trality of different forms of bread in many cultural cuisines.
Wheat is the most commonly used cereal for baking bread. It
has been cultivated roughly 10,000 years ago as part of the
Cell M
Neolithic agricultural revolution (Salamini et al., 2002) and
nowadays is the most commonly grown grain worldwide,
with approximately 750 million metric tons produced annually
(USDA, 2016). The high penetrance of wheat bread into most
human cultures and its long-lasting consumption suggest that
humans and their gut microbiome have adapted to metabolizing
wheat bread. However, commonly consumed present-day
bread greatly differs from traditional wheat bread in many
ways, including the degree of refinement, type of leavening
agent, preparation process, and additives used.
Whole grains contain germ and bran, which contain dietary fi-
ber, B vitamins, iron, magnesium, and zinc (Slavin et al., 2001)
and are therefore considered ‘‘healthy,’’ but they are removed
in the milling process of refined flour. Scientific evidence
regarding the health benefits of whole-grain consumption are
contradictory. Several studies regard consumption of whole
grains as advantageous to human health and suggest that it is
associated with a significantly lower all-cause mortality (Aune
et al., 2016); a reduced risk of cancer (Jacobs et al., 1998), car-
diovascular disease (Mellen et al., 2008; Mente et al., 2009), type
II diabetes mellitus (TIIDM; deMunter et al., 2007), and the meta-
bolic syndrome (Lutsey et al., 2007); and an improvement in gly-
cemic control (Pereira et al., 2002), cholesterol levels (Giacco
et al., 2010; Jensen et al., 2006; Sofi et al., 2010), blood pressure
(Tighe et al., 2010), inflammation (Katcher et al., 2008; Montonen
et al., 2013; Vanegas et al., 2017; Vitaglione et al., 2015), and liver
functions (Montonen et al., 2013). Conversely, some of the above
studies show improvement in only a handful of clinical markers
(Giacco et al., 2010; Jensen et al., 2006; Sofi et al., 2010; Tighe
et al., 2010; Vitaglione et al., 2015), and additional large-scale in-
terventional crossover trials show no significant effect on these
disease-risk markers (Andersson et al., 2007; Brownlee et al.,
2010; Costabile et al., 2008; Giacco et al., 2010; Tucker et al.,
2010). Yet additional studies claim that whole-grain bread con-
sumption may lead to a decrease in mineral absorption (Bach
Kristensen et al., 2005; Reinhold et al., 1976).
The use of baker’s yeast (Saccharomyces cerevisiae) as a
leavening agent is a recent widely used addition to bread
etabolism 25, 1243–1253, June 6, 2017 ª 2017 Elsevier Inc. 1243

Table 1. Cohort Description
SW Group
(Mean ± SD)
WS Group
(Mean ± SD)
KS
p Value
Number of
subjects (n)
10 10 –
Sex (% female) 60% 50% 1
Age (y) 39.1 ± 14.3 37.3 ± 8.9 0.68
BMI (kg/m2) 26.5 ± 5.6 24.6 ± 5.3 0.97
HbA1c (%) 5.19 ± 0.23 5.13 ± 0.19 0.68
Total cholesterol
(mg/dL)
191 ± 40 171 ± 26 0.31
Waist-to-hip
circumference ratio
0.81 ± 0.08 0.80 ± 0.08 0.97
Systolic blood
pressure (mmHg)
119 ± 17 119 ± 25 0.68
Diastolic blood
pressure (mmHg)
77 ± 8 79 ± 19 0.97
WS, white bread consumption followed by sourdough bread consump-
tion. SW, sourdough bread consumption followed by white bread con-
sumption. KS, Kolmogorov-Smirnov test.
making, dating back only�150 years (Batt and Tortorello, 2014).
In contrast, sourdough, which contains a culture of mostly wild
yeast as well as lactic and acetic acid bacteria that naturally
inoculate bread dough, has been used as a leavening agent
since ancient times (Minervini et al., 2014). Sourdough fermenta-
tion releases several compounds that are not found in modern
yeast fermentation, and sourdough breads were shown to in-
crease mineral bioavailability (Arendt et al., 2007; Leenhardt
et al., 2005; Lopez et al., 2003) and to induce advantageous ef-
fects on glucose metabolism (Lappi et al., 2010). Lastly, a very
recent addition to bread making is the introduction of additives
such as food preservatives and emulsifiers, whose roles are to
improve the shelf-life and texture of commercial bread. Some
emulsifiers were suggested to alter the gut microbiome in mice
in a manner that induces inflammation and obesity (Chassaing
et al., 2015).
The contradictory evidence regarding the effects of whole
grains in bread on human health and the relatively poor evidence
regarding the effects of sourdough fermentationmaybea result of
a large variability in even seemingly identical bread types, stem-
ming from differences in bread ingredients, additives, the propor-
tions inwhich they are used, andpreparationmethods.Moreover,
sourdough fermentation depends on environmental bacterial and
fungal strains that may vary compositionally and functionally
across different bakeries. One way in which bread, a carbohy-
drate-rich food, exerts its metabolic effects is through the post-
prandial glycemic response (PPGR) induced by its consumption.
PPGRs are an important aspect of human metabolic health.
Postprandial hyperglycemia is an independent risk factor for car-
diovascular disease (Gallwitz, 2009) and liver cirrhosis (Nishida
et al., 2006) and is associated with markers of glycemic control
(Zeevi et al., 2015), obesity (Blaak et al., 2012; Zeevi et al.,
2015), and enhanced all-cause mortality in both TIIDM (Cavalot
et al., 2011) and cancer (Lamkin et al., 2009).
The high interpersonal variability in the PPGR to identical
foods, recently described by us and by others (Matthan et al.,
1244 Cell Metabolism 25, 1243–1253, June 6, 2017
2016; Zeevi et al., 2015), may constitute another previously
disregarded reason to the different conclusions reached by
different studies as to the effects of bread consumption on hu-
man physiology. A significant factor associated with this vari-
ability in PPGRs is the host gut microbiome (Zeevi et al., 2015),
highlighted in the past decade to critically contribute to human
health and to the risk of obesity, glucose intolerance, TIIDM,
hyperlipidemia, insulin resistance, and their metabolic compli-
cations (Le Chatelier et al., 2013; Karlsson et al., 2013; Qin
et al., 2012; Suez et al., 2014; Turnbaugh et al., 2006; Zhang
et al., 2013).
In this study, we performed a randomized crossover trial with
20 healthy subjects comparing the effects of traditionally milled
and prepared whole-grain sourdough bread and industrial white
bread made from refined wheat on multiple clinical and disease
markers and on the composition and function of the gut
microbiome.
RESULTS & DISCUSSION
No Difference in Treatment Effects between White andSourdough BreadTo examine the difference in the effect of bread type on multiple
clinical parameters and on the function and composition of the
gut microbiome, we performed a randomized crossover trial
with two 1-week-long periods of dietary intervention, separated
by a 2-week-long washout period. Following a 3-day run-in
period in which their dietary intake was characterized using
real-time logging to a smartphone application that we developed
(Zeevi et al., 2015), subjects received either industrial white
bread made from mostly refined wheat flour (locally known as
‘‘achid’’) from a major brand common in Israel (Table S1; herein-
after ‘‘white bread’’), or a sourdough-leavened bread made
from whole-grain wheat flour with traditional methods in an arti-
sanal bakery (STAR Methods; Table S1; hereinafter ‘‘sourdough
bread’’). Subjects were randomly assigned to two sequence
groups: white bread followed by sourdough bread (WS), or sour-
dough bread followed bywhite bread (SW). See Table 1 for group
characteristics and Figure S1 for a CONSORT flow diagram.
As the primary outcomes of this trial were measures of glyce-
mic control, consumption of different bread types in this trial was
matched based on the amount of available carbohydrates, a
main effector of the PPGR. Subjects were instructed to consume
50 g of available carbohydrates from bread every morning of the
week (145 g and 110 g of sourdough and white bread, respec-
tively, given in the form of standardized meals, STAR Methods)
and to supplement the rest of their regular diet with additional
bread of the same type. On the first intervention period, addi-
tional breadwas consumed ad libitum; while on the second inter-
vention period, available carbohydrates of supplemented bread
were matched to the first intervention period (Figure 1A). Sub-
jects were also instructed not to consume additional wheat
products during the intervention periods, including bread that
was not supplied to them, pasta, and any other wheat-based
products (Table S2 lists major food items consumed before
and throughout the trial).
During the intervention periods, subjects consumed, on a daily
average, over 100 g of available carbohydrates from bread, a
significant increase from an average of 42.2 ± 24.5 g during
Gut microbiomeBlood tests
AnthropometricsOral GTT
Standardized meals
Sourdough bread
Sourdough breadWhite bread
White bread
Week 1Morning meals + ad-libitum
WashoutTwo weeks
Week 2Bread consumption matched20 participants
B B B B B B
Increased with Sourdough Bread
Increased with White Bread
Effect of Bread Type (95% Confidence Interval)
Iron (µg/dl)
HDL Cholesterol (mg/dl)
CRP (mg/l)
Urea (mg/dl)
Weight (kg.)
LDL Cholesterol (mg/dl)
LDH (IU/l)
OGTT Resp. (mg/dl*h)
Cholesterol, t. (mg/dl)
TSH (mIU/ml)
BMR (KJ)
Dias. BP (mmHg)
GGT (U/l)
Sys. BP (mmHg)
Wakeup Glucose (mg/dl)
Triglycerides (mg/dl)
Creatinine (mg/dl)
ALT (IU/l)
AST (IU/l)
Calcium (mg/dl)
A
B White Bread Sourdough Bread
OG
TT R
esp.
(mg/
dl*h
)
C
White Bread Sourdough Bread
Wak
eup
Glu
cose
(mg/
dl)D
-10.5
0.21
2.4
3.5
0.03
17.1
6.7
9.2
4
6.6
102
0.4
4.9
16.8
7.1
3.6
0.35
2
0.04
1
3.1
-3.3
-0.06
-2.5
-0.4
-4
-7.9
-13.1
-3.7
-0.3
-64
-2.6
-1.4
-2.9
-1.8
-3.6
-0.006
-0.6
-0.4
-0.03
White bread first (WS) Sourdough bread first (SW)Median value
p-va
lue
E
Increased with Sourdough Bread
Increased with White Bread Effect size
Significant at FDR < 0.1
Non-significantEubacterium ventriousum
p-va
lue
F
Increased with Sourdough Bread
Increased with White Bread Effect size
Significant at FDR < 0.1
Non-significantAnaerostipes
Metagenomic species 16S genera
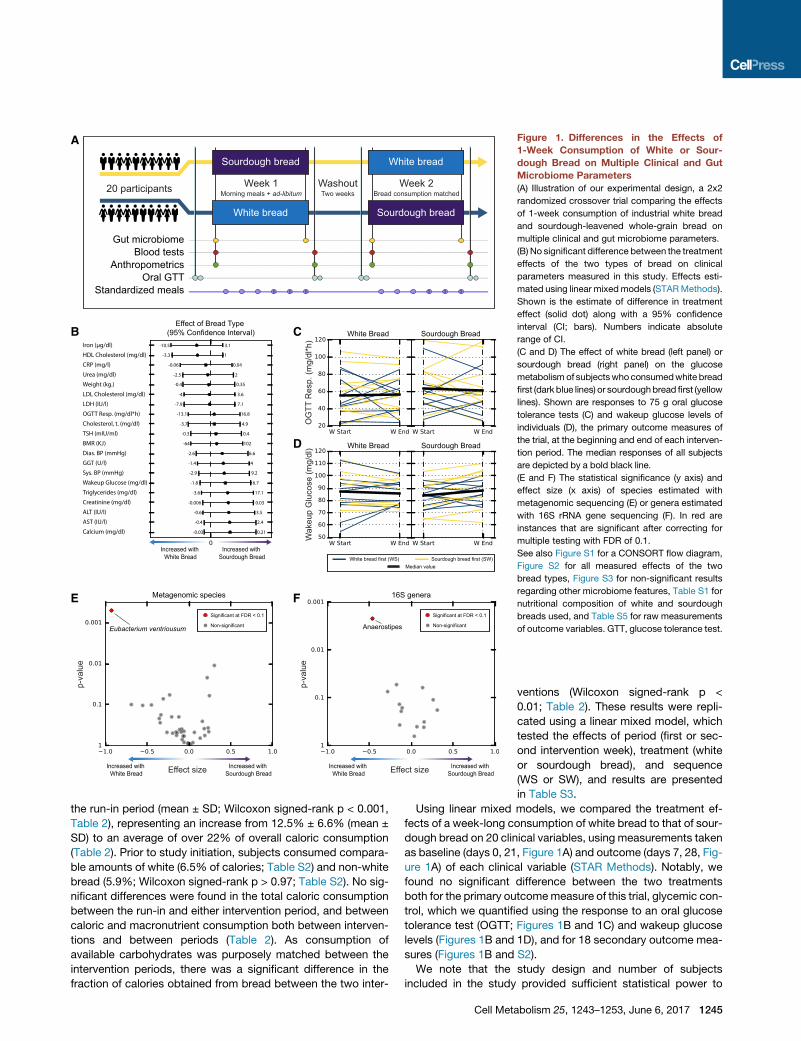
Figure 1. Differences in the Effects of
1-Week Consumption of White or Sour-
dough Bread on Multiple Clinical and Gut
Microbiome Parameters
(A) Illustration of our experimental design, a 2x2
randomized crossover trial comparing the effects
of 1-week consumption of industrial white bread
and sourdough-leavened whole-grain bread on
multiple clinical and gut microbiome parameters.
(B) No significant difference between the treatment
effects of the two types of bread on clinical
parameters measured in this study. Effects esti-
mated using linear mixedmodels (STARMethods).
Shown is the estimate of difference in treatment
effect (solid dot) along with a 95% confidence
interval (CI; bars). Numbers indicate absolute
range of CI.
(C and D) The effect of white bread (left panel) or
sourdough bread (right panel) on the glucose
metabolismof subjectswhoconsumedwhite bread
first (dark blue lines) or sourdoughbread first (yellow
lines). Shown are responses to 75 g oral glucose
tolerance tests (C) and wakeup glucose levels of
individuals (D), the primary outcome measures of
the trial, at the beginning and end of each interven-
tion period. The median responses of all subjects
are depicted by a bold black line.
(E and F) The statistical significance (y axis) and
effect size (x axis) of species estimated with
metagenomic sequencing (E) or genera estimated
with 16S rRNA gene sequencing (F). In red are
instances that are significant after correcting for
multiple testing with FDR of 0.1.
See also Figure S1 for a CONSORT flow diagram,
Figure S2 for all measured effects of the two
bread types, Figure S3 for non-significant results
regarding other microbiome features, Table S1 for
nutritional composition of white and sourdough
breads used, and Table S5 for raw measurements
of outcome variables. GTT, glucose tolerance test.
the run-in period (mean ± SD; Wilcoxon signed-rank p < 0.001,
Table 2), representing an increase from 12.5% ± 6.6% (mean ±
SD) to an average of over 22% of overall caloric consumption
(Table 2). Prior to study initiation, subjects consumed compara-
ble amounts of white (6.5% of calories; Table S2) and non-white
bread (5.9%; Wilcoxon signed-rank p > 0.97; Table S2). No sig-
nificant differences were found in the total caloric consumption
between the run-in and either intervention period, and between
caloric and macronutrient consumption both between interven-
tions and between periods (Table 2). As consumption of
available carbohydrates was purposely matched between the
intervention periods, there was a significant difference in the
fraction of calories obtained from bread between the two inter-
Cell Met
ventions (Wilcoxon signed-rank p <
0.01; Table 2). These results were repli-
cated using a linear mixed model, which
tested the effects of period (first or sec-
ond intervention week), treatment (white
or sourdough bread), and sequence
(WS or SW), and results are presented
in Table S3.
Using linear mixed models, we compared the treatment ef-
fects of a week-long consumption of white bread to that of sour-
dough bread on 20 clinical variables, using measurements taken
as baseline (days 0, 21, Figure 1A) and outcome (days 7, 28, Fig-
ure 1A) of each clinical variable (STAR Methods). Notably, we
found no significant difference between the two treatments
both for the primary outcomemeasure of this trial, glycemic con-
trol, which we quantified using the response to an oral glucose
tolerance test (OGTT; Figures 1B and 1C) and wakeup glucose
levels (Figures 1B and 1D), and for 18 secondary outcome mea-
sures (Figures 1B and S2).
We note that the study design and number of subjects
included in the study provided sufficient statistical power to
abolism 25, 1243–1253, June 6, 2017 1245

Table 2. Nutrient Consumption before and during Intervention Weeks
Energy (kcal) Total Lipid (g) Protein (g) Carbs. (g)
Avail. Carbs.
from Bread (g)
Energy from
Bread (% kcal)
Run-In
(Mean ± SD) 2,154 ± 431 94.1 ± 21.1 84.8 ± 32.8 219.3 ± 52.1 42.2 ± 24.5 12.5 ± 6.6%
White-Sourdough (WS)
Week 1 (W; mean ± SD) 2,336 ± 588 97.2 ± 26.9 103.5 ± 45.2 250.2 ± 79.4 100.0 ± 41.0 22.1 ± 5.0%
Week 2 (S; mean ± SD) 2,166 ± 465 90.7 ± 20.5 99.0 ± 39.7 244.7 ± 64.3 101.4 ± 40.7 26.0 ± 6.2%
Sourdough-White (SW)
Week 1 (S; mean ± SD) 2,187 ± 600 95.3 ± 29.3 89.6 ± 43.0 255.6 ± 56.5 107.2 ± 29.2 28.0 ± 5.2%
Week 2 (W; mean ± SD) 2,230 ± 494 91.1 ± 25.2 84.8 ± 31.5 261.0 ± 55.1 107.8 ± 29.8 25.5 ± 5.7%
Wilcoxon Signed-Rank Test p Values
Run-in versus Week 1 0.146 0.655 0.041* 0.006** 0.0002*** 0.0003***
Run-in versus Week 2 0.093 0.794 0.057 0.003** 0.0002*** 0.0002***
Week 1 versus Week 2 0.456 0.279 0.314 1.000 0.391 0.526
Run-in versus White 0.053 0.941 0.048* 0.005** 0.0002*** 0.0003***
Run-in versus Sourdough 0.156 0.941 0.048* 0.002** 0.0002*** 0.0002***
Sourdough versus White 0.093 0.709 0.794 0.766 0.794 0.002**
* p < 0.05, ** p < 0.01, *** p < 0.001. Avail., available; Carbs., carbohydrates. See also Table S2 for fraction of calories obtained from specific food items
and Table S3 for a replication of this analysis with linear mixed models.
capture a change as small as one standard deviation from ex-
pected change with no intervention (given 20 subjects; Kenward
and Jones, 2003; Figure 1B). For example, the bounds of the
95% confidence interval for the effect of bread type on wakeup
glucose were smaller than 7 mg/dL. Similarly, the bounds for the
95% confidence interval for bread-type effect on body weight
were smaller than 400 g. Confidence intervals for estimates of
bread-type effect on all outcome variables are listed in Figure 1B.
We further note that some differences between the bread types
could have been masked by the difference in fraction of calories
obtained from bread, as well as by the increase in bread con-
sumption that was employed here compared to the regular diet
of the subjects.
Next, we sequenced DNA produced from stool samples
collected as baseline (days �1, 20) and outcome (days 6, 27)
with both metagenomic and 16S rRNA gene sequencing. These
were used to calculate microbiota relative abundances at the
species (metagenome), genus (16S), and phylum (16S) levels,
the relative abundances of KEGG pathways and modules (Kane-
hisa and Goto, 2000; STAR Methods), and the Shannon a-diver-
sity index (16S OTUs and metagenomic species). We employed
the same linear mixed models to assess the difference in treat-
ment effect and found that the relative abundances of both
Eubacterium ventriosum species and the Anaerostipes genus
significantly increased with white bread consumption compared
to sourdough bread consumption (p < 0.001 FDR corrected at
0.1,Figures1Eand1F).Notably,bothE. ventriosumandmembers
of the Anaerostipes genus are butyrate producers (Munoz-Tam-
ayo et al., 2011; Tims et al., 2013), a short-chain fatty acid that
was previously suggested to protect against colon cancer (Lup-
ton, 2004) and obesity (Lin et al., 2012) and to abrogate colonic
inflammation (Segain et al., 2000). Conversely, E. ventriosum
was previously associated with obesity in a study of monozygotic
twinsdiscordant for it (Timset al., 2013).Nosignificantdifferences
in treatment effect were found for a-diversity (p > 0.4) for the
1246 Cell Metabolism 25, 1243–1253, June 6, 2017
phylum level relative abundances (Figure S3A) or for functional
properties of the microbiome (Figures S3B and S3C).
One-Week-Long Consumption of Bread Alters MultipleBlood MarkersGiven the lack of differential treatment effects on clinical param-
eters between white and sourdough bread, we next asked
whether consumption of bread, regardless of its type, for
1 week affects metabolic and clinical markers. To this end, we
performed a post hoc analysis and compared the value of
each parameter at the beginning and the end of the first interven-
tion week, examining all 20 subjects jointly. We note that this is a
within-group comparison, limited by the absence of a control
group, and that some effects could possibly stem from trial
participation per se rather than bread consumption.
Notably, we found that a single week of bread consumption re-
sulted in changes to multiple clinical variables and risk factors
(Figures 2A–2K) that were statistically significant, albeit numeri-
cally small and not necessarily clinically significant. We found a
significant decrease in levels of the essential minerals calcium,
iron, and magnesium (Wilcoxon signed-rank p < 0.001, p <
0.01, and p < 0.01, respectively; Figures 2A, 2D, and 2F),
in accordance with previous studies (Bach Kristensen et al.,
2005; McCance and Widdowson, 1942; Reinhold et al., 1976),
and a significant increase in the levels of lactate dehydrogenase
(LDH; p < 0.01; Figure 2E), a marker of tissue damage. We also
found a significant decrease in the levels of liver enzymes aspar-
tate aminotransferase (AST; p < 0.005; Figure 2B); gamma-
glutamyl transpeptidase (GGT; p < 0.005; Figure 2C); alanine
aminotransferase (ALT; p < 0.05; Figure 2I), markers of liver
function; C-reactive protein (CRP), a commonly used marker of
inflammation (p < 0.05; Figure 2K); and creatinine (p < 0.05; Fig-
ure 2J), a marker of kidney function. We found a significant
decrease in both total and low-density lipoprotein (LDL) choles-
terol levels (p < 0.05 for both; Figure 2G,H) but no significant

Calcium LDH MagnesiumAST GGT Iron
Cholesterol, t. LDL Cholesterol ALT Creatinine CRP HDL Cholesterol
A B C D E F
G H I J K L
ΔW
1 (m
g/dl
)
ΔW
1 (IU
/l)
ΔW
1 (U
/l)
ΔW
1 (μ
g/dl
)
ΔW
1 (IU
/l)
ΔW
1 (m
g/dl
)
ΔW
1 (m
g/dl
)
ΔW
1 (m
g/dl
)
ΔW
1 (IU
/l)
ΔW
1 (m
g/dl
)
ΔW
1 (m
g/l)
ΔW
1 (m
g/dl
)
p<0.005p<0.001 p<0.005 p<0.01p<0.01 p<0.01
p<0.05p<0.05 p<0.05 p<0.05p<0.05 n.s.
White bread consumer Sourdough bread consumer 95% confidence interval
Figure 2. One-Week Dietary Intervention of Bread Consumption, Independent of Bread Type, Affects Multiple Clinical Parameters
(A–K) Changes in clinical parameters between the start and end of the first intervention week in analysis that combines white bread consumers (blue dots) and
sourdough bread consumers (purple dots), showing a statistically significant increase in blood lactate dehydrogenase (LDH; E); a significant decrease in blood
calcium (A), aspartate aminotransferase (AST; B), gamma-glutamyl transpeptidase (GGT; C), iron (D), magnesium (F), total (T.; G) and LDL (H) cholesterol, alanine
aminotransferase (ALT; I), creatinine (J), and C-reactive protein (CRP; K); and no significant change in HDL cholesterol (L). p values were calculated using
Wilcoxon signed-rank test, corrected formultiple hypotheses testing using FDR at 0.1. Also shown are 95%confidence intervals for the change in each parameter
(gray lines). See also Figure S4 of all additional non-significant changes in clinical parameters.
change in high-density lipoprotein (HDL) cholesterol levels (Fig-
ure 2L). Non-significant changes in other outcome variables
are shown in Figure S4. Overall, and despite the limitations of
this analysis, understanding the effect of different foods on clin-
ical parameters is a first step toward combining different foods in
order to personally tailor diets that produce clinical effects.
Overall Microbiota Composition Is Resilient to BreadConsumptionSeveral studies indicated that even short-term dietary interven-
tions, whether animal-based, plant-based (David et al., 2014),
or involving barley bread consumption (Kovatcheva-Datchary
et al., 2015), result in significant, rapid, and reproducible alter-
ations to the gut microbiome.
Subjects in our study provided stool samples from the start
and end of each intervention period, days�1, 6, 20, and 27 (Fig-
ure 1A; STAR Methods). We performed a principal coordinate
analysis (PCoA) of microbial species abundances (Figure 3A,
derived from metagenome sequencing) and of OTUs abun-
dances (Figure S5A, derived from 16S rRNA gene sequencing)
and found a significant clustering of the microbiota composi-
tions of each subject, which remained similar to themselves
throughout the crossover trial (ANOVA p < 10�20 for species, Fig-
ure 3A; p < 10�20 for OTUs, Figure S5A). Analysis with ANCOM
(Mandal et al., 2015) found 126 out of 175 species and 565
out of 604 OTUs to separate significantly between different
individuals throughout the trial (FDR < 0.1).
To evaluate the magnitude of changes in microbiota composi-
tion, we compared it to that of the changes in the run-in period of
a previous trial in which microbiome samples were collected
but no dietary intervention was performed (Zeevi et al., 2015;
Table S4 lists baseline characteristics; STAR Methods), using
abundances estimated using both 16S rRNA gene and meta-
genomic sequencing (STAR Methods). We found no signifi-
cant differences in a-diversity (Shannon) between baseline and
outcome measurements of both intervention weeks (Wilcoxon
p > 0.4 for species, Figure 3B; p > 0.05 for OTUs, Figure S5B)
concurrent with lack of significant changes in the non-interven-
tional cohort. We found no significant differences in the change
to a-diversity of metagenomic species between the intervention
Cell Metabolism 25, 1243–1253, June 6, 2017 1247
PC1 (14.2%; Separation p<10-20)
PC
2 (1
3.6%
; Sep
arat
ion
p<10
-20 )
A
PC1 (13.6%)
PC
2 (7
.9%
)
E
B
C
DΔ
alph
a di
vers
ity (a
.u.)
beta
div
ersi
ty (a
.u.)
Person ellipse
Microbiomesample
Bread intervention Subject #2 in breadintervention
No intervention(retrospective)
Subject #2 with nointervention
InterventionWeek 1
InterventionWeek 2
ReferenceCohort (No
Intervention)
n.s.
n.s.
n.s.
n.s.
InterventionWeek 1
InterventionWeek 2
ReferenceCohort (No
Intervention)
alph
a di
vers
ity (a
.u.)
InterventionWeek 1
InterventionWeek 2
ReferenceCohort (No
Intervention)
Baseline BaselineOutcome Outcome Start End
n.s. n.s. n.s.PCoA of metagenomic species
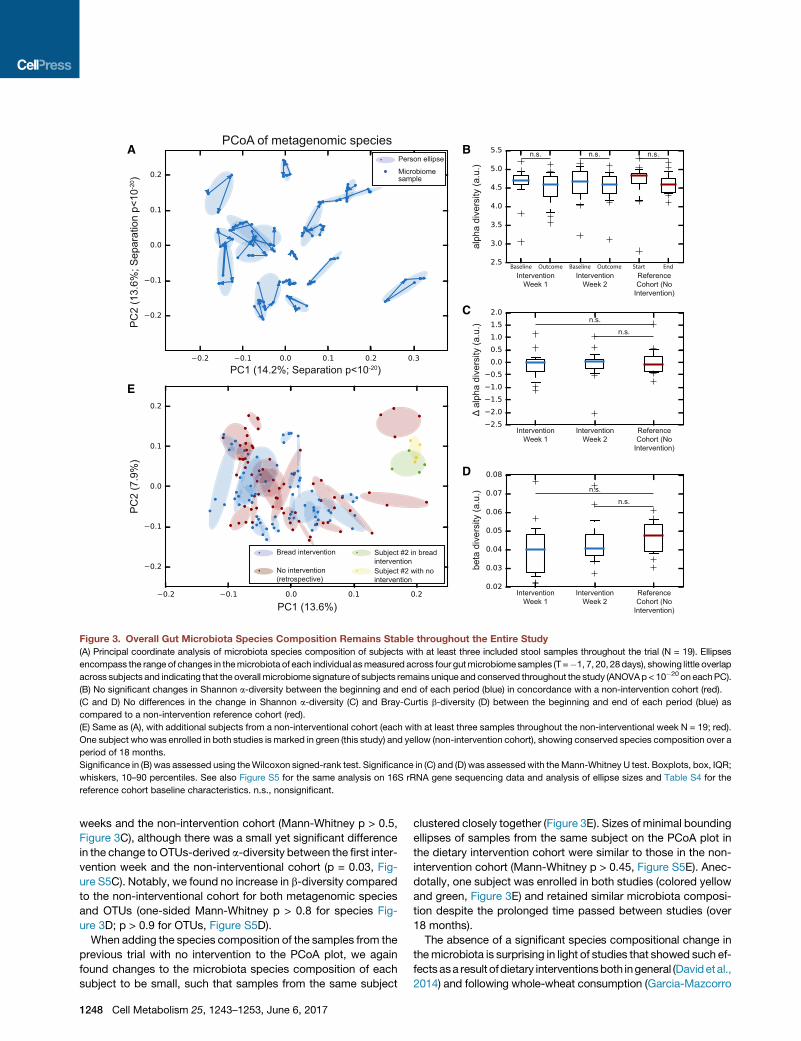
Figure 3. Overall Gut Microbiota Species Composition Remains Stable throughout the Entire Study
(A) Principal coordinate analysis of microbiota species composition of subjects with at least three included stool samples throughout the trial (N = 19). Ellipses
encompass the range of changes in themicrobiota of each individual asmeasured across four gutmicrobiomesamples (T =�1, 7, 20, 28days), showing little overlap
across subjects and indicating that the overall microbiome signature of subjects remains unique and conserved throughout the study (ANOVAp< 10�20 on eachPC).
(B) No significant changes in Shannon a-diversity between the beginning and end of each period (blue) in concordance with a non-intervention cohort (red).
(C and D) No differences in the change in Shannon a-diversity (C) and Bray-Curtis b-diversity (D) between the beginning and end of each period (blue) as
compared to a non-intervention reference cohort (red).
(E) Same as (A), with additional subjects from a non-interventional cohort (each with at least three samples throughout the non-interventional week N = 19; red).
One subject whowas enrolled in both studies is marked in green (this study) and yellow (non-intervention cohort), showing conserved species composition over a
period of 18 months.
Significance in (B) was assessed using theWilcoxon signed-rank test. Significance in (C) and (D) was assessedwith theMann-Whitney U test. Boxplots, box, IQR;
whiskers, 10–90 percentiles. See also Figure S5 for the same analysis on 16S rRNA gene sequencing data and analysis of ellipse sizes and Table S4 for the
reference cohort baseline characteristics. n.s., nonsignificant.
weeks and the non-intervention cohort (Mann-Whitney p > 0.5,
Figure 3C), although there was a small yet significant difference
in the change toOTUs-derived a-diversity between the first inter-
vention week and the non-interventional cohort (p = 0.03, Fig-
ure S5C). Notably, we found no increase in b-diversity compared
to the non-interventional cohort for both metagenomic species
and OTUs (one-sided Mann-Whitney p > 0.8 for species Fig-
ure 3D; p > 0.9 for OTUs, Figure S5D).
When adding the species composition of the samples from the
previous trial with no intervention to the PCoA plot, we again
found changes to the microbiota species composition of each
subject to be small, such that samples from the same subject
1248 Cell Metabolism 25, 1243–1253, June 6, 2017
clustered closely together (Figure 3E). Sizes of minimal bounding
ellipses of samples from the same subject on the PCoA plot in
the dietary intervention cohort were similar to those in the non-
intervention cohort (Mann-Whitney p > 0.45, Figure S5E). Anec-
dotally, one subject was enrolled in both studies (colored yellow
and green, Figure 3E) and retained similar microbiota composi-
tion despite the prolonged time passed between studies (over
18 months).
The absence of a significant species compositional change in
themicrobiota is surprising in light of studies that showed such ef-
fects asa result ofdietary interventionsboth ingeneral (Davidetal.,
2014) and following whole-wheat consumption (Garcia-Mazcorro
0
0
Sta
ndar
d de
viat
ions
Density
Freq
uenc
y (#
of m
eals
)
Standard Deviations
B
C* **** **
White bread
White bread w/butter
S.D. bread
S.D. bread w/butter
p<10-10
mea
n iA
UC
Whi
te -
mea
n iA
UC
Sou
rdou
gh (m
g/dl
*h)
A
Higher response
to white bread
Higher response
to sourdough bread
SW group subject
WS group subjectExpected White bread White bread
w/butterSourdough
breadSourdough
bread w/butter
True
pos
itive
rate
False positive rate
PPGR inducing breadclassification ROC curve
(area = 0.83)
D
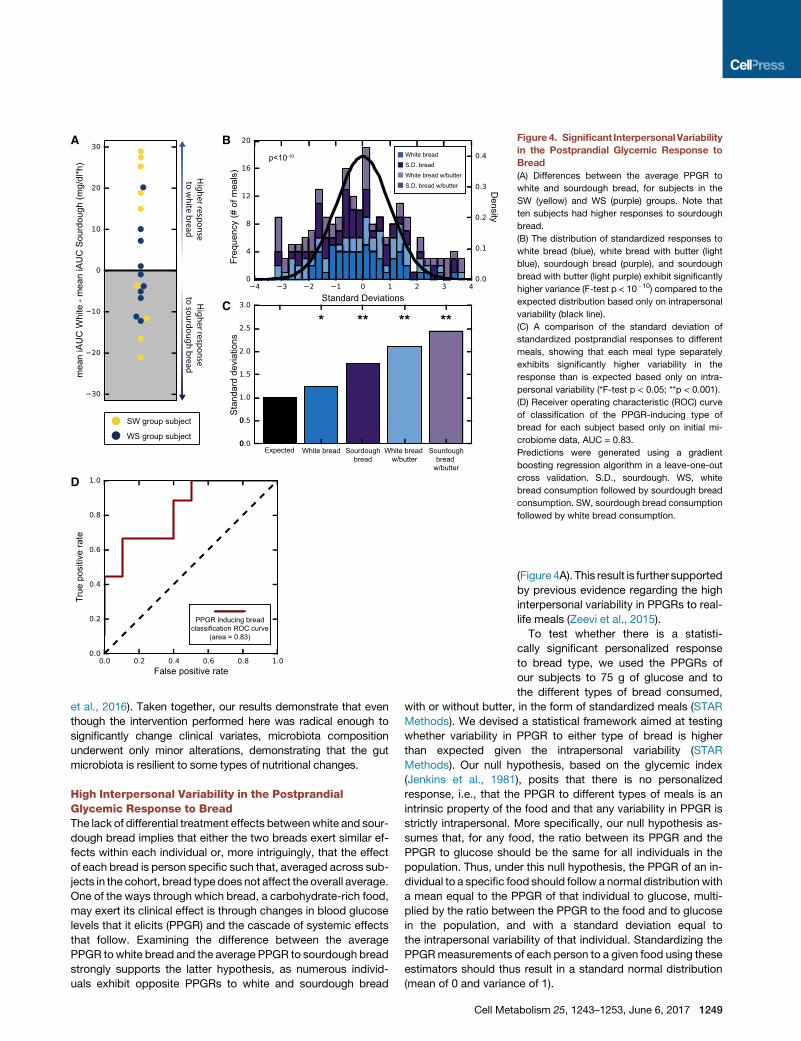
Figure 4. Significant InterpersonalVariability
in the Postprandial Glycemic Response to
Bread
(A) Differences between the average PPGR to
white and sourdough bread, for subjects in the
SW (yellow) and WS (purple) groups. Note that
ten subjects had higher responses to sourdough
bread.
(B) The distribution of standardized responses to
white bread (blue), white bread with butter (light
blue), sourdough bread (purple), and sourdough
bread with butter (light purple) exhibit significantly
higher variance (F-test p < 10�10) compared to the
expected distribution based only on intrapersonal
variability (black line).
(C) A comparison of the standard deviation of
standardized postprandial responses to different
meals, showing that each meal type separately
exhibits significantly higher variability in the
response than is expected based only on intra-
personal variability (*F-test p < 0.05; **p < 0.001).
(D) Receiver operating characteristic (ROC) curve
of classification of the PPGR-inducing type of
bread for each subject based only on initial mi-
crobiome data, AUC = 0.83.
Predictions were generated using a gradient
boosting regression algorithm in a leave-one-out
cross validation. S.D., sourdough. WS, white
bread consumption followed by sourdough bread
consumption. SW, sourdough bread consumption
followed by white bread consumption.
et al., 2016). Taken together, our results demonstrate that even
though the intervention performed here was radical enough to
significantly change clinical variates, microbiota composition
underwent only minor alterations, demonstrating that the gut
microbiota is resilient to some types of nutritional changes.
High Interpersonal Variability in the PostprandialGlycemic Response to BreadThe lack of differential treatment effects betweenwhite and sour-
dough bread implies that either the two breads exert similar ef-
fects within each individual or, more intriguingly, that the effect
of each bread is person specific such that, averaged across sub-
jects in the cohort, bread type does not affect the overall average.
One of the ways through which bread, a carbohydrate-rich food,
may exert its clinical effect is through changes in blood glucose
levels that it elicits (PPGR) and the cascade of systemic effects
that follow. Examining the difference between the average
PPGR towhite bread and the average PPGR to sourdough bread
strongly supports the latter hypothesis, as numerous individ-
uals exhibit opposite PPGRs to white and sourdough bread
Cell Met
(Figure 4A). This result is further supported
by previous evidence regarding the high
interpersonal variability in PPGRs to real-
life meals (Zeevi et al., 2015).
To test whether there is a statisti-
cally significant personalized response
to bread type, we used the PPGRs of
our subjects to 75 g of glucose and to
the different types of bread consumed,
with or without butter, in the form of standardized meals (STAR
Methods). We devised a statistical framework aimed at testing
whether variability in PPGR to either type of bread is higher
than expected given the intrapersonal variability (STAR
Methods). Our null hypothesis, based on the glycemic index
(Jenkins et al., 1981), posits that there is no personalized
response, i.e., that the PPGR to different types of meals is an
intrinsic property of the food and that any variability in PPGR is
strictly intrapersonal. More specifically, our null hypothesis as-
sumes that, for any food, the ratio between its PPGR and the
PPGR to glucose should be the same for all individuals in the
population. Thus, under this null hypothesis, the PPGR of an in-
dividual to a specific food should follow a normal distributionwith
a mean equal to the PPGR of that individual to glucose, multi-
plied by the ratio between the PPGR to the food and to glucose
in the population, and with a standard deviation equal to
the intrapersonal variability of that individual. Standardizing the
PPGRmeasurements of each person to a given food using these
estimators should thus result in a standard normal distribution
(mean of 0 and variance of 1).
abolism 25, 1243–1253, June 6, 2017 1249

Notably, when performing this standardization process and
comparing the distribution of standardized meals with the ex-
pected standard normal, we observe significantly higher vari-
ance both when combining all meals (F-test for equality of two
variances [Jones, 1994] p < 10�10; Figure 4B) and when each
meal type is considered separately (p < 0.05; Figure 4C).
This result indicates that individuals exhibit personalized
PPGRs to bread, reinforcing our previous finding that a major
source of variability in response to food is interpersonal (Zeevi
et al., 2015). Thus, to the extent that the effect of a food onmeta-
bolic parameters is partly mediated by the PPGR induced by that
food, our results suggest that such personalized glycemic re-
sponses should be measured and accounted for when evalu-
ating the effects of food. We hypothesize that this may explain
several contradictions in the literature regarding the effects of
different foods.
Prediction of Personal Glycemic-Response-InducingBread Using Microbiome FeaturesFollowing the significant interpersonal variability that we de-
tected in the PPGRs to the different meal types and the manifes-
tation of opposite PPGRs to the two bread types, we next asked
whether we could predict from baseline measures in advance
whether it is white or sourdough bread that will induce lower gly-
cemic responses for each individual.
As a reference, we note that the published glycemic index for
similar bread types was 70 and 54 for white bread and sour-
dough bread, respectively (Foster-Powell et al., 2002). As the
glycemic index inherently ignores inter-individual differences, it
would result in wrong classification for the ten subjects who
had lower glycemic responses to white bread than to sourdough
bread (Figure 4A).
Wedevised aclassification algorithmbasedongradient boost-
ing regression (Friedman, 2001), as these algorithms can model
complex non-linear relationships. We used only features derived
from the baseline microbiome sample (collected at T = �1 days,
Figure 1A), namely the relative abundances of microbiome spe-
cies derived usingMetaPhlAn (Truong et al., 2015); relative abun-
dances ofmicrobial genes, KEGGmodules, andKEGGpathways
(Kanehisa and Goto, 2000); and the ratio of metagenomic reads
mapped to the human genome, to the integrated reference cata-
log of the human gut microbiome (Li et al., 2014), and to a collec-
tion of complete microbial genomes (STAR Methods).
Weevaluated theperformanceof ourmodel using the standard
leave-one-out cross validation (CV) scheme, whereby a model is
trained on all subjects except one and thenproduces aprediction
for the left-out subject. In each CV fold, we performed extensive
feature selection to ensure that the number of features is not
excessive considering the number of training examples, thereby
reducing the risk of overfitting. To reduce the immense feature
space of microbial gene relative abundances, we performed a
principal component analysis (PCA) on the training set of each
CV and selected four PCs. For species, pathways, and modules
abundances, we removed sparse features and those correlated
to other features across the training set of each CV and then re-
tained only the top six features best correlated with the outcome
in the training set of each CV fold.
Notably, the model predictions were highly accurate with an
area under the receiver operating characteristic (ROC) curve
1250 Cell Metabolism 25, 1243–1253, June 6, 2017
(AUC) of 0.83 (Figure 4D), demonstrating that the glycemic-
response-inducing bread can be accurately classified for each
subject using only microbiome data. We note that further
research is needed to validate these results on additional
data. Fitting the prediction algorithm on all subjects combined
revealed that some of the informative features were the
MetaPhlAn-derived relative abundances of Coprobacter fastid-
iosus and Lachnospiraceae bacterium 3_1_46FAA.
While exact mechanisms for the effect of the gut microbiota on
glycemic control are yet to be elucidated, our highly accurate
predictor demonstrates that personalized bread responses can
be predicted and that such predictors can bear clinical signifi-
cance. Moreover, as this prediction was based on data derived
from stool samples, it demonstrates the adequacy of this proxy
measurement in such a prediction.
CONCLUSIONS
In this study, we found no significant differences on a broad array
of clinical parameters between two 1-week-long dietary inter-
ventions, one including consumption of industrial white bread
made from refined wheat and the other consumption of sour-
dough-leavened bread made from whole grains using traditional
methods. This was despite statistically significant, albeit small,
changes in the levels of the same parameters following the first
week of bread consumption, regardless of its type. Gut micro-
biome analysis revealed differential treatment effects between
the two types of bread in only two taxa and showed that the
microbiota composition remained generally stable and person
specific throughout this trial. Finally, using a rigorous statistical
framework, we showmarked and highly significant interpersonal
variation in the glycemic response to the two types of bread, with
some subjects featuring a higher response to one bread and
some to the other. We further show that the type of bread that in-
duces higher glycemic responses could be predicted for each
subject using only microbiome data.
Understanding the interpersonal variation in the effect of
bread, one of the most-consumed staple foods, would allow
the personalization of bread-related nutritional recommenda-
tions and optimization of food choices worldwide. More broadly,
our study underlines the importance of personalization in dietary
recommendations, as even the straightforward comparison
of breads commonly considered ‘‘healthy’’ and ‘‘unhealthy’’ re-
vealed personal effects on PPGR, suggesting that universal die-
tary recommendations may have limited efficacy.
STAR+METHODS
Detailed methods are provided in the online version of this paper
and include the following:
d KEY RESOURCES TABLE
d CONTACT FOR REAGENT AND RESOURCE SHARING
d EXPERIMENTAL MODEL AND SUBJECT DETAILS
B Main study cohort
B Reference cohort
d METHOD DETAILS
B Clinical trial
B Exclusion and inclusion criteria

B Outcome variables
B Bread preparation
B Standardized meals
B Drug usage
B Gut microbiome sampling and sequencing
B Gut microbiome analysis
B Reference cohort
d QUANTIFICATION AND STATISTICAL ANALYSIS
B Statistical analyses
B Classification of PPGR inducing bread type
B Measurement of interpersonal variability
d DATA AND SOFTWARE AVAILABILITY
d ADDITIONAL RESOURCES
SUPPLEMENTAL INFORMATION
Supplemental Information includes five figures and five tables and can
be found with this article online at http://dx.doi.org/10.1016/j.cmet.2017.
05.002.
AUTHOR CONTRIBUTIONS
T.K. and D.Z. conceived the project, designed the study, designed and con-
ducted all analyses, interpreted the results, and wrote the manuscript. T.K.
and D.Z. equally contributed to this work and are listed in random order.
N.Z. designed the study and interpreted the results. O.W. and N.B. assisted
in analyses. A.W. designed the study, directed sample sequencing, and
together with M.L.-P. and T.A.-S. performed metagenomic extraction and
sequencing. M.L.-P. performed 16S sequencing. G.M., N.K., and M.R. de-
signed the study and coordinated data collection. J.S. designed the study.
B.Z.G., A.A.L., E.E., and E.S. conceived the project and designed the study.
A.A.L, E.E., and E.S. designed and conducted the analyses, interpreted the re-
sults, and wrote the manuscript.
CONFLICTS OF INTEREST
E.S. and E.E. are paid scientific consultants for DayTwo Inc.
ACKNOWLEDGMENTS
We thank the Segal and Elinav group members for fruitful discussions, Ohad
Manor for his help with analyses, Naomi Avivi-Ragolsky for technical help,
Anomarel Ogen for baking the sourdough bread, and Amnon Berezin from
Kemach Haaretz for milling the flour. T.K. and D.Z are supported by the Minis-
try of Science, Technology, and Space, Israel. T.K. is supported by the Foulkes
Foundation. E.E. is supported by Yael and Rami Ungar, Israel; the Leona M.
and Harry B. Helmsley Charitable Trust; the Gurwin Family Fund for Scientific
Research; the Crown Endowment Fund for Immunological Research; the es-
tate of Jack Gitlitz; the estate of Lydia Hershkovich; the Benoziyo Endowment
Fund for the Advancement of Science; the Adelis Foundation; John L. and Vera
Schwartz, Pacific Palisades; Alan Markovitz, Canada; Cynthia Adelson, Can-
ada; the estate of Samuel and Alwyn J. Weber; Mr. and Mrs. Donald L.
Schwarz, Sherman Oaks; grants funded by the European Research Council;
the Israel Science Foundation; and the Alon Foundation scholar award. E.E.
is the incumbent of the Rina Gudinski Career Development Chair and a senior
fellow of the Canadian Institute for Advanced Research (CIFAR). E.S. is sup-
ported by the Crown Human Genome Center; the Else Kroener Fresenius
Foundation; Donald L. Schwarz, Sherman Oaks, CA; Jack N. Halpern, New
York, NY; Leesa Steinberg, Canada; and grants funded by the European
Research Council and the Israel Science Foundation.
Received: November 8, 2016
Revised: March 12, 2017
Accepted: May 10, 2017
Published: June 6, 2017
REFERENCES
Andersson, A., Tengblad, S., Karlstrom, B., Kamal-Eldin, A., Landberg, R.,
Basu, S., Aman, P., and Vessby, B. (2007). Whole-grain foods do not affect
insulin sensitivity or markers of lipid peroxidation and inflammation in healthy,
moderately overweight subjects. J. Nutr. 137, 1401–1407.
Arendt, E.K., Ryan, L.A.M., and Dal Bello, F. (2007). Impact of sourdough on
the texture of bread. Food Microbiol. 24, 165–174.
Aune, D., Keum, N., Giovannucci, E., Fadnes, L.T., Boffetta, P., Greenwood,
D.C., Tonstad, S., Vatten, L.J., Riboli, E., andNorat, T. (2016). Whole grain con-
sumption and risk of cardiovascular disease, cancer, and all cause and cause
specific mortality: systematic review and dose-responsemeta-analysis of pro-
spective studies. BMJ 353, i2716.
Bach Kristensen, M., Tetens, I., Alstrup Jørgensen, A.B., Dal Thomsen, A.,
Milman, N., Hels, O., Sandstrom, B., and Hansen, M. (2005). A decrease in
iron status in young healthy women after long-term daily consumption of the
recommended intake of fibre-rich wheat bread. Eur. J. Nutr. 44, 334–340.
Batt, C.A., and Tortorello, M.-L., eds. (2014). Encyclopedia of Food
Microbiology, Second Edition (Academic Press).
Blaak, E.E., Antoine, J.-M., Benton, D., Bjorck, I., Bozzetto, L., Brouns, F.,
Diamant, M., Dye, L., Hulshof, T., Holst, J.J., et al. (2012). Impact of postpran-
dial glycaemia on health and prevention of disease. Obes. Rev. 13, 923–984.
Bolger, A.M., Lohse, M., and Usadel, B. (2014). Trimmomatic: a flexible
trimmer for Illumina sequence data. Bioinformatics 30, 2114–2120.
Brownlee, I.A., Moore, C., Chatfield, M., Richardson, D.P., Ashby, P.,
Kuznesof, S.A., Jebb, S.A., and Seal, C.J. (2010). Markers of cardiovascular
risk are not changed by increased whole-grain intake: the WHOLEheart study,
a randomised, controlled dietary intervention. Br. J. Nutr. 104, 125–134.
Caporaso, J.G., Kuczynski, J., Stombaugh, J., Bittinger, K., Bushman, F.D.,
Costello, E.K., Fierer, N., Pena, A.G., Goodrich, J.K., Gordon, J.I., et al.
(2010). QIIME allows analysis of high-throughput community sequencing
data. Nat. Methods 7, 335–336.
Cavalot, F., Pagliarino, A., Valle, M., Di Martino, L., Bonomo, K., Massucco, P.,
Anfossi, G., and Trovati, M. (2011). Postprandial blood glucose predicts car-
diovascular events and all-cause mortality in type 2 diabetes in a 14-year
follow-up: lessons from the San Luigi Gonzaga Diabetes Study. Diabetes
Care 34, 2237–2243.
Chassaing, B., Koren, O., Goodrich, J.K., Poole, A.C., Srinivasan, S., Ley, R.E.,
and Gewirtz, A.T. (2015). Dietary emulsifiers impact the mouse gut microbiota
promoting colitis and metabolic syndrome. Nature 519, 92–96.
Costabile, A., Klinder, A., Fava, F., Napolitano, A., Fogliano, V., Leonard, C.,
Gibson, G.R., and Tuohy, K.M. (2008). Whole-grain wheat breakfast cereal
has a prebiotic effect on the human gut microbiota: a double-blind, placebo-
controlled, crossover study. Br. J. Nutr. 99, 110–120.
David, L.A., Maurice, C.F., Carmody, R.N., Gootenberg, D.B., Button, J.E.,
Wolfe, B.E., Ling, A.V., Devlin, A.S., Varma, Y., Fischbach, M.A., et al.
(2014). Diet rapidly and reproducibly alters the human gut microbiome.
Nature 505, 559–563.
de Munter, J.S.L., Hu, F.B., Spiegelman, D., Franz, M., and van Dam, R.M.
(2007). Whole grain, bran, and germ intake and risk of type 2 diabetes: a pro-
spective cohort study and systematic review. PLoS Med. 4, e261.
Edgar, R.C. (2013). UPARSE: highly accurate OTU sequences from microbial
amplicon reads. Nat. Methods 10, 996–998.
FAO (Food and Agriculture Organization of the United Nations) (1998).
FAOSTAT Statistical Database. http://www.fao.org/faostat/en/#home.
Foster-Powell, K., Holt, S.H.A., and Brand-Miller, J.C. (2002). International
table of glycemic index and glycemic load values: 2002. Am. J. Clin. Nutr.
76, 5–56.
Friedman, J.H. (2001). Greedy function approximation: a gradient boosting
machine. Ann. Stat. 29, 1189–1232.
Gallwitz, B. (2009). Implications of postprandial glucose and weight control in
people with type 2 diabetes: understanding and implementing the International
Diabetes Federation guidelines. Diabetes Care 32 (Suppl 2 ), S322–S325.
Cell Metabolism 25, 1243–1253, June 6, 2017 1251

Garcia-Mazcorro, J.F., Ivanov, I., Mills, D.A., and Noratto, G. (2016). Influence
of whole-wheat consumption on fecal microbial community structure of obese
diabetic mice. PeerJ 4, e1702.
Giacco, R., Clemente, G., Cipriano, D., Luongo, D., Viscovo, D., Patti, L., Di
Marino, L., Giacco, A., Naviglio, D., Bianchi, M.A., et al. (2010). Effects of the
regular consumption of wholemeal wheat foods on cardiovascular risk factors
in healthy people. Nutr. Metab. Cardiovasc. Dis. 20, 186–194.
Jacobs, D.R., Jr., Marquart, L., Slavin, J., and Kushi, L.H. (1998). Whole-grain
intake and cancer: an expanded review and meta-analysis. Nutr. Cancer
30, 85–96.
Jenkins, D.J., Wolever, T.M., Taylor, R.H., Barker, H., Fielden, H., Baldwin,
J.M., Bowling, A.C., Newman, H.C., Jenkins, A.L., and Goff, D.V. (1981).
Glycemic index of foods: a physiological basis for carbohydrate exchange.
Am. J. Clin. Nutr. 34, 362–366.
Jensen, M.K., Koh-Banerjee, P., Franz, M., Sampson, L., Grønbaek, M., and
Rimm, E.B. (2006). Whole grains, bran, and germ in relation to homocysteine
and markers of glycemic control, lipids, and inflammation 1. Am. J. Clin.
Nutr. 83, 275–283.
Jones, D.H. (1994). ‘‘Statistical Methods,’’ 8th edition, by George W. Snedecor
and William G. Cochran. J. Educ. Behav. Stat. 19, 304–307.
Kanehisa, M., and Goto, S. (2000). KEGG: kyoto encyclopedia of genes and
genomes. Nucleic Acids Res. 28, 27–30.
Karlsson, F.H., Tremaroli, V., Nookaew, I., Bergstrom, G., Behre, C.J.,
Fagerberg, B., Nielsen, J., and B€ackhed, F. (2013). Gut metagenome in
European women with normal, impaired and diabetic glucose control.
Nature 498, 99–103.
Katcher, H.I., Legro, R.S., Kunselman, A.R., Gillies, P.J., Demers, L.M.,
Bagshaw, D.M., and Kris-Etherton, P.M. (2008). The effects of a whole
grain-enriched hypocaloric diet on cardiovascular disease risk factors in
men and women with metabolic syndrome. Am. J. Clin. Nutr. 87, 79–90.
Kenward, M.G., and Jones, B. (2003). The 2x2 cross-over trial. In Design and
Analysis of Cross-Over Trials, Second Edition (Chapman and Hall/CRC).
Korem, T., Zeevi, D., Suez, J., Weinberger, A., Avnit-Sagi, T., Pompan-Lotan,
M., Matot, E., Jona, G., Harmelin, A., Cohen, N., et al. (2015). Growth dynamics
of gutmicrobiota in health and disease inferred from singlemetagenomic sam-
ples. Science 349, 1101–1106.
Kovatcheva-Datchary, P., Nilsson, A., Akrami, R., Lee, Y.S., De Vadder, F.,
Arora, T., Hallen, A., Martens, E., Bjorck, I., and B€ackhed, F. (2015). Dietary fi-
ber-induced improvement in glucosemetabolism is associated with increased
abundance of prevotella. Cell Metab. 22, 971–982.
Lamkin, D.M., Spitz, D.R., Shahzad, M.M.K., Zimmerman, B., Lenihan, D.J.,
Degeest, K., Lubaroff, D.M., Shinn, E.H., Sood, A.K., and Lutgendorf, S.K.
(2009). Glucose as a prognostic factor in ovarian carcinoma. Cancer 115,
1021–1027.
Lappi, J., Selinheimo, E., Schwab, U., Katina, K., Lehtinen, P., Mykk€anen, H.,
Kolehmainen, M., and Poutanen, K. (2010). Sourdough fermentation of whole-
meal wheat bread increases solubility of arabinoxylan and protein and de-
creases postprandial glucose and insulin responses. J. Cereal Sci. 51,
152–158.
Le Chatelier, E., Nielsen, T., Qin, J., Prifti, E., Hildebrand, F., Falony, G.,
Almeida, M., Arumugam, M., Batto, J.-M., Kennedy, S., et al.; MetaHIT con-
sortium (2013). Richness of human gut microbiome correlates with metabolic
markers. Nature 500, 541–546.
Leenhardt, F., Levrat-Verny, M.-A., Chanliaud, E., and Remesy, C. (2005).
Moderate decrease of pH by sourdough fermentation is sufficient to reduce
phytate content of whole wheat flour through endogenous phytase activity.
J. Agric. Food Chem. 53, 98–102.
Li, J., Jia, H., Cai, X., Zhong, H., Feng, Q., Sunagawa, S., Arumugam, M.,
Kultima, J.R., Prifti, E., Nielsen, T., et al.; MetaHIT Consortium; MetaHIT
Consortium (2014). An integrated catalog of reference genes in the human
gut microbiome. Nat. Biotechnol. 32, 834–841.
Lin, H.V., Frassetto, A., Kowalik, E.J., Jr., Nawrocki, A.R., Lu, M.M., Kosinski,
J.R., Hubert, J.A., Szeto, D., Yao, X., Forrest, G., and Marsh, D.J. (2012).
Butyrate and propionate protect against diet-induced obesity and regulate
1252 Cell Metabolism 25, 1243–1253, June 6, 2017
gut hormones via free fatty acid receptor 3-independent mechanisms. PLoS
ONE 7, e35240.
Lopez, H.W., Duclos, V., Coudray, C., Krespine, V., Feillet-Coudray, C.,
Messager, A., Demigne, C., and Remesy, C. (2003). Making bread with sour-
dough improves mineral bioavailability from reconstituted whole wheat flour
in rats. Nutrition 19, 524–530.
Lupton, J.R. (2004). Microbial degradation products influence colon cancer
risk: the butyrate controversy. J. Nutr. 134, 479–482.
Lutsey, P.L., Jacobs, D.R., Jr., Kori, S., Mayer-Davis, E., Shea, S., Steffen,
L.M., Szklo, M., and Tracy, R. (2007). Whole grain intake and its cross-
sectional association with obesity, insulin resistance, inflammation, diabetes
and subclinical CVD: the MESA study. Br. J. Nutr. 98, 397–405.
Mandal, S., Van Treuren, W., White, R.A., Eggesbø, M., Knight, R., and
Peddada, S.D. (2015). Analysis of composition of microbiomes: a novel
method for studying microbial composition. Microb. Ecol. Health Dis. 26,
http://dx.doi.org/10.3402/mehd.v26.27663.
Marco-Sola, S., Sammeth, M., Guigo, R., and Ribeca, P. (2012). The GEM
mapper: fast, accurate and versatile alignment by filtration. Nat. Methods 9,
1185–1188.
Matthan, N.R., Ausman, L.M., Meng, H., Tighiouart, H., and Lichtenstein, A.H.
(2016). Estimating the reliability of glycemic index values and potential sources
of methodological and biological variability. Am. J. Clin. Nutr. 104, 1004–1013.
McCance, R.A., and Widdowson, E.M. (1942). Mineral metabolism of healthy
adults on white and brown bread dietaries. J. Physiol. 101, 44–85.
Mehrotra, D.V. (2014). A recommended analysis for 23 2 crossover trials with
baseline measurements. Pharm. Stat. 13, 376–387.
Mellen, P.B., Walsh, T.F., and Herrington, D.M. (2008). Whole grain intake and
cardiovascular disease: a meta-analysis. Nutr. Metab. Cardiovasc. Dis. 18,
283–290.
Mente, A., de Koning, L., Shannon, H.S., and Anand, S.S. (2009). A systematic
review of the evidence supporting a causal link between dietary factors and
coronary heart disease. Arch. Intern. Med. 169, 659–669.
Minervini, F., De Angelis, M., Di Cagno, R., and Gobbetti, M. (2014). Ecological
parameters influencing microbial diversity and stability of traditional sour-
dough. Int. J. Food Microbiol. 171, 136–146.
Montonen, J., Boeing, H., Fritsche, A., Schleicher, E., Joost, H.-G., Schulze,
M.B., Steffen, A., and Pischon, T. (2013). Consumption of red meat and
whole-grain bread in relation to biomarkers of obesity, inflammation, glucose
metabolism and oxidative stress. Eur. J. Nutr. 52, 337–345.
Munoz-Tamayo, R., Laroche, B., Walter, E., Dore, J., Duncan, S.H., Flint, H.J.,
and Leclerc, M. (2011). Kinetic modelling of lactate utilization and butyrate pro-
duction by key human colonic bacterial species. FEMS Microbiol. Ecol. 76,
615–624.
Nishida, T., Tsuji, S., Tsujii, M., Arimitsu, S., Haruna, Y., Imano, E., Suzuki, M.,
Kanda, T., Kawano, S., Hiramatsu, N., et al. (2006). Oral glucose tolerance test
predicts prognosis of patients with liver cirrhosis. Am. J. Gastroenterol.
101, 70–75.
Pereira, M.A., Jacobs, D.R., Jr., Pins, J.J., Raatz, S.K., Gross, M.D., Slavin,
J.L., and Seaquist, E.R. (2002). Effect of whole grains on insulin sensitivity in
overweight hyperinsulinemic adults. Am. J. Clin. Nutr. 75, 848–855.
Qin, J., Li, Y., Cai, Z., Li, S., Zhu, J., Zhang, F., Liang, S., Zhang, W., Guan, Y.,
Shen, D., et al. (2012). A metagenome-wide association study of gut micro-
biota in type 2 diabetes. Nature 490, 55–60.
Reinhold, J.G., Faradji, B., Abadi, P., and Ismail-Beigi, F. (1976). Decreased
absorption of calcium, magnesium, zinc and phosphorus by humans due to
increased fiber and phosphorus consumption as wheat bread. J. Nutr. 106,
493–503.
Salamini, F., Ozkan, H., Brandolini, A., Sch€afer-Pregl, R., and Martin, W.
(2002). Genetics and geography of wild cereal domestication in the near
east. Nat. Rev. Genet. 3, 429–441.
Segain, J.P., Raingeard de la Bletiere, D., Bourreille, A., Leray, V., Gervois, N.,
Rosales, C., Ferrier, L., Bonnet, C., Blottiere, H.M., and Galmiche, J.P. (2000).
Butyrate inhibits inflammatory responses through NFkappaB inhibition: impli-
cations for Crohn’s disease. Gut 47, 397–403.

Slavin, J.L., Jacobs, D., Marquart, L., and Wiemer, K. (2001). The role of whole
grains in disease prevention. J. Am. Diet. Assoc. 101, 780–785.
Sofi, F., Ghiselli, L., Cesari, F., Gori, A.M., Mannini, L., Casini, A., Vazzana, C.,
Vecchio, V., Gensini, G.F., Abbate, R., and Benedettelli, S. (2010). Effects of
short-term consumption of bread obtained by an old Italian grain variety on
lipid, inflammatory, and hemorheological variables: an intervention study.
J. Med. Food 13, 615–620.
Suez, J., Korem, T., Zeevi, D., Zilberman-Schapira, G., Thaiss, C.A., Maza, O.,
Israeli, D., Zmora, N., Gilad, S., Weinberger, A., et al. (2014). Artificial sweet-
eners induce glucose intolerance by altering the gut microbiota. Nature 514,
181–186.
Tighe, P., Duthie, G., Vaughan, N., Brittenden, J., Simpson, W.G., Duthie, S.,
Mutch,W.,Wahle, K., Horgan, G., and Thies, F. (2010). Effect of increased con-
sumption of whole-grain foods on blood pressure and other cardiovascular
risk markers in healthy middle-aged persons: a randomized controlled trial.
Am. J. Clin. Nutr. 92, 733–740.
Tims, S., Derom, C., Jonkers, D.M., Vlietinck, R., Saris, W.H., Kleerebezem,
M., de Vos, W.M., and Zoetendal, E.G. (2013). Microbiota conservation and
BMI signatures in adult monozygotic twins. ISME J. 7, 707–717.
Truong, D.T., Franzosa, E.A., Tickle, T.L., Scholz, M., Weingart, G., Pasolli, E.,
Tett, A., Huttenhower, C., and Segata, N. (2015). MetaPhlAn2 for enhanced
metagenomic taxonomic profiling. Nat. Methods 12, 902–903.
Tucker, A.J., Mackay, K.A., Robinson, L.E., Graham, T.E., Bakovic, M., and
Duncan, A.M. (2010). The effect of whole grain wheat sourdough bread con-
sumption on serum lipids in healthy normoglycemic/normoinsulinemic and hy-
perglycemic/hyperinsulinemic adults depends on presence of the APOE E3/E3
genotype: a randomized controlled trial. Nutr. Metab. (Lond.) 7, 37.
Turnbaugh, P.J., Ley, R.E., Mahowald, M.A., Magrini, V., Mardis, E.R., and
Gordon, J.I. (2006). An obesity-associated gut microbiome with increased ca-
pacity for energy harvest. Nature 444, 1027–1031.
USDA (United States Department of Agriculture) (2016). World Agricultural
Supply and Demand Estimates. https://www.usda.gov/oce/commodity/
wasde/.
Vanegas, S.M., Meydani, M., Barnett, J.B., Goldin, B., Kane, A., Rasmussen,
H., Brown, C., Vangay, P., Knights, D., Jonnalagadda, S., et al. (2017).
Substituting whole grains for refined grains in a 6-wk randomized trial has a
modest effect on gut microbiota and immune and inflammatory markers of
healthy adults. Am. J. Clin. Nutr. 105, 635–650.
Vitaglione, P., Mennella, I., Ferracane, R., Rivellese, A.A., Giacco, R., Ercolini,
D., Gibbons, S.M., La Storia, A., Gilbert, J.A., Jonnalagadda, S., et al. (2015).
Whole-grain wheat consumption reduces inflammation in a randomized
controlled trial on overweight and obese subjects with unhealthy dietary and
lifestyle behaviors: role of polyphenols bound to cereal dietary fiber. Am. J.
Clin. Nutr. 101, 251–261.
Zeevi, D., Korem, T., Zmora, N., Israeli, D., Rothschild, D., Weinberger, A.,
Ben-Yacov, O., Lador, D., Avnit-Sagi, T., Lotan-Pompan, M., et al. (2015).
Personalized nutrition by prediction of glycemic responses. Cell 163,
1079–1094.
Zhang, X., Shen, D., Fang, Z., Jie, Z., Qiu, X., Zhang, C., Chen, Y., and Ji, L.
(2013). Human gut microbiota changes reveal the progression of glucose intol-
erance. PLoS ONE 8, e71108.
Cell Metabolism 25, 1243–1253, June 6, 2017 1253

STAR+METHODS
KEY RESOURCES TABLE
REAGENT or RESOURCE SOURCE IDENTIFIER
Biological Samples
Stool samples of reference cohort used for 16S rDNA
amplification and sequencing
Zeevi et al., 2015 N/A
Critical Commercial Assays
PowerMag Soil DNA isolation kit MoBio Laboratories N/A
Deposited Data
Raw sequence files, 16S sequencing, reference cohort This paper ENA: PRJEB17643
Raw sequence files, metagenomic sequencing,
reference cohort
Zeevi et al., 2015 ENA: PRJEB11532
Raw sequence files, main study cohort This paper ENA: PRJEB17643
Human reference genome UCSC (https://genome.ucsc.edu) hg19
KEGG: Kyoto Encyclopedia of Genes and Genomes Kanehisa and Goto, 2000 http://www.genome.jp/kegg/;
RRID: SCR_012773
Integrated reference catalog of the human gut
microbiome
Li et al., 2014 http://meta.genomics.cn
Database of complete bacterial genomes Korem et al., 2015 Available upon request from
Oligonucleotides
16S PCR primer: GTGCCAGCMGCCGCGGTAA IDT (http://www.idtdna.com/site) 515F
16S PCR primer: GGACTACHVGGGTWTCTAAT IDT (http://www.idtdna.com/site) 806R
Software and Algorithms
Trimmomatic v. 0.32 Bolger et al., 2014 http://www.usadellab.org/cms/
index.php?page=trimmomatic;
RRID: SCR_011848
GEM mapper build 1.376 Marco-Sola et al., 2012 https://sourceforge.net/projects/
gemlibrary/
USearch8.0 Edgar, 2013 http://www.drive5.com/usearch/
QIIME 1.8.0 Caporaso et al., 2010 http://qiime.org/; RRID: SCR_008249
MetaPhlAn2 Truong et al., 2015 https://bitbucket.org/biobakery/
metaphlan2; RRID: SCR_004915
SAS v. 9.4 SAS institute https://www.sas.com;
RRID: SCR_004635
Other
Measurements of outcome variables This paper Table S5
CONTACT FOR REAGENT AND RESOURCE SHARING
Further information and requests for resources and reagents should be directed to and will be fulfilled by the Lead Contact, Eran Se-
gal ([email protected]).
EXPERIMENTAL MODEL AND SUBJECT DETAILS
Main study cohortTwenty healthy adults were included in this study, including nine males (four in SW, five in WS) and 11 females (six in SW, five in WS),
27-66 years of age (38.2 ± 11.3 [mean ± SD], Table 1 for group characteristics). Study protocol was approved by Tel Aviv Sourasky
Medical Center Institutional Review Board (IRB), approval numbers TLV-0658-12, TLV-0050-13 and TLV-0522-10. All subjects
signed written informed consent forms.
e1 Cell Metabolism 25, 1243–1253.e1–e5, June 6, 2017

Reference cohortAnalyzed here are samples from a previous trial (Zeevi et al., 2015). Baseline characteristics of all subjects analyzed are given in
Table S4.
METHOD DETAILS
Clinical trialThis study was a single-center randomized crossover trial, performed at the Weizmann Institute of Science, Israel. No changes were
done to the study protocol and methods after the trial commenced.
Thirty-four subjects were recruited for this study throughout February 2016. 12 potential subjects withdrew due to personal rea-
sons or study requirements and twowere excluded due to exclusion criteria, all before randomization. Randomized group allocations
were computer generated with no restrictions. Recruitment and follow-up were performed by certified clinical research associates.
Twenty healthy subjects were eventually randomized without any restrictions, and the trial took place between February 21st and
April 5th, 2016 (Figure S1).
The trial was completed as planned. All twenty subjects completed the trial and there were no drop-outs or withdrawals. No
adverse effects were reported by any of the study subjects. Adherence to the interventions was assessed using real-time logging
of all meals consumed, performed on a proprietary smartphone application that we developed (Zeevi et al., 2015).
Exclusion and inclusion criteriaAll subjects fulfilled the following inclusion criteria: males and females, aged 18-70, who are currently not following any diet regime or
dietitian consultation and are able to provide informed consent and technically operate a glucometer for oral glucose tolerance test
(OGTT) and the calibration of the CGM. Exclusion criteria included: (i) pregnancy or fertility treatments; (ii) usage of antibiotics or an-
tifungals within three months prior to participation; (iii) chronically active inflammatory or neoplastic disease in the three years prior to
enrollment; (iv) chronic gastrointestinal disorder, including Inflammatory Bowel Disease and Celiac disease; (v) skin disease,
including contact dermatitis, precluding proper attachment of the CGM; (vi) active neuropsychiatric disorder; (vii) myocardial infarc-
tion or cerebrovascular accident in the 6 months prior to participation; (viii) coagulation disorders; (ix) chronic immunosuppressive
medication usage; (x) pre-diagnosed type I or type II diabetes mellitus or treatment with anti-diabetic medication. Adherence to in-
clusion and exclusion criteria was validated by medical doctors.
Outcome variablesWemeasured outcome variables at baseline, after the first intervention period, after the washout period, and at the end of the second
intervention period (Figure 1A). Predetermined outcome variables consisted of: (a) blood tests, performed after fasting at days 0, 7, 21
and 28, measuring levels of: triglycerides, LDL cholesterol, HDL cholesterol, total cholesterol, ALT, AST, GGT, iron, calcium, creat-
inine, urea, thyroid stimulating hormone (TSH), LDH and CRP; (b) blood pressure measurements, taken with an automated blood
pressure monitor (M6 model, Omron, Hoofddorp, the Netherlands) at days 0, 7, 21 and 28; (c) weight and basal metabolic rate
(BMR) measurements, taken with the BC-418 Segmental Body Composition Analyzer (Tanita, Tokyo, Japan) at days 0, 7, 21 and
28; (d) average blood glucose levels in the 15 min following wakeup (referred as ‘‘wakeup glucose’’), taken as the average of four
continuous glucose monitor (CGM; iPro2 by Medtronic, MN, USA) measurements at days 1 & 2, 5 & 6, 22 & 23, and 26 & 27; (e) blood
glucose response to OGTT quantified as the incremental area under the glucose curve (iAUC with respect to the median glucose
in the 30 min prior to the meal; Zeevi et al., 2015), after consumption of 75 g of glucose, as measured with a blood glucose monitor
(Contour by Bayer AG, Leverkusen, Germany), and calculated as the average of two tests performed at days�6 &�5, 8 & 9, 15 & 16,
and 29 & 30; (f) andmicrobiome analyses, performed on stool samples taken within 24 hr of days�1, 6, 20 and 27. All measurements
are provided in Table S5.
Bread preparationFlour was freshly stone milled from hard red bread wheat (Triticum aestivum var. aestivum). The resulting flour was sifted in order to
remove only the largest particles of bran, resulting in a 98% ‘‘extraction rate’’ (1000 g of wheat yielded 980 g of flour). Loaves were
prepared using the following four ingredients: freshly stone milled flour as described above, water, salt and a mature sourdough
starter without any other additive. The overall formula for the bread was (in bakers’ percentage) 100% flour, 90% water, and
1.8% salt with the sourdough starter portion representing 37% of total flour weight (i.e., 20% of the flour in the formula had been
pre-fermented). The dough was kneaded in a planetary mixer, ‘‘bulk’’ fermented for 1 hr at 24�C and ‘‘retarded’’ at 4�C for 8 hr.
The dough was portioned into 1150 g pieces, shaped and transferred into loaf pans, where they underwent ‘‘proofing’’ (final rising)
for 2 hr at 24�C. The loaveswere baked in a stone hearth oven at 245�C for approximately 60min to obtain final loaf weight of 1kg after
baking.
The composition of the sourdough bread was determined by the food and water laboratory of Bactochem (Ness-Ziona, Israel), a
company certified by the Israeli Ministry of Health, except for the fiber content that was estimated from the USDA National Nutrient
Cell Metabolism 25, 1243–1253.e1–e5, June 6, 2017 e2

Database values ‘‘Basic Report 20080, Wheat flour, whole-grain’’ after subtracting 2% of the sifted bran. For the industrial bread, we
used manufacturer labeling. The composition of both bread types is depicted in Table S1.
Standardized mealsWe supplied our subjects with standardized meals at the start of each intervention week, according to the intervention type. Stan-
dardized meals were calculated to have 50 g of available carbohydrates. During the white bread intervention period, subjects
consumed 3 meals of 110 g white bread, and 3 meals of 110 g white bread + 30 g butter. During the sourdough bread intervention
period, subjects consumed 3 meals of 145 g sourdough bread, and 3 meals of 145 g sourdough bread + 30 g butter. Subjects were
instructed to consume these meals immediately after their night fast, not to modify the meal, and to refrain from eating or performing
strenuous physical activity before, and for 2 hr following consumption.
Drug usageIn the WS group, two subjects sporadically reported consumption of NSAIDs. One subject reported regular consumption of multivi-
tamins and omega 3. In the SW group, one subject reported regular consumption of vitamin D3, Eltroxin and Rampiril, and sporadic
consumption of antacids; one subject reported regular consumption of Losartan; one subject reported regular consumption of iron
supplementation; one subject reported consumption of birth control pills and multivitamins, and sporadic consumption of NSAIDs;
and one subject reported regular consumption of birth control pills and sporadic consumption of NSAIDs.
Gut microbiome sampling and sequencingSubjects self-sampled their stool using a swab following detailed printed instructions. Collected samples were immediately stored in
a home freezer (�20�C) and transferred in a provided cooler to our facilities, where they were stored at�80�C.We purified DNA using
PowerMag Soil DNA isolation kit (MoBio) optimized for Tecan automated platform. For shotgun sequencing, 100 ng of purified DNA
was sheared with a Covaris E220X sonicator. Illumina compatible libraries were prepared as described (Zeevi et al., 2015), and
sequenced on the Illumina NextSeq platform with a read length of 80bp to a depth of 8,429,912 ± 5,568,845 reads (mean ± SD).
Two samples with < 1M reads were removed from further analyses. For 16S rRNA gene sequencing, PCR amplification of the
V3/4 region using the 515F/806R 16S rRNA gene primers was performed followed by 500bp paired-end sequencing on the Illumina
Miseq platform to a depth of 77,872 ± 61,464 reads (mean ± SD). 2 samples were not analyzed due to technical issues in the 16S
rRNA gene amplification process. 2 samples with fewer than 30,000 reads were removed from further analyses. All 16S analyses
were performed following subsampling to 30,000 reads.
Gut microbiome analysisWe filtered metagenomic reads containing Illumina adapters, filtered low quality reads and trimmed low quality read edges using
Trimmomatic (Bolger et al., 2014). We detected host DNA by mapping with GEM (Marco-Sola et al., 2012) to the Human genome
(hg19) with inclusive parameters, and removed those reads. 16S analysis was performed using USearch8.0 (Edgar, 2013) using
the commands fastq_mergepairs, derep_fulllength, sortbysize, out_radius_pct, uchime_ref, usearch_global, followed by the script
assign_taxonomy.py from QIIME (Caporaso et al., 2010).
We obtained relative abundances (RA) from metagenomic sequencing via MetaPhlAn2 (Truong et al., 2015) with default parame-
ters.We assigned length-normalized RA of genes, obtained by similarmappingwith GEM to the reference catalog of (Li et al., 2014) to
KEGG Orthology (KO) entries (Kanehisa and Goto, 2000), and these were then normalized to sum to 1. Metagenomics-derived RAs
were capped at 10�5, while 16S rRNA-derived RAs were capped at 10�4.
PCoA was calculated on species (metagenomics) or OTUs (16S) RA, using Bray-Curtis dissimilarity. a-diversity for each individual
was calculated on species RA (metagenomics) or OTUs (16S) using the Shannon index. b-diversity was calculated using the Bray-
Curtis divergence between baseline and outcome samples in each intervention week and at the start and end of the run-in period of a
previous trial (Zeevi et al., 2015). Only taxa present in at least 10 samples were included in analyses, except when calculating
a-diversity.
Reference cohortAnalyzed here are samples from the run-in period of a dietary intervention trial from (Zeevi et al., 2015), in which no dietary intervention
was performed. For metagenomic samples previously generated sequences (Zeevi et al., 2015) were used. For 16S rRNA gene
sequencing, samples were processed anew as described above. Only subjects who had more than three samples collected were
included in the analysis in Figures 3A, 3E and S5A. Baseline characteristics of all subjects analyzed are given in Table S4.
QUANTIFICATION AND STATISTICAL ANALYSIS
Statistical analysesAnalysis of treatment effect in the crossover trial and calculation of 95% confidence interval was done using linear mixed models as
recommended (Mehrotra, 2014), using SAS version 9.4, estimating treatment effect with fixed effects for period, sequence group, the
e3 Cell Metabolism 25, 1243–1253.e1–e5, June 6, 2017

difference between baseline measurements at both intervention periods, and interaction between that difference and the period. No
other co-variates were included in the model. For the effect of bread on the gut microbiome (Figures 1E, 1F, and S3), only instances
(e.g., genus, module) with abundance above capping level observed in both weeks in at least 15 subjects were included in the anal-
ysis. Results were corrected for multiple hypothesis testing using FDR of 0.1 for each phylogenetic or functional level separately.
Analysis of general bread consumption effect was performed using Wilcoxon signed-rank test, with results corrected for multiple
hypothesis testing using FDR of 0.1.
Classification of PPGR inducing bread typeWe employed a stochastic gradient boosting regression algorithm which was trained on the difference between the average re-
sponses to white and sourdough bread divided by the average OGTT response, and tested against the true classification to two
categories of lower PPGRs to white or sourdough bread using leave-one-out cross validation (CV). The prediction used: (a) metage-
nomics-derived species (capped at 10�5), pathways andmodule abundances (corrected tomapping percentage to the gene catalog
of (Li et al., 2014)), of which, 6 non-sparse features were selected based on Pearson correlation to the target value in the training set of
each CV fold; (b) four principal components of composition of genes obtained by mapping to (Li et al., 2014), with principal compo-
nent analysis calculated only on the training set of each CV fold; (c) the number of said genes present in the samples; and (d) mapping
percentage to the human genome, the gene catalog, and a database of complete bacterial genomes (Korem et al., 2015).
Measurement of interpersonal variabilityTo calculate the expected PPGR ratio for each meal, for each subject, we average the PPGR to every standardized meal and divided
this average by their average PPGR to glucose:
RfðiÞ =PPGRfðiÞPPGRgluðiÞ
Where Rf(i) is the ratio of the response of subject i to food f, and PPGRfðiÞ is the average PPGR of subject i to food f. Next, we calcu-
late this average ratio in the population, excluding said subject, i.e., this calculation is performed for every subject, by only taking into
account other subjects:
Rfð:iÞ =1
n� 1
Xj = 1::n; jsi
RfðjÞ
Where n is the total number of subjects participating in the study. Rfð:iÞ is the PPGR ratio for food f used for future calculations
regarding subject i.
To calculate the expected response of each person to every food, for each subject we calculate PPGRgluðiÞ, the average response
of subject i to glucose, measured over 6-8 measurements. We estimate the expected response to food f by multiplying the average
response to glucose for each subject by the PPGR population-level ratio for food f excluding the subject in question:
P dPGRfðiÞ =PPGRgluðiÞ,Rfð:iÞ
We estimate the intra-individual standard deviation of the response to food f by constructing a random sample consensus
(RANSAC) linear model of subjects’ standard deviation of PPGR to glucose given their median PPGR to glucose. In this linear model
we do not fit an intercept (i.e., require that for a PPGR of 0, the estimated standard deviation is 0). Using this linear model we estimate:
dSDfðiÞ = lm
�P dPGRfðiÞ
�= lm
�PPGRgluðiÞ,Rfð:iÞ
�Where lm is the linear model in question.
The total expected standard deviation is therefore given by:
to dtSDfðiÞ = dSDfðiÞ,
ffiffiffiffiffiffiffiffiffiffiffiffiffiffiffiffiffiffiffiffiffiffiffiffiffiffi1+
1
N2gluðiÞ
!vuutWhere NgluðiÞ is number of measurements of glucose PPGR for subject i.
Standardization of the glucose response to every food f was performed by subtracting the estimated expected response to the
food and dividing by the estimated standard deviation:
SPPGRfðiÞ =PPGRfðiÞ � dPPGRfðiÞ
tot dSDfðiÞ
Where SPPGRfðiÞ is the standardized postprandial glycemic response of person i to food f. Under the null hypothesis of no inter-
personal variability, the distribution of SPPGRfðiÞ over all foods across all subjects is expected to be a standard normal distribution,
with mean 0 and variance 1.
Cell Metabolism 25, 1243–1253.e1–e5, June 6, 2017 e4
DATA AND SOFTWARE AVAILABILITY
Sequencing data has been deposited at the European Nucleotide Archive with accession ENA: PRJEB17643. All measurements of
outcome variables are available in Table S5.
ADDITIONAL RESOURCES
Trial was reported to clinicaltrials.gov, NCT: NCT02936362.
e5 Cell Metabolism 25, 1243–1253.e1–e5, June 6, 2017