Brazil: Responses to the Financial Crisis Responses to the Financial Crisis Lima, Peru March 2009...
59
1 Brazil: Responses to the Financial Crisis Lima, Peru March 2009 Mario Torós
Transcript of Brazil: Responses to the Financial Crisis Responses to the Financial Crisis Lima, Peru March 2009...
1
Brazil: Responses to theFinancial Crisis
Lima, PeruMarch 2009
Mario Torós

2
I. Domestic Economic Conditions

3
Domestic Demand x Supply
Domestic Demand
GDP
% against same quarter the year before
Source: IBGE
3.2
1.3
-4.5
-3.0
-1.5
0.0
1.5
3.0
4.5
6.0
7.5
9.0
1Q 03
3Q 03
1Q 04
3Q 04
1Q 05
3Q 05
1Q 06
3Q 06
1Q 07
3Q 07
1Q 08
4Q 08

4
Investment Growth
Source: IBGE
1Q99
1Q00
1Q01
1Q02
1Q03
1Q04
1Q05
1Q06
1Q07
1Q08
-15
-10
-5
0
5
10
15
20
annual growth1999/2003: -2.6%2004/2008: 9.9%
19.7
4Q08
3.8
% against same quarter the year before

5
Payroll
Source: IBGE
%
-8.2
1.6
4.25.9 5.8
6.97.8
-9.5
-7.5
-5.5
-3.5
-1.5
0.5
2.5
4.5
6.5
8.5
10.5
2003 2004 2005 2006 2007 2008Jan 09Jan 08

6
average 00/03664
average 04/081,415
thou
sand
average 95/99-323
-1,100
0
1,100
2,20019
95
1996
1997
1998
1999
2000
2001
2002
2003
2004
2005
2006
2007
2008
Job Creation
Source: MTE
1,452

7
Unemployment%
Source: IBGE
2004
20052006
2007
20087
8
9
10
11
12
13
Jan Feb Mar Apr May Jun Jul Aug Sep Oct Nov Dec6
6.8%

8
Credit Growth
Source: Banco Central
Jan
2004
=100
Households
Companies
Jan09/Jan08+23.2%
Jan09/Jan08 +37.2%
100130160190220250280310340370400
Jan 04
Jul 04
Jan 05
Jul 05
Jan 06
Jul 06
Jan 07
Jul 07
Jan 08
Jul 08
Jan 09
New loans (Jan09/Jan08)Companies -11.4Households -1.8total -8.1

9
Formal Job Creation
Source: MTE
mill
ion
-1.0
-0.5
0.0
0.5
1.0
1.5
2.0
2.5
Jan 95
Jan 96
Jan 97
Jan 98
Jan 99
Jan 00
Jan 01
Jan 02
Jan 03
Jan 04
Jan 05
Jan 06
Jan 07
Jan 08
Jan 09
2003645 thousand
average 1995-200249 thousand
average 2004-20081,415 thousand

10
Retail Sales20
03=1
00
3 month moving averageseasonally adjusted
Sources: IBGE and Banco Central
90
100
110
120
130
140
150
Jan 00
Jan 01
Jan 02
Jan 03
Jan 04
Jan 05
Jan 06
Jan 07
Jan 08
Jan 09
11
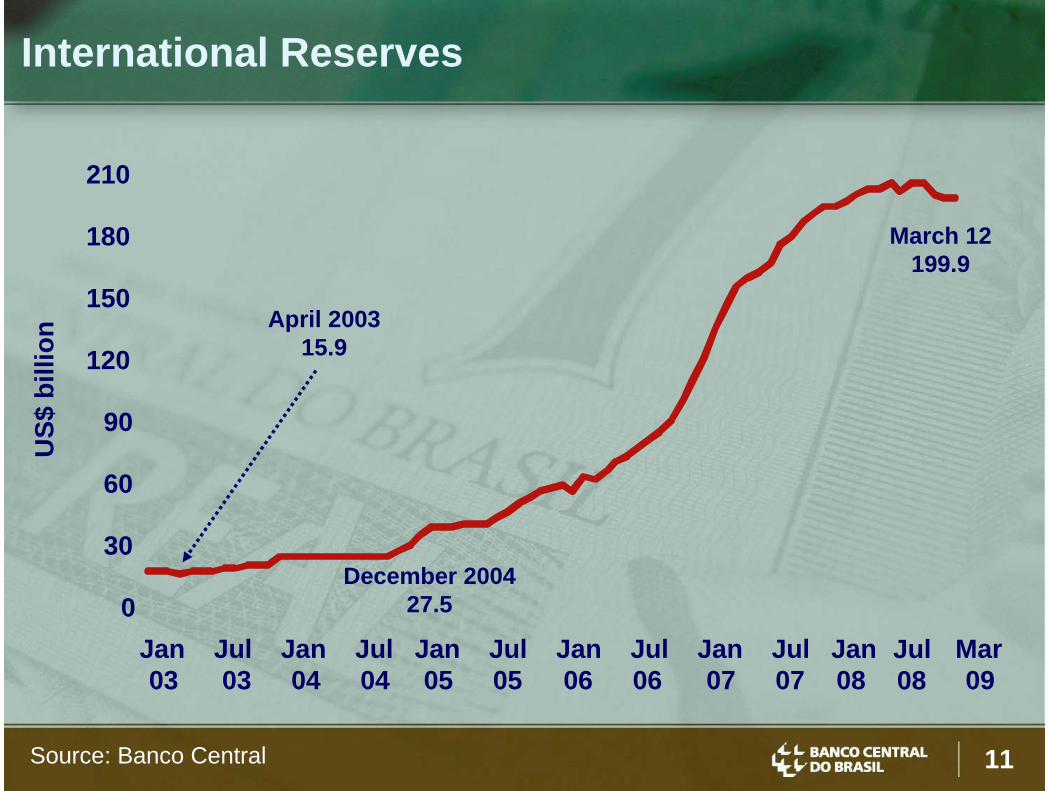
International ReservesU
S$ b
illio
n
Source: Banco Central
Jan 03
Jul 03
Jan 04
Jul04
Jan 05
Jul 05
Jan 06
Jul 06
Jan 07
Jul07
Jan 08
Mar 09
Jul08
December 200427.5
April 2003 15.9
March 12199.9
0
30
60
90
120
150
180
210

12
Public Sector External Debt/GDP%
Source: Banco Central
-5
0
5
10
15
20
25
30
35
40
45
90 92 94 96 98 00 02 04 06 08
Gross Debt/GDP Net Debt/GDP

13
Net External Debt x Sovereign Rating (S&P)
Sources: Banco Central and Bloomberg
US$
bill
ion
1Q 02
3Q 02
1Q 03
3Q 03
1Q 04
3Q 04
1Q 05
3Q 05
1Q 06
3Q 06
1Q 07
3Q 07
1Q 08
4Q 08
BBB-
BB+
BB
BB-
B+
BB-
-28.9
-40
0
40
80
120
160
200
14
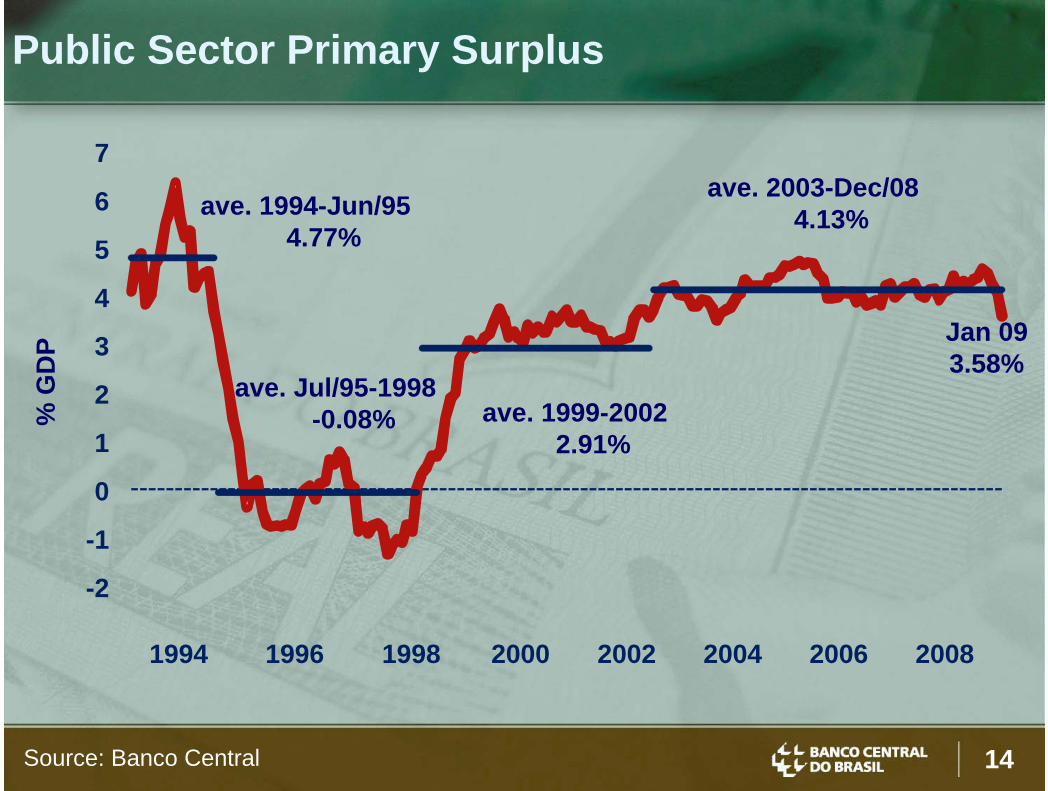
Public Sector Primary Surplus%
GD
P
Source: Banco Central
Jan 093.58%
ave. 1994-Jun/954.77%
ave. 1999-20022.91%
ave. 2003-Dec/084.13%
-2
-1
0
1
2
3
4
5
6
7
1994 1996 1998 2000 2002 2004 2006 2008
ave. Jul/95-1998-0.08%

15
% G
DP
Credit/GDP: Brazil x Central Economies - 2007
Sources: World Bank and Banco Central * January 2009
0
20
40
60
80
100
120
140
160
180
200
220
Brazil* Australia Sweden Canada Spain UK USA
41.2

16
Brazilian Banks: Capital Ratio
Source: Banco Central
%
Brazil 11%
Basel8%
6
8
10
12
14
16
18
20
2000 2001 2002 2003 2004 2005 2006 2007 2008
18.0%
Floor

17
Real Effective FX RateJu
n 94
=100
15 currency basket
Source: Banco Central
99.4
60
80
100
120
140
160
180
Jan 88
Jul 89
Jan 91
Jul 92
Jan 94
Jul 95
Jan 97
Jul 98
Jan 00
Jul 01
Jan 03
Jul 04
Jan 06
Jul 07
Jan 09

18
II. Crisis Impacts

19
“Commodities Boom and Bust”:CRB Index and Brazilian Terms of Trade
Sources: Funcex and Bloomberg
2006
=10
0
Terms of TradeCRB
Jan 03
Jul 03
Jan 04
Jul 04
Jan 05
Jul 05
Jan 06
Jul 06
Jan 07
Jul 07
Jan 08
Jan09
Jul 08
200
250
300
350
400
450
500
90
95
100
105
110
115

20
Commodities and Real FX Rate:Partial Offsetting
Jan
2006
= 1
00
Source: Bloomberg * March 6
Jan 06
Apr06
Jun 06
Sep06
Dec06
Mar 07
May07
Aug07
Nov 07
Feb08
May08
Jul 08
Oct08
Mar* 09
CRB/USD CRB/BRL
60
70
80
90
100
110
120
130
140

21
Stocks x Brazilian Real
Sources: Banco Central and BMFBovespa
poin
ts x
100
0
R$/
US$
Bovespa IndexFX Rate
1.50
1.75
2.00
2.25
2.50
25
35
45
55
65
75
Jun 07
Aug07
Oct07
Dec07
Feb08
Apr08
Jun 08
Jul 08
Sep08
Nov 08
Feb09

22
Industrial Output and Inflation (CPI)
USA EU Japan China Russia India Turkey South
Africal
Chile Colombia Mexico Peru Brazil
Sep 08 -6.3 -2.5 0.2 11.4 6.4 5.5 -4.2 4.7 3.6 -3.5 -2.2 ... 9.7
Oct 08 -4.2 -5.6 -7.1 8.2 1.7 -0.3 -8.5 -1.8 -0.8 -7.4 -2.3 ... 1.1
Nov 08 -5.9 -8.1 -16.6 5.4 -8.7 2.4 -13.9 -4.8 -5.7 -13.3 -5.4 ... -6.2
Dec 08 -7.8 ...-20.6 5.7 -10.2 ... ... ... -3.7 ... ... ... -14.5
USA EU Japan China Russia India Turkey South
Africa
Chile Colombia Mexico Peru Brazil
Sep 08 4.9 3.6 2.1 4.6 15.0 11.0 11.1 13.1 9.2 7.6 5.5 6.2 6.3
Oct 08 3.7 3.2 1.7 4.0 14.2 11.1 12.0 12.1 9.9 7.9 5.8 6.5 6.4
Nov 08 1.1 2.1 1.0 2.4 13.8 11.1 10.8 11.8 8.9 7.7 6.2 6.8 6.4
Dec 08 0.1 1.6 0.4 1.2 13.3 11.1 10.1 9.5 7.1 7.7 6.5 6.7 5.9
Dec-Sep (p.p.) -4.8 -2.0 -1.7 -3.4 -1.7 0.2 -1.0 -3.6 -2.1 0.1 1.1 0.4 -0.4
Industrial Output (% p.y.)
Inflation – Consumer Price Index (% p.y.)

23
Wholesale Prices
Source: FGV
% %
2
4
6
8
10
12
14
16
0
10
20
30
40
Jan 07
Mar 07
May07
Jul 07
Sep07
Nov 07
Jan 08
Mar 08
May08
Jul 08
Sep08
Nov 08
Jan 09
agricultureindustrial
in 12 months
24
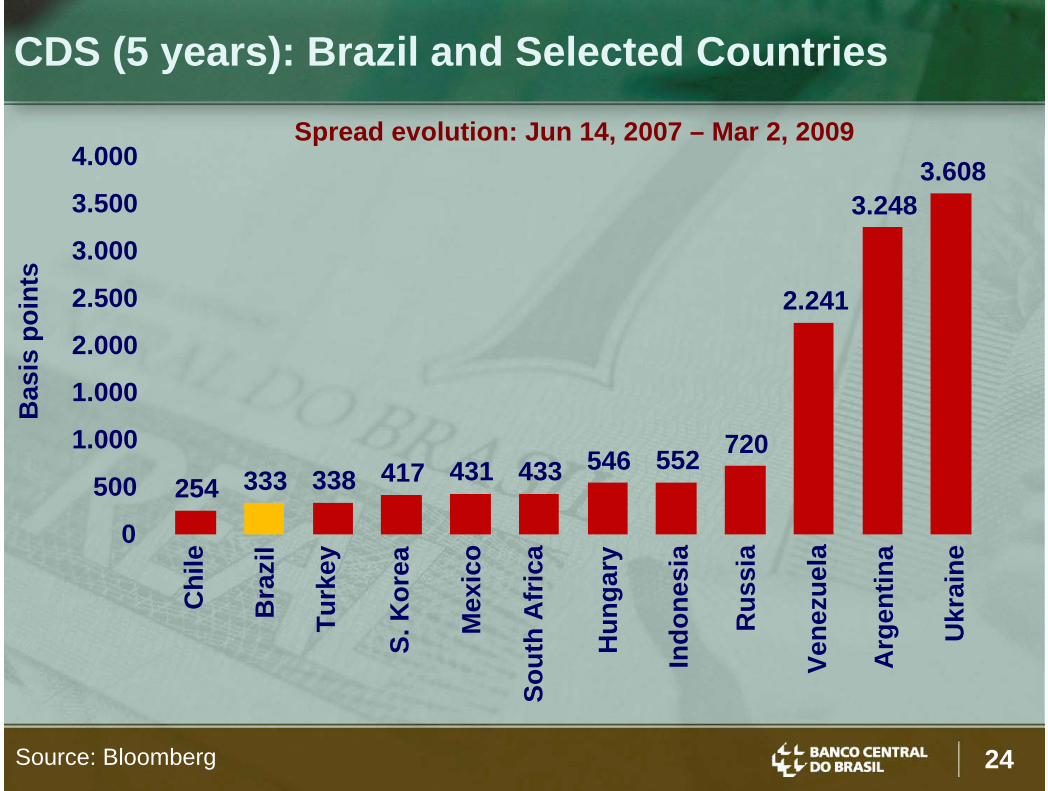
CDS (5 years): Brazil and Selected Countries
Source: Bloomberg
Spread evolution: Jun 14, 2007 – Mar 2, 2009
Chi
le
Turk
ey
Bra
zil
S. K
orea
Mex
ico
Sout
hA
fric
a
Indo
nesi
a
Hun
gary
Rus
sia
Vene
zuel
a
Arg
entin
a
Ukr
aine
Bas
ispo
ints
254 333 338 417 431 433 546 552 720
2.241
3.2483.608
0
500
1.000
1.000
2.000
2.500
3.000
3.500
4.000
25Source: Bloomberg
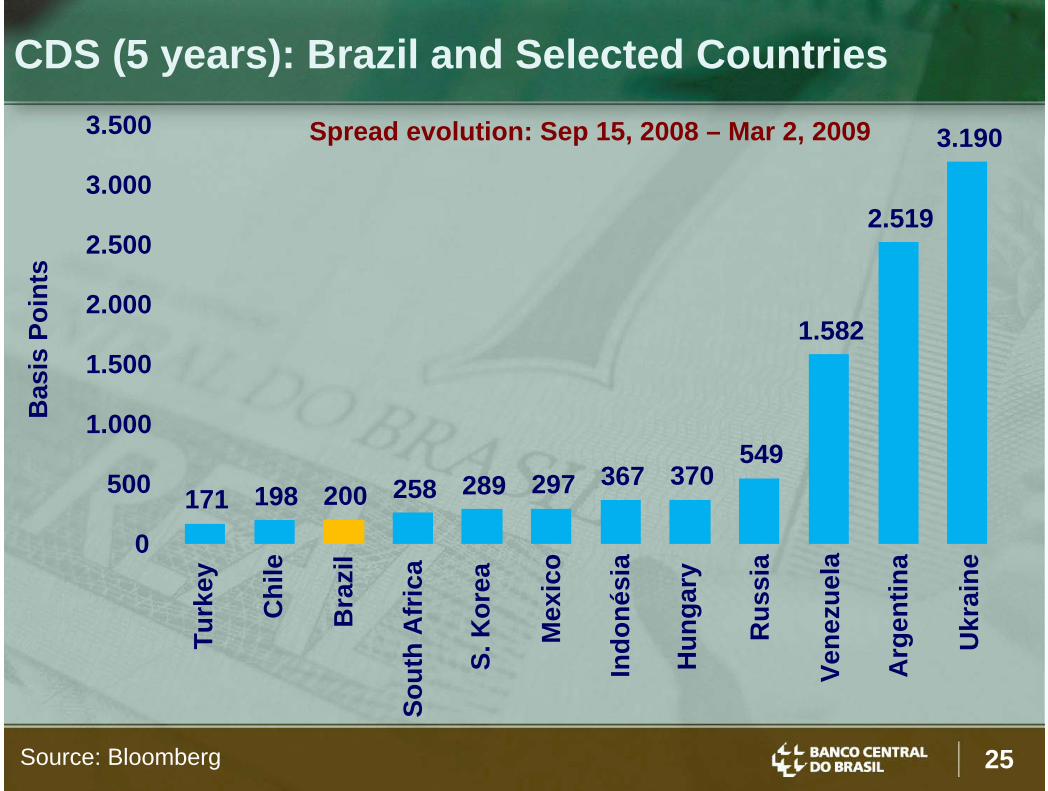
CDS (5 years): Brazil and Selected CountriesB
asis
Poin
ts
Spread evolution: Sep 15, 2008 – Mar 2, 2009
Turk
ey
Bra
zil
Chi
le
S. K
orea
Mex
ico
Sout
hA
fric
a
Indo
nési
a
Hun
gary
Rus
sia
Vene
zuel
a
Arg
entin
a
Ukr
aine
171 198 200 258 289 297 367 370549
1.582
2.519
3.190
0
500
1.000
1.500
2.000
2.500
3.000
3.500

26
%Stock Exchanges: Brazil and Selected Countries
Jun 14, 2007 – Mar 2, 2009
Source: BloombergIn
dia
Chi
na
Fran
ce
Japa
n
UK
Spai
n
Ger
man
y
USA
Hon
gK
ong
Bra
zil-60
-50
-40
-30
-20
-10
0NIKKEI CAC 40 S&P DAX Xangai FTSE IBEX 35 Mumbai H. Seng Ibovespa
27
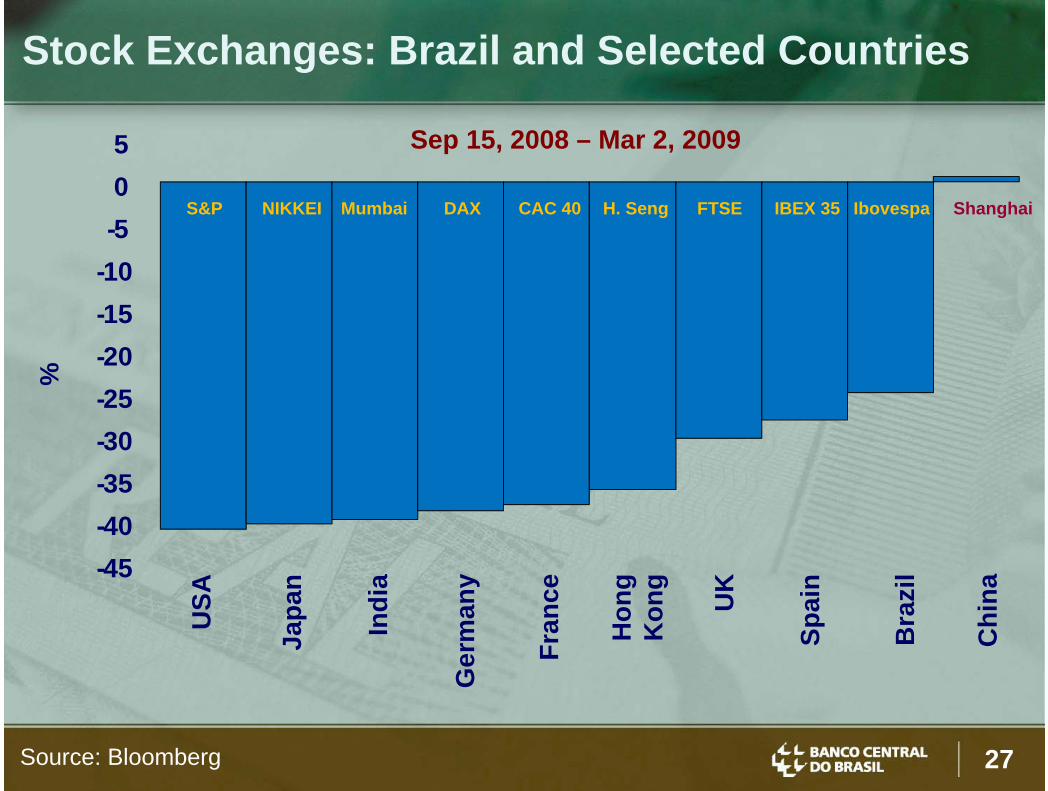
Sep 15, 2008 – Mar 2, 2009
%
Source: Bloomberg
Stock Exchanges: Brazil and Selected Countries
Indi
a
Chi
na
Fran
ce
Japa
n
UK
Spai
n
Ger
man
y
USA
Hon
gK
ong
Bra
zil-45
-40-35-30-25-20-15-10-505
S&P NIKKEI Mumbai DAX CAC 40 H. Seng FTSE IBEX 35 Ibovespa Shanghai

28
Currencies: Brazil and Emerging Economies
Source: Bloomberg
Jun 14, 2007 – Mar 2, 2009
Arg
entin
a
Chi
le
Bra
zil
Hun
gary
Turk
ey
Indo
nési
a
Mex
ico
Sout
hA
fric
a
Rus
sia
S. K
orea
Ukr
aine
14.7 17.2
27.2 29.2 30.8 32.739.0
42.246.3
67.9 68.9
0
10
20
30
40
50
60
70
%

29
Sep 15, 2008 – Mar 2, 2009
Currencies: Brazil and Emerging Economies
Source: Bloomberg
%
Arg
entin
a
Chi
le
Sout
hA
fric
a
Bra
zil
S. K
orea
Indo
nési
a
Turk
ey
Hun
gary
Mex
ico
Rus
sia
Ukr
aine
13.8 16.7
26.9 30.235.0 36.9
41.0 41.9 43.6 44.0
76.8
0
10
20
30
40
50
60
70
80

30
Currencies: Brazil and Central Economies
Source: Bloomberg
-20.7
-5.6
5.8 5.9
17.8 21.127.1 29.8 32.7
40.1
52.3
-30-20-10
0102030405060
Japa
n
Switz
erla
nd
Euro
Den
mar
k
Nor
way
Can
ada
Bra
zil
Swed
en
Aus
tral
ia UK
New
Zeal
and
%
Jun 14, 2007 – Mar 2, 2009

31
Currencies: Brazil and Central Economies
Source: Bloomberg
%
-6.9
5.7
13.2 13.3
20.824.5
28.0 28.133.8 34.8 36.3
-10-505
10152025303540
Japa
n
Switz
erla
nd
Euro
Den
mar
k
Can
ada
Nor
way
Aus
tral
ia UK
N. Z
eala
nd
Bra
zil
Swed
en
Sep 15, 2008 – Mar 2, 2009

32
Currencies: Increased Volatility
0
10
20
30
40
50
60
70
80
May08
Jun08
Jul08
Aug08
Sep08
Oct08
Nov08
Dec08
Jan09
Brazil Mexico India S. Korea South AfricaEuro

33
Export Finance FX Flow (ACC)
Source: Banco Central
5 Day Moving Average
US$
mill
ion Lehman
Brothers
1st USD Repo
Auction
1st TradeFinanceAuction
50
100
150
200
250
300
350
400
9/5 9/19 10/3 10/17 10/31 11/14 11/28 12/12 12/26 1/9 1/23 2/6 2/20 2/27

34
CCI (Consumer Confidence Index)
90
95
100
105
110
115
120
125
Jan06
Jul06
Jan07
Jul07
Jan08
Jul08
Jan09
Consumer Confidence IndexCurrent SituationExpectations
Sep
2005
=100
Source: FGV
35
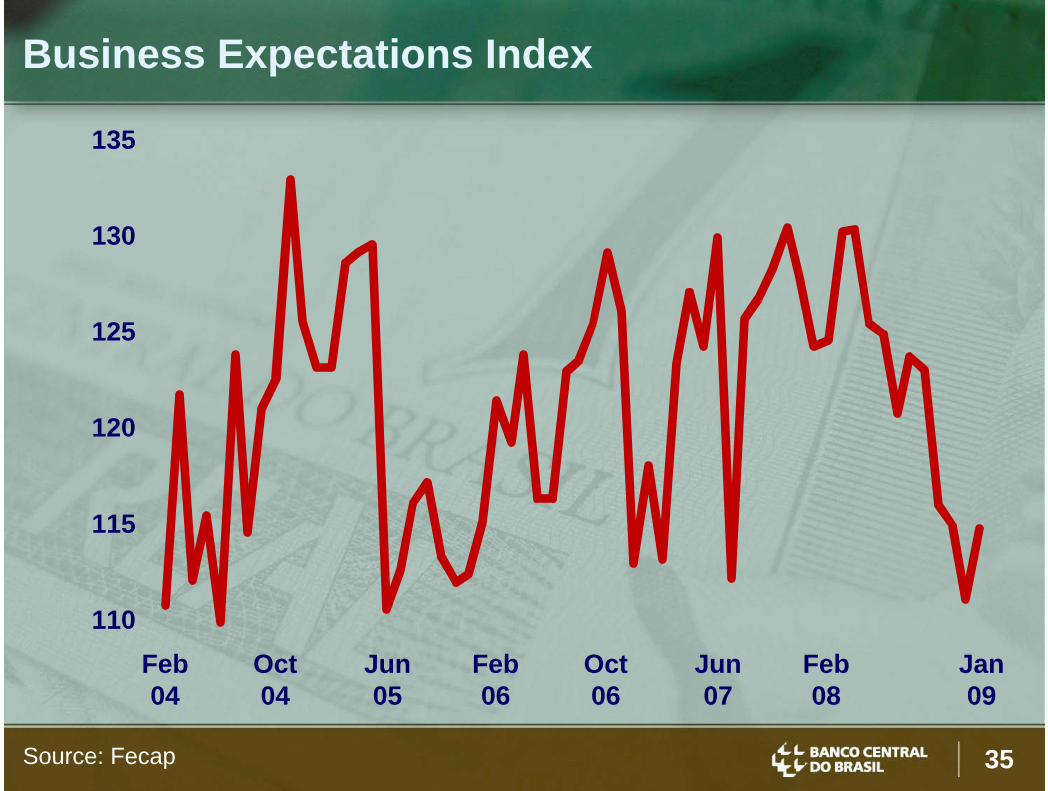
Business Expectations Index
Source: Fecap
110
115
120
125
130
135
Feb04
Oct04
Jun05
Feb06
Oct06
Jun07
Feb08
Jan09

36
Industrial Output20
02 =
100
s.a
.
Source: IBGE
90
95
100
105
110
115
120
125
130
135
Jan 01
Jul 01
Jan 02
Jul 02
Jan 03
Jul 03
Jan 04
Jul 04
Jan 05
Jul 05
Jan 06
Jul 06
Jan 07
Jul 07
Jan 08
Jul 08
Jan 09
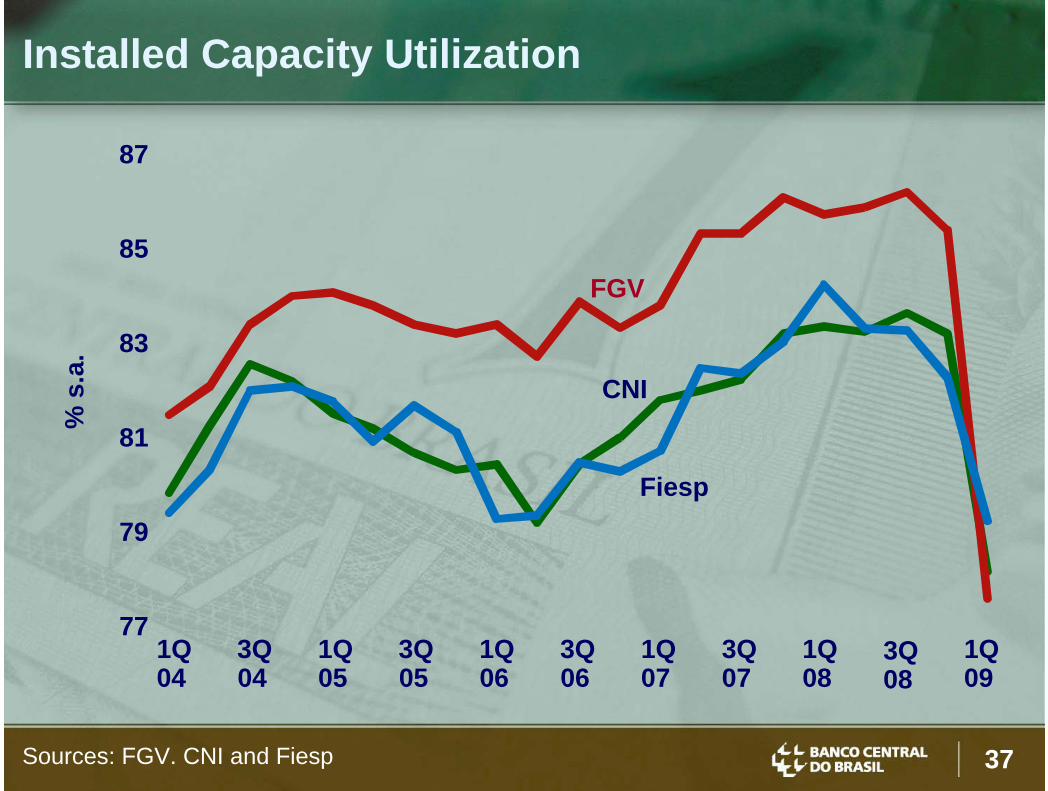
37
Installed Capacity Utilization
Sources: FGV. CNI and Fiesp
% s
.a.
1Q 04
3Q 04
1Q 05
3Q 05
1Q 06
3Q 06
1Q 07
3Q 07
1Q 08
1Q 09
77
79
81
83
85
87
CNI
FGV
Fiesp
3Q 08

38
ICI (Industrial Confidence Index)
Source: FGV
707580859095
100105110115120125
Jan06
Jul06
Jan07
Jul07
Jan08
Jul08
Jan09
Jul 2
005=
100
39
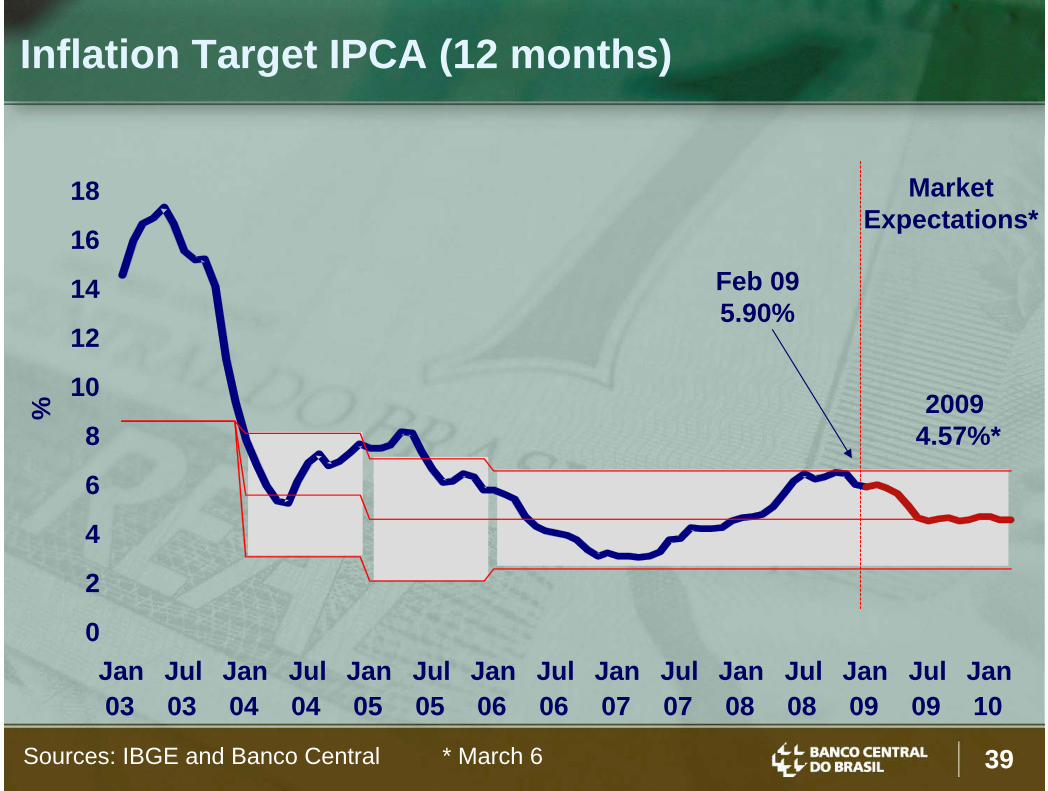
Inflation Target IPCA (12 months)
Sources: IBGE and Banco Central * March 6
MarketExpectations*
Feb 09 5.90%
20094.57%*
%
0
2
4
6
8
10
12
14
16
18
Jan 03
Jul 03
Jan 04
Jul 04
Jan 05
Jul 05
Jan 06
Jul 06
Jan 07
Jul 07
Jan 08
Jul 08
Jan 09
Jul 09
Jan 10

40
III. Central Bank Actions (so far…)
41
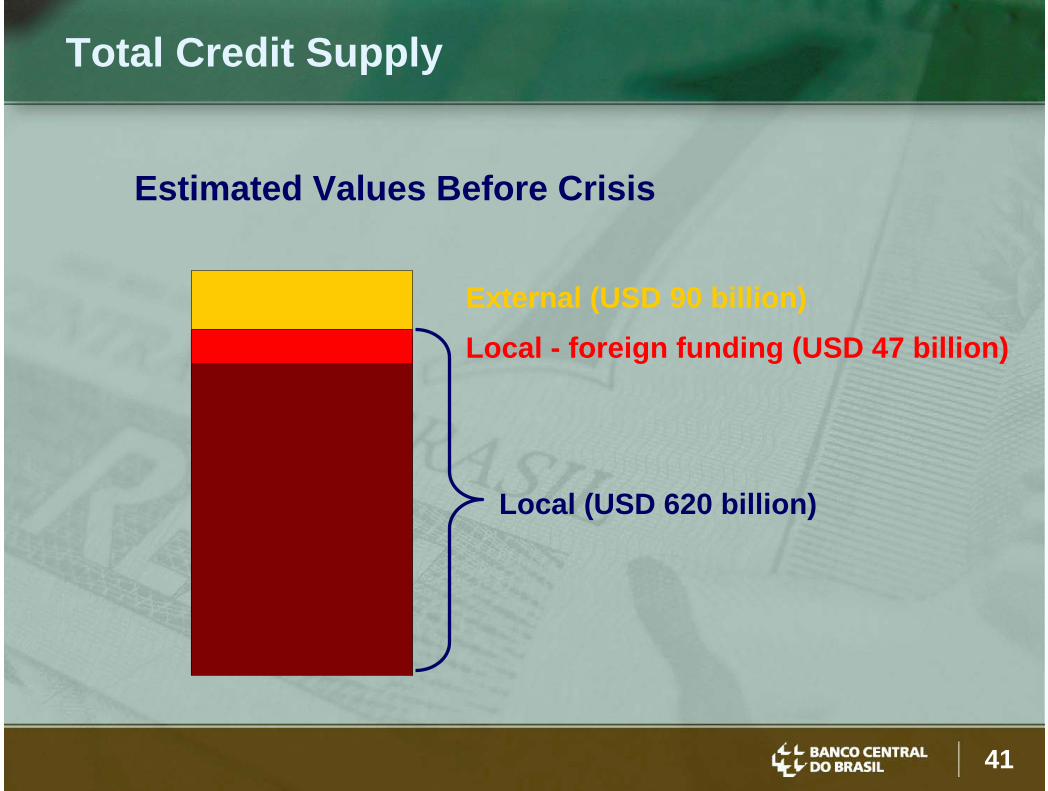
Total Credit Supply
External (USD 90 billion)
Local (USD 620 billion)
Estimated Values Before Crisis
Local - foreign funding (USD 47 billion)

42
September 24• Rise on reserve requirements over leasing
companies deposits postponed• “Additional Requirements” deduction value
rises from R$ 100 million to R$ 300 million• Measures freed up R$ 5.3 billion
Local Currency Liquidity

43
October 2• Up to 40% of Time Deposits Reserve
Requirements freed for acquisition of small banks (capital up to R$ 2.5 billion) assets
• Potential impact: R$ 25.3 billion
Local Currency Liquidity

44
October 8• Time Deposit Reserve Requirements
deduction value raised from R$ 300 million to R$ 700 million
• “Additional Requirements” ratio on cash and time deposits lowered from 8% to 5%
• Potential impact: R$ 21.8 billion
Local Currency Liquidity

45
October 13• “Additional Requirements” deduction raised
from R$ 300 million to R$ 1 billion• Time Deposit requirements deduction raised
from R$ 700 million to R$ 2 billion. Ratio for asset acquisition raised from 40% to 70%
• Capital ceiling of banks eligible to sell assets increased from R$ 2 billion to R$ 7 billion
• Potential impact: R$ 27.0 billion
Local Currency Liquidity

46
October 14• Facility for banks to use requirements for
buying other banks assets expanded• Demand Deposits reserve requirements
ratio lowered from 45% to 42%, freeing up R$ 4.0 billion
Local Currency Liquidity

47
October 14• National Monetary Council increases ratio
on demand deposits that banks must lend to agricultural sector from 25% to 30%
• Potential impact: R$ 4.5 billion for loans
Local Currency Liquidity

48
October 30• Changes on requirements framework to
foster use of liquidity freed up by previous measures
• 70% of time deposits requirements to be made in cash
• Target: to encourage large banks to acquire small banks assets
Local Currency Liquidity

49
November 13• Banks can use government bonds, instead
of cash, to meet part of the “Additional Reserve Requirements”
• Potential impact: R$ 42.1 billion
Local Currency Liquidity
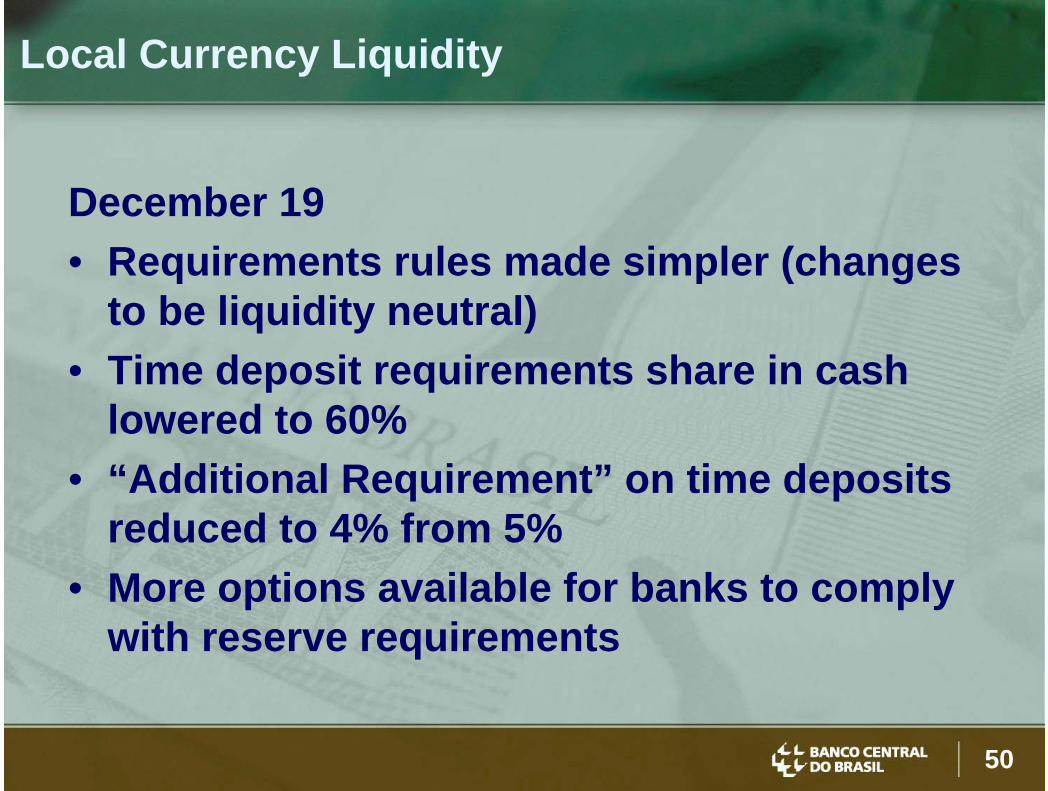
50
December 19• Requirements rules made simpler (changes
to be liquidity neutral)• Time deposit requirements share in cash
lowered to 60%• “Additional Requirement” on time deposits
reduced to 4% from 5%• More options available for banks to comply
with reserve requirements
Local Currency Liquidity

51
Local Currency Liquidity
Source: Banco Central
Reserve requirementseasying:
R$ 99.8 billionUS$ 43.3 billion

52
• Foreign currency swap contracts• Sales of USD in spot market• USD repurchase agreement auctions• Collateralized loans aimed at financing
exports• Currency swaps transactions with other
central banks (Fed)• Loans to companies and banks to roll over
external debts
Foreign Currency Liquidity
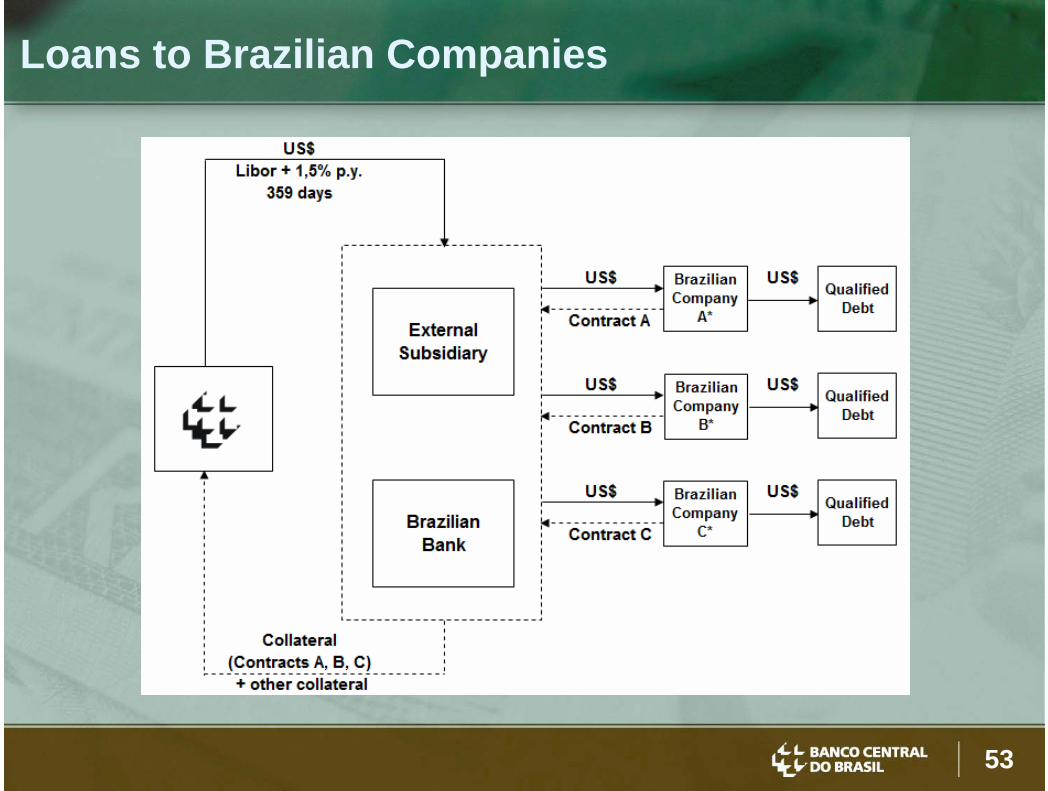
53
Loans to Brazilian Companies

54
Loans to Brazilian Banks

55
-20
-10
0
US$ billion
Mar 9th: US$ 11.0 billion
Currency Swaps Contracts
10
20
30
40
Mar/09Jun/07Sep/05Apr/02 Jan/04
Short in USD
Long in USD
Oct 1st: - US$ 21.4 billion

56
Foreign Currency Liquidity

57
Interest Rates
Source: Banco Central * 12/3
%
Selic (Overnight)6 Month Swap12 Month Swap
8
12
16
20
24
28
32
Jan00
Jan01
Jan02
Jan03
Jan04
Jan05
Jan06
Jan07
Jan08
Mar*09

58
Real Interest Rate (12 Month Swap)
Source: Banco Central * March 12
% ave. 96/9918.4%
ave. 00/0315.0%
ave. 04/0511.5%
ave. 06/088.2%
5
10
15
20
25
30
35
40
Jan96
Jan97
Jan98
Jan99
Jan00
Jan01
Jan02
Jan03
Jan04
Jan05
Jan06
Jan07
Jan08
Mar*09
5.4
59
Brazil: Responses to theFinancial Crisis
Lima, PeruMarch 2009
Mario Torós