Brazil unbound: How investors see Brazil and Brazil sees the world

BRAZIL MEANS BUSINESS
In spite of the world financial crisis, Brazil remains an appealing business destination.

GDP compared – Latin America (in trillions of US$)

Southeast
55,09
South – 19,03
Northeast
13,68
Center-West
7,28
North
4,92
REGIONAL DISPARITIES% of total GDP (2008)
Source: International Monetary Fund
Note:5 cities represent almost 24% of Brazilian GDP as
follows:
SP 12%RJ 5,2%DF 3,8%BH 1,4%Curitiba 1,2%

HEALTHY ECONOMY:Macroeconomic Analysis
Achieved investment grade status (S&P Rating Services – April 2008)
Strong post crisis economy relative to other countries
Inflation under control
Appreciating currency
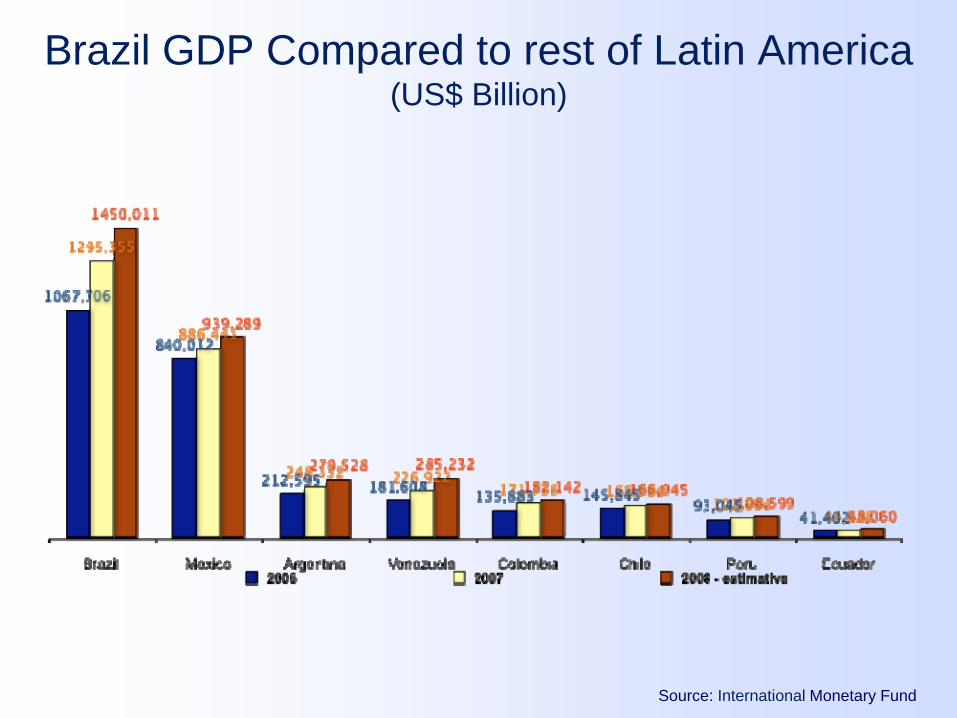
Brazil GDP Compared to rest of Latin America(US$ Billion)
Source: International Monetary Fund

Imports from USA
Source: SECEX – November 2009
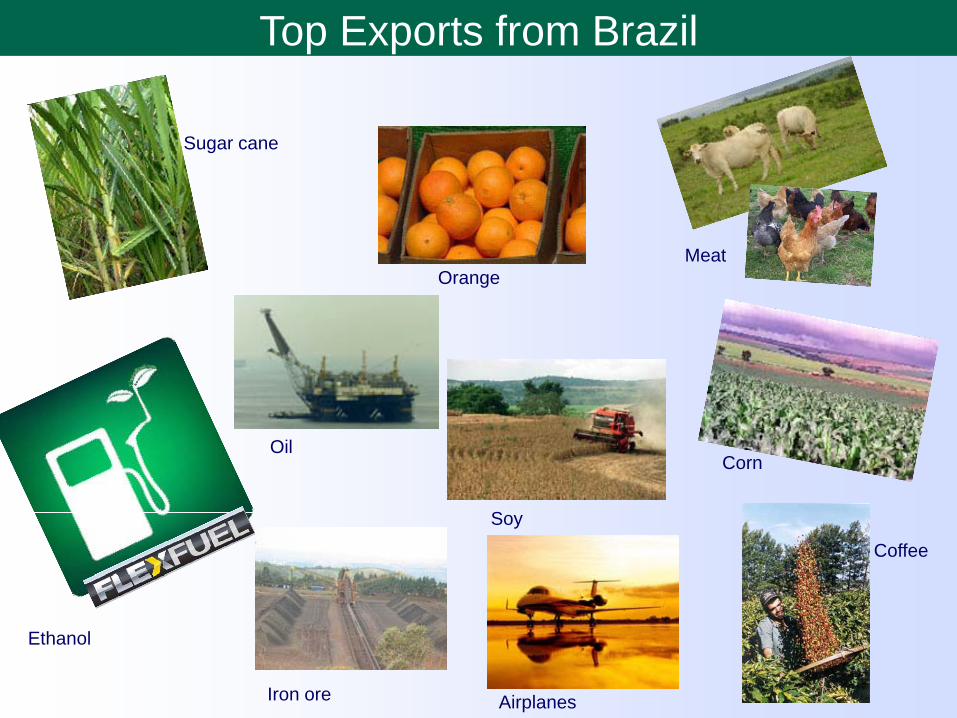
Top Exports from Brazil
Orange
Soy
Corn
Sugar cane
Airplanes
Coffee
Oil
Iron ore
Ethanol
Meat

PRESIDENT LUIS INÁCIO “LULA” DA SILVA
Took office on January 1st, 2003.Labor Party- PT.First mandate - with 61.27% in 2002.Second mandate - with 60,83% in 2006.Elections October 2010.

4.5%
1.8%
8.5%
6.0% 5.5%
3.5%
7.8%
4.1% 4.3%
2001 2002 2003 2004 2005 2006 2007 2008 2009 Banco Central est.
INFLATION RATE
2.25
3.5
2.75 2.62.25 2.14
1.952.3
1.72
2001 2002 2003 2004 2005 2006 2007 2008 2009 est.
EXCHANGE RATE

In 3 years, 18.5 mi of Brazilians moved to a higher income level
11.7 mi left the lower level between 2005 and 200836.6% achieved the superior income level in 2008, highest index registered since 199571% of the change in the base of the pyramid (to the intermediate level) occurred in Southeast and Northeast19.5 mi had a real increase in the individual income superior to the per capita income national evolution between 2001 and 2008
.000
13.333
26.667
40.000
1995 1998 2002 2005 2008Base Intermediate SuperiorIn %
Base: income up to USD 110 / month
Intermediate: from USD 110 to USD 273 / month
Superior: above USD 273 / month

Prime rate (Selic) in Brazil has reached the lowest historic level (in %)

More than 4.5 million new jobs created in formal sector.
The lowest inflation rates in decades 2000-08.
Expansion of purchasing power and credit and for millions although some contraction in 2008
Lula Administration’s emphasis on lowering public debt and reducing real interest rates will expand bank credit to businesses for investment.
Spreads (the difference between banks’ cost of funds and their lending rates) is highest in the world.
UNDER LULA - ACCESS TO CREDIT

13Income Pyramid changes during Lula´s administration
2008
A & B
C
D & E
2015 projection
A & B
C
D & E
56,5%
28%
15,7%
Source: FGV
10,5%
49%
40%

In 2010, R$ 90 bi more in consumption (in R$ millions)
Brazilians consumption in 2010 equal or more than pre-crisis. -- job growth-- income growth-- low interest rates -- credit is back-- expenses from Federal Government

The “Favela” Today
Source: Copo pela Metade; Author Ricardo Neves – Ibope 2003 page 224

Brazil and the crisis
and the non-consumer market

New measures from the government
Refrigerator•From 15%•To 5%
Washing Machine•From 20 %•To 10%
Stove•From 5%•To 0%
Household appliances –IPI taxes
Examples of impact on prices
R$ 1.799
R$ 1.699
- R$ 100
R$ 999
R$ 944
- R$ 55
RS 699
R$ 680
- R$ 19

Brazilian Barriers to Business
Custo Brazil
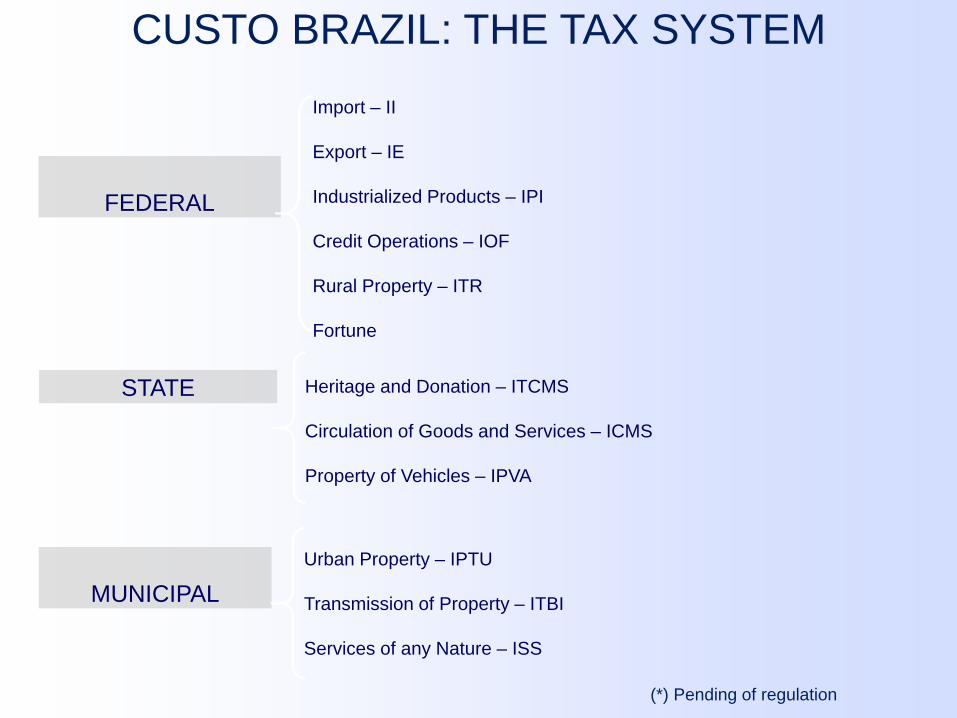
CUSTO BRAZIL: THE TAX SYSTEM
STATE
FEDERAL
MUNICIPAL
Import – II
Export – IE
Industrialized Products – IPI
Credit Operations – IOF
Rural Property – ITR
Fortune
Heritage and Donation – ITCMS
Circulation of Goods and Services – ICMS
Property of Vehicles – IPVA
Urban Property – IPTU
Transmission of Property – ITBI
Services of any Nature – ISS
(*) Pending of regulation

Hypothetical Cost Buildup for an Imported Machine in US Dollars
FOB price of Product 100,000Freight 2,400Insurance (1%) 1,000
CIF Price of Product 103,400Import Duty Rate: 19% -- applied to CIF 19,646IPI: 5% -- applied to CIF + import duty 6,152ICMS: 18% -- applied to CIF + import duty + IPI 23,256Merchant Marine Tax: 25% of ocean freight cost 600Warehouse: 0.65% of CIF; or min. US$ 170, max US$ 235 235Terminal Handling Charges: average US$ 100 per container 100Contribution to Custom Broker's union 2.2% CIF; or min of US$ 71, max US$ 160 160Custom Brokerage Fee: average 0.65% of CIF or min US$ 170, max US$ 450 450SISCOMEX Fee 30Typical Cargo Transportation charge 35Typical Bank Costs: 2% of FOB 2,000
FINAL COST 156,064

Infra-structure Matters in Brazil
▫ BR US Difference• Soy production costs 187 238 51 dollars cheaper in Brazil• Transportation costs 97 26 71 dollars cheaper in U.S. • Port costs 7 3 4 dollars cheaper in U.S.• Total 291 267 24 dollars in favor of USA
• Conclusion:
• To produce soy in Brazil is 51 dollars cheaper than in the US. But the logistics costs not only eliminate this advantage but inverts the equation. At the end, it is 24 dollars cheaper export from the US than Brazil.
Source: Veja Magazine – Aug/07


iPod prices around the worldHere is the CommSec iPod Index, based on January 2007 prices for 2GB iPod
Nanos. 1 Brazil $327.71
2 India $222.27
Sweden $213.03
4 Denmark $208.25
9 United Kingdom $195.04
23 United States $149.00
24 Japan $147.63
IPOD INDEX
3

GDP: 5%
Growth Rate: 4,83 %
Inflation Rate: 4,29% year (still working with 2009 estimates)
Foreign Direct Investment : US$ 35 Billion
SELIC at 10,50 % year
Foreign Exchange Rate: 1 USD = 1.7 Reais
Unemployment Rate: 7.4% (still working with 2009 estimates - nov 2009)
Economic Indicators2010 Estimates
Source: Central Bank Brazil
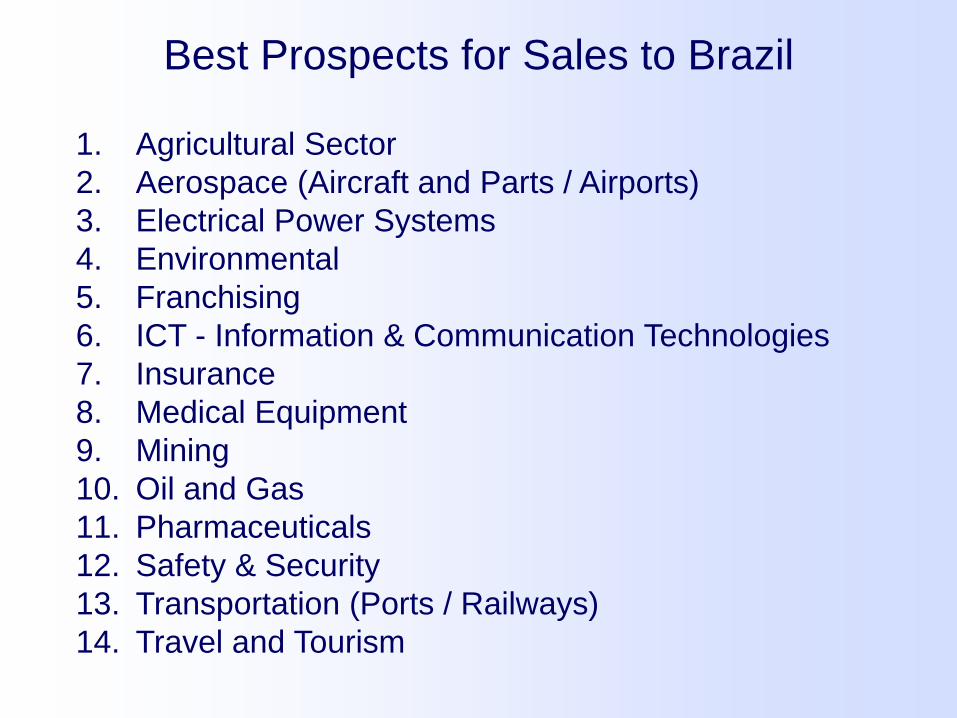
1. Agricultural Sector2. Aerospace (Aircraft and Parts / Airports)3. Electrical Power Systems 4. Environmental 5. Franchising6. ICT - Information & Communication Technologies7. Insurance8. Medical Equipment9. Mining10. Oil and Gas 11. Pharmaceuticals12. Safety & Security13. Transportation (Ports / Railways) 14. Travel and Tourism
Best Prospects for Sales to Brazil

26
Standards – voluntary product requirements, in the U.S. standards development is market driven.
Conformity Assessment – verifying the conformance of a product to a standard (SDOC, product certification,
independent testing)
Technical Regulations – mandatory requirements which may include particular standards or conformity assessment
procedures.
Regional Commercial Officer Miguel Hernandez [email protected]
DOC Standards Initiative www.trade.gov/standards
Standards as Non-Tariff Barriers

Thank you !Points of Contact:
[email protected]: 55-61 3312-7481 / Fax: 55 –61 3312-7656
Belo [email protected]: 55-31 3213-1583 / Fax: 55-31 3213-1575
São Paulo [email protected]: 55-11 5186-7429 / Fax: 55-11 5186-7410
[email protected]: 81-3416-3075 / Fax: 81-3231-1906
Rio de Janeiro [email protected]: 55-21 3823-2417 / Fax 55-21 3823-2424