Brand Loyalty and the Decline of American Automobile Firms · Brand Loyalty and the Decline of...
48
FRED MANNERING Universityof Washington CLIFFORD WINSTON BrookingsInstitution Brand Loyalty and the Decline of American Automobile Firms DESPITE RECORD profits in 1988, the American automobile industry is in serious decline and could face a financial crisis during the 1990s. Much of General Motors' and Ford's recent profits have come from European operations that in some cases are protected from competition with Japanese automobile manufacturers by import barriers-a luxury that will end soon because the Japanese are building plants in Europe. Independently, Europe may lower its barriers. Japanese production ca- pacity also continues to grow in America. By the mid- 1990s Japanese transplants will be capable of producing 3.5 million cars and light trucks a year, nearly 25 percent of all current U.S. sales. While the Japanese are building plants, American companies are closing them-eight in the past three years. The Japanese product line is also growing, with cars produced in all size classes, including luxury and midsize, the traditional strongholds of U. S. producers. American companies must also confront the end of the long U. S. economic expansion. The most concrete indication of the industry's decline is the change in U.S. market share during the past decade. As shown in figure 1, the Japanese firms increased their share by 10 percentage points despite being constrained by quotas (voluntary restraint agreements), by a 40 percent appreciation of their currency, and by a difficult transition to American-based production. At the same time, General Motors' share Theauthors wishto thank seminar participants attheBrookings Institution, theCalifornia Institute of Technology, the NationalBureau of EconomicResearch, the University of California at Irvine,and the U.S. Department of Justice. 67
Transcript of Brand Loyalty and the Decline of American Automobile Firms · Brand Loyalty and the Decline of...
FRED MANNERING University of Washington
CLIFFORD WINSTON Brookings Institution
Brand Loyalty and the Decline of American Automobile Firms
DESPITE RECORD profits in 1988, the American automobile industry is in serious decline and could face a financial crisis during the 1990s. Much of General Motors' and Ford's recent profits have come from European operations that in some cases are protected from competition with Japanese automobile manufacturers by import barriers-a luxury that will end soon because the Japanese are building plants in Europe. Independently, Europe may lower its barriers. Japanese production ca- pacity also continues to grow in America. By the mid- 1990s Japanese transplants will be capable of producing 3.5 million cars and light trucks a year, nearly 25 percent of all current U.S. sales. While the Japanese are building plants, American companies are closing them-eight in the past three years. The Japanese product line is also growing, with cars produced in all size classes, including luxury and midsize, the traditional strongholds of U. S. producers. American companies must also confront the end of the long U. S. economic expansion.
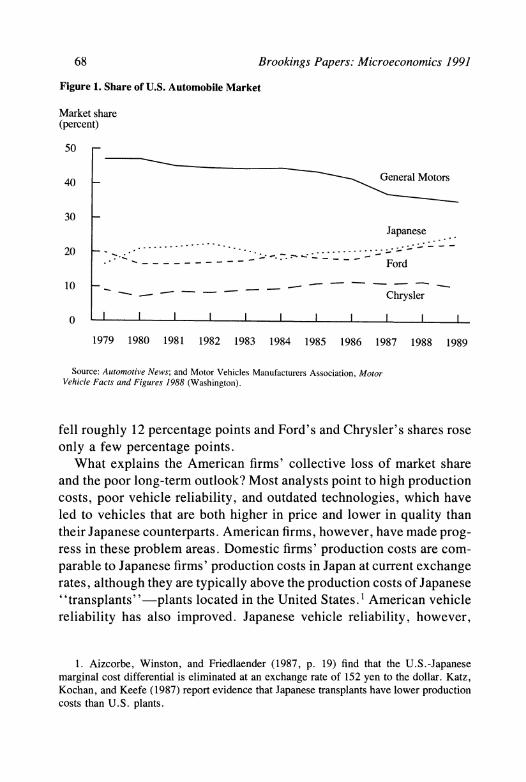
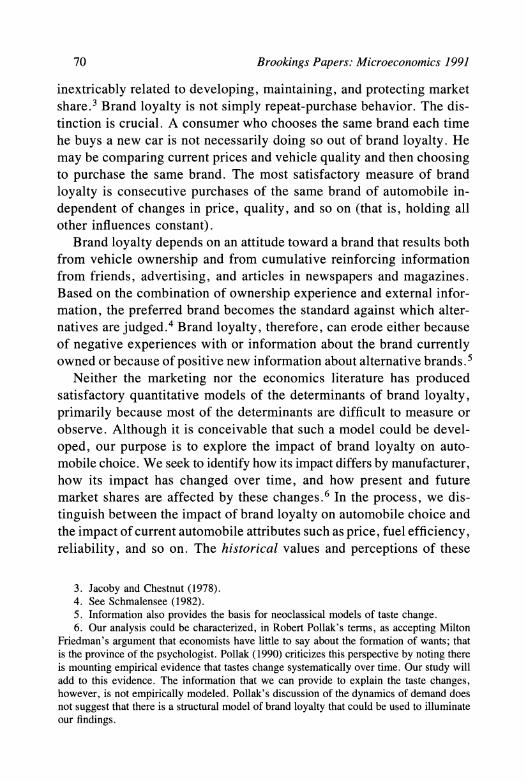
The most concrete indication of the industry's decline is the change in U.S. market share during the past decade. As shown in figure 1, the Japanese firms increased their share by 10 percentage points despite being constrained by quotas (voluntary restraint agreements), by a 40 percent appreciation of their currency, and by a difficult transition to American-based production. At the same time, General Motors' share
The authors wish to thank seminar participants at the Brookings Institution, the California Institute of Technology, the National Bureau of Economic Research, the University of California at Irvine, and the U.S. Department of Justice.
67
68 Brookings Papers: Microeconomics 1991
Figure 1. Share of U.S. Automobile Market
Market share (percent)
50 -
40 - - =
30 - Japanese
20 - .......-. - - - - .. Ford
10 .- - - - - - Chrysler
0 I I I I 1
1979 1980 1981 1982 1983 1984 1985 1986 1987 1988 1989
Source: Automotive News; and Motor Vehicles Manufacturers Association, Motor Vehicle Facts and Figures 1988 (Washington).
fell roughly 12 percentage points and Ford's and Chrysler's shares rose only a few percentage points.
What explains the American firms' collective loss of market share and the poor long-term outlook? Most analysts point to high production costs, poor vehicle reliability, and outdated technologies, which have led to vehicles that are both higher in price and lower in quality than their Japanese counterparts. American firms, however, have made prog- ress in these problem areas. Domestic firms' production costs are com- parable to Japanese firms' production costs in Japan at current exchange rates, although they are typically above the production costs of Japanese "transplants" -plants located in the United States. 1 American vehicle reliability has also improved. Japanese vehicle reliability, however,
1. Aizcorbe, Winston, and Friedlaender (1987, p. 19) find that the U.S.-Japanese marginal cost differential is eliminated at an exchange rate of 152 yen to the dollar. Katz, Kochan, and Keefe (1987) report evidence that Japanese transplants have lower production costs than U.S. plants.
Fred Mannering and Clifford Winston 69
also continues to improve, and recent Japanese technological advances suggest American automakers still have a difficult catch-up task.2
A neglected but critical cause of the U.S. industry's decline and un- certain future is the deterioration in the loyalty of consumers to the products of U.S. manufacturers: brand loyalty. Even if American manufacturers catch up to the Japanese in quality and price, the legacy remains. American automakers' performance during the 1990s will be haunted by their product lines and quality during previous decades. Although brand loyalty is one of the biggest problems the industry faces, it is probably the hardest to correct in the near future. Unlike other industry problems, for example, production cost differentials, which can be "corrected" fairly quickly by external economic events, such as an exchange rate appreciation, or by government policy, such as domestic content legislation, a collapse in brand loyalty is the result of cumulative negative experience with a com- pany's product. Winning consumers back and reversing a decline in brand loyalty could take years.
The decline in brand loyalty for General Motors' cars is responsible for more than a third of its loss in market share during the past decade. If current levels of brand loyalty to American and Japanese manufacturers remain constant throughout the 1990s, Chrysler's position as the third largest seller of automobiles and light trucks in America will be threatened by Toyota, and the combined market share of Toyota, Honda, and Nissan will approach General Motors' share. While much of American auto- makers' problem with brand loyalty is due simply to the successful entry by the Japanese into the U.S. market, U.S. automakers themselves con- tributed to the loss of loyalty. Reversing the decline in American brand loyalty and preventing financial distress will not be easy, but both gov- ernment and corporate action could help stem the tide.
An Overview of Brand Loyalty
Gaining and keeping a significant market share is considered by many firms to be the key to high long-term profitability. Brand loyalty is
2. Japanese advances include more efficient and powerful "multivalve" engines and suspension systems that electronically adjust to road conditions and to a driver's tastes.
70 Brookings Papers: Microeconomics 1991
inextricably related to developing, maintaining, and protecting market share.3 Brand loyalty is not simply repeat-purchase behavior. The dis- tinction is crucial. A consumer who chooses the same brand each time he buys a new car is not necessarily doing so out of brand loyalty. He may be comparing current prices and vehicle quality and then choosing to purchase the same brand. The most satisfactory measure of brand loyalty is consecutive purchases of the same brand of automobile in- dependent of changes in price, quality, and so on (that is, holding all other influences constant).
Brand loyalty depends on an attitude toward a brand that results both from vehicle ownership and from cumulative reinforcing information from friends, advertising, and articles in newspapers and magazines. Based on the combination of ownership experience and external infor- mation, the preferred brand becomes the standard against which alter- natives are judged.4 Brand loyalty, therefore, can erode either because of negative experiences with or information about the brand currently owned or because of positive new information about alternative brands. 5
Neither the marketing nor the economics literature has produced satisfactory quantitative models of the determinants of brand loyalty, primarily because most of the determinants are difficult to measure or observe. Although it is conceivable that such a model could be devel- oped, our purpose is to explore the impact of brand loyalty on auto- mobile choice. We seek to identify how its impact differs by manufacturer, how its impact has changed over time, and how present and future market shares are affected by these changes.6 In the process, we dis- tinguish between the impact of brand loyalty on automobile choice and the impact of current automobile attributes such as price, fuel efficiency, reliability, and so on. The historical values and perceptions of these
3. Jacoby and Chestnut (1978). 4. See Schmalensee (1982). 5. Information also provides the basis for neoclassical models of taste change. 6. Our analysis could be characterized, in Robert Pollak's terms, as accepting Milton
Friedman's argument that economists have little to say about the formation of wants; that is the province of the psychologist. Pollak (1990) criticizes this perspective by noting there is mounting empirical evidence that tastes change systematically over time. Our study will add to this evidence. The information that we can provide to explain the taste changes, however, is not empirically modeled. Pollak's discussion of the dynamics of demand does not suggest that there is a structural model of brand loyalty that could be used to illuminate our findings.
Fred Mannering and Clifford Winston 71
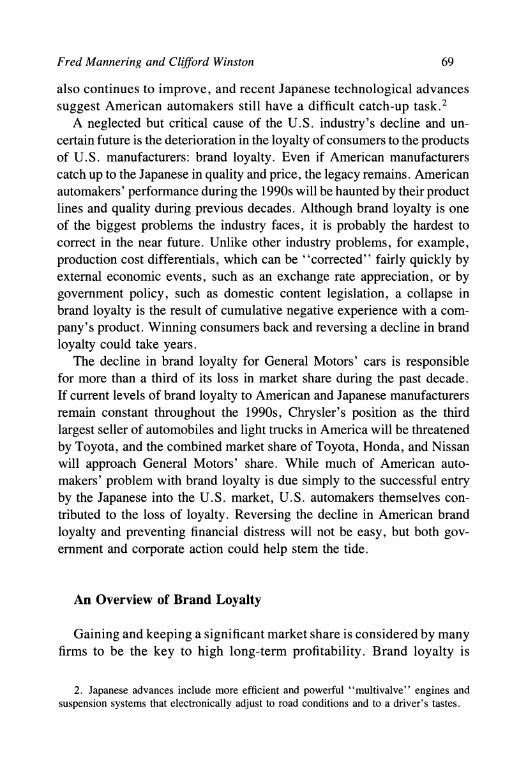
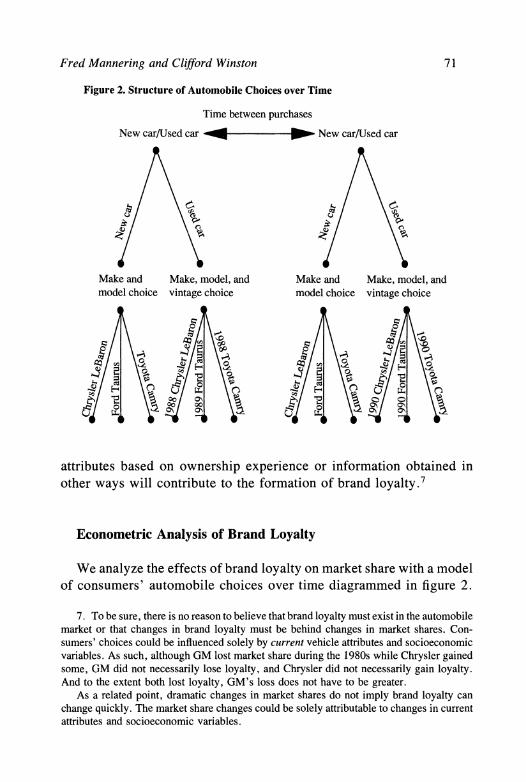
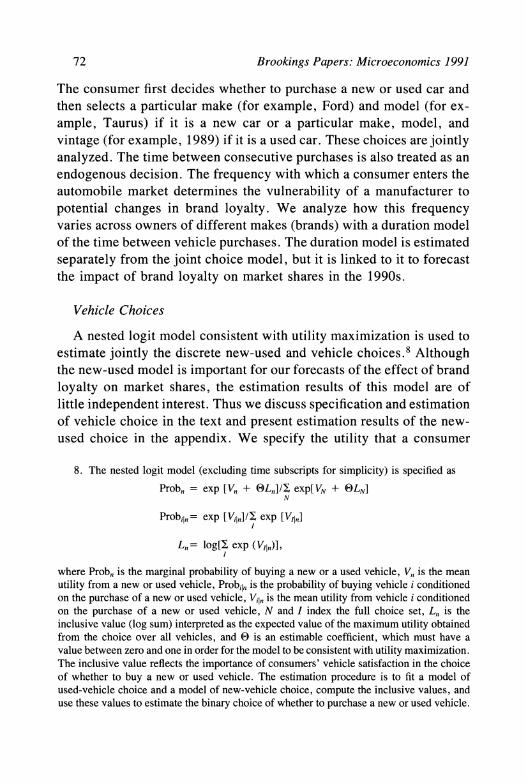
Figure 2. Structure of Automobile Choices over Time
Time between purchases
New car/Used car _ New car/Used car
A R IPCD 0
Make and Make, model, and Make and Make, model, and model choice vintage choice model choice vintage choice
Eoo ercA nayi ofBad oat
'IC Q 'I
We analyze the effects of brand loyalty on market share with a model of consumers' automobile choices over time diagrammed in figure 2.
7. To be sure, there is no reason to believe that brand loyalty must exist in the automobile market or that changes in brand loyalty must be behind changes in market shares. Con- sumers' choices could be influenced solely by current vehicle attributes and socioeconomic variables. As such, although GM lost market share during the 1980s while Chrysler gained some, GM did not necessarily lose loyalty, and Chrysler did not necessarily gain loyalty. And to the extent both lost loyalty, GM's loss does not have to be greater.
As a related point, dramatic changes in market shares do not imply brand loyalty can change quickly. The market share changes could be solely attributable to changes in current attributes and socioeconomic variables.
72 Brookings Papers: Microeconomics 1991
The consumer first decides whether to purchase a new or used car and then selects a particular make (for example, Ford) and model (for ex- ample, Taurus) if it is a new car or a particular make, model, and vintage (for example, 1989) if it is a used car. These choices are jointly analyzed. The time between consecutive purchases is also treated as an endogenous decision. The frequency with which a consumer enters the automobile market determines the vulnerability of a manufacturer to potential changes in brand loyalty. We analyze how this frequency varies across owners of different makes (brands) with a duration model of the time between vehicle purchases. The duration model is estimated separately from the joint choice model, but it is linked to it to forecast the impact of brand loyalty on market shares in the 1990s.
Vehicle Choices
A nested logit model consistent with utility maximization is used to estimate jointly the discrete new-used and vehicle choices.8 Although the new-used model is important for our forecasts of the effect of brand loyalty on market shares, the estimation results of this model are of little independent interest. Thus we discuss specification and estimation of vehicle choice in the text and present estimation results of the new- used choice in the appendix. We specify the utility that a consumer
8. The nested logit model (excluding time subscripts for simplicity) is specified as
Probn = exp [Vn + 0Ln]/Y2 exp[VN + OLN] N
Probiln = exp [ViIn]/ X exp [V,ln]
Ln = log[l exp ( VsI)],
where Probn is the marginal probability of buying a new or a used vehicle, V,, is the mean utility from a new or used vehicle, Probil,, is the probability of buying vehicle i conditioned on the purchase of a new or used vehicle, Viln is the mean utility from vehicle i conditioned on the purchase of a new or used vehicle, N and I index the full choice set, Ln is the inclusive value (log sum) interpreted as the expected value of the maximum utility obtained from the choice over all vehicles, and 0 is an estimable coefficient, which must have a value between zero and one in order for the model to be consistent with utility maximization. The inclusive value reflects the importance of consumers' vehicle satisfaction in the choice of whether to buy a new or used vehicle. The estimation procedure is to fit a model of used-vehicle choice and a model of new-vehicle choice, compute the inclusive values, and use these values to estimate the binary choice of whether to purchase a new or used vehicle.
Fred Mannering and Clifford Winston 73
derives from vehicle choice as a function of his socioeconomic char- acteristics, vehicle attributes, and his brand loyalty, which, as indicated previously, captures the consumer's accumulated information about a brand.
As we have shown elsewhere, brand loyalty can be justified theo- retically as an influence on vehicle choice in the context of a short-run dynamic model of taste change.9 Loyalty can be interpreted as a state variable summarizing accumulated vehicle-ownership experience. The state variable can be transformed to a measurable variable, the number of previous consecutive purchases of the same brand of vehicle as the new vehicle purchase, to facilitate estimation.
We term this measure of brand loyalty transaction loyalty. Two other measures are worth considering. Replacement loyalty considers whether a consumer who is replacing a specific vehicle replaces that vehicle with a vehicle of the same brand. For example, suppose a consumer owns a Jaguar XJS for two years, at which time he decides he needs an economical car for commuting and purchases a Honda CRX. Three years after the Honda purchase the consumer replaces the XJS with a Jaguar XJ6. This consumer would be replacement loyal but not trans- action loyal to Jaguar for two purchases. 10 The justification for consid- ering replacement loyalty is that the consumer was loyal, that is, kept his Jaguar, but was forced to purchase another brand because Jaguar does not offer an economical commuting car. But Jaguar's limited range of models cost it a possible sale and possibly allowed the consumer to develop loyalty to Honda. This is the justification for considering trans- action loyalty as the appropriate loyalty measure. A third measure is simply the number of vehicles of the same brand that the consumer has ever owned. This could be justified as an approximate measure of the stock of consumer experience with a brand. Its weakness is that it ignores how breaks in a consumer's transaction loyalty could lead him to develop loyalty to another brand. In what follows we use transaction loyalty as our measure of brand loyalty and explore how the other measures affect results.
9. Mannering and Winston (1985). 10. In this example and in our empirical work we measure brand loyalty by the number
of purchases, not by consecutive years of ownership.
74 Brookings Papers: Microeconomics 1991
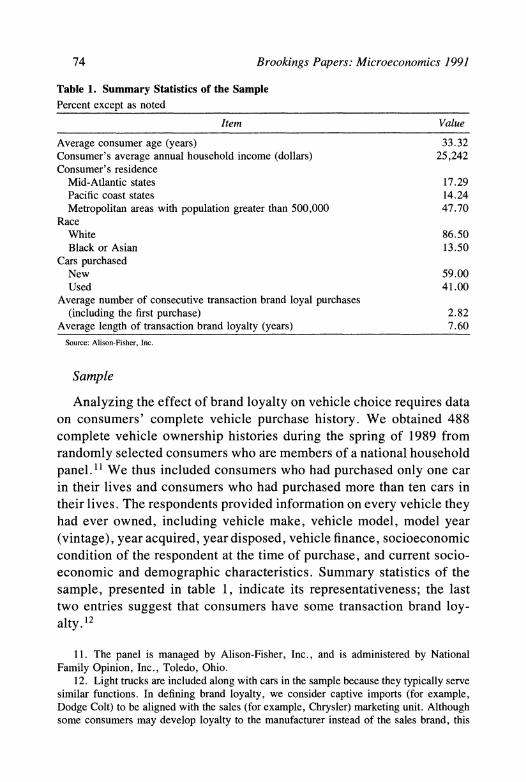
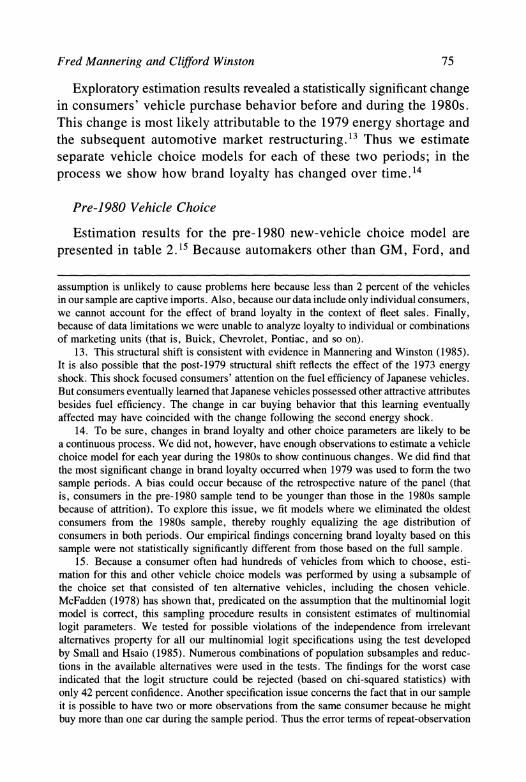
Table 1. Summary Statistics of the Sample Percent except as noted
Item Value
Average consumer age (years) 33.32 Consumer's average annual household income (dollars) 25,242 Consumer's residence
Mid-Atlantic states 17.29 Pacific coast states 14.24 Metropolitan areas with population greater than 500,000 47.70
Race White 86.50 Black or Asian 13.50
Cars purchased New 59.00 Used 41.00
Average number of consecutive transaction brand loyal purchases (including the first purchase) 2.82
Average length of transaction brand loyalty (years) 7.60 Source: Alison-Fisher, Inc.
Sample
Analyzing the effect of brand loyalty on vehicle choice requires data on consumers' complete vehicle purchase history. We obtained 488 complete vehicle ownership histories during the spring of 1989 from randomly selected consumers who are members of a national household panel. 11 We thus included consumers who had purchased only one car in their lives and consumers who had purchased more than ten cars in their lives. The respondents provided information on every vehicle they had ever owned, including vehicle make, vehicle model, model year (vintage), year acquired, year disposed, vehicle finance, socioeconomic condition of the respondent at the time of purchase, and current socio- economic and demographic characteristics. Summary statistics of the sample, presented in table 1, indicate its representativeness; the last two entries suggest that consumers have some transaction brand loy- alty. 12
11. The panel is managed by Alison-Fisher, Inc., and is administered by National Family Opinion, Inc., Toledo, Ohio.
12. Light trucks are included along with cars in the sample because they typically serve similar functions. In defining brand loyalty, we consider captive imports (for example, Dodge Colt) to be aligned with the sales (for example, Chrysler) marketing unit. Although some consumers may develop loyalty to the manufacturer instead of the sales brand, this
Fred Mannering and Clifford Winston 75
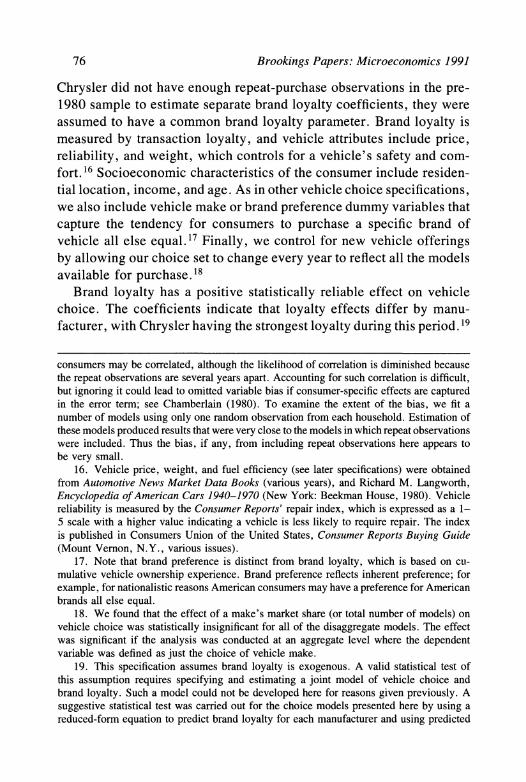
Exploratory estimation results revealed a statistically significant change in consumers' vehicle purchase behavior before and during the 1980s. This change is most likely attributable to the 1979 energy shortage and the subsequent automotive market restructuring.'3 Thus we estimate separate vehicle choice models for each of these two periods; in the process we show how brand loyalty has changed over time.14
Pre-1980 Vehicle Choice
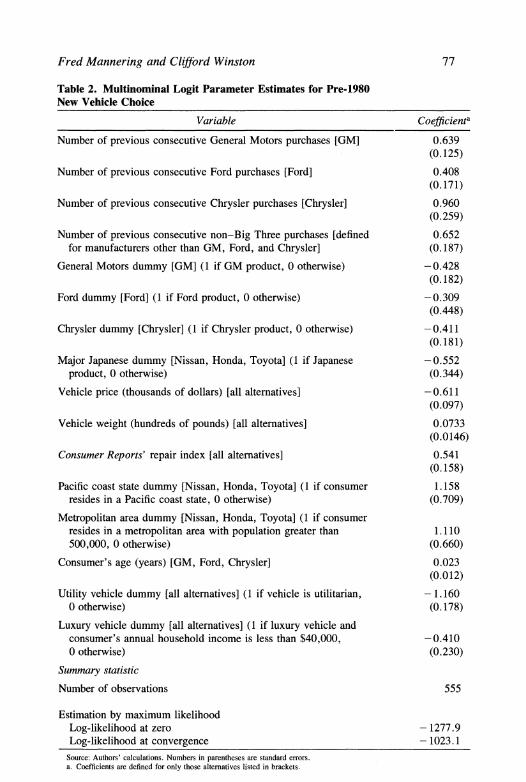
Estimation results for the pre-1980 new-vehicle choice model are presented in table 2.15 Because automakers other than GM, Ford, and
assumption is unlikely to cause problems here because less than 2 percent of the vehicles in our sample are captive imports. Also, because our data include only individual consumers, we cannot account for the effect of brand loyalty in the context of fleet sales. Finally, because of data limitations we were unable to analyze loyalty to individual or combinations of marketing units (that is, Buick, Chevrolet, Pontiac, and so on).
13. This structural shift is consistent with evidence in Mannering and Winston (1985). It is also possible that the post-1979 structural shift reflects the effect of the 1973 energy shock. This shock focused consumers' attention on the fuel efficiency of Japanese vehicles. But consumers eventually learned that Japanese vehicles possessed other attractive attributes besides fuel efficiency. The change in car buying behavior that this learning eventually affected may have coincided with the change following the second energy shock.
14. To be sure, changes in brand loyalty and other choice parameters are likely to be a continuous process. We did not, however, have enough observations to estimate a vehicle choice model for each year during the 1980s to show continuous changes. We did find that the most significant change in brand loyalty occurred when 1979 was used to form the two sample periods. A bias could occur because of the retrospective nature of the panel (that is, consumers in the pre-1980 sample tend to be younger than those in the 1980s sample because of attrition). To explore this issue, we fit models where we eliminated the oldest consumers from the 1980s sample, thereby roughly equalizing the age distribution of consumers in both periods. Our empirical findings concerning brand loyalty based on this sample were not statistically significantly different from those based on the full sample.
15. Because a consumer often had hundreds of vehicles from which to choose, esti- mation for this and other vehicle choice models was performed by using a subsample of the choice set that consisted of ten alternative vehicles, including the chosen vehicle. McFadden (1978) has shown that, predicated on the assumption that the multinomial logit model is correct, this sampling procedure results in consistent estimates of multinomial logit parameters. We tested for possible violations of the independence from irrelevant alternatives property for all our multinomial logit specifications using the test developed by Small and Hsaio (1985). Numerous combinations of population subsamples and reduc- tions in the available alternatives were used in the tests. The findings for the worst case indicated that the logit structure could be rejected (based on chi-squared statistics) with only 42 percent confidence. Another specification issue concerns the fact that in our sample it is possible to have two or more observations from the same consumer because he might buy more than one car during the sample period. Thus the error terms of repeat-observation
76 Brookings Papers: Microeconomics 1991
Chrysler did not have enough repeat-purchase observations in the pre- 1980 sample to estimate separate brand loyalty coefficients, they were assumed to have a common brand loyalty parameter. Brand loyalty is measured by transaction loyalty, and vehicle attributes include price, reliability, and weight, which controls for a vehicle's safety and com- fort. 16 Socioeconomic characteristics of the consumer include residen- tial location, income, and age. As in other vehicle choice specifications, we also include vehicle make or brand preference dummy variables that capture the tendency for consumers to purchase a specific brand of vehicle all else equal. 17 Finally, we control for new vehicle offerings by allowing our choice set to change every year to reflect all the models available for purchase.18
Brand loyalty has a positive statistically reliable effect on vehicle choice. The coefficients indicate that loyalty effects differ by manu- facturer, with Chrysler having the strongest loyalty during this period. 19
consumers may be correlated, although the likelihood of correlation is diminished because the repeat observations are several years apart. Accounting for such correlation is difficult, but ignoring it could lead to omitted variable bias if consumer-specific effects are captured in the error term; see Chamberlain (1980). To examine the extent of the bias, we fit a number of models using only one random observation from each household. Estimation of these models produced results that were very close to the models in which repeat observations were included. Thus the bias, if any, from including repeat observations here appears to be very small.
16. Vehicle price, weight, and fuel efficiency (see later specifications) were obtained from Automotive News Market Data Books (various years), and Richard M. Langworth, Encyclopedia of American Cars 1940-1970 (New York: Beekman House, 1980). Vehicle reliability is measured by the Consumer Reports' repair index, which is expressed as a 1- 5 scale with a higher value indicating a vehicle is less likely to require repair. The index is published in Consumers Union of the United States, Consumer Reports Buying Guide (Mount Vernon, N.Y., various issues).
17. Note that brand preference is distinct from brand loyalty, which is based on cu- mulative vehicle ownership experience. Brand preference reflects inherent preference; for example, for nationalistic reasons American consumers may have a preference for American brands all else equal.
18. We found that the effect of a make's market share (or total number of models) on vehicle choice was statistically insignificant for all of the disaggregate models. The effect was significant if the analysis was conducted at an aggregate level where the dependent variable was defined as just the choice of vehicle make.
19. This specification assumes brand loyalty is exogenous. A valid statistical test of this assumption requires specifying and estimating a joint model of vehicle choice and brand loyalty. Such a model could not be developed here for reasons given previously. A suggestive statistical test was carried out for the choice models presented here by using a reduced-form equation to predict brand loyalty for each manufacturer and using predicted
Fred Mannering and Clifford Winston 77
Table 2. Multinominal Logit Parameter Estimates for Pre-1980 New Vehicle Choice
Variable Coefficienta
Number of previous consecutive General Motors purchases [GM] 0.639 (0.125)
Number of previous consecutive Ford purchases [Ford] 0.408 (0.171)
Number of previous consecutive Chrysler purchases [Chrysler] 0.960 (0.259)
Number of previous consecutive non-Big Three purchases [defined 0.652 for manufacturers other than GM, Ford, and Chrysler] (0.187)
General Motors dummy [GM] (1 if GM product, 0 otherwise) -0.428 (0.182)
Ford dummy [Ford] (1 if Ford product, 0 otherwise) -0.309 (0.448)
Chrysler dummy [Chrysler] (1 if Chrysler product, 0 otherwise) -0.411 (0.181)
Major Japanese dummy [Nissan, Honda, Toyota] (1 if Japanese - 0.552 product, 0 otherwise) (0.344)
Vehicle price (thousands of dollars) [all alternatives] -0.611 (0.097)
Vehicle weight (hundreds of pounds) [all alternatives] 0.0733 (0.0146)
Consumer Reports' repair index [all alternatives] 0.541 (0.158)
Pacific coast state dummy [Nissan, Honda, Toyota] (1 if consumer 1.158 resides in a Pacific coast state, 0 otherwise) (0.709)
Metropolitan area dummy [Nissan, Honda, Toyota] (1 if consumer resides in a metropolitan area with population greater than 1.110 500,000, 0 otherwise) (0.660)
Consumer's age (years) [GM, Ford, Chrysler] 0.023 (0.012)
Utility vehicle dummy [all alternatives] (1 if vehicle is utilitarian, - 1.160 0 otherwise) (0.178)
Luxury vehicle dummy [all alternatives] (1 if luxury vehicle and consumer's annual household income is less than $40,000, -0.410 0 otherwise) (0.230)
Summary statistic
Number of observations 555
Estimation by maximum likelihood Log-likelihood at zero - 1277.9 Log-likelihood at convergence - 1023.1
Source: Authors' calculations. Numbers in parentheses are standard errors. a. Coefficients are defined for only those alternatives listed in brackets.
78 Brookings Papers: Microeconomics 1991
Loyalty is determined by the vehicle brand most recently purchased; the loyalty effects of previously owned brands tend to be quickly de- preciated.20 The vehicle make dummies indicate a preference (all else equal) for cars made by the smaller manufacturers (whose dummy is set to zero) and by Ford (whose dummy is not statistically significantly different from zero). The vehicle attributes have plausible (as indicated by their elasticities shown in the appendix) and statistically reliable effects on choice. Because the vehicle attributes are allowed to change every year in our sample, they (along with changes in model offerings) incorporate the effects of public policies such as automobile regulations and quotas. Finally, we find older consumers have a positive preference for vehicles made by the major American manufacturers, while those consumers living in large metropolitan areas or in Pacific coast states have a positive preference for vehicles made by the major Japanese manufacturers.21 All consumers have a negative preference (all else
brand loyalty instead of actual brand loyalty in forming the independent variables for the vehicle choice models. The variables used in the reduced-form equation include charac- teristics of the consumer such as sex, household size, race, number of years driving, income, residential location, and characteristics of the brand such as total number of models offered since the consumer began to drive, market share during this period, and average reliability (as reported by Consumer Reports) for all models during this period. Regression and Poisson regression models were used for the predictions. The results indicated that the coefficients of the predicted brand loyalty variables were very similar to those for the actual brand loyalty variables, and that the coefficients of the other variables were virtually unchanged. Thus we used the actual brand loyalty variables for the choice models and forecasts reported here.
20. For this and other models presented later we investigated measures of loyalty that included the number of vehicles of a specified brand currently owned, whether new or used vehicles were previously owned, the number of brand-specific vehicles ever owned, and replacement loyalty. (These measures also serve to identify first-time buyers and the possible effects of reputation and advertising on them.) Models using these measures produced statistically inferior results. We also found that the appropriate unit for transaction loyalty is purchases as opposed to years (duration of loyalty) and that the linear functional form for transaction loyalty is statistically justified (that is, a chi-squared test revealed this restricted form was not statistically different from the unrestricted form that specified individual coefficients for one, two, three, and four or more previous brand purchases). Finally, we found no statistical difference in consumer loyalty among those purchasing light trucks and those purchasing automobiles, although we could not distinguish between purchasers of "heavy" light trucks (for example, Ford F-Series) and light trucks (for example, Toyota pickup).
21. Lave and Bradley (1980) also find a Pacific coast preference for Japanese vehicles that they attribute to variations in the Japanese manufacturers' marketing effort among
Fred Mannering and Clifford Winston 79
equal) for utility vehicles, and lower-income consumers have a negative preference for luxury vehicles.
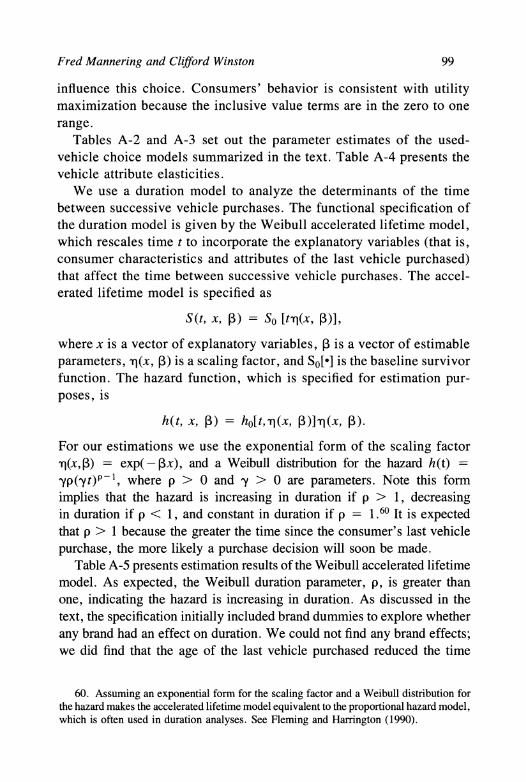
The estimation results for used-vehicle choice are similar to those for new-vehicle choice; thus we summarize the main findings here and present the estimates themselves in the appendix. Brand loyalty is also an important influence in used-vehicle choice, with Ford having the greatest loyalty in the used car market. Brand loyalty in the used car market is important to manufacturers because it could promote brand loyalty in the new car market. We also find there is a brand preference for Ford for used vehicles.
Vehicle Choice during the 1980s
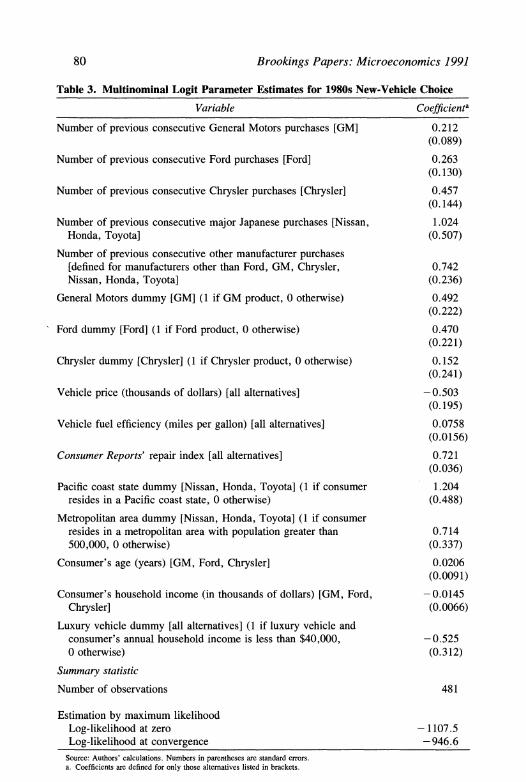
By 1980, Nissan, Honda, and Toyota became a significant factor in vehicle selection, and we could estimate separate brand loyalty coef- ficients for each of them. But we found that their loyalties were not statistically significantly different. Table 3 presents the new-vehicle choice estimates.
The most striking finding is that the Japanese manufacturers have significantly higher brand loyalty than their American competitors. The Japanese brand loyalty advantage is consistent with the reputation they earned during the 1980s of producing very high quality vehicles.22 Consistent with the poor reputation General Motors developed during the 1980s, GM has the lowest brand loyalty of the U. S. manufacturers.23
The brand preference dummies indicate that, all else equal, consum- ers want to buy American cars, especially Ford and General Motors
states. They also find an East Coast preference for Japanese vehicles. We found no such effect.
22. To the extent consumers have dealer loyalty, it appears in the Japanese case that this is an outgrowth of brand loyalty. Doron P. Levin, "Japan's Rich Cars Enrich Dealers," New York Times, November 6, 1990, p. DI, reports that dealers claim that Japanese makers have a strategy of sparing no expense or effort to improve the rituals of selling or servicing. Any additional effect of a dealer is likely to be captured in the brand preference dummies and model offerings in the choice set. The market share variable, although insignificant, was also an attempt to capture dealer effects.
23. For a representative account of consumers' dissatisfaction with GM's poor-quality cars during the decade, see Paul Ingrassia and Joseph B. White, "Losing the Race: With Its Market Share Sliding, GM Scrambles to Avoid a Calamity," Wall Street Journal, December 14, 1989, p. 1.
80 Brookings Papers: Microeconomics 1991
Table 3. Multinominal Logit Parameter Estimates for 1980s New-Vehicle Choice
Variable Coefficienta
Number of previous consecutive General Motors purchases [GM] 0.212 (0.089)
Number of previous consecutive Ford purchases [Ford] 0.263 (0.130)
Number of previous consecutive Chrysler purchases [Chrysler] 0.457 (0.144)
Number of previous consecutive major Japanese purchases [Nissan, 1.024 Honda, Toyota] (0.507)
Number of previous consecutive other manufacturer purchases [defined for manufacturers other than Ford, GM, Chrysler, 0.742 Nissan, Honda, Toyota] (0.236)
General Motors dummy [GM] (1 if GM product, 0 otherwise) 0.492 (0.222)
Ford dummy [Ford] (1 if Ford product, 0 otherwise) 0.470 (0.221)
Chrysler dummy [Chrysler] (1 if Chrysler product, 0 otherwise) 0.152 (0.241)
Vehicle price (thousands of dollars) [all alternatives] -0.503 (0.195)
Vehicle fuel efficiency (miles per gallon) [all alternatives] 0.0758 (0.0156)
Consumer Reports' repair index [all alternatives] 0.721 (0.036)
Pacific coast state dummy [Nissan, Honda, Toyota] (1 if consumer 1.204 resides in a Pacific coast state, 0 otherwise) (0.488)
Metropolitan area dummy [Nissan, Honda, Toyota] (1 if consumer resides in a metropolitan area with population greater than 0.714 500,000, 0 otherwise) (0.337)
Consumer's age (years) [GM, Ford, Chrysler] 0.0206 (0.0091)
Consumer's household income (in thousands of dollars) [GM, Ford, -0.0145 Chrysler] (0.0066)
Luxury vehicle dummy [all alternatives] (1 if luxury vehicle and consumer's annual household income is less than $40,000, -0.525 0 otherwise) (0.312)
Summary statistic
Number of observations 481
Estimation by maximum likelihood Log-likelihood at zero -1107.5 Log-likelihood at convergence -946.6
Source: Authors' calculations. Numbers in parentheses are standard errors. a. Coefficients are defined for only those alternatives listed in brackets.
Fred Mannering and Clifford Winston 81
products. The surge in brand preference during the past decade is pos- sibly spurred by nationalistic sentiment for an industry whose financial viability is strongly threatened by foreign competitors .24 As in the period before 1980, vehicle attributes have a plausible (see the appendix) and statistically reliable influence on choice.25 In addition, consumers living in Pacific coast states or large metropolitan areas have a positive pref- erence for vehicles made by the major Japanese firms, and older con- sumers have a preference for vehicles made by American firms. Finally, higher-income consumers have a preference against American manu- facturers and lower-income consumers have a preference against luxury vehicles.
The used-vehicle choice estimates, presented in the appendix, par- allel the findings for new vehicles. During the 1980s, Japanese auto- makers have developed the greatest brand loyalty and General Motors the lowest. General Motors and Ford, however, have a brand preference advantage.
An Assessment of the Findings: State Dependence vs. Heterogeneity
Our findings indicate that consumers with previous ownership ex- perience with a particular brand of car are more likely to purchase that brand of car in the future than consumers with no experience owning that brand. The influence of previous ownership experience has risen over time for Japanese automakers and fallen over time for American automakers. However, the propensity for repeat purchase and the change in this propensity could arise from two different sources. One is true brand loyalty or state dependence, which implies that consumers' pref- erences are affected by previous ownership experience. The other is
24. Matt DeLorenzo, "Flagging Spirits," Auto Week (July 2, 1990, p. 20), reports that "consumers would still like to have domestic products-85 percent of the people, given the choice of products of perceived equal quality, would choose domestic." It is not inconsistent to find greater brand loyalty to Japanese cars but brand preference for American cars. As explained earlier, brand preference reflects consumers' inherent preference all else (including brand loyalty) equal.
25. Because we found that fuel efficiency had a statistically reliable effect on 1980s choices, we used it instead of vehicle weight, whose effect was small and statistically insignificant, in the specification.
82 Brookings Papers: Microeconomics 1991
that consumers could differ in an unmeasured way, which increases their propensity to purchase a particular brand of vehicle. If we are truly estimating the effects of and changes in brand loyalty, it is essential that our parameter estimates capture true state dependence and not unmeasured differences in the population (that is, heterogeneity), which give rise to spurious state dependence.
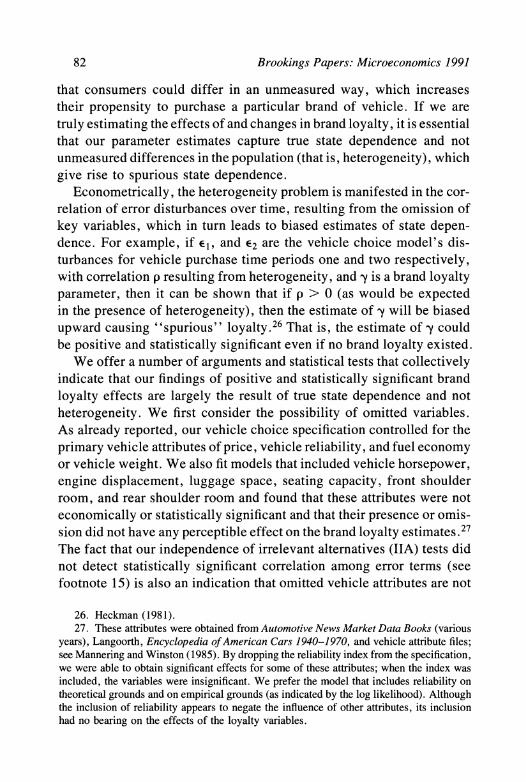
Econometrically, the heterogeneity problem is manifested in the cor- relation of error disturbances over time, resulting from the omission of key variables, which in turn leads to biased estimates of state depen- dence. For example, if E1, and E2 are the vehicle choice model's dis- turbances for vehicle purchase time periods one and two respectively, with correlation p resulting from heterogeneity, and y is a brand loyalty parameter, then it can be shown that if p > 0 (as would be expected in the presence of heterogeneity), then the estimate of y will be biased upward causing "spurious" loyalty.26 That is, the estimate of y could be positive and statistically significant even if no brand loyalty existed.
We offer a number of arguments and statistical tests that collectively indicate that our findings of positive and statistically significant brand loyalty effects are largely the result of true state dependence and not heterogeneity. We first consider the possibility of omitted variables. As already reported, our vehicle choice specification controlled for the primary vehicle attributes of price, vehicle reliability, and fuel economy or vehicle weight. We also fit models that included vehicle horsepower, engine displacement, luggage space, seating capacity, front shoulder room, and rear shoulder room and found that these attributes were not economically or statistically significant and that their presence or omis- sion did not have any perceptible effect on the brand loyalty estimates *27
The fact that our independence of irrelevant alternatives (IIA) tests did not detect statistically significant correlation among error terms (see footnote 15) is also an indication that omitted vehicle attributes are not
26. Heckman (1981). 27. These attributes were obtained from Automotive News Market Data Books (various
years), Langoorth, Encyclopedia of American Cars 1940-1970, and vehicle attribute files; see Mannering and Winston (1985). By dropping the reliability index from the specification, we were able to obtain significant effects for some of these attributes; when the index was included, the variables were insignificant. We prefer the model that includes reliability on theoretical grounds and on empirical grounds (as indicated by the log likelihood). Although the inclusion of reliability appears to negate the influence of other attributes, its inclusion had no bearing on the effects of the loyalty variables.
Fred Mannering and Clifford Winston 83
affecting error term correlation and are not a source of heterogeneity. Our specifications also controlled for the primary socioeconomic variables: income, residential location, and age. We fit models that included house- hold size, number of children, marital status, household employment, race, type of residence, home ownership, occupation, and education level but could not find that any of these variables had a significant economic and statistical effect or affected the brand loyalty estimates. 28
Another possible source of heterogeneity arises from explanatory variables that do not change over time. The variables included in our choice models do change over time. The values of the vehicle attributes and socioeconomic characteristics are those at the time the vehicle purchase decision was made.
We also conducted three statistical tests. First the endogeneity test reported in footnote 19 strongly suggests that the brand loyalty coef- ficients are not being influenced by heterogeneity effects. 29
Second, we adapted an idea from James Heckman that suggests that heterogeneity problems can be controlled if models are estimated con- ditional on previous state dependence. 30 For example, a vehicle choice model could be estimated for those consumers who previously pur- chased American cars. It is argued that such conditioning controls for the possibility that some individuals are more likely in some unmeasured way to purchase an American brand. We estimated models conditioned on previous purchases being American brands, on previous purchases being Japanese brands, and on previous purchases being specific brands (for example, GM) and consistently found that the appropriate brand loyalty coefficients from the conditional models were not statistically significantly different from those in the unconditional models reported here. This suggests that heterogeneity has a minimal presence in the brand loyalty findings.
As a final test of state dependence, we applied some ideas of Gary Chamberlain to explore whether the effects of repeat-purchase behavior
28. These socioeconomic variables were included in the Allison-Fisher data base. Pre- vious vehicle choice models have also found these socioeconomic variables to be insig- nificant. See, for example, Train (1986).
29. It may be argued that this test is inadequate because the instruments are correlated with key omitted variables. This criticism seems tenuous in light of our search for such variables.
30. Heckman (1981).
84 Brookings Papers: Microeconomics 1991
were influenced by time or the ordering of purchases.3" For example, consider a consumer who purchases a new Ford in the current period (1991) and had previously purchased a Ford in 1985, 1978, and 1970. Now assume this consumer made the same purchases as before except that in 1985 he purchased a GM instead of a Ford. Two important findings for these cases based on our models are as follows. First, the effects of the 1978 and 1970 purchases in the first case are statistically significant and indeed not statistically significantly different from the effect of the 1985 purchase, thus enabling us to specify a common brand loyalty parameter for the three consecutive brand loyal purchases. Second, the effects of the 1978 and 1970 Ford purchases in the second case are now statistically insignificant because of the break in loyalty in 1985. These findings suggest that we are identifying state dependence because we are able to capture the persistent influence of repeat-purchase behavior several periods ago and because we can distinguish between breaks in and contin- uations of repeat-purchase behavior.
Although we recognize that none of our arguments or statistical tests are definitive, collectively they are strongly suggestive that our findings are capturing true state dependence. One possible statistical reason for this, as illustrated by the last example, is that our observations for each consumer (vehicle purchases) tend to be several years apart, thus weak- ening the correlation of possible unmeasured influences.
Additional Findings on Brand Loyalty
It is also useful to step back from statistical arguments and to use the estimated brand loyalty parameters to calculate various measures of interest. In the process, we attempt to reveal the intuitive plausibility of the estimates and present additional results.
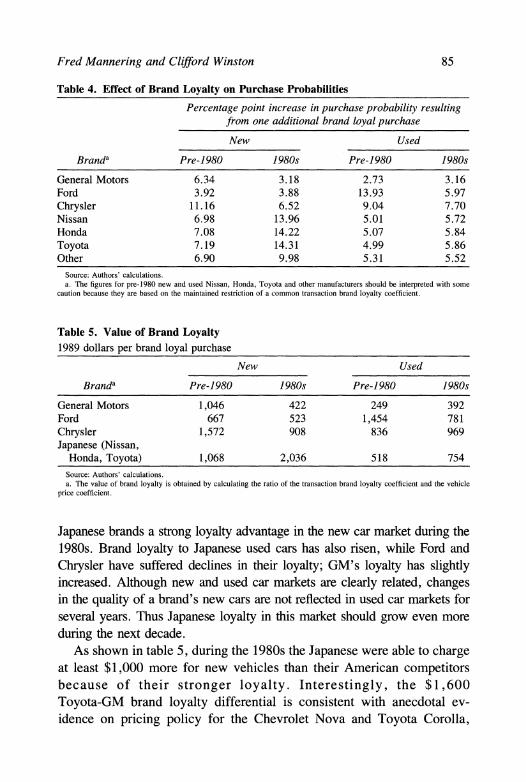
Table 4 summarizes the significant loss in loyalty that American brands experienced during the 1980s. Before 1980, for example, the purchase of a new General Motors product increased the probability that a consumer's next new car would be a GM by 6.3 percentage points; after 1980, this increase declined by half, to 3.2 percentage points.32 The erosion of loyalty to Amer- ican brands and the increase in loyalty to Japanese brands has given the
31. Chamberlain (1985). 32. This and other comparisons are based on pre-1980 and 1980s specifications that
are slightly different. However, virtually the same findings concerning brand loyalty per- sisted when we restricted the specifications to be identical.
Fred Mannering and Clifford Winston 85
Table 4. Effect of Brand Loyalty on Purchase Probabilities
Percentage point increase in purchase probability resulting from one additional brand loyal purchase
New Used
Branda Pre-1980 1980s Pre-1980 1980s
General Motors 6.34 3.18 2.73 3.16 Ford 3.92 3.88 13.93 5.97 Chrysler 11.16 6.52 9.04 7.70 Nissan 6.98 13.96 5.01 5.72 Honda 7.08 14.22 5.07 5.84 Toyota 7.19 14.31 4.99 5.86 Other 6.90 9.98 5.31 5.52
Source: Authors' calculations. a. The figures for pre-1980 new and used Nissan, Honda, Toyota and other manufacturers should be interpreted with some
caution because they are based on the maintained restriction of a common transaction brand loyalty coefficient.
Table 5. Value of Brand Loyalty 1989 dollars per brand loyal purchase
New Used
Branda Pre-1980 1980s Pre-1980 1980s
General Motors 1,046 422 249 392 Ford 667 523 1,454 781 Chrysler 1,572 908 836 969 Japanese (Nissan,
Honda, Toyota) 1,068 2,036 518 754 Source: Authors' calculations. a. The value of brand loyalty is obtained by calculating the ratio of the transaction brand loyalty coefficient and the vehicle
price coefficient.
Japanese brands a strong loyalty advantage in the new car market during the 1980s. Brand loyalty to Japanese used cars has also risen, while Ford and Chrysler have suffered declines in their loyalty; GM's loyalty has slightly increased. Although new and used car markets are clearly related, changes in the quality of a brand's new cars are not reflected in used car markets for several years. Thus Japanese loyalty in this market should grow even more during the next decade.
As shown in table 5, during the 1980s the Japanese were able to charge at least $1,000 more for new vehicles than their American competitors because of their stronger loyalty. Interestingly, the $1,600 Toyota-GM brand loyalty differential is consistent with anecdotal ev- idence on pricing policy for the Chevrolet Nova and Toyota Corolla,
86 Brookings Papers: Microeconomics 1991
nearly identical cars produced by the NUMMI joint venture operated by GM and Toyota. 33 The Japanese brand loyalty premium most likely reflects the return from their initial investment in reputation.34
Extensions of Brand Loyalty
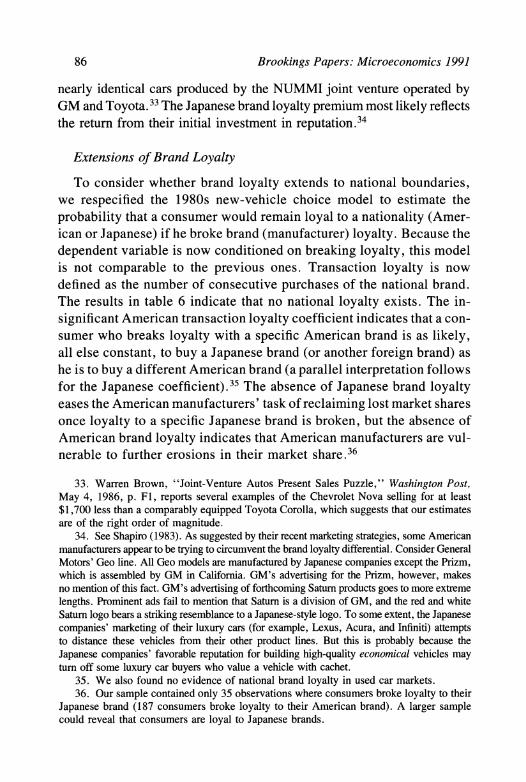
To consider whether brand loyalty extends to national boundaries, we respecified the 1980s new-vehicle choice model to estimate the probability that a consumer would remain loyal to a nationality (Amer- ican or Japanese) if he broke brand (manufacturer) loyalty. Because the dependent variable is now conditioned on breaking loyalty, this model is not comparable to the previous ones. Transaction loyalty is now defined as the number of consecutive purchases of the national brand. The results in table 6 indicate that no national loyalty exists. The in- significant American transaction loyalty coefficient indicates that a con- sumer who breaks loyalty with a specific American brand is as likely, all else constant, to buy a Japanese brand (or another foreign brand) as he is to buy a different American brand (a parallel interpretation follows for the Japanese coefficient).35 The absence of Japanese brand loyalty eases the American manufacturers' task of reclaiming lost market shares once loyalty to a specific Japanese brand is broken, but the absence of American brand loyalty indicates that American manufacturers are vul- nerable to further erosions in their market share.36
33. Warren Brown, "Joint-Venture Autos Present Sales Puzzle," Washington Post, May 4, 1986, p. Fl, reports several examples of the Chevrolet Nova selling for at least $1,700 less than a comparably equipped Toyota Corolla, which suggests that our estimates are of the right order of magnitude.
34. See Shapiro (1983). As suggested by their recent marketing strategies, some American manufacturers appear to be trying to circumvent the brand loyalty differential. Consider General Motors' Geo line. All Geo models are manufactured by Japanese companies except the Prizm, which is assembled by GM in California. GM's advertising for the Prizm, however, makes no mention of this fact. GM's advertising of forthcoming Saturn products goes to more extreme lengths. Prominent ads fail to mention that Saturn is a division of GM, and the red and white Saturn logo bears a striking resemblance to a Japanese-style logo. To some extent, the Japanese companies' marketing of their luxury cars (for example, Lexus, Acura, and Infiniti) attempts to distance these vehicles from their other product lines. But this is probably because the Japanese companies' favorable reputation for building high-quality economical vehicles may turn off some luxury car buyers who value a vehicle with cachet.
35. We also found no evidence of national brand loyalty in used car markets. 36. Our sample contained only 35 observations where consumers broke loyalty to their
Japanese brand (187 consumers broke loyalty to their American brand). A larger sample could reveal that consumers are loyal to Japanese brands.
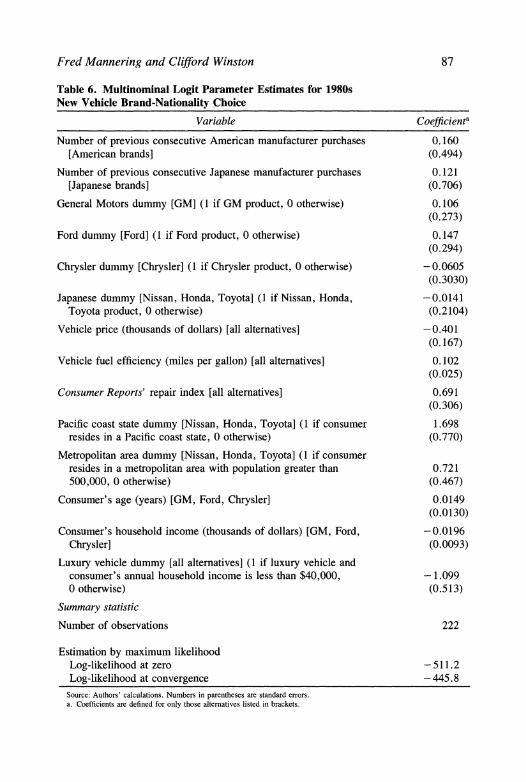
Fred Mannering and Clifford Winston 87
Table 6. Multinominal Logit Parameter Estimates for 1980s New Vehicle Brand-Nationality Choice
Variable Coefficienta
Number of previous consecutive American manufacturer purchases 0.160 [American brands] (0.494)
Number of previous consecutive Japanese manufacturer purchases 0.121 [Japanese brands] (0.706)
General Motors dummy [GM] (1 if GM product, 0 otherwise) 0.106 (0.273)
Ford dummy [Ford] (1 if Ford product, 0 otherwise) 0.147 (0.294)
Chrysler dummy [Chrysler] (1 if Chrysler product, 0 otherwise) -0.0605 (0.3030)
Japanese dummy [Nissan, Honda, Toyota] (1 if Nissan, Honda, -0.0141 Toyota product, 0 otherwise) (0.2104)
Vehicle price (thousands of dollars) [all alternatives] -0.401 (0.167)
Vehicle fuel efficiency (miles per gallon) [all alternatives] 0.102 (0.025)
Consumer Reports' repair index [all alternatives] 0.691 (0.306)
Pacific coast state dummy [Nissan, Honda, Toyota] (1 if consumer 1.698 resides in a Pacific coast state, 0 otherwise) (0.770)
Metropolitan area dummy [Nissan, Honda, Toyota] (1 if consumer resides in a metropolitan area with population greater than 0.721 500,000, 0 otherwise) (0.467)
Consumer's age (years) [GM, Ford, Chrysler] 0.0149 (0.0130)
Consumer's household income (thousands of dollars) [GM, Ford, -0.0196 Chrysler] (0.0093)
Luxury vehicle dummy [all alternatives] (1 if luxury vehicle and consumer's annual household income is less than $40,000, - 1.099 0 otherwise) (0.513)
Summary statistic
Number of observations 222
Estimation by maximum likelihood Log-likelihood at zero -511.2 Log-likelihood at convergence - 445.8
Source: Authors' calculations. Numbers in parentheses are standard errors. a. Coefficients are defined for only those alternatives listed in brackets.
88 Brookings Papers: Microeconomics 1991
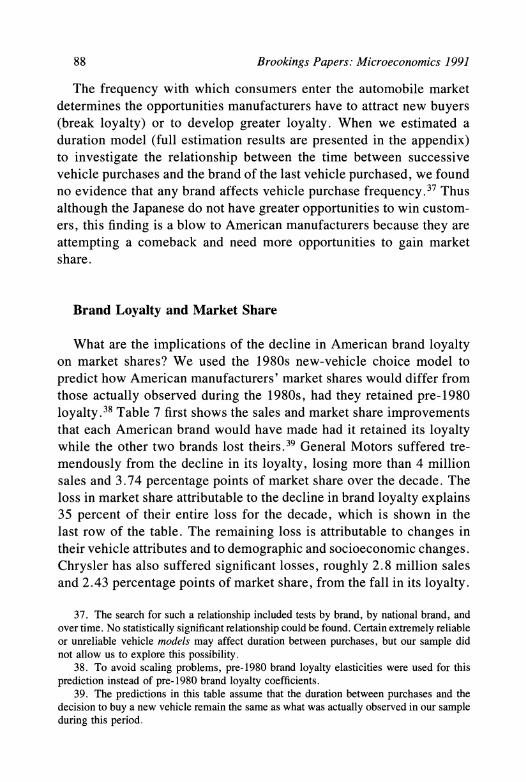
The frequency with which consumers enter the automobile market determines the opportunities manufacturers have to attract new buyers (break loyalty) or to develop greater loyalty. When we estimated a duration model (full estimation results are presented in the appendix) to investigate the relationship between the time between successive vehicle purchases and the brand of the last vehicle purchased, we found no evidence that any brand affects vehicle purchase frequency.37 Thus although the Japanese do not have greater opportunities to win custom- ers, this finding is a blow to American manufacturers because they are attempting a comeback and need more opportunities to gain market share.
Brand Loyalty and Market Share
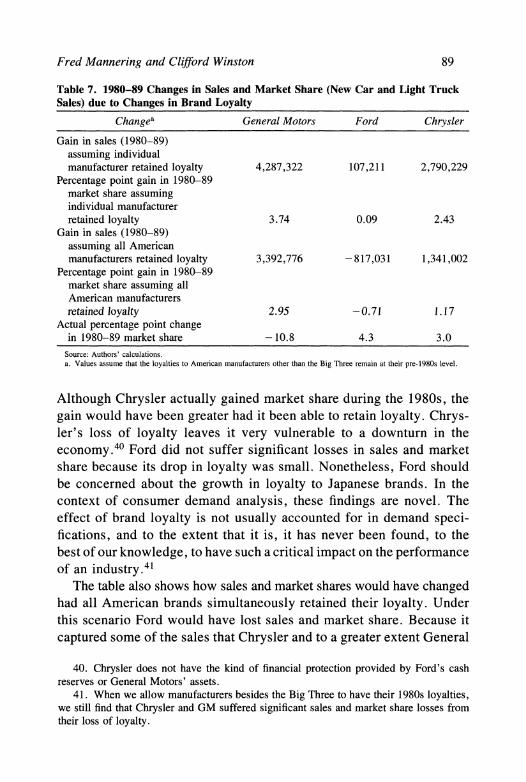
What are the implications of the decline in American brand loyalty on market shares? We used the 1980s new-vehicle choice model to predict how American manufacturers' market shares would differ from those actually observed during the 1980s, had they retained pre-1980 loyalty.38 Table 7 first shows the sales and market share improvements that each American brand would have made had it retained its loyalty while the other two brands lost theirs.39 General Motors suffered tre- mendously from the decline in its loyalty, losing more than 4 million sales and 3.74 percentage points of market share over the decade. The loss in market share attributable to the decline in brand loyalty explains 35 percent of their entire loss for the decade, which is shown in the last row of the table. The remaining loss is attributable to changes in their vehicle attributes and to demographic and socioeconomic changes. Chrysler has also suffered significant losses, roughly 2.8 million sales and 2.43 percentage points of market share, from the fall in its loyalty.
37. The search for such a relationship included tests by brand, by national brand, and over time. No statistically significant relationship could be found. Certain extremely reliable or unreliable vehicle models may affect duration between purchases, but our sample did not allow us to explore this possibility.
38. To avoid scaling problems, pre-1980 brand loyalty elasticities were used for this prediction instead of pre-1980 brand loyalty coefficients.
39. The predictions in this table assume that the duration between purchases and the decision to buy a new vehicle remain the same as what was actually observed in our sample during this period.
Fred Mannering and Clifford Winston 89
Table 7. 1980-89 Changes in Sales and Market Share (New Car and Light Truck Sales) due to Changes in Brand Loyalty
Changea General Motors Ford Chrysler
Gain in sales (1980-89) assuming individual manufacturer retained loyalty 4,287,322 107,211 2,790,229
Percentage point gain in 1980-89 market share assuming individual manufacturer retained loyalty 3.74 0.09 2.43
Gain in sales (1980-89) assuming all American manufacturers retained loyalty 3,392,776 -817,031 1,341,002
Percentage point gain in 1980-89 market share assuming all American manufacturers retained loyalty 2.95 -0.71 1.17
Actual percentage point change in 1980-89 market share - 10.8 4.3 3.0
Source: Authors' calculations. a. Values assume that the loyalties to American manufacturers other than the Big Three remain at their pre-1980s level.
Although Chrysler actually gained market share during the 1980s, the gain would have been greater had it been able to retain loyalty. Chrys- ler's loss of loyalty leaves it very vulnerable to a downturn in the economy.40 Ford did not suffer significant losses in sales and market share because its drop in loyalty was small. Nonetheless, Ford should be concerned about the growth in loyalty to Japanese brands. In the context of consumer demand analysis, these findings are novel. The effect of brand loyalty is not usually accounted for in demand speci- fications, and to the extent that it is, it has never been found, to the best of our knowledge, to have such a critical impact on the performance of an industry.41
The table also shows how sales and market shares would have changed had all American brands simultaneously retained their loyalty. Under this scenario Ford would have lost sales and market share. Because it captured some of the sales that Chrysler and to a greater extent General
40. Chrysler does not have the kind of financial protection provided by Ford's cash reserves or General Motors' assets.
41. When we allow manufacturers besides the Big Three to have their 1980s loyalties, we still find that Chrysler and GM suffered significant sales and market share losses from their loss of loyalty.
90 Brookings Papers: Microeconomics 1991
Motors lost from the decline in their loyalty, Ford benefited, on net, from the simultaneous loss in American brand loyalty. In contrast, General Motors and Chrysler lost sales and market share from the simultaneous decline in loyalty.
Corporate Behavior and the Decline in American Brand Loyalty
There are two possible explanations for the decline in American brand loyalty during the 1980s. One is that the Japanese automakers, as new entrants in the 1960s and 1970s, expanded the set of automobile alter- natives facing consumers, causing some of them to stray from their American brand. As consumers became better informed about the Jap- anese brands, they developed strong loyalty to them. The second ex- planation is that the price-quality offerings of American automakers eroded during the 1970s and 1980s; as consumers became better in- formed about these developments, they began to reject their American brand.
There is no question that the entry of Japanese automakers into the U.S. market contributed significantly to the decline in American brand loyalty. What is less certain is whether American automakers contrib- uted to their own problems. To explore this issue, we formed a sub- sample of our vehicle choice sample consisting of consumers who never bought a Japanese car even when they broke loyalty with their American brand. When we estimated vehicle choice models based on this sub- sample of consumers, we found that their American brand loyalty coef- ficients for the pre- 1980 and 1980s models were not statistically significantly different from the American brand loyalty coefficients ob- tained for these models from the full sample. Some consumers appear to have acquired negative information primarily from their own and other American brands that reduced their loyalty.42
Although it is extremely difficult to specify a model that could be
42. We also fit separate models for those consumers who entered the vehicle market for the first time during the 1980s and for those who entered the market before 1980. Tests again revealed that there was no statistically significant difference in the brand loyalty coefficients (during the 1980s) for these groups of consumers.
Fred Mannering and Clifford Winston 91
used to identify quantitatively American automaker actions that can explain their loss in loyalty, we can suggest some developments that may have discouraged repeat buying of their cars and that may have enabled the Japanese to develop loyalty to their cars.4 Examples of management mistakes include slow development and inadequate testing of new models, slow development of existing models, and poor pricing strategies in response to government policy that gave them competitive advantages.
A major problem facing American automakers over the past decade is that the Japanese have a significant advantage in new product de- velopment time. Because they have been able to develop a quality vehicle in much less time than their U. S. competitors, the Japanese have responded more quickly to the market and have been able to break brand loyalty among owners of American brands.44 American manu- facturers have tried to reduce new product development time by re- ducing the time devoted to testing, which has compounded their loyalty losses during the 1980s. General Motors, in particular, appears to let the public serve as a testing ground for new models instead of having the engineering department conduct adequate testing. During the 1970s, GM accumulated a record of premature vehicle introductions that in- cluded the Vega and its poorly designed and tested aluminum-sleeved cylinder linings, the infamous diesel cars, and vehicles equipped with the 4-6-8 engine. The latter two resulted in class action suits against the company. General Motors' reputation for premature vehicle intro- duction prompted Consumer Reports during the 1980s to recommend that consumers avoid GM models in their first year.45
American automakers have also been slow to develop existing vehicle models to retain and increase loyalty. For example, Ford attracted many buyers with its Taurus and Sable in 1985, the same year a new Honda Accord appeared. In 1989 Honda introduced an all-new Accord, while
43. Some of these developments might have also affected brand attributes at the time of purchase.
44. See Clark, Chew, and Fujimoto (1987). 45. In a recent Auto Week survey ("What Do We Think?" July 2, 1990, p. 21), 68
percent of the respondents said they would not buy a domestic car in its first year of production; 47 percent of the respondents said they would not buy an import in its first year of production.
92 Brookings Papers: Microeconomics 1991
big changes for Taurus are still years away. In the meantime, the Accord has become the largest selling model in the United States, while sales for the Taurus have declined.
Kim Clark and Takahiro Fujimoto argue that the consistent ability of Japanese automakers to develop new models and redevelop existing models in response to the market is crucial to the development of consumer loyalty.46 Japanese product development continues to mesh with consumers' expectations of how a company's product should evolve. Clark and Fujimoto point out that although the Honda Accord was one of the top-selling cars in the 1980s, when it was time to develop the 1990 Accord, Honda perceived that consumers were evolving out of sporty sedans toward family models. Honda therefore repositioned the Accord (moving it up-market) to satisfy consumers' expectations.
During the early 1980s the U.S. government negotiated quotas with the Japanese and in the mid-1980s helped lower the value of the dollar. Both policies could have helped the manufacturers increase repeat- purchase behavior and possibly develop greater loyalty, but the auto- makers' response may have lost loyalty. We have shown elsewhere that the U.S. manufacturers' reaction to the quotas was to raise prices.47 This strategy may have been profit maximizing in the short run, but it sacrificed sales and market share to the Japanese and, in the long run, may have resulted in permanent sales losses because Japanese loyalty is so strong. The U.S. firms also missed an opportunity to gain share and develop loyalty when the yen appreciated dramatically after 1985. Their strategy was again to raise prices as Japanese "costs" rose. By not pricing aggressively, U.S. companies failed to break loyalty to Japanese cars and possibly to develop greater loyalty to their cars.48 Japanese competitors, by contrast, have developed a reputation for pricing aggressively to gain market share. Most recently, Honda raised the price only 6 percent when it introduced the enlarged new (1990) Accord, an increase less than those on some unchanged U.S. models.
The evidence, admittedly not empirically modeled, suggests that American automakers' product development and pricing mistakes dur-
46. Clark and Fujimoto (1990). 47. Mannering and Winston (1987b). 48. Pricing can affect loyalty by affecting repeat-purchase behavior, which could, all
else constant, develop into brand loyalty.
Fred Mannering and Clifford Winston 93
Table 8. Forecasts of Changes in Car and Light Truck Market Shares during the 1990s Percentage point change by brand
Scenario I Scenario 2 Scenario 3
Change during Change during Change during Manufacturer 1989 share the 1990s the 1990s the 1990s
General Motors 35.1 -4.20 -3.26 -3.14 Ford 24.6 -3.20 -2.76 -2.15 Chrysler 13.8 - 3.40 -3.18 -2.40 Nissan 4.6 +2.50 +2.05 + 1.72 Honda 5.4 + 2.72 +2.20 + 1.79 Toyota 6.5 +3.18 +2.41 +1.95
Source: Authors' calculations.
ing the 1980s contributed to their decade-long loyalty losses, the full
consequences of which have yet to be felt.
Brand Loyalty and Market Share during the 1990s
What effect will the loss in American brand loyalty have on market shares during the 1990s? For this forecast we used our 1980s joint vehicle and new-used choice models and the duration model and as- sumed that brand preferences and loyalties during the 1990s remained constant at 1980s levels. Three scenarios regarding changes in socio- economic conditions during the 1990s are presented.49 The first assumes that consumer real income increases 2 percent per year and that the
average consumer age in 1999 is 1.5 years greater than in 1990. We also assume that over the decade residential population, accounting for
migration and population growth, shifts 10 percent to the Pacific coast
states, and shifts 10 percent to large metropolitan areas (population greater than 500,000). The second scenario assumes the same change in income but assumes a 2.5-year increase in consumer age and resi-
dential shifts of 5 percent to Pacific coast states and 8 percent to large
metropolitan areas. A final scenario assumes that socioeconomic con- ditions are unchanged during the decade.
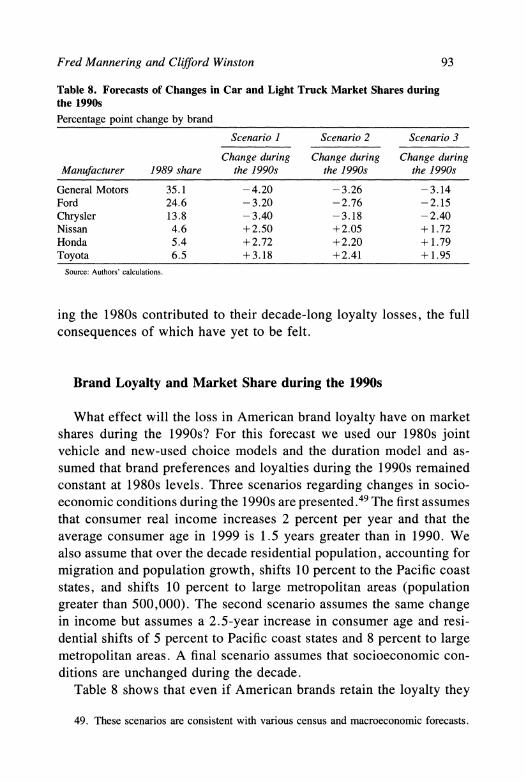
Table 8 shows that even if American brands retain the loyalty they
49. These scenarios are consistent with various census and macroeconomic forecasts.
94 Brookings Papers: Microeconomics 1991
had during the 1980s, they will continue to suffer substantial losses in market share during the 1990s because Japanese brands have much greater loyalty. The change in socioeconomic conditions generally fa- vors the Japanese firms, but, as shown in scenario 3, U.S. firms suffer significant losses even without these changes. The forecasts optimis- tically assume the Japanese do not achieve greater loyalty or increases in brand preference through improvements in vehicle reliability or by extending the range of their models. 50 Under the first and most plausible scenario, General Motors' market share falls to nearly 30 percent; Nis- san's, Honda's, and Toyota's combined share begins to approach that level; Ford's share falls to 21 percent; Chrysler's share falls to 10 percent; and Toyota's rises close to 10 percent, enabling it to become the third largest seller in America under more likely assumptions con- cerning its reliability improvements and models. Unless the American brands' loss of loyalty during the 1980s is reversed, the negative inertia that has developed will pose a serious threat to the financial performance of the American manufacturers during the 1990s.51
Corporate and Public Policy to Promote American Brand Loyalty
What can American automakers do to regain loyalty? Can govern- ment policy help?
Michael Porter characterizes effective policy toward industry as chal- lenging an industry to advance.52 Every two years, for example, Jap- anese automakers must subject their new domestic vehicles to the strict vehicle quality inspection system run by the Japanese government. Because cars for export are produced on a similar production line as domestic cars, this system has effectively promoted export quality stan-
50. For illustrative forecasts of the effect of changes in brand preference on market shares, see Mannering and Winston (1987a).
51. Forecasts of market shares during the 1990s that assume American automakers retained pre-1980 loyalty confirmed that the American automakers' potential loss of market share during the 1990s is largely attributable to the decline in their loyalty.
52. Porter (1990).
Fred Mannering and Clifford Winston 95
dards for all Japanese vehicles.53 In the process, it may have helped each Japanese manufacturer to develop brand loyalty, and it could promote national (Japanese) brand loyalty in the United States.54
American economists, however, generally view regulation as an in- trusion of government into competition that undermines competitive advantage. Indeed, tighter emissions standards and higher fuel economy requirements, despite their possible benefits, are likely to force Amer- ican automakers to raise prices and to change their fleet mix. Japanese automakers might be given an opportunity to attract customers who would have continued to buy their American brand had its models not been altered by regulations. (It will be recalled that once a customer breaks loyalty with an American brand he is as likely to buy a Japanese brand as he is to buy a different American brand.)
Without invoking formal regulations, the U.S. government could meet Porter's definition of effective policy and play a constructive role by conducting objective comparative evaluations of the performance of American and foreign automakers' new cars and by publicizing the findings .55 Alternatively, they could hire an independent firm to conduct these assessments. These evaluations could provide information and incentives to improve performance in the same spirit as government reports of airlines' on-time performance.56 In addition, Shapiro points out that this type of information could benefit consumers by lowering the premium to high-quality producers that exists because of imperfect
53. Export quality standards have also been promoted by restrictions on the export of used cars. According to Japanese officials, if sold too widely abroad, old cars might give Japan's new car makers a bad name (see Clay Chandler, "Japanese and Soviets Collide in Lots of Used-Car Dealers," Wall Street Journal, November 15, 1990, p.1).
54. A possible benefit of this policy, which we could not quantify, is that it reduced the likelihood of negative reputation effects among manufacturers. Such effects could arise from a bad model that hurts the sales of all brands of the same nationality as the brand that produced the bad model. All American manufacturers, for example, may have suffered reputation losses from such "problematic" models as the Ford Pinto and Chevrolet Vega. Jarrell and Peltzman (1985) found that recalls of American manufacturers' cars caused losses to their American rivals. They were unable to determine whether foreign rivals were affected.
55. These evaluations would differ from Consumer Reports' subjective evaluations, which are primarily based on asking consumers to evaluate vehicle quality. The government's eval- uation of vehicle craftsmanship and quality would go beyond current governmental and non- governmental evaluations of emissions, fuel economy, and safety performance.
56. These reports have been found by Morrison and Winston (1989) to influence trav- elers' choices of airlines and have been used by airlines for promotional purposes.
96 Brookings Papers: Microeconomics 1991
information on vehicle quality.57 More generally, the presence of brand loyalty in any market suggests the existence of a welfare loss to con- sumers because of imperfect information concerning product quality. Complete elimination of brand loyalty suggests consumers would ben- efit and, in at least the automobile market, American firms would also benefit.58
Ultimately the American automobile manufacturers must take full responsibility for overcoming the Japanese loyalty advantage. First, they must not repeat their product development and pricing mistakes.59 Moreover, they must develop new and existing models to satisfy con- sumers' evolving expectations. They should also use pricing to develop repeat-purchase behavior and ultimately loyalty. Oldsmobile, for ex- ample, has attempted to retain loyalty by offering full return credit toward the purchase of another Oldsmobile to any dissatisfied owner of a new Oldsmobile. Automakers could offer repeat buyers discounts similar to frequent flier programs, increasing, for example, the used car trade-in allowance if the car is their brand or offering a discount to customers who currently own their brand. These discounts could be increased with repeat-purchase frequency. American automakers could also use pricing initiatives to break Japanese loyalty. For example, they could increase the trade-in allowance for Japanese cars or offer a dis- count to customers who have traditionally owned Japanese cars. The Japanese could adopt the same pricing strategies, but they might be reluctant to do so because their own loyalty is so strong.
Because brand loyalty partly reflects the historical quality of an au- tomaker's vehicles, it may give the impression that the relative quality of certain brands' vehicles is higher than it actually is. One way to correct this impression is through advertising. Indeed, this is what Lee
57. Shapiro (1983) also outlines the theoretical arguments for minimum and optimal quality standards. More empirical research is needed to determine whether such standards, which may have benefited Japanese consumers and producers, would be desirable in Amer- ica.
58. Forecasts of market shares during the 1990s that assume no automaker has brand loyalty indicate American manufacturers would lose only 1.0-1.5 percentage points of market share while the Japanese manufacturers would gain only 1.0-1.2 percentage points of market share.
59. Some might argue that the American firms' myopia was optimal. Public statements by GM and other firms, however, indicate considerable regret and concern over recent losses of market share.
Fred Mannering and Clifford Winston 97
Iacocca of Chrysler has attempted to do when he claims that "Chrysler's cars are every bit as good as the Japanese, but nobody knows it." These advertisements reveal the importance and difficulty of fighting history. This approach could be effective in breaking Japanese loyalty, but only if the brand's vehicles live up to advertised claims.
Conclusion
The historical quality and value of a brand of automobile and the reputation it has developed among consumers as reflected in brand loyalty directly affect its current and future performance in the mar- ketplace. Having allowed their loyalty to erode, American automakers have suffered and will continue to suffer significant losses in market share.
The challenge that American automakers face in trying to catch up with, or, worse, in trying not to fall further behind, the Japanese au- tomakers' loyalty advantage is formidable. Although American auto- makers have improved the quality and value of their vehicles, the Japanese automakers continue to make improvements in their vehicles that pre- vent U. S. makers from closing the gap completely. To be sure, im- provements in American vehicles will eventually generate greater brand loyalty and will also improve brand preference. But because Japanese vehicles have such an outstanding reputation and strong brand loyalty, it will take a long time for American automakers to develop the rep- utation that their vehicles are comparable in all important respects to Japanese vehicles. And quality improvements alone may not be suffi- cient. American automakers must continually develop new models and redevelop existing models that mesh with consumers' evolving values and lifestyles.
The lesson for American automakers is that they must be more cog- nizant of the long-run effects of their policies and their response to government policies. Historically, they have rarely approached the mar- ket with this mindset. With events in the industry unfolding so rapidly, the most pressing concern is whether the American automakers have time to change.
98 Brookings Papers: Microeconomics 1991
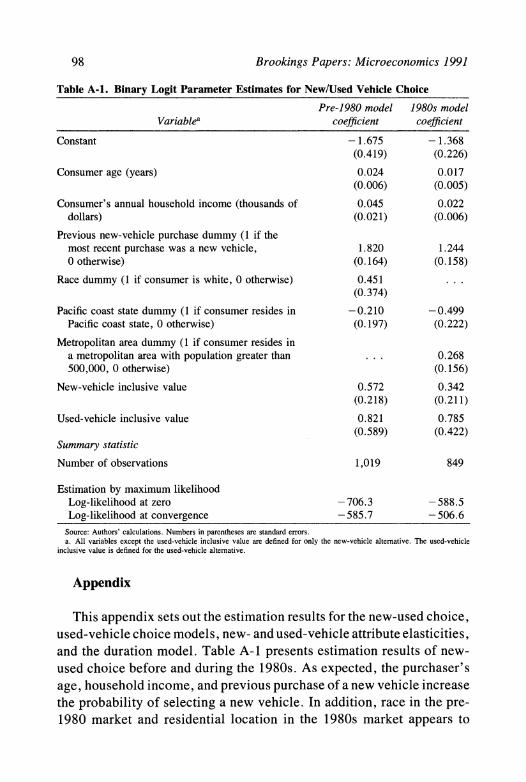
Table A-1. Binary Logit Parameter Estimates for New/Used Vehicle Choice
Pre-1980 model 1980s model Variablea coefficient coefficient
Constant - 1.675 - 1.368 (0.419) (0.226)
Consumer age (years) 0.024 0.017 (0.006) (0.005)
Consumer's annual household income (thousands of 0.045 0.022 dollars) (0.021) (0.006)
Previous new-vehicle purchase dummy (1 if the most recent purchase was a new vehicle, 1.820 1.244 0 otherwise) (0.164) (0.158)
Race dummy (1 if consumer is white, 0 otherwise) 0.451 ... (0.374)
Pacific coast state dummy (1 if consumer resides in -0.210 -0.499 Pacific coast state, 0 otherwise) (0.197) (0.222)
Metropolitan area dummy (1 if consumer resides in a metropolitan area with population greater than . . . 0.268 500,000, 0 otherwise) (0.156)
New-vehicle inclusive value 0.572 0.342 (0.218) (0.211)
Used-vehicle inclusive value 0.821 0.785 (0.589) (0.422)
Summary statistic
Number of observations 1,019 849
Estimation by maximum likelihood Log-likelihood at zero -706.3 -588.5 Log-likelihood at convergence -585.7 -506.6
Source: Authors' calculations. Numbers in parentheses are standard errors. a. All variables except the used-vehicle inclusive value are defined for only the new-vehicle alternative. The used-vehicle
inclusive value is defined for the used-vehicle alternative.
Appendix
This appendix sets out the estimation results for the new-used choice, used-vehicle choice models, new- and used-vehicle attribute elasticities, and the duration model. Table A-I presents estimation results of new- used choice before and during the 1980s. As expected, the purchaser's age, household income, and previous purchase of a new vehicle increase the probability of selecting a new vehicle. In addition, race in the pre- 1980 market and residential location in the 1980s market appears to
Fred Mannering and Clifford Winston 99
influence this choice. Consumers' behavior is consistent with utility maximization because the inclusive value terms are in the zero to one range.
Tables A-2 and A-3 set out the parameter estimates of the used- vehicle choice models summarized in the text. Table A-4 presents the vehicle attribute elasticities.
We use a duration model to analyze the determinants of the time between successive vehicle purchases. The functional specification of the duration model is given by the Weibull accelerated lifetime model, which rescales time t to incorporate the explanatory variables (that is, consumer characteristics and attributes of the last vehicle purchased) that affect the time between successive vehicle purchases. The accel- erated lifetime model is specified as
S(t, x, I) = So [t-r(x, )],
where x is a vector of explanatory variables, m is a vector of estimable parameters, -r(x, 1) is a scaling factor, and SO[-] is the baseline survivor function. The hazard function, which is specified for estimation pur- poses, is
h(t, x, 1) = ho[tvq(x, P)]-r(x, 1).
For our estimations we use the exponential form of the scaling factor -r(x,1) = exp(-Px), and a Weibull distribution for the hazard h(t) = ,yp(,yt)P-1, where p > 0 and y > 0 are parameters. Note this form implies that the hazard is increasing in duration if p > 1, decreasing in duration if p < 1, and constant in duration if p = 1.60 It is expected that p > 1 because the greater the time since the consumer's last vehicle purchase, the more likely a purchase decision will soon be made.
Table A-5 presents estimation results of the Weibull accelerated lifetime model. As expected, the Weibull duration parameter, p, is greater than one, indicating the hazard is increasing in duration. As discussed in the text, the specification initially included brand dummies to explore whether any brand had an effect on duration. We could not find any brand effects; we did find that the age of the last vehicle purchased reduced the time
60. Assuming an exponential form for the scaling factor and a Weibull distribution for the hazard makes the accelerated lifetime model equivalent to the proportional hazard model, which is often used in duration analyses. See Fleming and Harrington (1990).
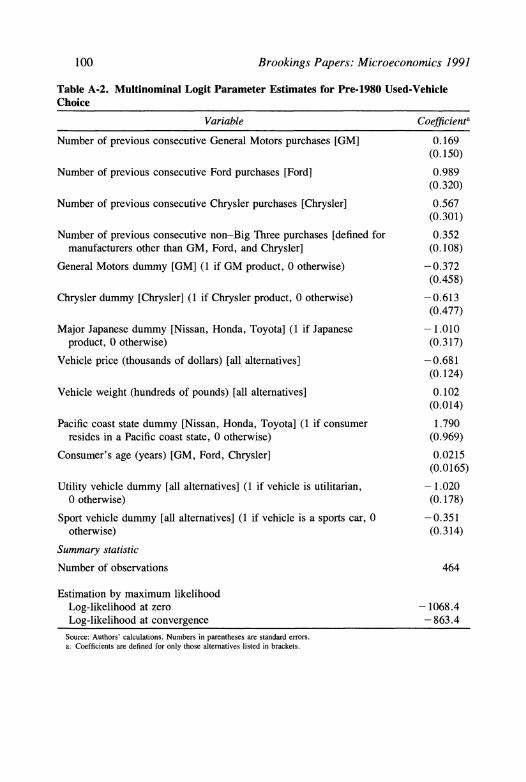
100 Brookings Papers: Microeconomics 1991
Table A-2. Multinominal Logit Parameter Estimates for Pre-1980 Used-Vehicle Choice
Variable Coefficienta
Number of previous consecutive General Motors purchases [GM] 0.169 (0.150)
Number of previous consecutive Ford purchases [Ford] 0.989 (0.320)
Number of previous consecutive Chrysler purchases [Chrysler] 0.567 (0.301)
Number of previous consecutive non-Big Three purchases [defined for 0.352 manufacturers other than GM, Ford, and Chrysler] (0.108)
General Motors dummy [GM] (1 if GM product, 0 otherwise) -0.372 (0.458)
Chrysler dummy [Chrysler] (1 if Chrysler product, 0 otherwise) -0.613 (0.477)
Major Japanese dummy [Nissan, Honda, Toyota] (1 if Japanese - 1.010 product, 0 otherwise) (0.317)
Vehicle price (thousands of dollars) [all altematives] -0.681 (0.124)
Vehicle weight (hundreds of pounds) [all alternatives] 0.102 (0.014)
Pacific coast state dummy [Nissan, Honda, Toyota] (1 if consumer 1.790 resides in a Pacific coast state, 0 otherwise) (0.969)
Consumer's age (years) [GM, Ford, Chrysler] 0.0215 (0.0165)
Utility vehicle dummy [all alternatives] (1 if vehicle is utilitarian, - 1.020 0 otherwise) (0.178)
Sport vehicle dummy [all alternatives] (1 if vehicle is a sports car, 0 -0.351 otherwise) (0.314)
Summary statistic
Number of observations 464
Estimation by maximum likelihood Log-likelihood at zero - 1068.4 Log-likelihood at convergence - 863.4
Source: Authors' calculations. Numbers in parentheses are standard errors. a. Coefficients are defined for only those alternatives listed in brackets.
Fred Mannering and Clifford Winston 101
Table A-3. Multinominal Logit Parameter Estimates for 1980s Used-Vehicle Choice
Variable Coefficienta
Number of previous consecutive General Motors purchases [GM] 0.204 (0.137)
Number of previous consecutive Ford purchases [Ford] 0.406 (0.210)
Number of previous consecutive Chrysler purchases [Chrysler] 0.504 (0.269)
Number of previous consecutive major Japanese purchases [Nissan, 0.632 Honda, Toyota] (0.395)
Number of previous consecutive other manufacturer purchases [defined for manufacturers other than GM, Ford, Chrysler, Nissan, Honda, 0.392 Toyota] (0.187)
Ford dummy [Ford] (1 if Ford product, 0 otherwise) 0.892 (0.245)
General Motors dummy [GM] (1 if GM product, 0 otherwise) 0.843 (0.238)
Vehicle price (thousands of dollars) [all alternatives] -0.521 (0.245)
Vehicle fuel efficiency (miles per gallon) [all alternatives] 0.0322 (0.0152)
Pacific coast state dummy [Nissan, Honda, Toyota] (1 if consumer 0.798 resides in a Pacific coast state, 0 otherwise) (0.610)
Metropolitan area dummy [Nissan, Honda, Toyota] (1 if consumer resides in a metropolitan area with population greater than 500,000, 0.546 0 otherwise) (0.489)
Utility vehicle dummy [all alternatives] (1 if vehicle is utilitarian, 0.199 0 otherwise) (0.156)
Summary statistic
Number of observations 368
Estimation by maximum likelihood Log-likelihood at zero -847.4 Log-likelihood at convergence -742.2
Source: Authors' calculations. Numbers in parentheses are standard errors. a. Coefficients are defined for only those alternatives listed in brackets.
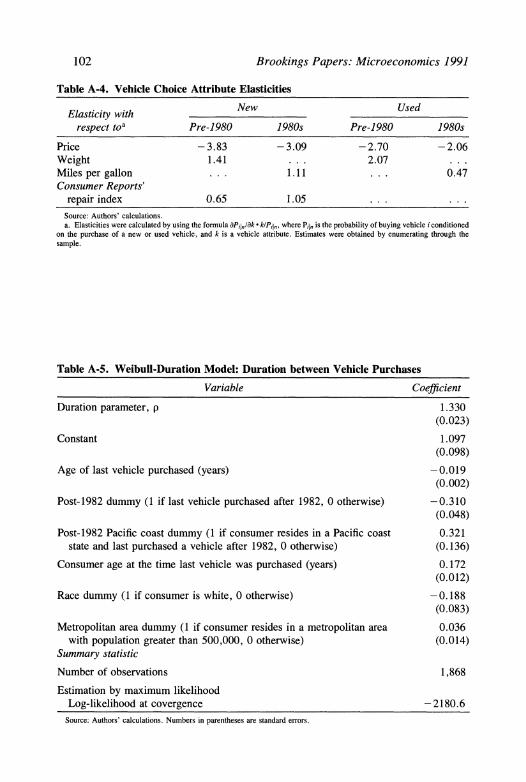
102 Brookings Papers: Microeconomics 1991
Table A-4. Vehicle Choice Attribute Elasticities
Elasticity with New Used respect toa Pre-1980 1980s Pre-1980 1980s
Price - 3.83 - 3.09 - 2.70 - 2.06 Weight 1.41 . . . 2.07 Miles per gallon ... 1.11 . . . 0.47 Consumer Reports'
repair index 0.65 1.05 . . Source: Authors' calculations. a. Elasticities were calculated by using the formula aPjj,f1ak * klPjin, where Pil, is the probability of buying vehicle i conditioned
on the purchase of a new or used vehicle, and k is a vehicle attribute. Estimates were obtained by enumerating through the sample.
Table A-5. Weibull-Duration Model: Duration between Vehicle Purchases
Variable Coefficient
Duration parameter, p 1.330 (0.023)
Constant 1.097 (0.098)
Age of last vehicle purchased (years) -0.019 (0.002)
Post-1982 dummy (1 if last vehicle purchased after 1982, 0 otherwise) -0.310 (0.048)
Post-1982 Pacific coast dummy (1 if consumer resides in a Pacific coast 0.321 state and last purchased a vehicle after 1982, 0 otherwise) (0.136)
Consumer age at the time last vehicle was purchased (years) 0.172 (0.012)
Race dummy (1 if consumer is white, 0 otherwise) -0.188 (0.083)
Metropolitan area dummy (1 if consumer resides in a metropolitan area 0.036 with population greater than 500,000, 0 otherwise) (0.014)
Summary statistic
Number of observations 1,868
Estimation by maximum likelihood Log-likelihood at covergence -2180.6
Source: Authors' calculations. Numbers in parentheses are standard errors.
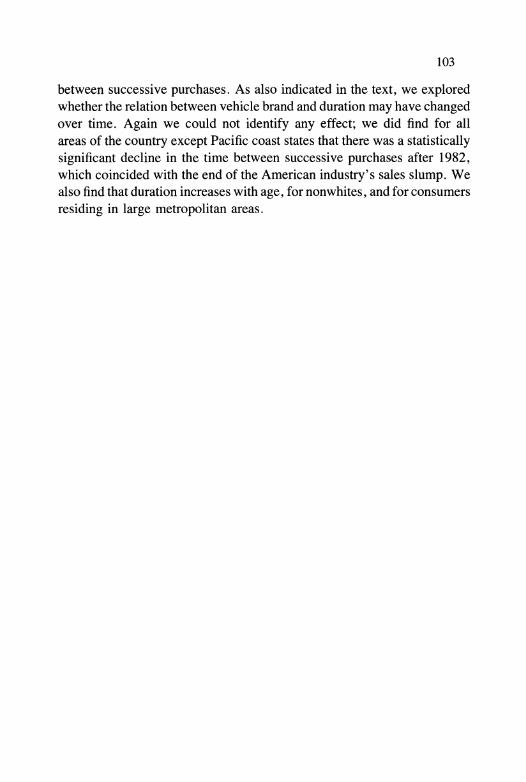
103
between successive purchases. As also indicated in the text, we explored whether the relation between vehicle brand and duration may have changed over time. Again we could not identify any effect; we did find for all areas of the country except Pacific coast states that there was a statistically significant decline in the time between successive purchases after 1982, which coincided with the end of the American industry's sales slump. We also find that duration increases with age, for nonwhites, and for consumers residing in large metropolitan areas.
Comments and Discussion
Comment by Zvi Griliches: The paper by Fred Mannering and Clifford Winston is a very interesting exploration of possible changes in the demand structure for automobiles in the United States in the last two decades. Its main conclusion that American consumers show less "loy- alty" to American cars today than they did in the past is undoubtedly true and may bode ill for the future of the American automobile industry. I am not sure, however, that lack of loyalty is anything more than a natural reaction to being faced with a better, higher-quality product at a lower, quality-adjusted price. The quantitative evidence presented by them on this topic is suggestive, but it is based on a relatively small sample, a relatively limited range of variables, and is subject to alter- native interpretations.
Loyalty in their model is an unobservable variable. It is proxied by lagged purchases of the same brand (manufacturer). Putting lagged values of the dependent variable into the equation creates, however, well-known problems of interpretation. They have been discussed in the past under the title of "serial correlation bias in distributed lag models. '61 In their context of discrete choice this problem is known as the issue of "heterogeneity versus state dependence.' 62 The simple alternative hypothesis to loyalty, to learning by experience, to a change of tastes by buying is the presence of important, slowly changing left- out variables in the model whose omission is proxied by lags in the dependent variable itself.
In the old language of distributed lag models, their model can be written as
61. See Griliches (1961, 1967). 62. See, for example, Heckman (1981); and Chamberlain (1985).
104
Fred Mannering and Clifford Winston 105
y = rx + YY-i + e
where x stands for the exogenous forces (variable or variables) deter- mining y, and e is the current period "new experience," which will be incorporated into a measure of "loyalty capital" in the next period. The alternative model says that
y = x + u u = m + e
where m is a set of left-out individual variables that do not change over time, the "heterogeneity" of individual buyers and specific car models, and e now represents the current "transitory" experience, which will not affect future behavior at all. More complicated models of depre- ciation and change in the left-out variables m are also possible. By lagging it, the second equation can be rewritten as
y = rx + (Y-1 - x-l - e1) + e
= r(x - x1) + Y-I + e -eI
Now, if this model is right and the first is estimated, then it is easy to show that one will get a positive and " significant" coefficient for lagged y. It will be less than one, because of the specification error of leaving x 1 and e -I out of the estimating equation.
Under reasonable assumptions,63 the resulting coefficient of lagged y will be plim j = pI/2/[a 2 + r3s'( 1 - r I] where U2 iS the variance of the overall disturbance u, p is its serial correlation (in this version it would equal o72/ 2), S2 is the variance in x and rj2_1 is the square of the serial correlation in the x's.
The finding that Py is positive and "significant" does not prove the existence of loyalty. Nor does a decline in y- provide evidence for a decline in loyalty. If there has been recent turbulence in the x's, this will reduce their serial correlation and, as can be seen from the above formula, reduce also the coefficient of lagged y, the past now having less predictive power about the present.
What are the left-out variables that are alternative candidates for the rather more nebulous concept of loyalty? They are of two kinds: the first deal with more detailed characteristics of the cars, seating room, power, styling; the second with more detailed characteristics of the
63. See, for example, the related formula in Griliches (1967, p. 37).
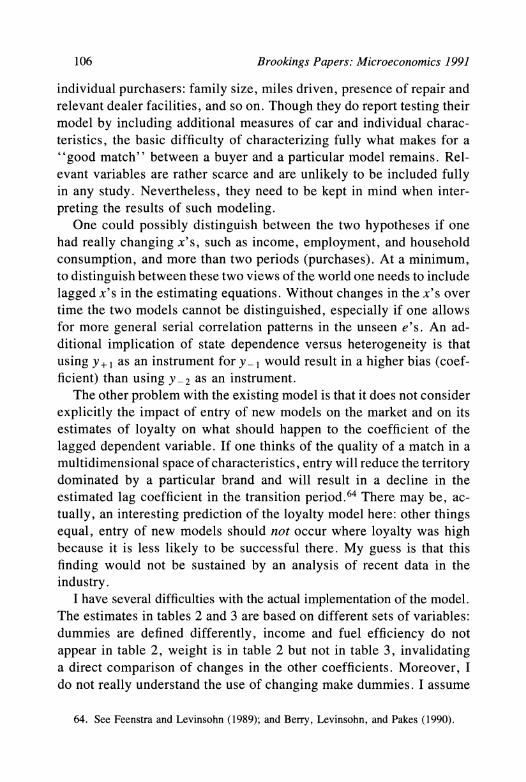
106 Brookings Papers: Microeconomics 1991
individual purchasers: family size, miles driven, presence of repair and relevant dealer facilities, and so on. Though they do report testing their model by including additional measures of car and individual charac- teristics, the basic difficulty of characterizing fully what makes for a "good match" between a buyer and a particular model remains. Rel- evant variables are rather scarce and are unlikely to be included fully in any study. Nevertheless, they need to be kept in mind when inter- preting the results of such modeling.
One could possibly distinguish between the two hypotheses if one had really changing x's, such as income, employment, and household consumption, and more than two periods (purchases). At a minimum, to distinguish between these two views of the world one needs to include lagged x's in the estimating equations. Without changes in the x's over time the two models cannot be distinguished, especially if one allows for more general serial correlation patterns in the unseen e's. An ad- ditional implication of state dependence versus heterogeneity is that using y+ 1 as an instrument for y -1 would result in a higher bias (coef- ficient) than using Y-2 as an instrument.
The other problem with the existing model is that it does not consider explicitly the impact of entry of new models on the market and on its estimates of loyalty on what should happen to the coefficient of the lagged dependent variable. If one thinks of the quality of a match in a multidimensional space of characteristics, entry will reduce the territory dominated by a particular brand and will result in a decline in the estimated lag coefficient in the transition period.64 There may be, ac- tually, an interesting prediction of the loyalty model here: other things equal, entry of new models should not occur where loyalty was high because it is less likely to be successful there. My guess is that this finding would not be sustained by an analysis of recent data in the industry.
I have several difficulties with the actual implementation of the model. The estimates in tables 2 and 3 are based on different sets of variables: dummies are defined differently, income and fuel efficiency do not appear in table 2, weight is in table 2 but not in table 3, invalidating a direct comparison of changes in the other coefficients. Moreover, I do not really understand the use of changing make dummies. I assume
64. See Feenstra and Levinsohn (1989); and Berry, Levinsohn, and Pakes (1990).
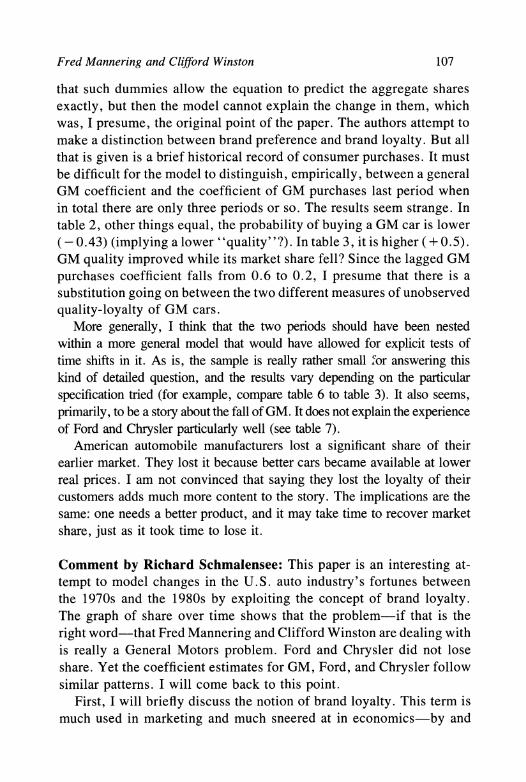
Fred Mannering and Clifford Winston 107
that such dummies allow the equation to predict the aggregate shares exactly, but then the model cannot explain the change in them, which was, I presume, the original point of the paper. The authors attempt to make a distinction between brand preference and brand loyalty. But all that is given is a brief historical record of consumer purchases. It must be difficult for the model to distinguish, empirically, between a general GM coefficient and the coefficient of GM purchases last period when in total there are only three periods or so. The results seem strange. In table 2, other things equal, the probability of buying a GM car is lower (-0.43) (implying a lower "quality" ?). In table 3, it is higher (+ 0. 5). GM quality improved while its market share fell? Since the lagged GM purchases coefficient falls from 0.6 to 0.2, I presume that there is a substitution going on between the two different measures of unobserved quality-loyalty of GM cars.
More generally, I think that the two periods should have been nested within a more general model that would have allowed for explicit tests of time shifts in it. As is, the sample is really rather small for answering this kind of detailed question, and the results vary depending on the particular specification tried (for example, compare table 6 to table 3). It also seems, primarily, to be a story about the fall of GM. It does not explain the experience of Ford and Chrysler particularly well (see table 7).
American automobile manufacturers lost a significant share of their earlier market. They lost it because better cars became available at lower real prices. I am not convinced that saying they lost the loyalty of their customers adds much more content to the story. The implications are the same: one needs a better product, and it may take time to recover market share, just as it took time to lose it.
Comment by Richard Schmalensee: This paper is an interesting at- tempt to model changes in the U.S. auto industry's fortunes between the 1970s and the 1980s by exploiting the concept of brand loyalty. The graph of share over time shows that the problem-if that is the right word-that Fred Mannering and Clifford Winston are dealing with is really a General Motors problem. Ford and Chrysler did not lose share. Yet the coefficient estimates for GM, Ford, and Chrysler follow similar patterns. I will come back to this point.
First, I will briefly discuss the notion of brand loyalty. This term is much used in marketing and much sneered at in economics-by and
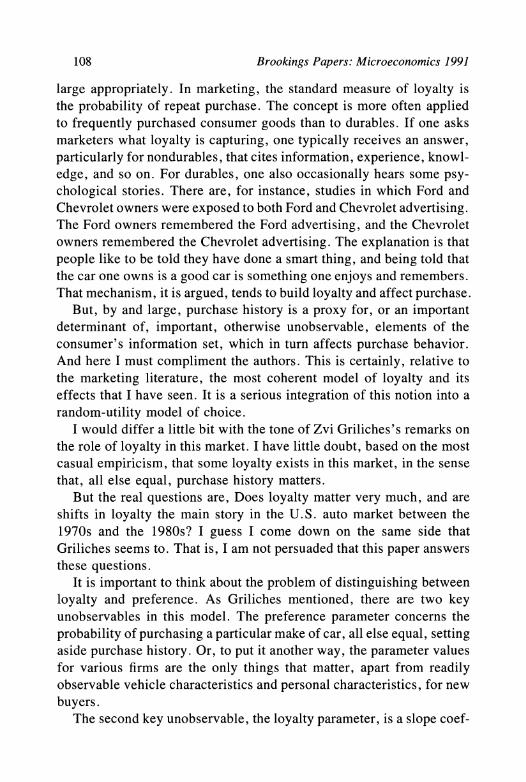
108 Brookings Papers: Microeconomics 1991
large appropriately. In marketing, the standard measure of loyalty is the probability of repeat purchase. The concept is more often applied to frequently purchased consumer goods than to durables. If one asks marketers what loyalty is capturing, one typically receives an answer, particularly for nondurables, that cites information, experience, knowl- edge, and so on. For durables, one also occasionally hears some psy- chological stories. There are, for instance, studies in which Ford and Chevrolet owners were exposed to both Ford and Chevrolet advertising. The Ford owners remembered the Ford advertising, and the Chevrolet owners remembered the Chevrolet advertising. The explanation is that people like to be told they have done a smart thing, and being told that the car one owns is a good car is something one enjoys and remembers. That mechanism, it is argued, tends to build loyalty and affect purchase.
But, by and large, purchase history is a proxy for, or an important determinant of, important, otherwise unobservable, elements of the consumer's information set, which in turn affects purchase behavior. And here I must compliment the authors. This is certainly, relative to the marketing literature, the most coherent model of loyalty and its effects that I have seen. It is a serious integration of this notion into a random-utility model of choice.
I would differ a little bit with the tone of Zvi Griliches's remarks on the role of loyalty in this market. I have little doubt, based on the most casual empiricism, that some loyalty exists in this market, in the sense that, all else equal, purchase history matters.
But the real questions are, Does loyalty matter very much, and are shifts in loyalty the main story in the U.S. auto market between the 1970s and the 1980s? I guess I come down on the same side that Griliches seems to. That is, I am not persuaded that this paper answers these questions.
It is important to think about the problem of distinguishing between loyalty and preference. As Griliches mentioned, there are two key unobservables in this model. The preference parameter concerns the probability of purchasing a particular make of car, all else equal, setting aside purchase history. Or, to put it another way, the parameter values for various firms are the only things that matter, apart from readily observable vehicle characteristics and personal characteristics, for new buyers.
The second key unobservable, the loyalty parameter, is a slope coef-
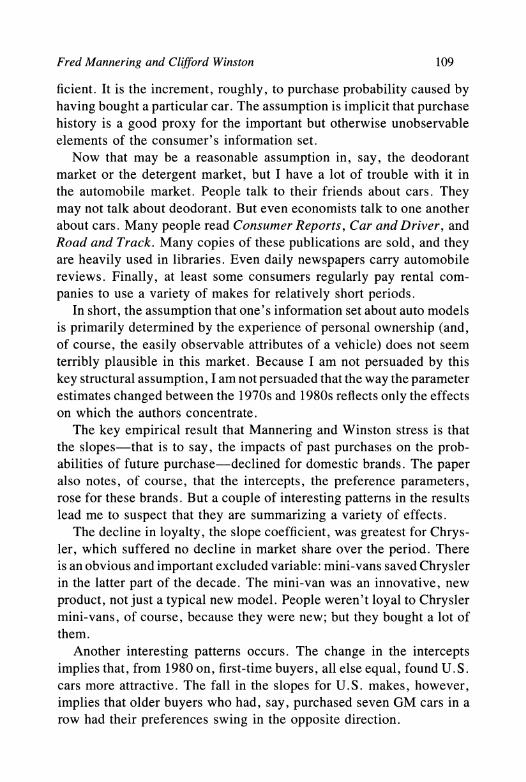
Fred Mannering and Clifford Winston 109
ficient. It is the increment, roughly, to purchase probability caused by having bought a particular car. The assumption is implicit that purchase history is a good proxy for the important but otherwise unobservable elements of the consumer's information set.
Now that may be a reasonable assumption in, say, the deodorant market or the detergent market, but I have a lot of trouble with it in the automobile market. People talk to their friends about cars. They may not talk about deodorant. But even economists talk to one another about cars. Many people read Consumer Reports, Car and Driver, and Road and Track. Many copies of these publications are sold, and they are heavily used in libraries. Even daily newspapers carry automobile reviews. Finally, at least some consumers regularly pay rental com- panies to use a variety of makes for relatively short periods.
In short, the assumption that one's information set about auto models is primarily determined by the experience of personal ownership (and, of course, the easily observable attributes of a vehicle) does not seem terribly plausible in this market. Because I am not persuaded by this key structural assumption, I am not persuaded that the way the parameter estimates changed between the 1970s and 1980s reflects only the effects on which the authors concentrate.
The key empirical result that Mannering and Winston stress is that the slopes-that is to say, the impacts of past purchases on the prob- abilities of future purchase-declined for domestic brands. The paper also notes, of course, that the intercepts, the preference parameters, rose for these brands. But a couple of interesting patterns in the results lead me to suspect that they are summarizing a variety of effects.
The decline in loyalty, the slope coefficient, was greatest for Chrys- ler, which suffered no decline in market share over the period. There is an obvious and important excluded variable: mini-vans saved Chrysler in the latter part of the decade. The mini-van was an innovative, new product, not just a typical new model. People weren't loyal to Chrysler mini-vans, of course, because they were new; but they bought a lot of them.
Another interesting patterns occurs. The change in the intercepts implies that, from 1980 on, first-time buyers, all else equal, found U.S. cars more attractive. The fall in the slopes for U.S. makes, however, implies that older buyers who had, say, purchased seven GM cars in a row had their preferences swing in the opposite direction.
110 Brookings Papers: Microeconomics 1991
That seems at odds with my expectation of how Japan's share grew. I would expect that it would grow more rapidly among younger buyers than among older buyers. I expect that first-time buyers were more likely to shift to a Japanese car than was someone who had purchased seven Chevrolets in a row.
I can intuitively see how this combination of changes in repeat- purchase effects and the intercept tracks the data. After all, the model has to replicate a situation in which GM, with its high initial share, declines gradually, even though the coefficients are assumed to change suddenly in 1980. But I am not persuaded that, in a structural sense, we have the real story here.
Finally, I can't resist saying a word about the public policy rec- ommendation at the end of the paper. I am a big fan of information- based remedies for almost everything, because generally labels are much less harmful than regulations. But I am a little skeptical about the capacity of official government evaluations of automobile quality to turn the market around, particularly since Mannering and Winston suggest that the government ought to produce such evaluations to turn the market around for U.S. auto makers.
I find it difficult to believe that anyone would view government evaluations, or private evaluations conducted under government con- tract, as more credible than those in Car and Driver. I even doubt that government reviews would be consistently more informative, since Car and Driver must meet a market test to survive. I am similarly skeptical of the ability of Lee Iacocca's bragging about quality to do much in the long run.
I think, as Griliches seems to, that the cure for what ails the U.S. auto industry is simple to describe, though difficult to implement. To regain market share and consumer loyalty, however one would like to define or measure it, U.S. auto makers must produce better cars at competitive prices.
General Discussion: Several participants suggested factors other than brand loyalty that must also be looked at as having contributed to loss of market share by U.S. auto manufacturers. A few brought up the relationship between dealer networks and market share. Timothy Bres- nahan noted the concurrent decline in the American brand dealer body and increase in the Japanese brand dealer body and suggested that this
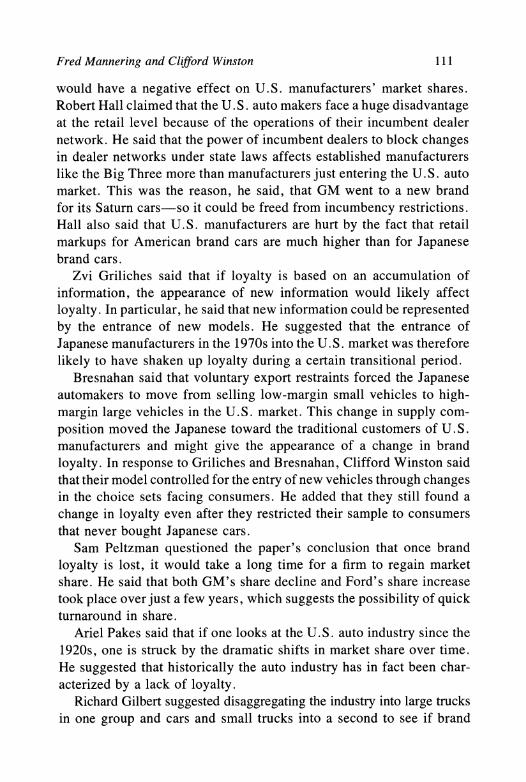
Fred Mannering and Clifford Winston 111
would have a negative effect on U.S. manufacturers' market shares. Robert Hall claimed that the U.S. auto makers face a huge disadvantage at the retail level because of the operations of their incumbent dealer network. He said that the power of incumbent dealers to block changes in dealer networks under state laws affects established manufacturers like the Big Three more than manufacturers just entering the U.S. auto market. This was the reason, he said, that GM went to a new brand for its Saturn cars-so it could be freed from incumbency restrictions. Hall also said that U.S. manufacturers are hurt by the fact that retail markups for American brand cars are much higher than for Japanese brand cars.
Zvi Griliches said that if loyalty is based on an accumulation of information, the appearance of new information would likely affect loyalty. In particular, he said that new information could be represented by the entrance of new models. He suggested that the entrance of Japanese manufacturers in the 1970s into the U.S. market was therefore likely to have shaken up loyalty during a certain transitional period.
Bresnahan said that voluntary export restraints forced the Japanese automakers to move from selling low-margin small vehicles to high- margin large vehicles in the U.S. market. This change in supply com- position moved the Japanese toward the traditional customers of U.S. manufacturers and might give the appearance of a change in brand loyalty. In response to Griliches and Bresnahan, Clifford Winston said that their model controlled for the entry of new vehicles through changes in the choice sets facing consumers. He added that they still found a change in loyalty even after they restricted their sample to consumers that never bought Japanese cars.
Sam Peltzman questioned the paper's conclusion that once brand loyalty is lost, it would take a long time for a firm to regain market share. He said that both GM's share decline and Ford's share increase took place over just a few years, which suggests the possibility of quick turnaround in share.
Ariel Pakes said that if one looks at the U.S. auto industry since the 1920s, one is struck by the dramatic shifts in market share over time. He suggested that historically the auto industry has in fact been char- acterized by a lack of loyalty.
Richard Gilbert suggested disaggregating the industry into large trucks in one group and cars and small trucks into a second to see if brand
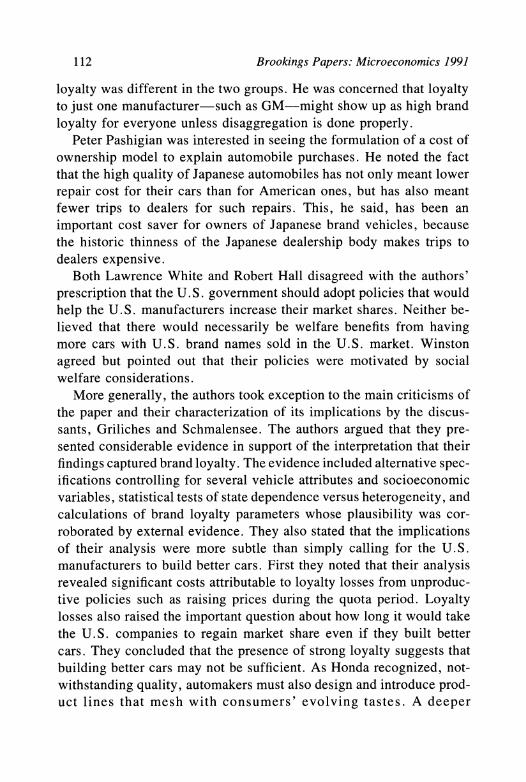
112 Brookings Papers: Microeconomics 1991
loyalty was different in the two groups. He was concerned that loyalty to just one manufacturer-such as GM-might show up as high brand loyalty for everyone unless disaggregation is done properly.
Peter Pashigian was interested in seeing the formulation of a cost of ownership model to explain automobile purchases. He noted the fact that the high quality of Japanese automobiles has not only meant lower repair cost for their cars than for American ones, but has also meant fewer trips to dealers for such repairs. This, he said, has been an important cost saver for owners of Japanese brand vehicles, because the historic thinness of the Japanese dealership body makes trips to dealers expensive.
Both Lawrence White and Robert Hall disagreed with the authors' prescription that the U.S. government should adopt policies that would help the U.S. manufacturers increase their market shares. Neither be- lieved that there would necessarily be welfare benefits from having more cars with U.S. brand names sold in the U.S. market. Winston agreed but pointed out that their policies were motivated by social welfare considerations.
More generally, the authors took exception to the main criticisms of the paper and their characterization of its implications by the discus- sants, Griliches and Schmalensee. The authors argued that they pre- sented considerable evidence in support of the interpretation that their findings captured brand loyalty. The evidence included alternative spec- ifications controlling for several vehicle attributes and socioeconomic variables, statistical tests of state dependence versus heterogeneity, and calculations of brand loyalty parameters whose plausibility was cor- roborated by external evidence. They also stated that the implications of their analysis were more subtle than simply calling for the U.S. manufacturers to build better cars. First they noted that their analysis revealed significant costs attributable to loyalty losses from unproduc- tive policies such as raising prices during the quota period. Loyalty losses also raised the important question about how long it would take the U.S. companies to regain market share even if they built better cars. They concluded that the presence of strong loyalty suggests that building better cars may not be sufficient. As Honda recognized, not- withstanding quality, automakers must also design and introduce prod- uct lines that mesh with consumers' evolving tastes. A deeper
Fred Mannering and Clifford Winston 113
understanding of what causes loyalty could reveal other competitive considerations.
References
Aizcorbe, Ana, Clifford Winston, and Ann Friedlaender. 1987. "Cost Com- petitiveness of the U.S. Automobile Industry." In Clifford Winston and Associates, Blind Intersection? Policy and the Automobile Industry. Brook- ings.
Berry, Steve, Jim Levinsohn, and Ariel Pakes. 1990. "Automobile Price in Market Equilibrium." Mimeo, Yale University (December).
Chamberlain, Gary. 1980. "Analysis of Covariance with Qualitative Data." Review of Economic Studies 47 (January):225-38.
. 1985. "Heterogeneity, Omitted Variable Bias, and Duration Depend- ence." In Longitudinal Analysis of Labor Market Data, edited by James J. Heckman and Burton Singer. Cambridge University Press.
Clark, Kim B., W. Bruce Chew, and Takahiro Fujimoto. 1987. "Product Development in the World Auto Industry." Brookings Papers on Economic Activity (Special Issue on Microeconomics):729-81.
Clark, Kim B., and Takahiro Fujimoto. 1990. "The Power of Product In- tegrity." Harvard Business Review (November-December):107-118.
Feenstra, Robert, and Jim Levinsohn. 1989. "Estimating Demand and Oli- gopoly Pricing for Differentiated Products with Multiple Characteristics." ITES SP444. University of Stockholm.
Fleming, Thomas R., and David P. Harrington. 1991. Counting Processes and Survival Analysis. John Wiley.
Griliches, Zvi. 1961. "A Note on Serial Correlation Bias in Estimates of Distributed Lags." Econometrica 29 (January): 65-73.
. 1967. "Distributed Lags: A Survey." Econometric 35 (January): 16- 49.
Heckman, James J. 1981. "Statistical Models for Discrete Panel Data." In Structural Analysis of Discrete Data with Econometric Applications, edited by Charles F. Manski and Daniel McFadden. MIT Press.
Jacoby, Jacob, and Robert W. Chestnut. 1978. Brand Loyalty: Measurement and Management. John Wiley.
Jarrell, Gregg, and Sam Peltzman. 1985. "The Impact of Product Recalls on the Wealth of Sellers." Journal of Political Economy 93 (June):5 12-36.
Katz, Harry C., Thomas A. Kochan, and Jeffrey H. Keefe. 1987. "Industrial
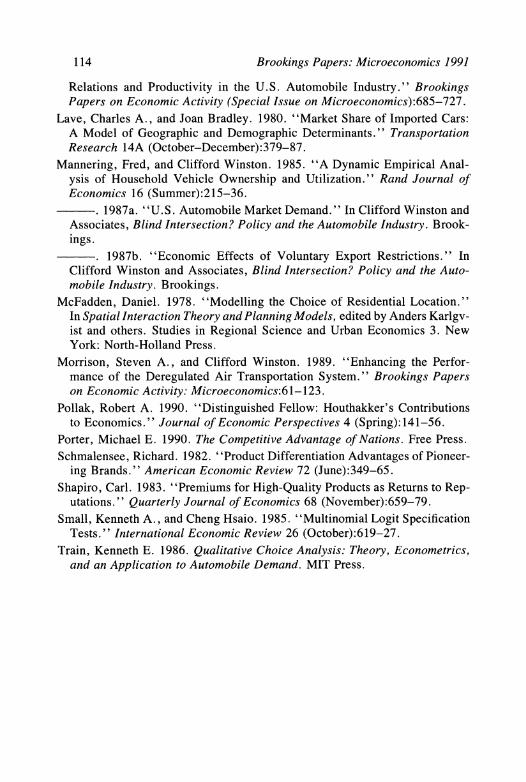
114 Brookings Papers: Microeconomics 1991
Relations and Productivity in the U.S. Automobile Industry." Brookings Papers on Economic Activity (Special Issue on Microeconomics):685-727.
Lave, Charles A., and Joan Bradley. 1980. "Market Share of Imported Cars: A Model of Geographic and Demographic Determinants." Transportation Research 14A (October-December):379-87.
Mannering, Fred, and Clifford Winston. 1985. "A Dynamic Empirical Anal- ysis of Household Vehicle Ownership and Utilization." Rand Journal of Economics 16 (Summer):215-36.
. 1987a. "U.S. Automobile Market Demand." In Clifford Winston and Associates, Blind Intersection? Policy and the Automobile Industry. Brook- ings.
. 1987b. "Economic Effects of Voluntary Export Restrictions." In Clifford Winston and Associates, Blind Intersection? Policy and the Auto- mobile Industry. Brookings.
McFadden, Daniel. 1978. "Modelling the Choice of Residential Location." In Spatial Interaction Theory and Planning Models, edited by Anders Karlgv- ist and others. Studies in Regional Science and Urban Economics 3. New York: North-Holland Press.
Morrison, Steven A., and Clifford Winston. 1989. "Enhancing the Perfor- mance of the Deregulated Air Transportation System." Brookings Papers on Economic Activity: Microeconomics:6 1-123.
Pollak, Robert A. 1990. "Distinguished Fellow: Houthakker's Contributions to Economics." Journal of Economic Perspectives 4 (Spring): 141-56.
Porter, Michael E. 1990. The Competitive Advantage of Nations. Free Press.
Schmalensee, Richard. 1982. "Product Differentiation Advantages of Pioneer- ing Brands." American Economic Review 72 (June):349-65.
Shapiro, Carl. 1983. "Premiums for High-Quality Products as Returns to Rep- utations. " Quarterly Journal of Economics 68 (November):659-79.
Small, Kenneth A., and Cheng Hsaio. 1985. "Multinomial Logit Specification Tests." International Economic Review 26 (October):619-27.
Train, Kenneth E. 1986. Qualitative Choice Analysis: Theory, Econometrics, and an Application to Automobile Demand. MIT Press.