Brain Imaging Science - courses.cs.washington.edu · BRAIN IMAGING OF ALZHEIMER’S DISEASE AMYLOID...
83
Imaging Brain Structure and Function Thomas J. Grabowski, Jr., MD Professor, Radiology and Neurology (joint) Director, UW Integrated Brain Imaging Center Director, UW Alzheimer’s Disease Research Center CSE/EE 577 October 18, 2017
Transcript of Brain Imaging Science - courses.cs.washington.edu · BRAIN IMAGING OF ALZHEIMER’S DISEASE AMYLOID...
Imaging Brain Structure and Function
Thomas J. Grabowski, Jr., MDProfessor, Radiology and Neurology (joint)
Director, UW Integrated Brain Imaging CenterDirector, UW Alzheimer’s Disease Research Center
CSE/EE 577October 18, 2017
Why image the brain?
• What’s wrong? (Medical diagnosis)
• How does it work? (Neuroscience)
• To aid intervention (Medical treatment, Engineering)
Why is the brain hard to image?
• Different soft tissues (gray, white) give low contrast to xrays
• Cerebral anatomy is 3D complex and variable • Neurophysiological processes must be imaged
indirectly through their coupled vascular and metabolic effects
• Much of the organization of the brain is still poorly understood.
• Cerebral functional zones are defined by microscopic features that can’t be imaged directly
Digital image paradigm
• Images are matrices of values of a physical or physiological parameter, extended over an anatomic space.
• The parameter is not derived “directly” from hardware sensors, but by post-acquisition computation.
• Images may be inputs to further workflow.
Paradoxically, imaging is an abstract concept
Outline
• The brain
• Brain imaging modalities
• Standard anatomical space
• Image processing
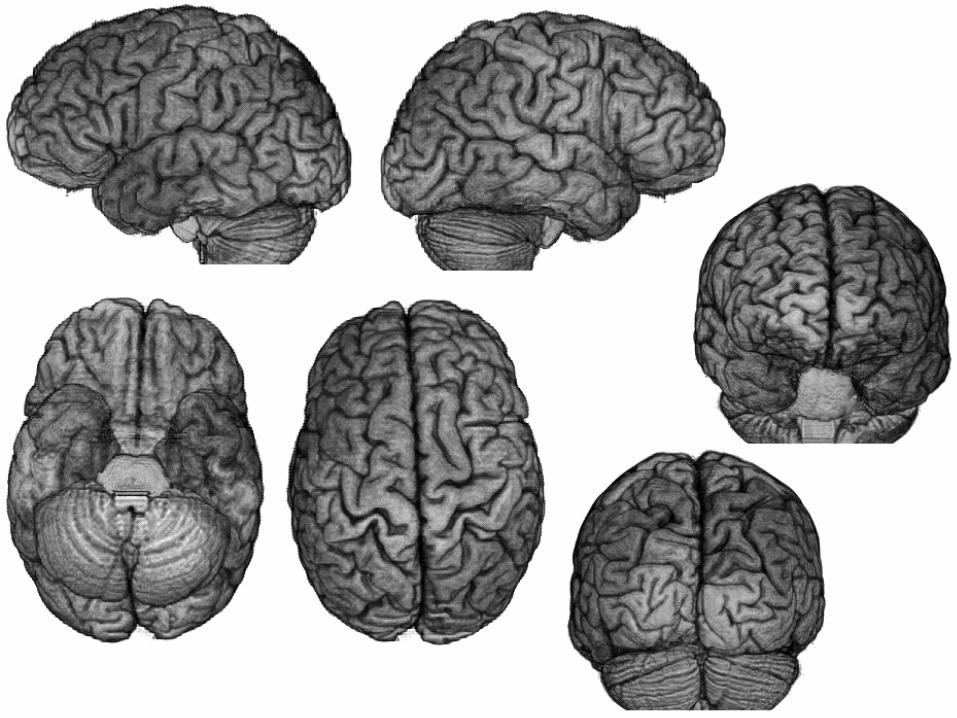

The brain is an organ
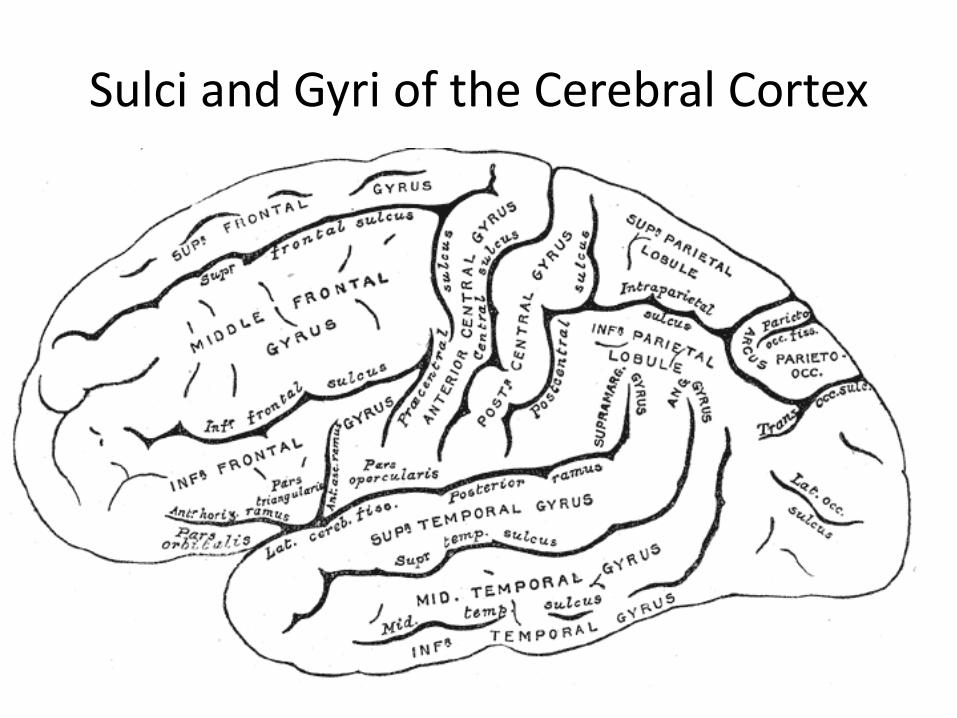
Sulci and Gyri of the Cerebral Cortex

Cortical thickness
FreeSurfer, CARET
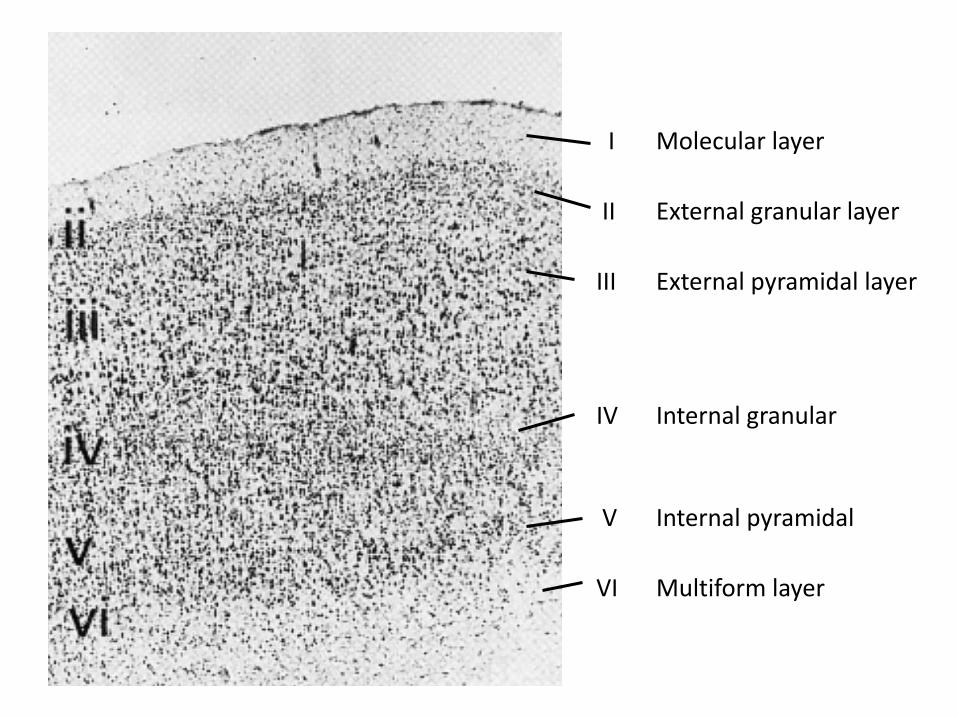
I Molecular layer
II External granular layer
III External pyramidal layer
IV Internal granular
V Internal pyramidal
VI Multiform layer
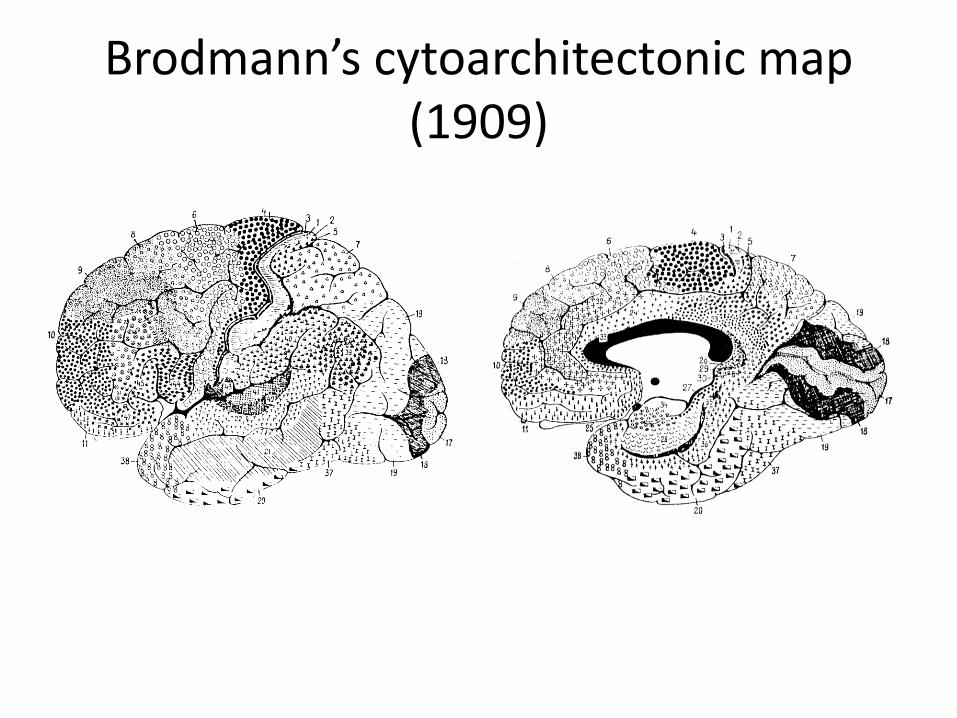
Brodmann’s cytoarchitectonic map(1909)
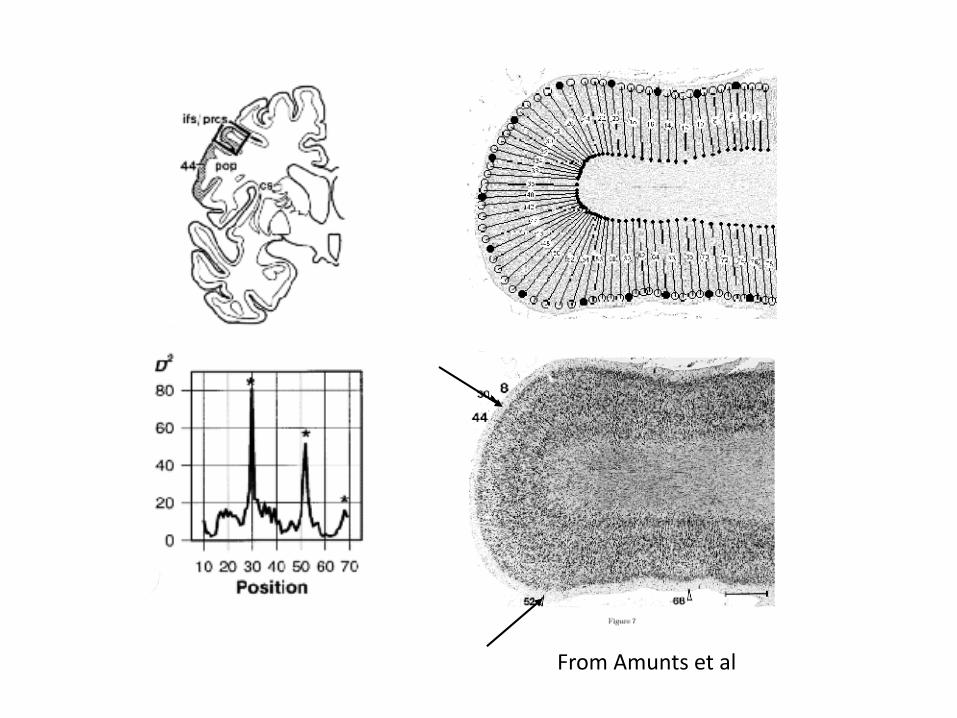
From Amunts et al
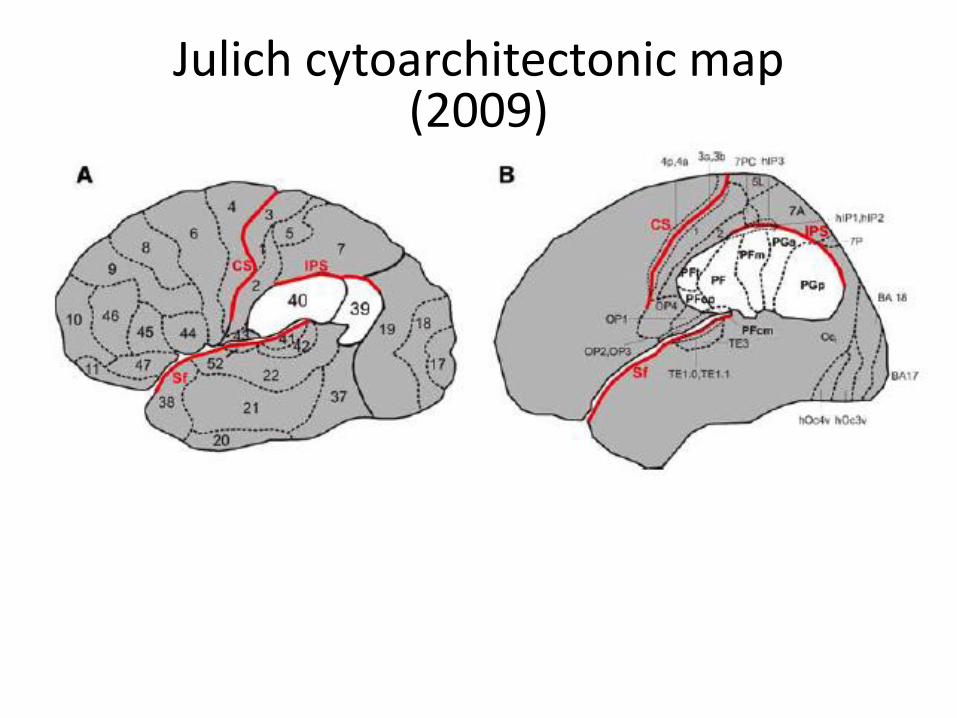
Julich cytoarchitectonic map(2009)


Xray Computed Tomography
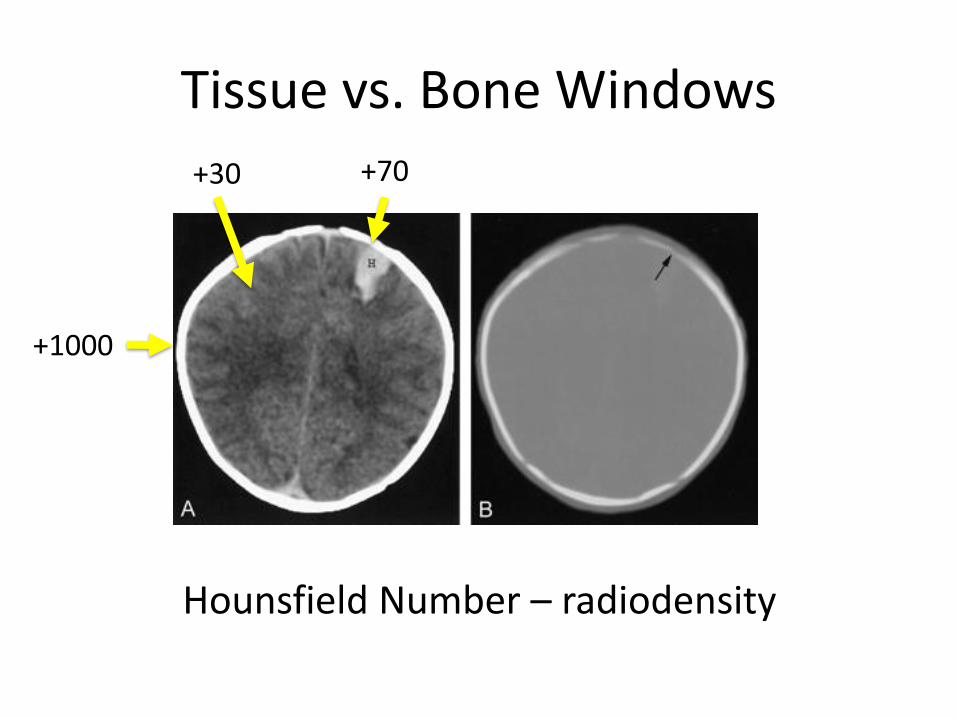
Tissue vs. Bone Windows
Hounsfield Number – radiodensity
+70+30
+1000
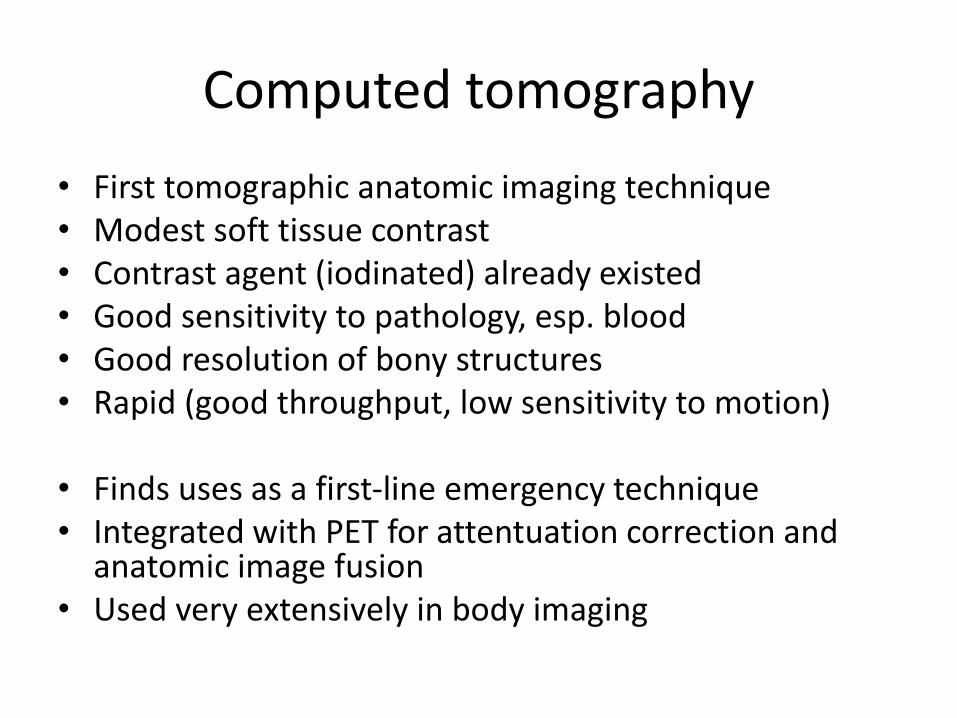
Computed tomography
• First tomographic anatomic imaging technique• Modest soft tissue contrast• Contrast agent (iodinated) already existed• Good sensitivity to pathology, esp. blood• Good resolution of bony structures• Rapid (good throughput, low sensitivity to motion)
• Finds uses as a first-line emergency technique• Integrated with PET for attentuation correction and
anatomic image fusion• Used very extensively in body imaging

Intracerebral hypertensive hemorrhage
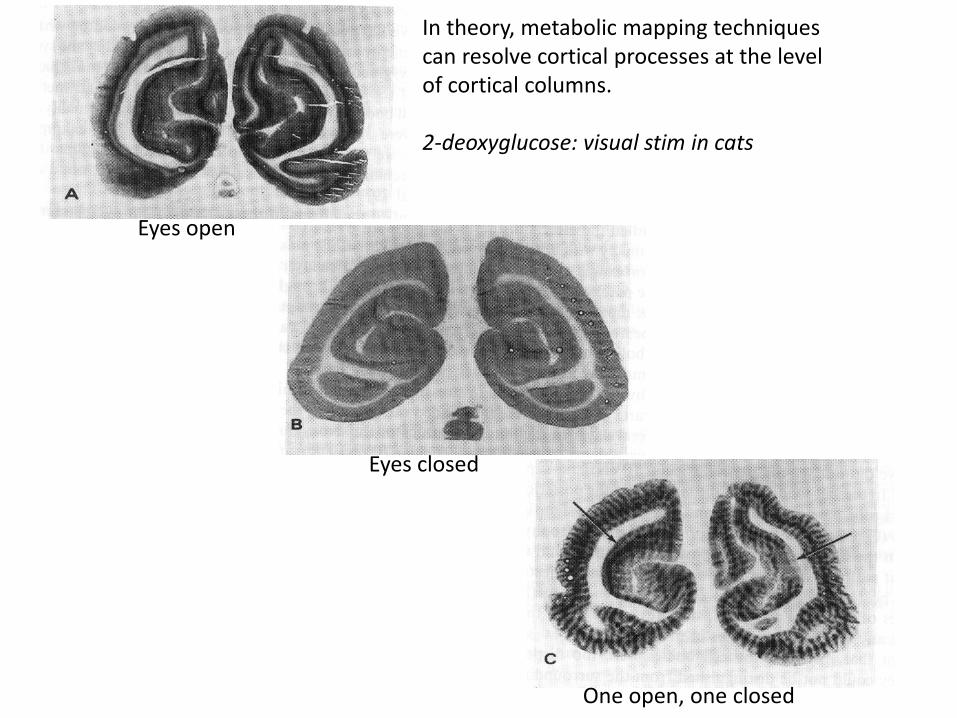
Eyes open
Eyes closed
One open, one closed
In theory, metabolic mapping techniquescan resolve cortical processes at the levelof cortical columns.
2-deoxyglucose: visual stim in cats


Positron Emission Tomography(PET)
Images of physiological parameters are inferred from the distribution of positron-emitting radiopharmaceuticals
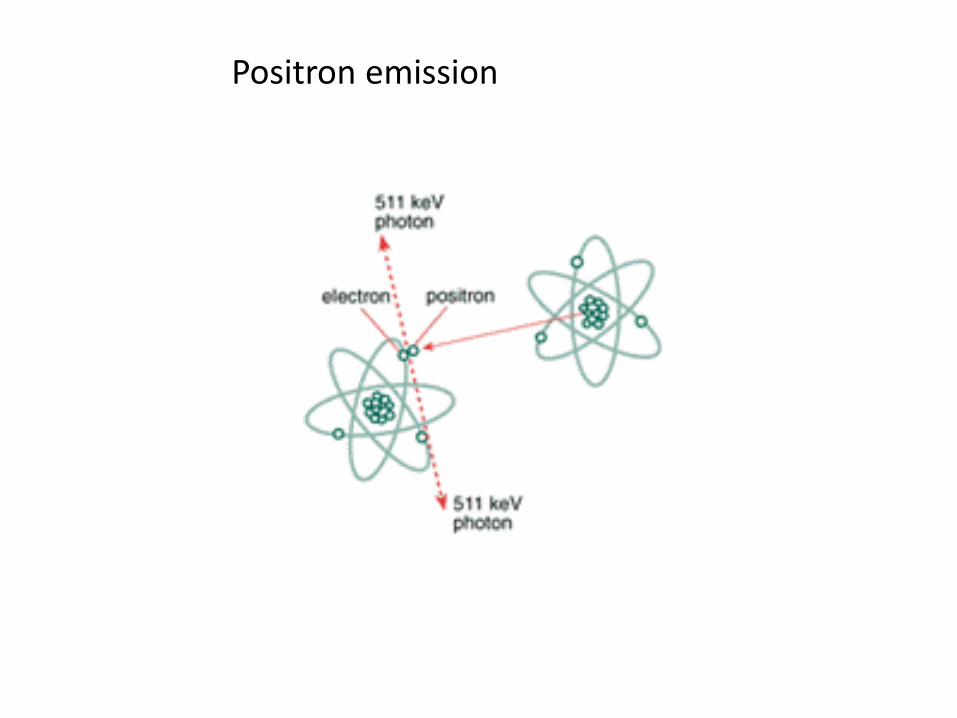
Positron emission
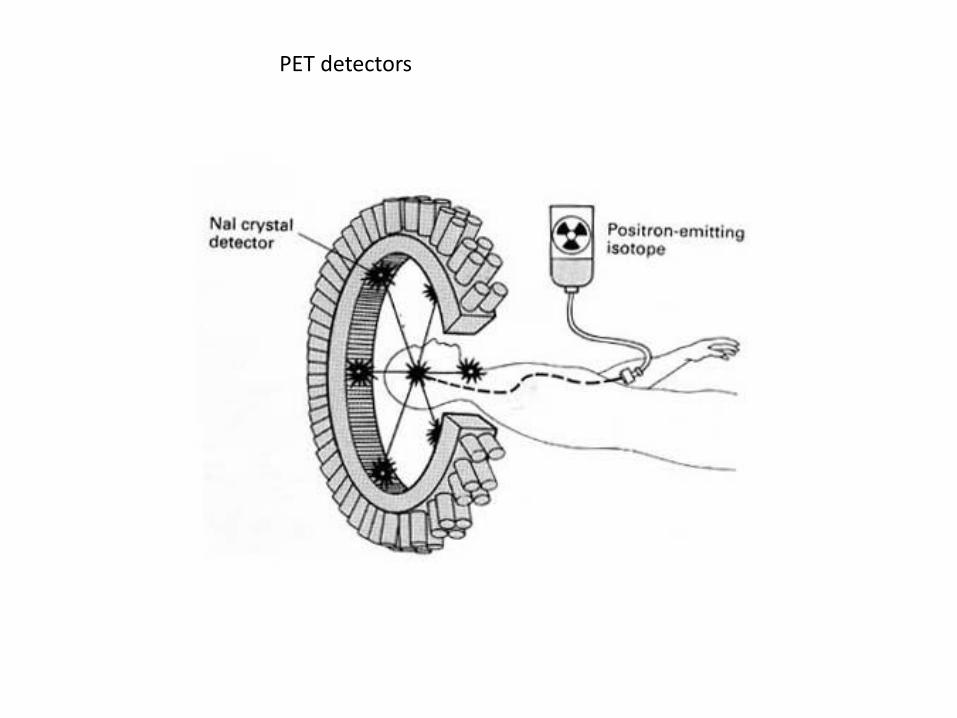
PET detectors

[18F]Fluorodeoxyglucose PET
PET
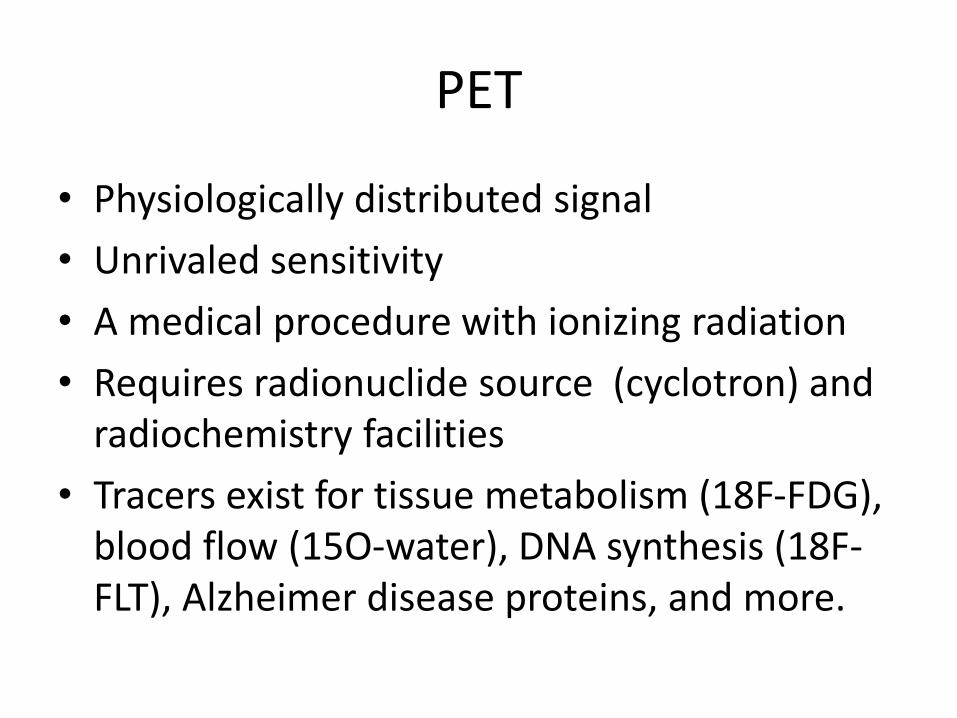
• Physiologically distributed signal
• Unrivaled sensitivity
• A medical procedure with ionizing radiation
• Requires radionuclide source (cyclotron) and radiochemistry facilities
• Tracers exist for tissue metabolism (18F-FDG), blood flow (15O-water), DNA synthesis (18F-FLT), Alzheimer disease proteins, and more.
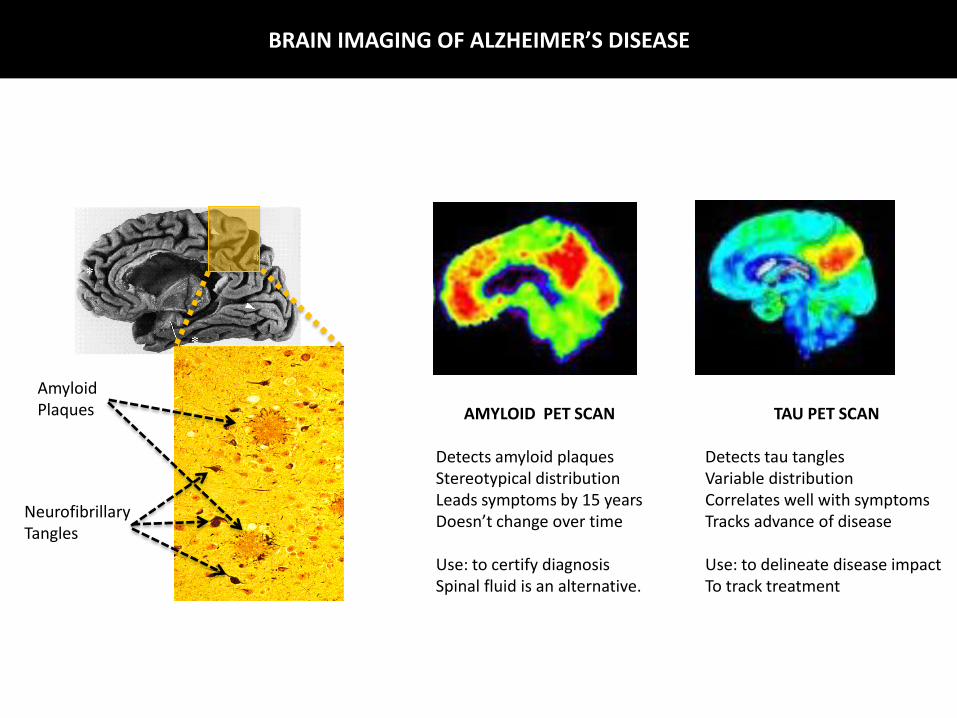
BRAIN IMAGING OF ALZHEIMER’S DISEASE
AMYLOID PET SCAN
Detects amyloid plaquesStereotypical distributionLeads symptoms by 15 yearsDoesn’t change over time
Use: to certify diagnosisSpinal fluid is an alternative.
TAU PET SCAN
Detects tau tanglesVariable distributionCorrelates well with symptomsTracks advance of disease
Use: to delineate disease impactTo track treatment
AmyloidPlaques
NeurofibrillaryTangles

Magnetic Resonance Imaging(MRI)
WassersteifelRoman Signer
1986

MRI
• Water molecules have a natural frequency at which they can accept and radiate energy
• More precisely, the hydrogen nuclei have a quantum mechanical property called spin angular momentum
• The spin states of hydrogen nuclei diverge in energy level in the presence of a magnetic field
• Water protons absorb or give off energy to move between these energy levels, at the natural frequency, the Larmor frequency, which is a function of the magnetic field strength.
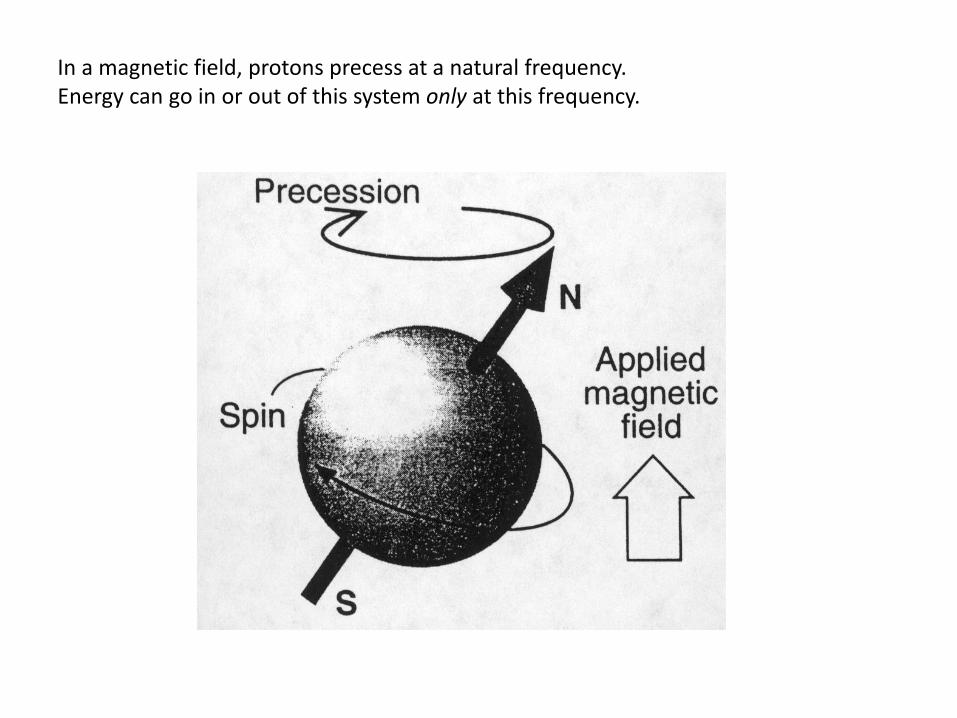
In a magnetic field, protons precess at a natural frequency. Energy can go in or out of this system only at this frequency.
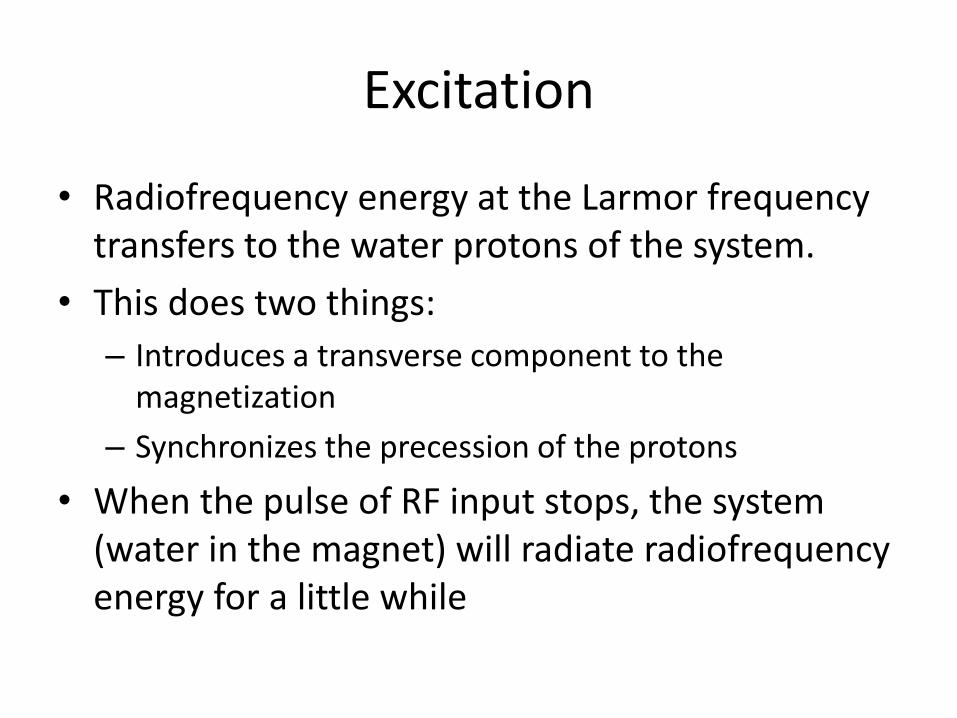
Excitation
• Radiofrequency energy at the Larmor frequency transfers to the water protons of the system.
• This does two things:
– Introduces a transverse component to the magnetization
– Synchronizes the precession of the protons
• When the pulse of RF input stops, the system (water in the magnet) will radiate radiofrequency energy for a little while
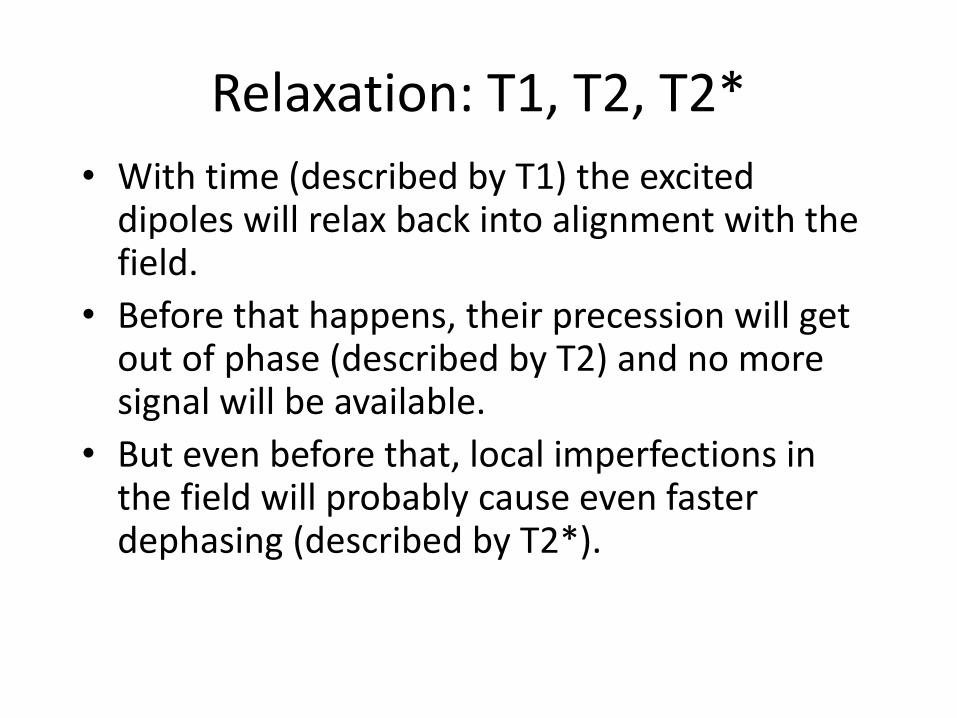
Relaxation: T1, T2, T2*
• With time (described by T1) the excited dipoles will relax back into alignment with the field.
• Before that happens, their precession will get out of phase (described by T2) and no more signal will be available.
• But even before that, local imperfections in the field will probably cause even faster dephasing (described by T2*).
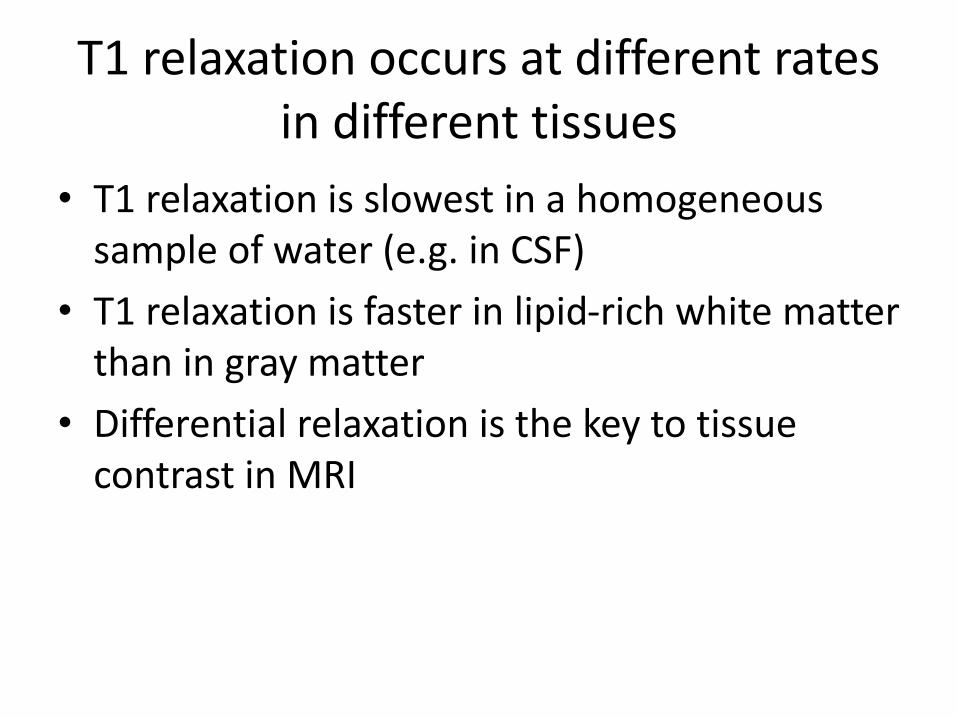
T1 relaxation occurs at different rates in different tissues
• T1 relaxation is slowest in a homogeneous sample of water (e.g. in CSF)
• T1 relaxation is faster in lipid-rich white matter than in gray matter
• Differential relaxation is the key to tissue contrast in MRI
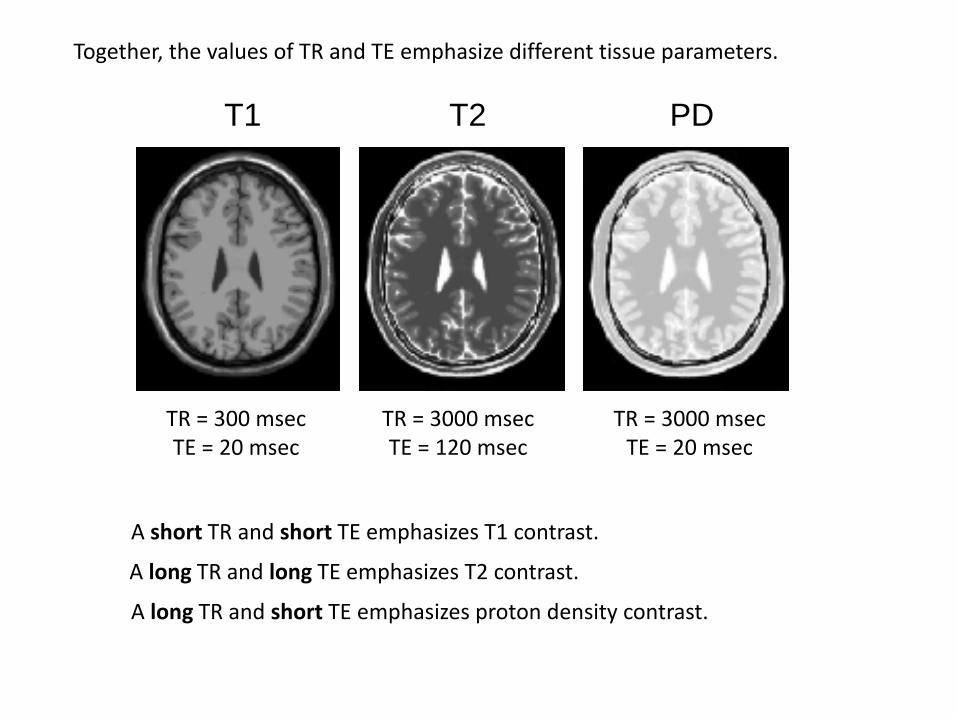
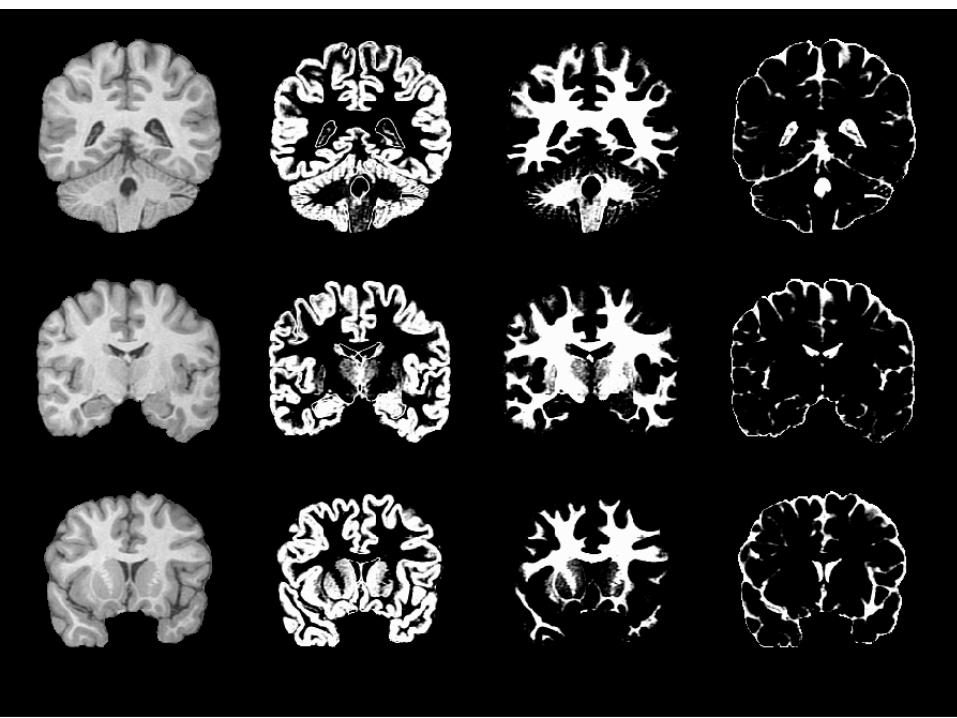
Together, the values of TR and TE emphasize different tissue parameters.
A long TR and short TE emphasizes proton density contrast.
T1 T2 PD
TR = 300 msecTE = 20 msec
TR = 3000 msecTE = 120 msec
TR = 3000 msecTE = 20 msec
A short TR and short TE emphasizes T1 contrast.
A long TR and long TE emphasizes T2 contrast.

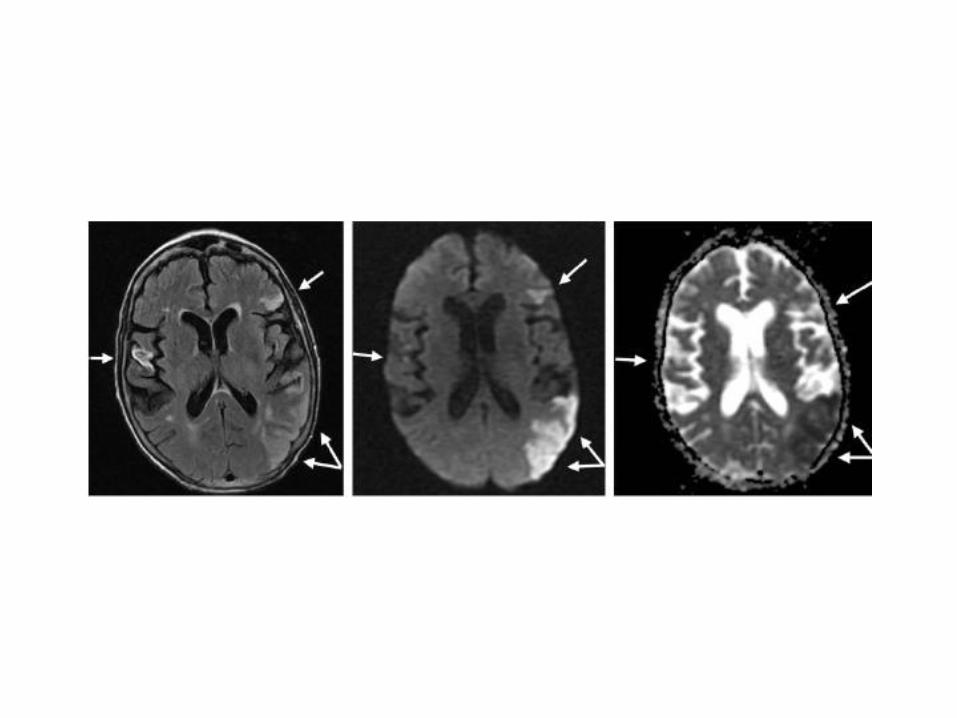
FLAIR : FLuid-Attenuated Inversion Recovery
– T2 weighting with black spinal fluid
The MRI signal is rich
• Proton density• Relaxation times (T1, T2)• Magnetic field distortion (T2*)
• Flow• Diffusion• Chemical shift• Magnetization transfer• ……
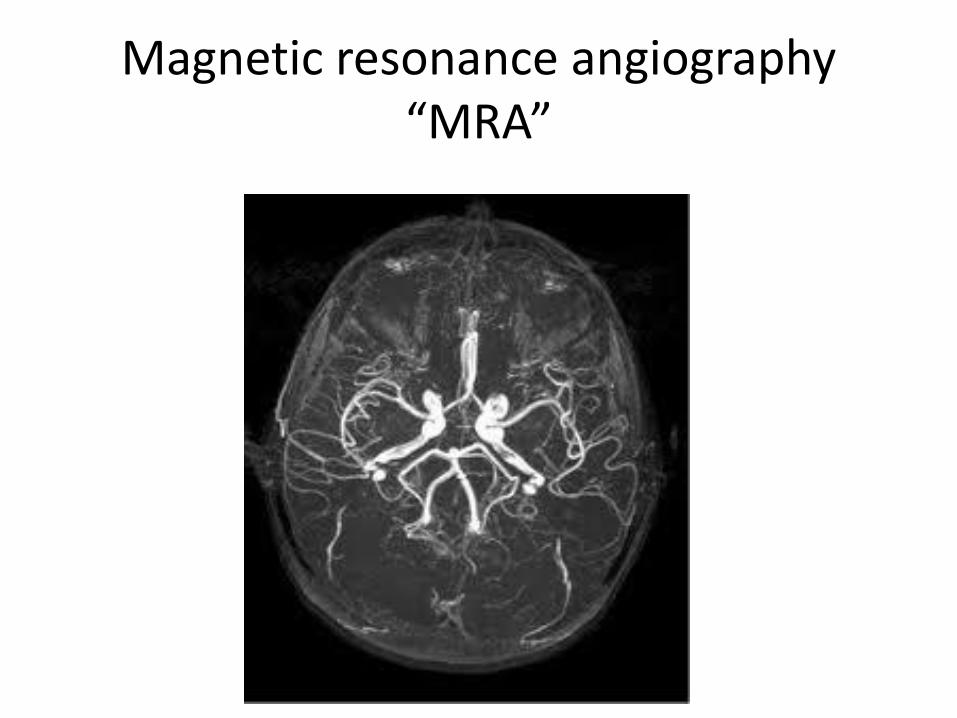
Magnetic resonance angiography“MRA”
The “economy” of MRI
• In MRI signal is the sum of the longitudinal magnetization of the protons in the field of view
• This is a like fixed budget, that can be used more or less efficiently, and can be spent to obtain some combination of:– Better spatial resolution– Better signal to noise ratio (SNR)– Reduced imaging time
• There are always trade-offs!• Advances in MRI are often in the form of a
smarter pulse sequence.

Efficient pulse sequences
• Maximize the amount of time spent listening for the signal
• Maximize the number of protons in the sample that are being put to work at any one time
• Optimize the relationship between TR and TE to maximize signal
• We use two efficient sequences extensively: MP-RAGE and EPI GRE fMRI


Diffusion Tensor Imaging
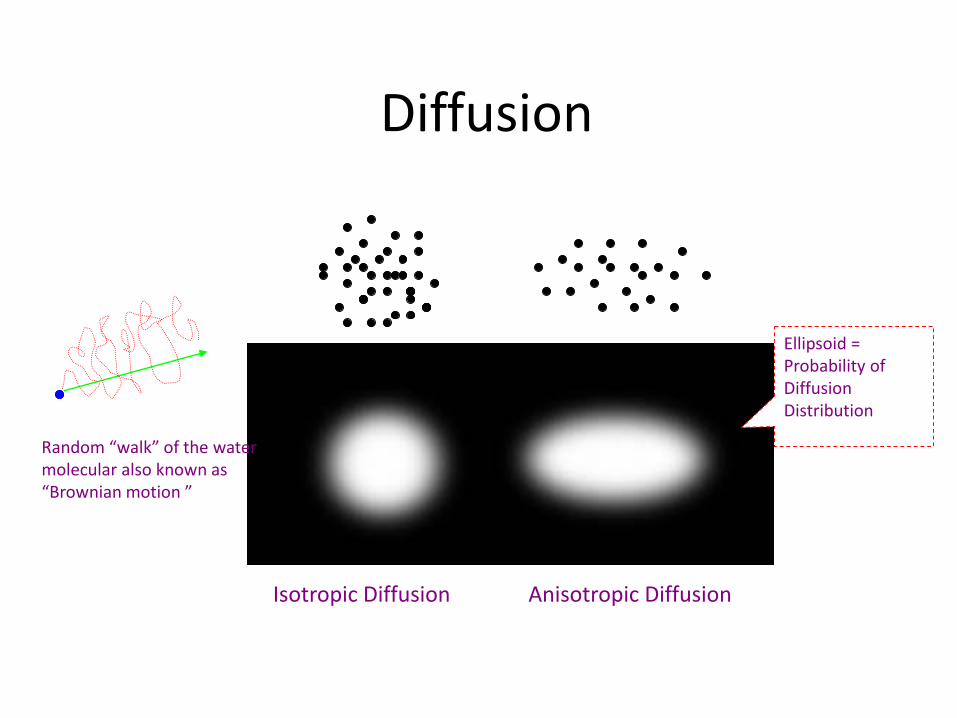
Diffusion
Random “walk” of the water molecular also known as “Brownian motion ”
Isotropic Diffusion Anisotropic Diffusion
Ellipsoid = Probability of Diffusion Distribution

Diffusion eigenvectors
Diagonalization of this tensor provides three eigenvectors (ev1, ev2 and ev3) with three corresponding eigenvalues (λ1, λ2 and λ3)ev1λ1
ev2λ2
ev3λ3 1
2
3
0 0
0 0
0 0
xx xy xz
T
xy yy yz
xz yz zz
D D D
D D D D E E
D D D
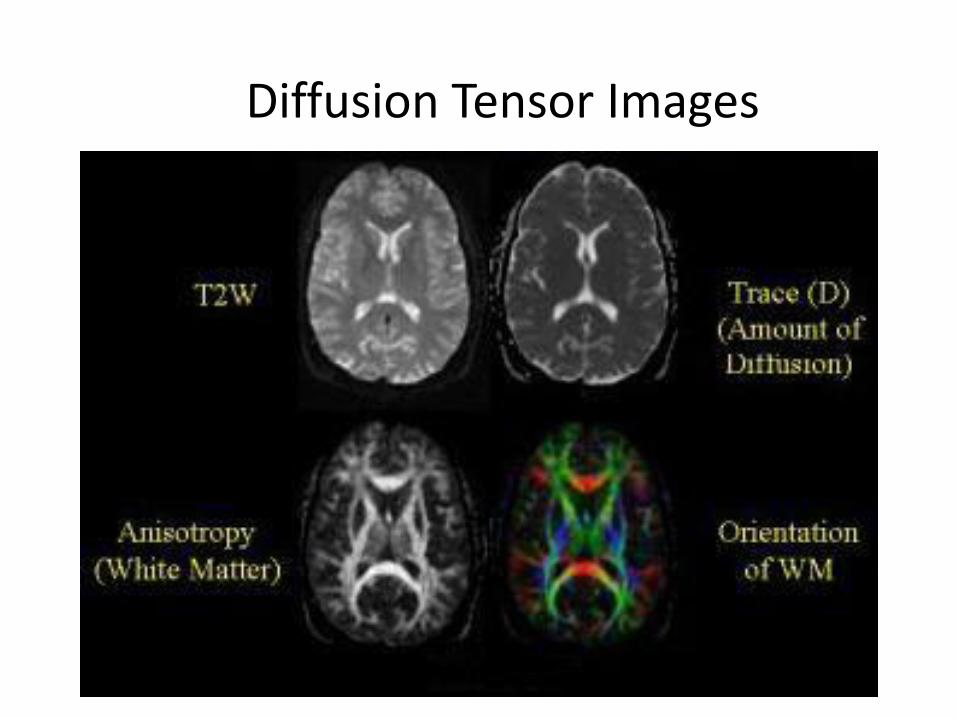
Diffusion Tensor Images
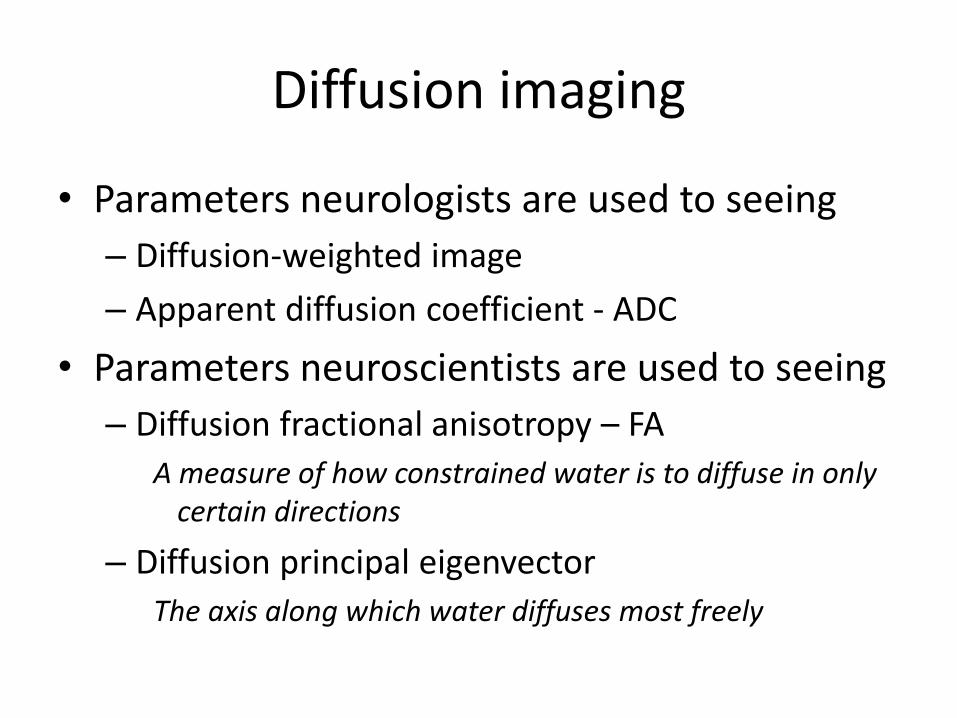
Diffusion imaging
• Parameters neurologists are used to seeing
– Diffusion-weighted image
– Apparent diffusion coefficient - ADC
• Parameters neuroscientists are used to seeing
– Diffusion fractional anisotropy – FA
A measure of how constrained water is to diffuse in only certain directions
– Diffusion principal eigenvector
The axis along which water diffuses most freely
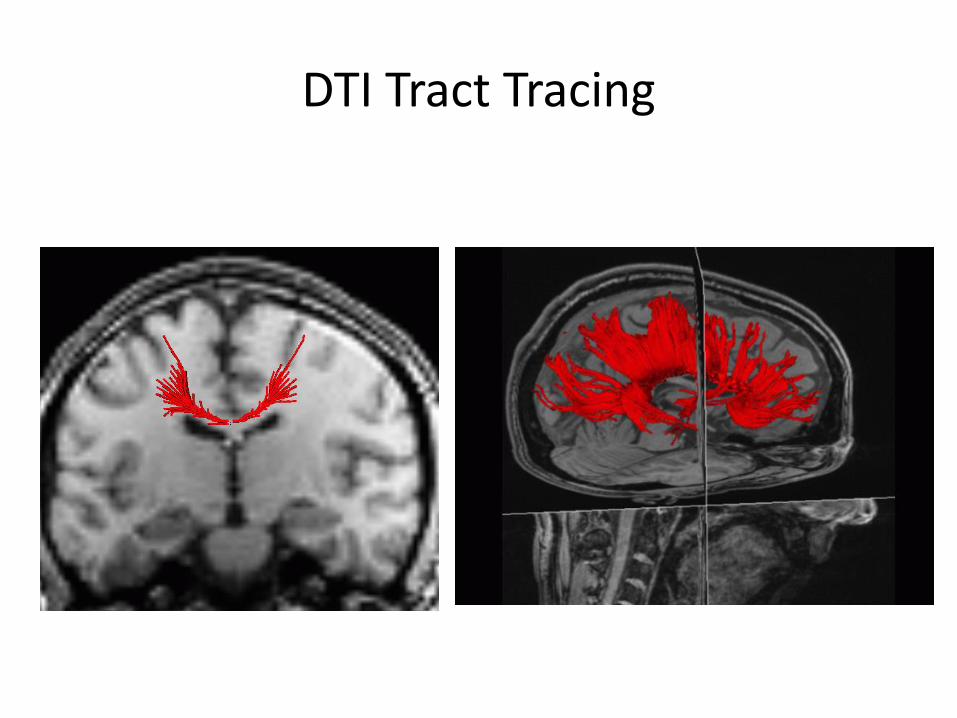
DTI Tract Tracing
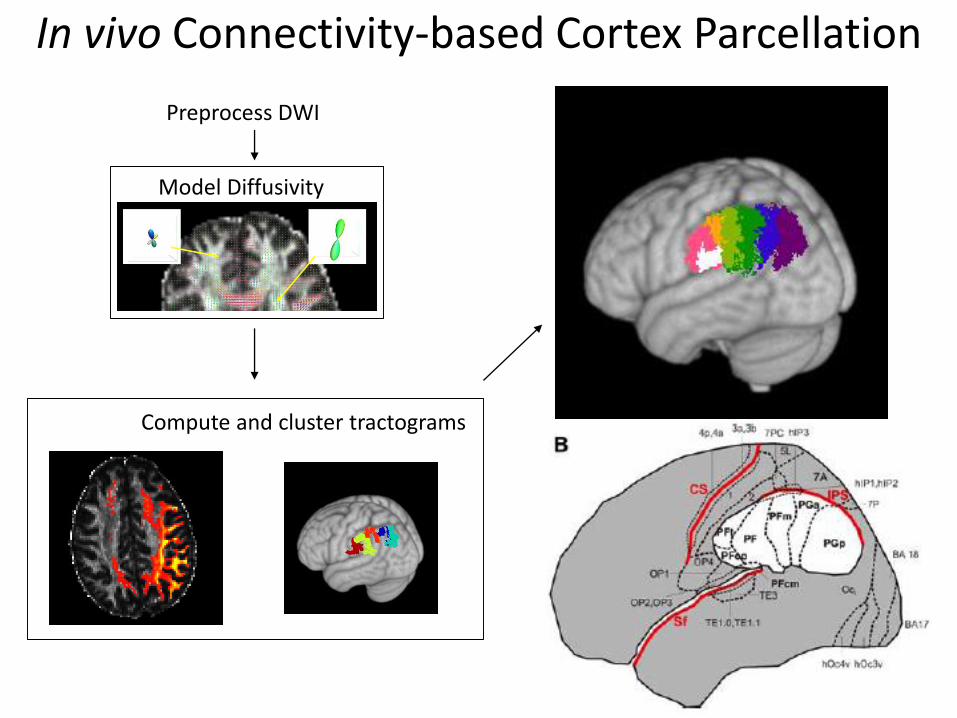
Preprocess DWI
Model Diffusivity
Compute and cluster tractograms
In vivo Connectivity-based Cortex Parcellation

Functional Magnetic Resonance Imaging (fMRI)
Physiological basis of fMRI
Brain activity is imaged indirectly, through parameters related to metabolic substrate delivery.
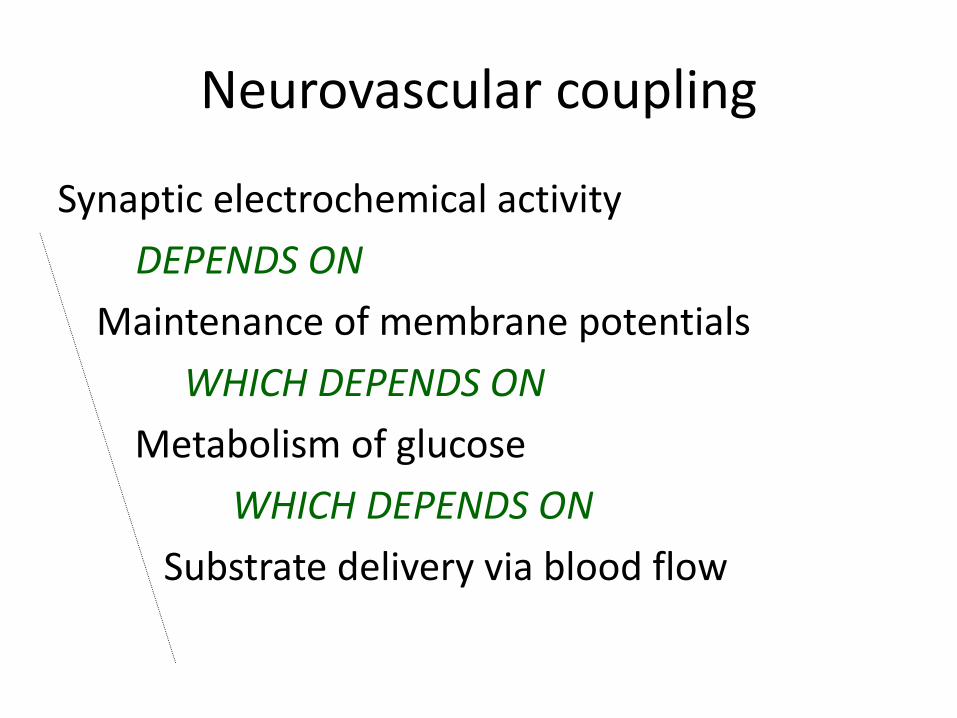
Neurovascular coupling
Synaptic electrochemical activity
DEPENDS ON
Maintenance of membrane potentials
WHICH DEPENDS ON
Metabolism of glucose
WHICH DEPENDS ON
Substrate delivery via blood flow

Basis of fMRI signal
MR SignalNeuralActivity
Metabolism
Blood Flow
dHb T2*
-20
0
20
40
60
80
100
120
0 5 10 15
Time (sec)
HemodynamicResponse Function (HRF)
BloodOxygenationDependentSignal
“BOLD”
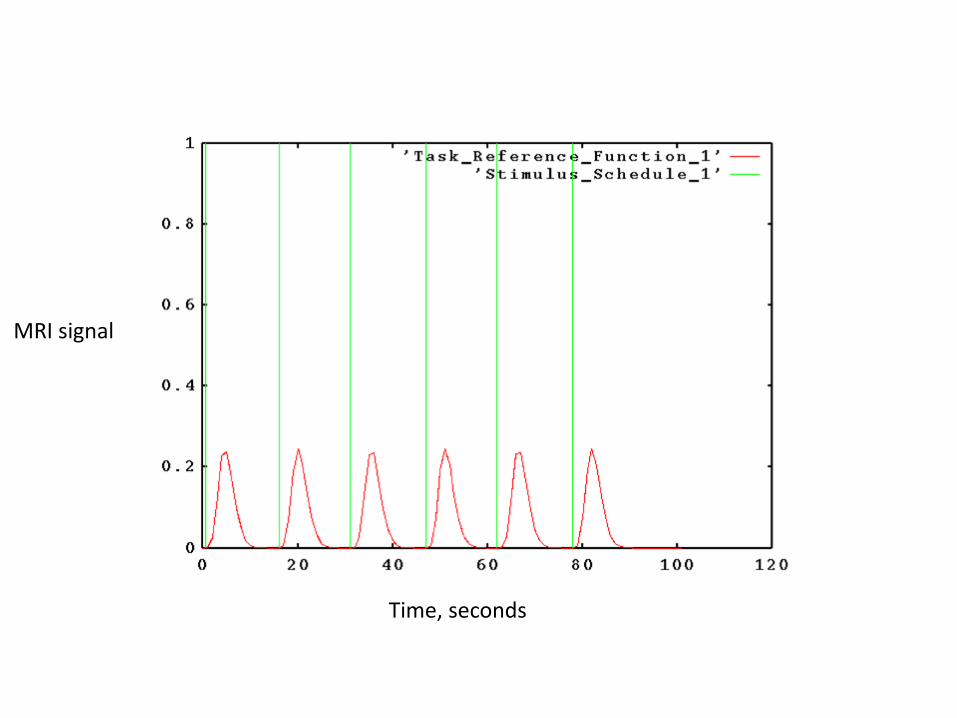
Time, seconds
MRI signal
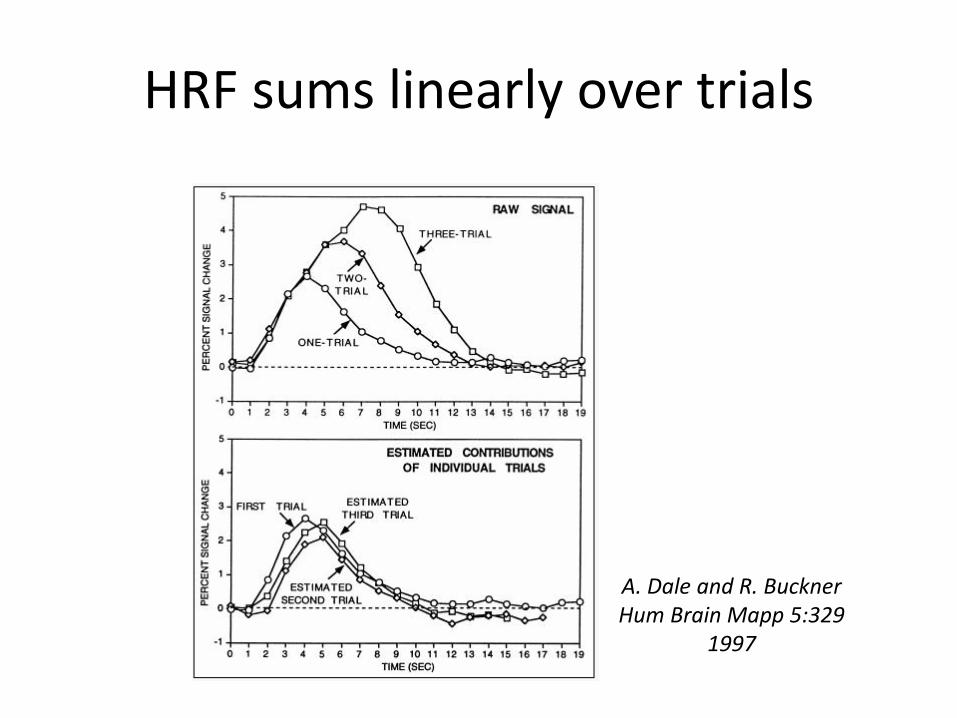
HRF sums linearly over trials
A. Dale and R. BucknerHum Brain Mapp 5:329
1997
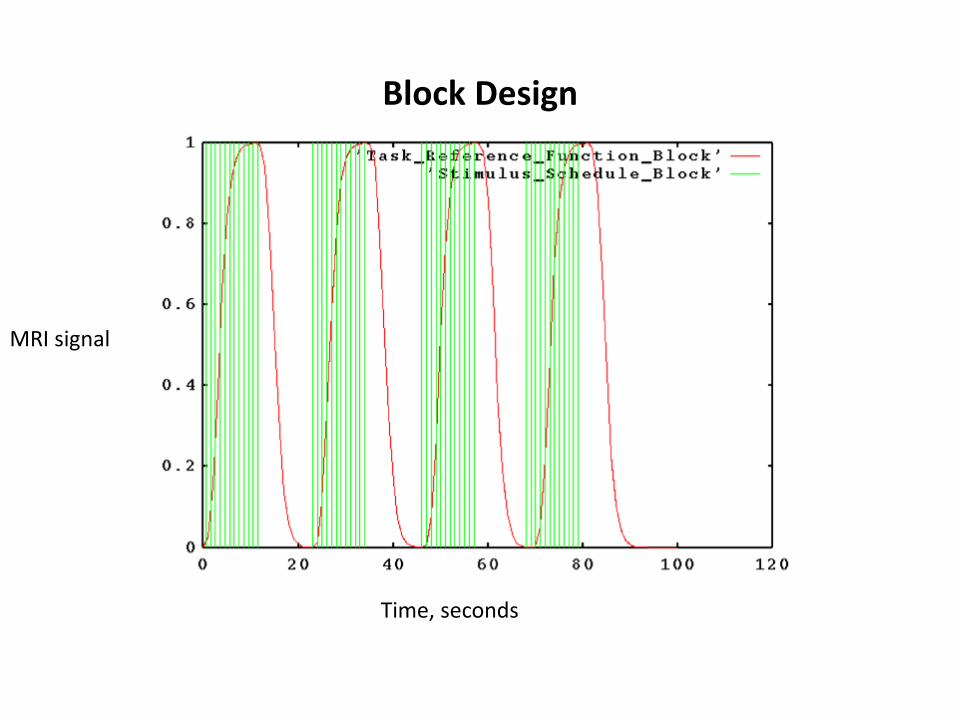
Time, seconds
MRI signal
Block Design

Activation of the anterior temporal lobes during listening to discourse.

Time, seconds
MRI signal
Event-Related Design

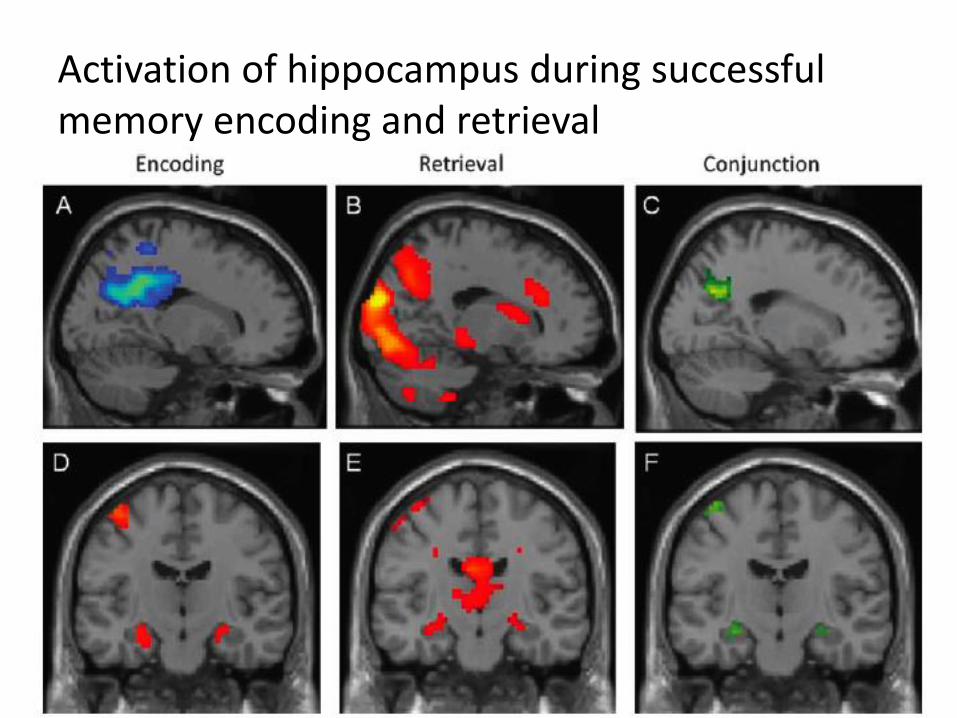
Activation of hippocampus during successful memory encoding and retrieval
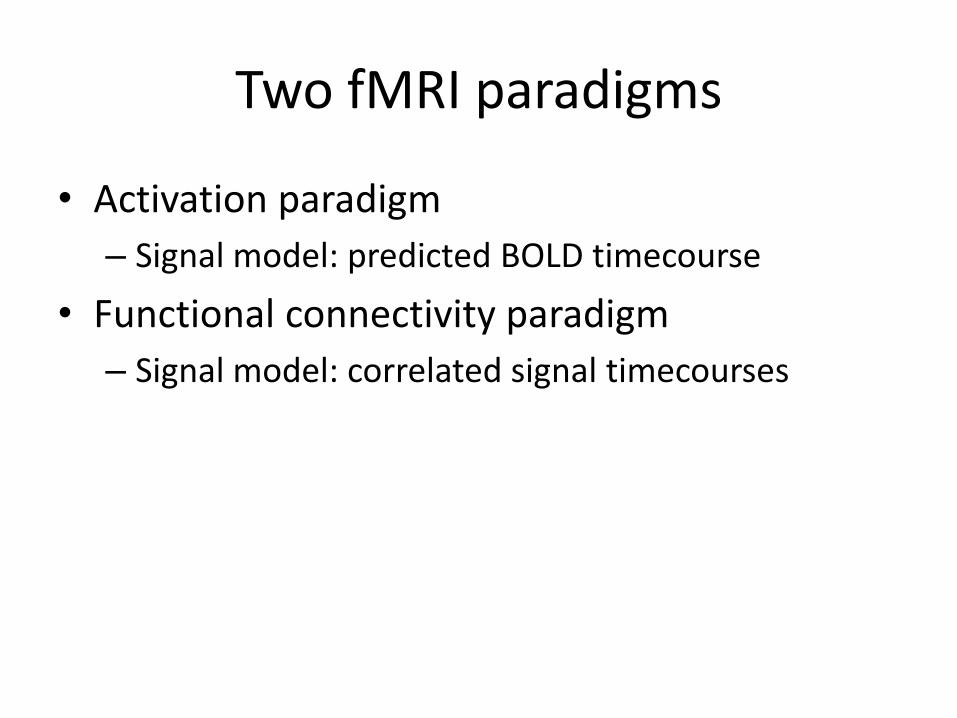
Two fMRI paradigms
• Activation paradigm
– Signal model: predicted BOLD timecourse
• Functional connectivity paradigm
– Signal model: correlated signal timecourses
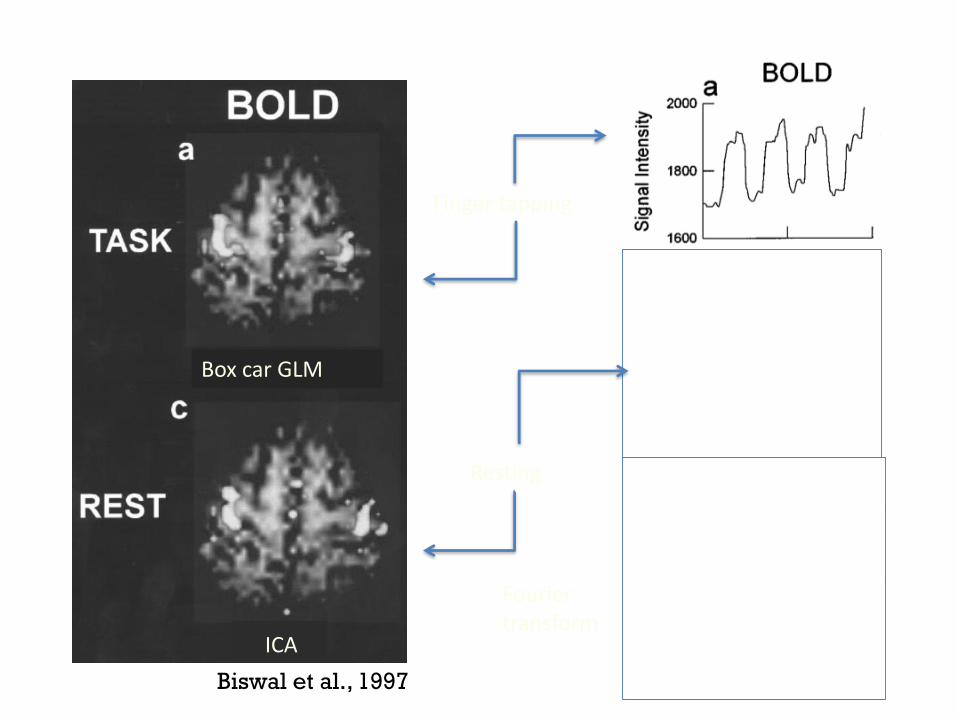
Finger tapping
Fourier transform
Resting State Paradigm
Resting
Biswal et al., 1997
ICA
Box car GLM
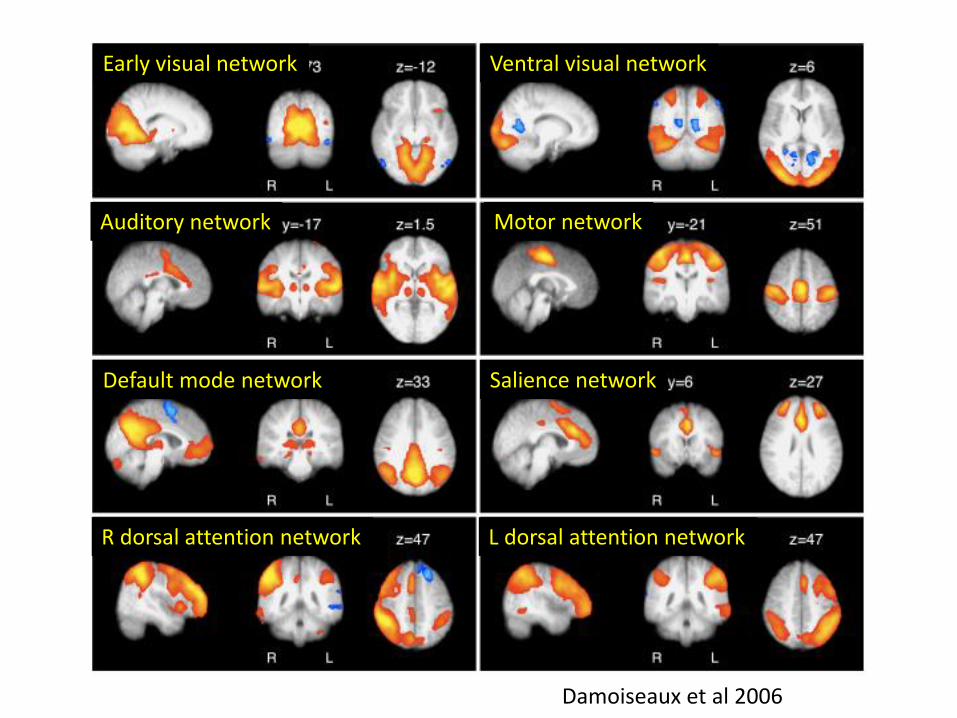
Early visual network
Motor network
Ventral visual network
Auditory network
L dorsal attention network
Salience networkDefault mode network
R dorsal attention network
Damoiseaux et al 2006
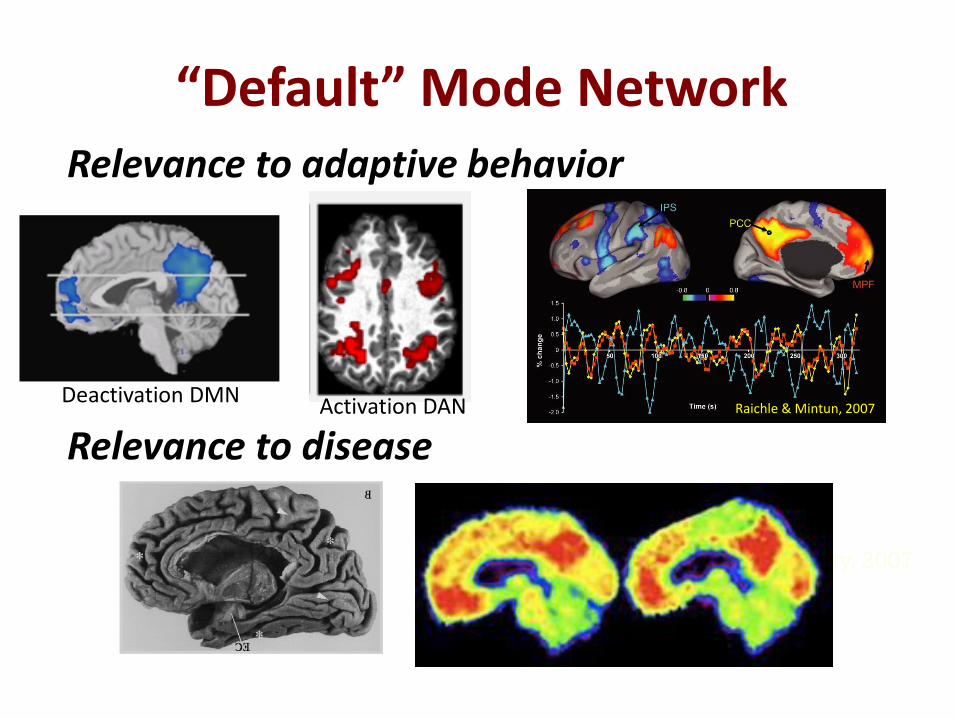
“Default” Mode Network
Grecius & Dougherty, 2007
Relevance to disease
Relevance to adaptive behavior
Raichle & Mintun, 2007Deactivation DMN Activation DAN
Summary: functional connectivity paradigm
• BOLD fluctuations formerly thought to be “noise” are correlated across distant sites.
• Analysis of functional connectivity “at rest” identifies consistent “intrinsic networks”
• Functional connectivity is grounded in anatomic connectivity
• Intrinsic networks may reflect a fundamental level of large-scale physiologic organization


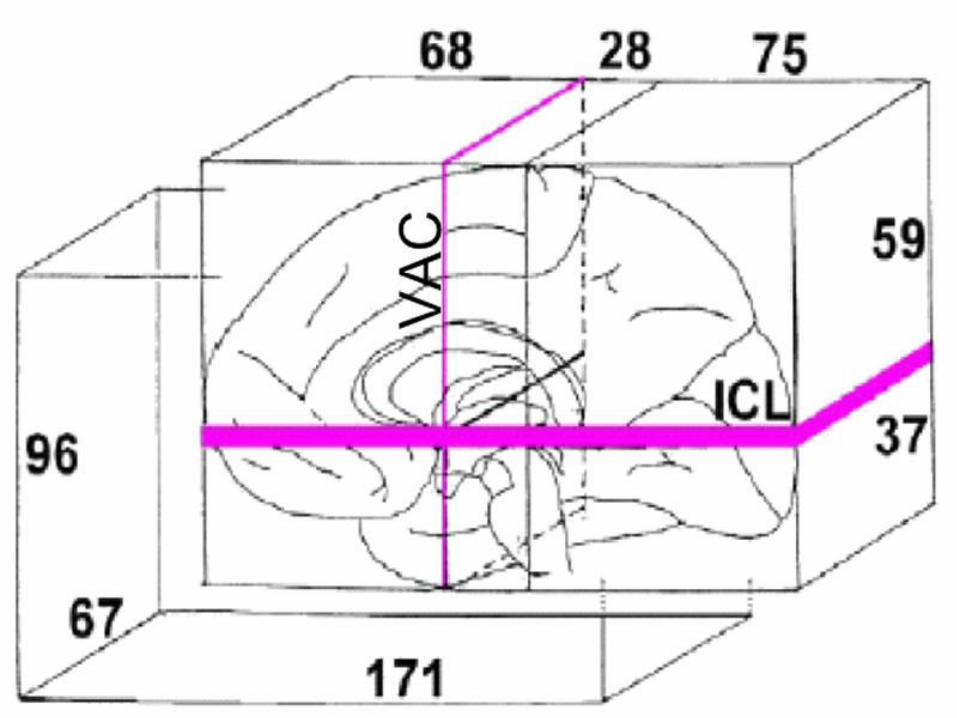
Anchoring standard space
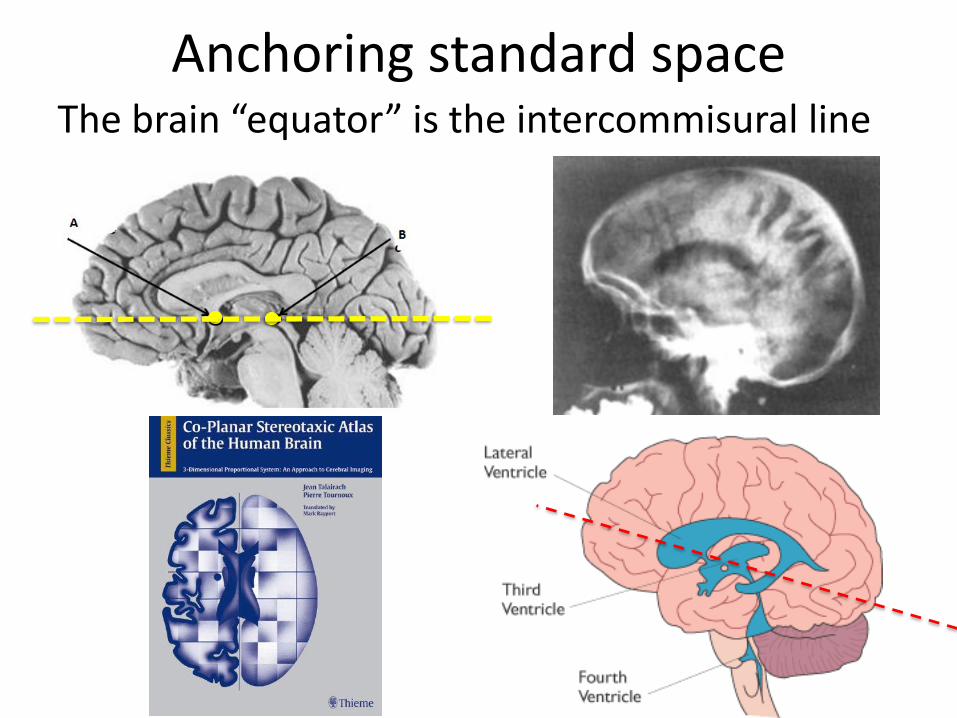
Anchoring standard spaceThe brain “equator” is the intercommisural line
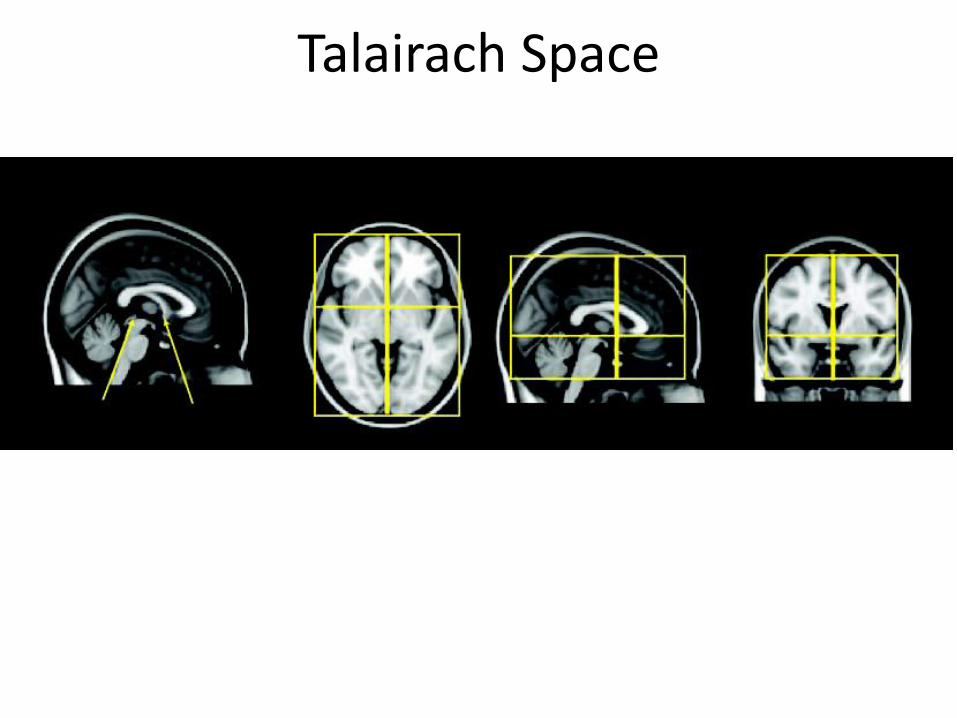
Talairach Space
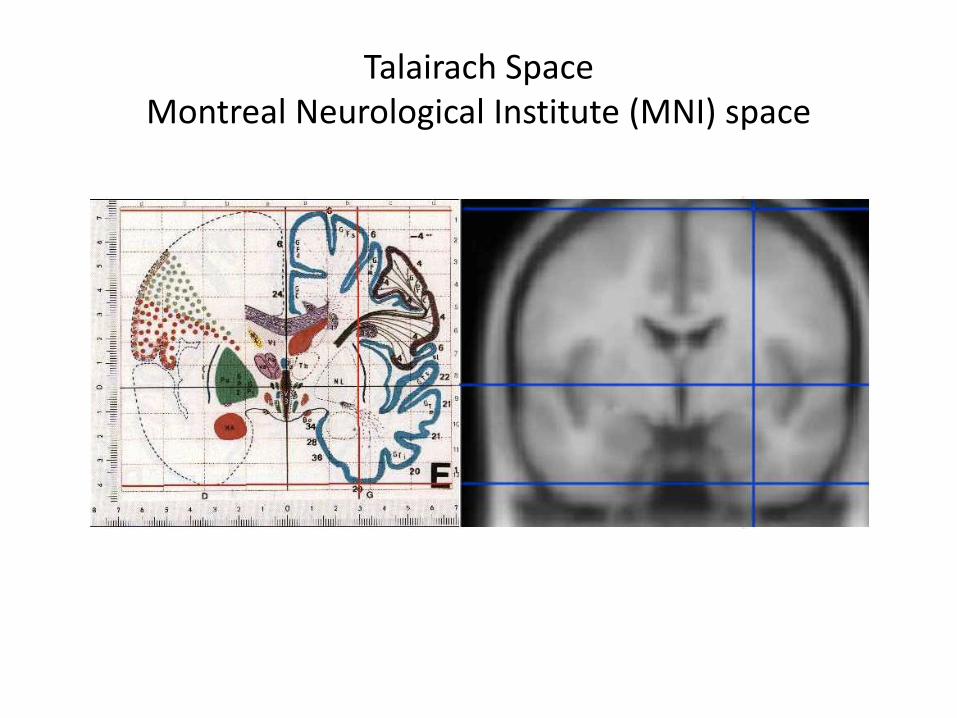
Talairach SpaceMontreal Neurological Institute (MNI) space
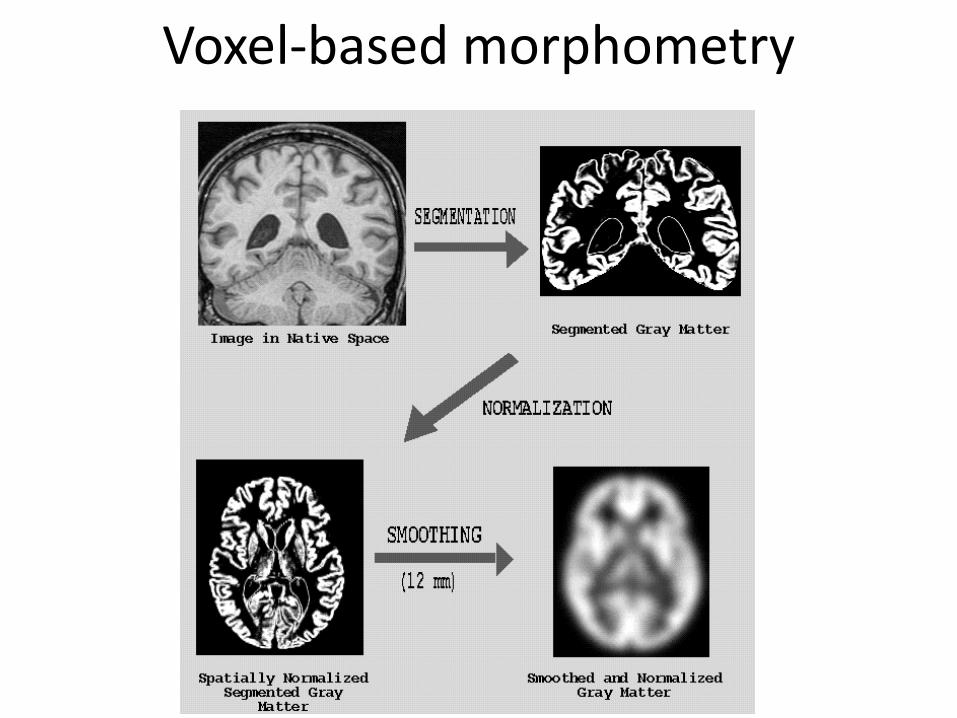
Voxel-based morphometry
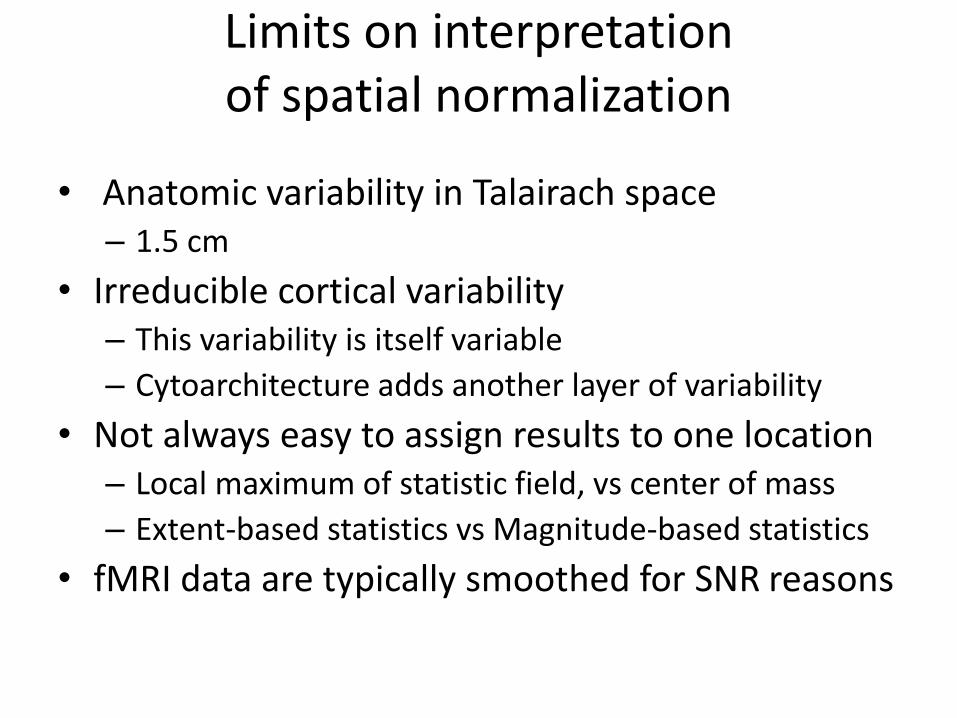
Limits on interpretation of spatial normalization
• Anatomic variability in Talairach space – 1.5 cm
• Irreducible cortical variability – This variability is itself variable
– Cytoarchitecture adds another layer of variability
• Not always easy to assign results to one location– Local maximum of statistic field, vs center of mass
– Extent-based statistics vs Magnitude-based statistics
• fMRI data are typically smoothed for SNR reasons

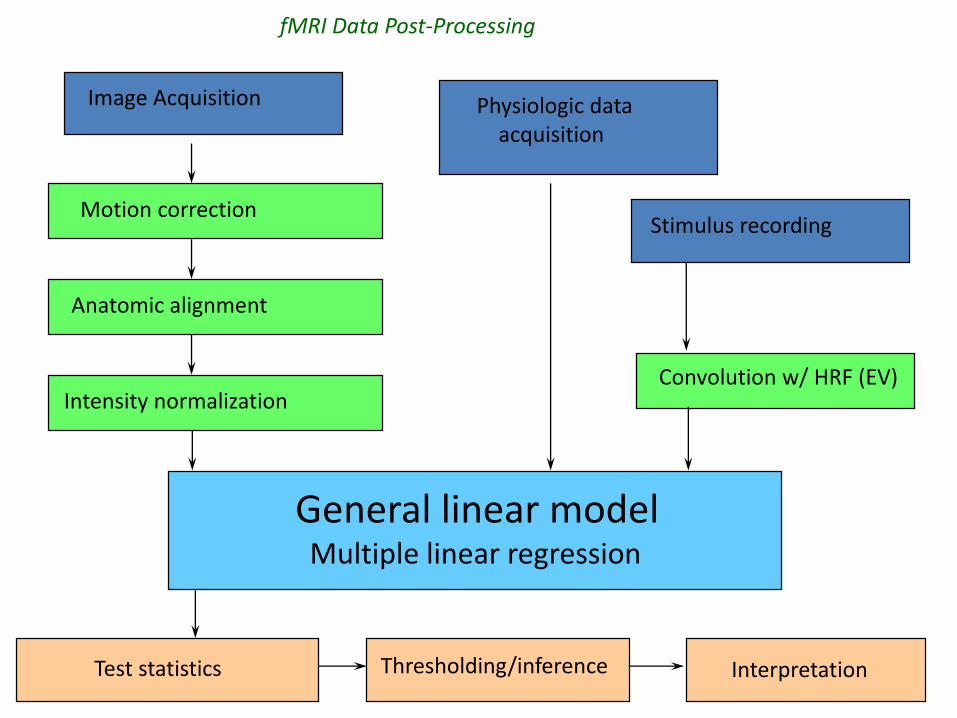
Image Acquisition Physiologic data acquisition
Stimulus recordingMotion correction
Anatomic alignment
Intensity normalization
General linear modelMultiple linear regression
Convolution w/ HRF (EV)
Thresholding/inferenceTest statistics
fMRI Data Post-Processing
Interpretation
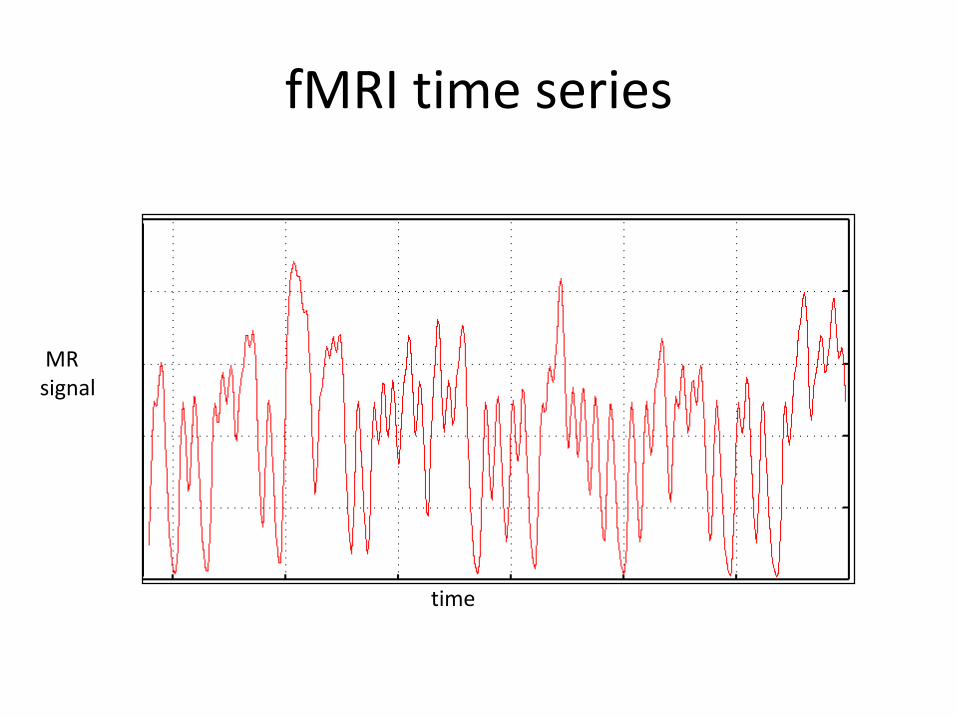
fMRI time series
time
MRsignal
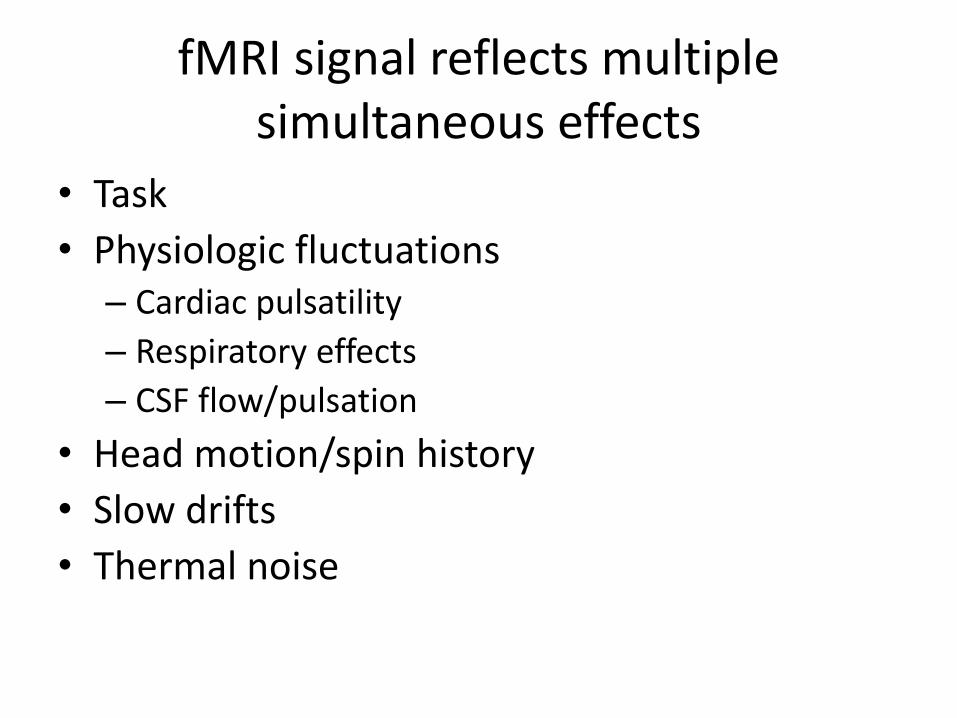
fMRI signal reflects multiple simultaneous effects
• Task
• Physiologic fluctuations– Cardiac pulsatility
– Respiratory effects
– CSF flow/pulsation
• Head motion/spin history
• Slow drifts
• Thermal noise
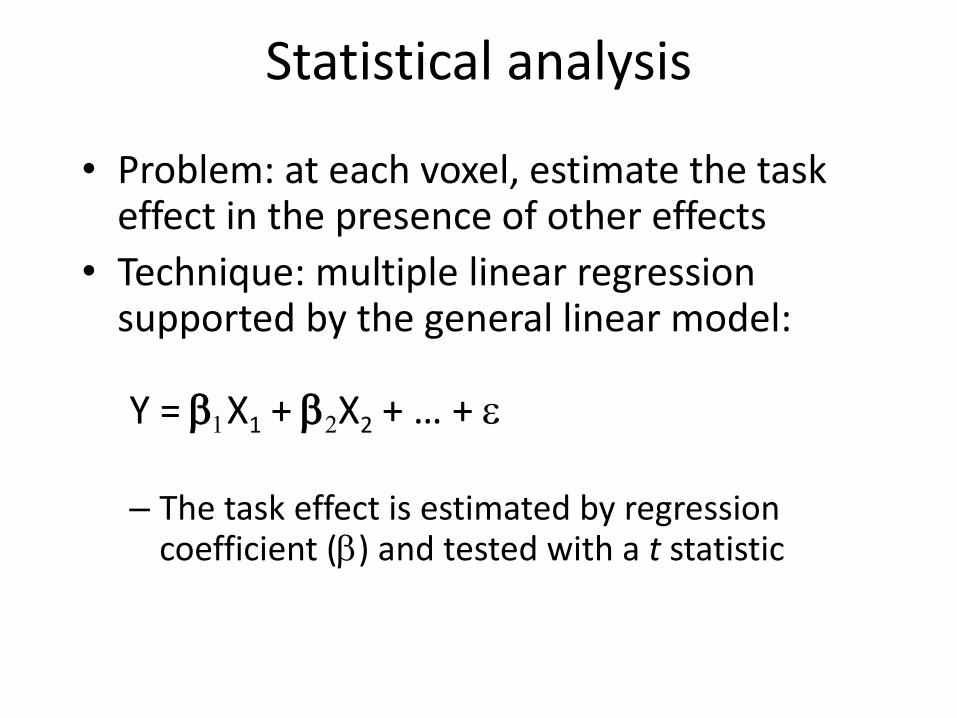
Statistical analysis
• Problem: at each voxel, estimate the task effect in the presence of other effects
• Technique: multiple linear regressionsupported by the general linear model:
Y = b1X1 + b2X2 + … + e
– The task effect is estimated by regression coefficient (b) and tested with a t statistic
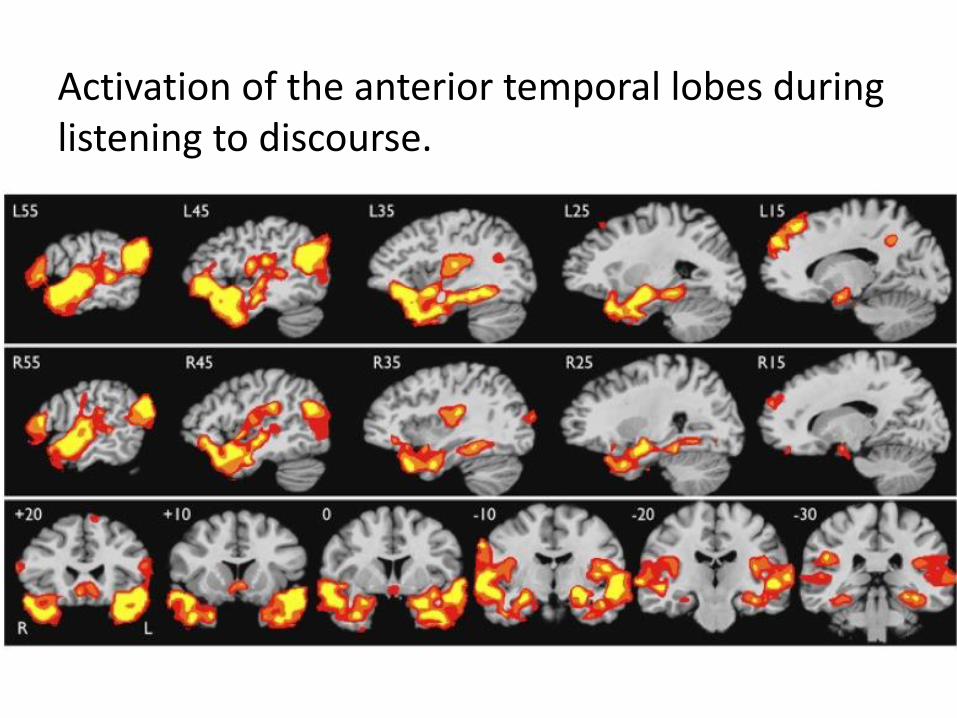
Activation of the anterior temporal lobes during listening to discourse.
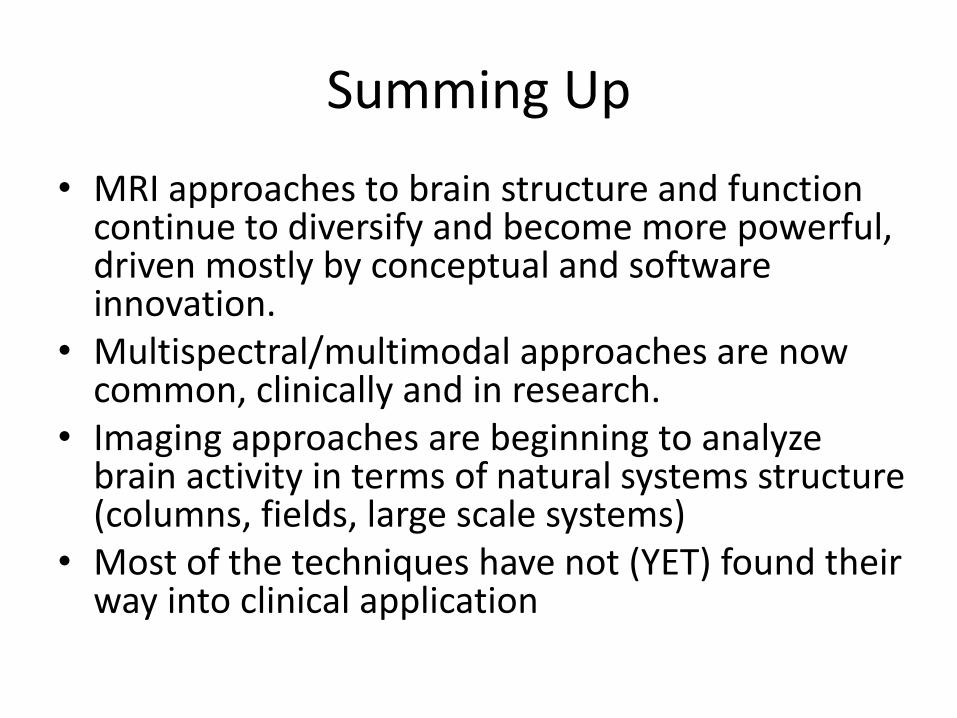
Summing Up
• MRI approaches to brain structure and function continue to diversify and become more powerful, driven mostly by conceptual and software innovation.
• Multispectral/multimodal approaches are now common, clinically and in research.
• Imaging approaches are beginning to analyze brain activity in terms of natural systems structure (columns, fields, large scale systems)
• Most of the techniques have not (YET) found their way into clinical application

Questions?


![Brain Amyloid Imaging · D = 6.7 nM AD brain 2014 2012 [18F]AV-45 florbetapir HN O CH 3 O N O 18 F K D = 3.1 nM AD brain Approved 18F-Labeled Amyloid Radiotracers [18F]3’F-PIB](https://static.fdocuments.us/doc/165x107/5ec436274d34d13b041ea689/brain-amyloid-imaging-d-67-nm-ad-brain-2014-2012-18fav-45-florbetapir-hn-o.jpg)