Brain Imaging and Machine Learning for Brain-Computer Interface
20
Brain Imaging and Machine Learning for Brain-Computer Interface 57 X Brain Imaging and Machine Learning for Brain-Computer Interface Maha Khachab, Chafic Mokbel, Salim Kaakour, Nicolas Saliba and Gérard Chollet* University of Balamand Lebanon *Ecole Nationale Supérieure des Télécommunications Paris 1. Introduction Human-computer interfaces are in continuous development, from keyboard, mouse, touch screen, to voice dictation, gesture recognition, etc. The aim is to facilitate the interaction between the human brain and the resources offered by a machine or a computer. Recently, a wider interest has emerged in directly interfacing the brain and the computer. The development of methods that combine the nervous system with artificial devices is attracting a growing interest from clinical research, because the interaction between brain and machines may lead to novel prosthetic devices or to a more efficient use of computer resources by breaking the barriers imposed at present by the classical human-machine interfaces. Individuals with impaired motor control may be disabled in the performance of their daily activities. Their motor performance, however, can be supported by artificial motor control systems. Such motor support systems may also assist healthy individuals in performing their tasks. One can also imagine interacting with different systems in parallel, or developing newer software tools without the need to physically typing the code. The brain output pathway allows it to interact through its natural biological interfaces. In order to design a system to support an impaired human motor control function or to directly interact the brain with computers and machines, one should address the method of interfacing with the human body. The interface should provide signals from the human body to derive motor intention. These interfaces and technologies are studied in the wide domain of neurotechnology. Neurotechnology is a multidisciplinary domain that integrates, not exclusively, knowledge and scientific evidence from neurosciences, engineering, and signal processing. The present chapter focuses specifically on Brain-Computer Interfaces. P. Sajda et al., defines (Sajda et al., 2008) the Brain-Computer Interface (BCI) as: “A Brain- Computer Interface is a system that includes a means for measuring neural signals from the brain, a method/algorithm for decoding these signals and a methodology for mapping this decoding to a behavior or action”. The system is thus formed of three principal blocks. The 3 www.intechopen.com
Transcript of Brain Imaging and Machine Learning for Brain-Computer Interface

Brain Imaging and Machine Learning for Brain-Computer Interface 57
Brain Imaging and Machine Learning for Brain-Computer Interface
Maha Khachab, Chaic Mokbel, Salim Kaakour, Nicolas Saliba and Gérard Chollet
X
Brain Imaging and Machine Learning for Brain-Computer Interface
Maha Khachab, Chafic Mokbel, Salim Kaakour,
Nicolas Saliba and Gérard Chollet* University of Balamand
Lebanon *Ecole Nationale Supérieure des Télécommunications
Paris
1. Introduction
Human-computer interfaces are in continuous development, from keyboard, mouse, touch screen, to voice dictation, gesture recognition, etc. The aim is to facilitate the interaction between the human brain and the resources offered by a machine or a computer. Recently, a wider interest has emerged in directly interfacing the brain and the computer. The development of methods that combine the nervous system with artificial devices is attracting a growing interest from clinical research, because the interaction between brain and machines may lead to novel prosthetic devices or to a more efficient use of computer resources by breaking the barriers imposed at present by the classical human-machine interfaces. Individuals with impaired motor control may be disabled in the performance of their daily activities. Their motor performance, however, can be supported by artificial motor control systems. Such motor support systems may also assist healthy individuals in performing their tasks. One can also imagine interacting with different systems in parallel, or developing newer software tools without the need to physically typing the code. The brain output pathway allows it to interact through its natural biological interfaces. In order to design a system to support an impaired human motor control function or to directly interact the brain with computers and machines, one should address the method of interfacing with the human body. The interface should provide signals from the human body to derive motor intention. These interfaces and technologies are studied in the wide domain of neurotechnology. Neurotechnology is a multidisciplinary domain that integrates, not exclusively, knowledge and scientific evidence from neurosciences, engineering, and signal processing. The present chapter focuses specifically on Brain-Computer Interfaces. P. Sajda et al., defines (Sajda et al., 2008) the Brain-Computer Interface (BCI) as: “A Brain-Computer Interface is a system that includes a means for measuring neural signals from the brain, a method/algorithm for decoding these signals and a methodology for mapping this decoding to a behavior or action”. The system is thus formed of three principal blocks. The
3
www.intechopen.com

Biomedical Imaging58
first two blocks are critical for the success of the BCI. Actually, the neural signals to be measured have to be chosen adequately and the decoding of these signals should be accurate. The use of the output of the decoder in the third block of a BCI application is a pure engineering problem. This block should take into account some specific aspects related to the errors that a BCI system may lead to and the particular context of a BCI. This chapter focuses on the first two blocks, i.e. the acquisition and decoding of neural signals. Informative neural signals may be collected at the microscopic level (e.g. spike trains), mesoscopic level (e.g. electrocorticogram) and/or, macroscopic level (e.g. electroencephalogram). In order to collect the spike trains, electrodes are generally implanted in a surgery with non negligible risk. BCI approaches based on these signals are invasive approaches. Besides the high surgical risks, such approaches have to face other challenges. The power consumption is a key issue limiting the possibility of advanced processing in the electrode implantation area. Therefore, neural signals have to be transmitted out of the implantation area which by itself is also a challenge. Clearly, non-invasive approaches, e.g. EEG signals-based systems, are more attractive than the invasive ones for the limited risk they may incur. However, signals in non invasive approaches are less precise than the spike trains measured in electrode-based approaches. Advanced processing is therefore required in the decoding block. In this chapter, we focus mainly on the non-invasive approaches for BCI. Several techniques have been proposed to measure relevant features from EEG or MRI signals and to decode the brain targets from those features. Such techniques are reviewed in the chapter with a focus on a specific approach. The basic idea is to make the comparison between a BCI system and the use of brain imaging in medical applications. Actually, based on neural signals like EEG, the electro-magnetic activity at the surface of the cortex may be measured. A practitioner would make use of such images of the cortex surface to detect abnormalities or diseases. The chapter shows this parallelism and how it has been exploited to build a state of the art BCI system. After a brief description of a general BCI system, a brief review of the neural signals and their measurements is provided. A particular focus is on EEG signals. EEG is a standard non-invasive and nearly risk-free method that has been extensively used in medical applications. In order to decode the signals collected, feature extraction is first performed. Based on the relevant features computed, a classification is performed. State of the art feature extraction approaches systems are presented in the chapter. Brain imaging techniques allow to visualize the surface of the cortex. This suggests using brain imaging techniques to evaluate the electro-magnetic activity at the cortex surface that will define a vector of features. These features will be given to the decoding/classification algorithm as input. At the output of the classification algorithm, the decoded intention would be detected. The chapter presents briefly several techniques for brain imaging with a focus on subspace correlation methods. These methods are detailed in the chapter. Several classifiers, e.g. Artificial Neural Networks (ANN), Independent Component Analysis (ICA) and other approaches have been used extensively in BCI systems. As an
example both the Support Vector Machine (SVM) and the Gaussian Mixture Model (GMM) are presented. To illustrate the concepts presented, a BCI system is described and some experimental results are provided. The system makes use of signal subspace decomposition as feature extraction and support vector machine as classifier. The chapter provides some hints about the system implementation before providing conclusions and perspectives.
2. BCI System
The basic design and operation of a BCI system include the following components (Veltink et al., 2001)(Wolpaw et al., 2002)(Ebrahimi et al., 2003):
1. Signal acquisition and digitization: The input is the EEG activity or brain signals from the user. This input is acquired by recording electrodes, amplified, and digitized. As stated above the signal acquisition defers largely from invasive and noninvasive approaches.
2. Signal processing: It comprises two stages:
a. Feature extraction: Features related to specific electrophysiology components are extracted.
b. Decoding algorithm: It translates the signal features into device commands that accomplish the user’s request.
3. Output device: In general, the output device may be prosthesis with its control
system or a video screen. The output is the feedback the brain uses to maintain and improve communication or to control prosthesis.
4. Operating format: It guides the operation (onset, offset, and timing) of the BCI.
Fig. 1. Basic design and operation of a Brain-Computer Interface (BCI).
Signal acquisition and preprocessing Feature
Extraction Decoding
Algorithm
Mechanical arm control
Adjust parameters
www.intechopen.com

Brain Imaging and Machine Learning for Brain-Computer Interface 59
first two blocks are critical for the success of the BCI. Actually, the neural signals to be measured have to be chosen adequately and the decoding of these signals should be accurate. The use of the output of the decoder in the third block of a BCI application is a pure engineering problem. This block should take into account some specific aspects related to the errors that a BCI system may lead to and the particular context of a BCI. This chapter focuses on the first two blocks, i.e. the acquisition and decoding of neural signals. Informative neural signals may be collected at the microscopic level (e.g. spike trains), mesoscopic level (e.g. electrocorticogram) and/or, macroscopic level (e.g. electroencephalogram). In order to collect the spike trains, electrodes are generally implanted in a surgery with non negligible risk. BCI approaches based on these signals are invasive approaches. Besides the high surgical risks, such approaches have to face other challenges. The power consumption is a key issue limiting the possibility of advanced processing in the electrode implantation area. Therefore, neural signals have to be transmitted out of the implantation area which by itself is also a challenge. Clearly, non-invasive approaches, e.g. EEG signals-based systems, are more attractive than the invasive ones for the limited risk they may incur. However, signals in non invasive approaches are less precise than the spike trains measured in electrode-based approaches. Advanced processing is therefore required in the decoding block. In this chapter, we focus mainly on the non-invasive approaches for BCI. Several techniques have been proposed to measure relevant features from EEG or MRI signals and to decode the brain targets from those features. Such techniques are reviewed in the chapter with a focus on a specific approach. The basic idea is to make the comparison between a BCI system and the use of brain imaging in medical applications. Actually, based on neural signals like EEG, the electro-magnetic activity at the surface of the cortex may be measured. A practitioner would make use of such images of the cortex surface to detect abnormalities or diseases. The chapter shows this parallelism and how it has been exploited to build a state of the art BCI system. After a brief description of a general BCI system, a brief review of the neural signals and their measurements is provided. A particular focus is on EEG signals. EEG is a standard non-invasive and nearly risk-free method that has been extensively used in medical applications. In order to decode the signals collected, feature extraction is first performed. Based on the relevant features computed, a classification is performed. State of the art feature extraction approaches systems are presented in the chapter. Brain imaging techniques allow to visualize the surface of the cortex. This suggests using brain imaging techniques to evaluate the electro-magnetic activity at the cortex surface that will define a vector of features. These features will be given to the decoding/classification algorithm as input. At the output of the classification algorithm, the decoded intention would be detected. The chapter presents briefly several techniques for brain imaging with a focus on subspace correlation methods. These methods are detailed in the chapter. Several classifiers, e.g. Artificial Neural Networks (ANN), Independent Component Analysis (ICA) and other approaches have been used extensively in BCI systems. As an
example both the Support Vector Machine (SVM) and the Gaussian Mixture Model (GMM) are presented. To illustrate the concepts presented, a BCI system is described and some experimental results are provided. The system makes use of signal subspace decomposition as feature extraction and support vector machine as classifier. The chapter provides some hints about the system implementation before providing conclusions and perspectives.
2. BCI System
The basic design and operation of a BCI system include the following components (Veltink et al., 2001)(Wolpaw et al., 2002)(Ebrahimi et al., 2003):
1. Signal acquisition and digitization: The input is the EEG activity or brain signals from the user. This input is acquired by recording electrodes, amplified, and digitized. As stated above the signal acquisition defers largely from invasive and noninvasive approaches.
2. Signal processing: It comprises two stages:
a. Feature extraction: Features related to specific electrophysiology components are extracted.
b. Decoding algorithm: It translates the signal features into device commands that accomplish the user’s request.
3. Output device: In general, the output device may be prosthesis with its control
system or a video screen. The output is the feedback the brain uses to maintain and improve communication or to control prosthesis.
4. Operating format: It guides the operation (onset, offset, and timing) of the BCI.
Fig. 1. Basic design and operation of a Brain-Computer Interface (BCI).
Signal acquisition and preprocessing Feature
Extraction Decoding
Algorithm
Mechanical arm control
Adjust parameters
www.intechopen.com

Biomedical Imaging60
3. Feature Extraction
Several measurement procedures have been used in modern BCI. As stated earlier, they can be divided into two categories. Non invasive procedures include Electroencephalography (EEG), Magnetoencephalography (MEG), functional magnetic resonance imaging (fMRI), positron emission tomography (PET) and near infrared spectroscopy (NIRS). Electrocorticography (ECoG), a method in which signals are recorded using intracranial electrodes, is used as an invasive procedure to collect signals.
3.1 Spike Signals The brain has a fascinating design consisting of a huge number of neurons that operate in parallel and a distributed memory system formed of synapses. There are over 100 trillions of synapses in the cerebral cortex. Each neuron is assumed to produce a unique and consistent spike waveform which is difficult to detect. The duration of a spike is on average 1 millisecond and its peak-to-peak voltage is from 100 to 400 V. The spikes cannot be used directly by the detection part of a BCI system. State of the art invasive BCI systems, start by sorting the spike trains (Shenoy et al., 2006). The distribution of specific spike signals can be used in order to detect the desired movement or intention.
3.2 Non-Invasive Signals Non-invasive exploration of human brain functions has always been a central topic in biomedical research. This is not only motivated by the high risk of invasive implantation surgery but also because macroscopic information has inherent value due to the information it provides on the motor command. Before any movement occurs, motor commands carried by descending motor pathways must first be organized in the brain. The target of the movement is identified by pooling sensory information in the posterior parietal cerebral cortex (Jakson et al., 1999). This information is then transmitted to the supplementary motor and premotor areas where a motor plan is developed. The plan includes information about the specific muscles that need to be contracted, the strength of contraction, and sequence of contraction. The motor plan is implemented by commands transmitted from the primary motor cortex through the descending pathways. Successful execution of these motor commands, however, depends on feedback provided to the motor cortex through the ascending pathways to the somatosensory cortex as well as through the visual pathway. One should also add that during both the planning and execution stages of a movement, motor processing is also provided by 2 major control systems, the cerebellum and basal ganglia (Figures 2 and 3). In order to monitor the spatio-temporal evolution of the cortical activity within the human brain, several methods make use of the electric potential and/or magnetic fields associated with the intracellular current that flows within the active pyramidal cells of the cortex. Surface electrodes can record electrical potential differences from a scalp surface leading to what is called electroencephalography (EEG). Magnetoencephalography (MEG) makes use of a superconducting quantum interference device (SQUID) magnetometer in order to record the weak magnetic fields outside the head surface (Knuutila et al 1993). Moreover, one goal in electric and magnetic recordings is to form an image of the electrical sources distributed across the cortex (Mosher et al., 1992) (Dale & Sereno, 1993).
Fig. 2. Cortical projections involving the motor areas. (From (Berne RM, Levy MN, Koeppen BM, Stanton BA. Physiology, Fourth edition, 1998).
Fig. 3. Flow diagram showing the sequence of activity in the voluntary motor and somatosensory feedback pathways. (From Berne RM, Levy MN, Koeppen BM, Stanton BA. Physiology, Fourth edition, 1998).
www.intechopen.com

Brain Imaging and Machine Learning for Brain-Computer Interface 61
3. Feature Extraction
Several measurement procedures have been used in modern BCI. As stated earlier, they can be divided into two categories. Non invasive procedures include Electroencephalography (EEG), Magnetoencephalography (MEG), functional magnetic resonance imaging (fMRI), positron emission tomography (PET) and near infrared spectroscopy (NIRS). Electrocorticography (ECoG), a method in which signals are recorded using intracranial electrodes, is used as an invasive procedure to collect signals.
3.1 Spike Signals The brain has a fascinating design consisting of a huge number of neurons that operate in parallel and a distributed memory system formed of synapses. There are over 100 trillions of synapses in the cerebral cortex. Each neuron is assumed to produce a unique and consistent spike waveform which is difficult to detect. The duration of a spike is on average 1 millisecond and its peak-to-peak voltage is from 100 to 400 V. The spikes cannot be used directly by the detection part of a BCI system. State of the art invasive BCI systems, start by sorting the spike trains (Shenoy et al., 2006). The distribution of specific spike signals can be used in order to detect the desired movement or intention.
3.2 Non-Invasive Signals Non-invasive exploration of human brain functions has always been a central topic in biomedical research. This is not only motivated by the high risk of invasive implantation surgery but also because macroscopic information has inherent value due to the information it provides on the motor command. Before any movement occurs, motor commands carried by descending motor pathways must first be organized in the brain. The target of the movement is identified by pooling sensory information in the posterior parietal cerebral cortex (Jakson et al., 1999). This information is then transmitted to the supplementary motor and premotor areas where a motor plan is developed. The plan includes information about the specific muscles that need to be contracted, the strength of contraction, and sequence of contraction. The motor plan is implemented by commands transmitted from the primary motor cortex through the descending pathways. Successful execution of these motor commands, however, depends on feedback provided to the motor cortex through the ascending pathways to the somatosensory cortex as well as through the visual pathway. One should also add that during both the planning and execution stages of a movement, motor processing is also provided by 2 major control systems, the cerebellum and basal ganglia (Figures 2 and 3). In order to monitor the spatio-temporal evolution of the cortical activity within the human brain, several methods make use of the electric potential and/or magnetic fields associated with the intracellular current that flows within the active pyramidal cells of the cortex. Surface electrodes can record electrical potential differences from a scalp surface leading to what is called electroencephalography (EEG). Magnetoencephalography (MEG) makes use of a superconducting quantum interference device (SQUID) magnetometer in order to record the weak magnetic fields outside the head surface (Knuutila et al 1993). Moreover, one goal in electric and magnetic recordings is to form an image of the electrical sources distributed across the cortex (Mosher et al., 1992) (Dale & Sereno, 1993).
Fig. 2. Cortical projections involving the motor areas. (From (Berne RM, Levy MN, Koeppen BM, Stanton BA. Physiology, Fourth edition, 1998).
Fig. 3. Flow diagram showing the sequence of activity in the voluntary motor and somatosensory feedback pathways. (From Berne RM, Levy MN, Koeppen BM, Stanton BA. Physiology, Fourth edition, 1998).
www.intechopen.com

Biomedical Imaging62
3.2.1 Electroencephalography The EEG is a recording of the rhythmic electrical activity that can be made from the cerebral cortex via electrodes placed on the surface of the skull. In clinical neurology, EEG is recorded from a grid of standard recording sites. EEG is recorded as a potential difference between a signal or active electrode (electrode that records the activity at the site of interest on the surface of the skull) and a reference or indifferent electrode (e.g. electrode placed at the ear lobe) (Westbrook, 2000). A conductive paste will be used to decrease contact impedance and electrode migration (Westbrook, 2000). Different EEG standard exist and mainly differ in the position of the electrodes on the skull. In the international 10-20 system EEG signals are recorded from a 59 electrodes placed on the skull as shown in Fig. 4 (Sajda et al., 2003). The signals are usually referenced to the left mastoid.
Fig. 4. The International 10-20 electrodes placement system (From Jasper HH. The ten-twenty electrode system of the international federation. In: Internal Federation of Societies for Electroencephalography and Clinical Neurophysiology. Recommendations for the practice of clinical electroencephalography. Elsevier, 1983: 3-10). EEG patterns are characterized by the frequency and amplitude of the electrical activity (Westbrook, 2000). The normal human EEG shows activity over the range of 1-30 Hz with amplitudes in the range of 20-100 V. The observed frequencies have been divided into several groups:
Alpha (8-13Hz): Alpha waves of moderate amplitude are typical of relaxed wakefulness and are most prominent over the parietal and occipital sites.
Beta (13-30 Hz): Lower amplitude beta activity is more prominent in frontal areas and over other regions during intense mental activity. They are associated with an
alert state of mind and can reach frequencies near 50 hertz during intense mental activity.
Delta (0.5-4 Hz): Delta waves are normal during drowsiness and early slow-wave sleep
Theta (4-7 Hz): Theta waves arise from emotional stress, especially frustration or disappointment.
Mu (8-12 Hz): Mu waves are linked to cortical motor activity and have been associated with beta activity. Mu waves diminish with movement or the intention to move. They occupy the same frequency band as Alpha waves.
Gamma (26-40 Hz): Gamma waves are considered to reflect the mechanism of consciousness.
These waves, especially Mu and Beta, have been used as features in several BCI systems. An example of EEG waves is provided in Fig. 5.
Fig. 5. EEG in a normal resting awake human. The recordings were made from eight channels at the same time. The electrode positions are indicated. (From Berne RM, Levy MN, Koeppen BM, Stanton BA. Physiology, Fourth edition, 1998). The importance of the EEG resides in its ability to describe the activity on the cortex surface. Therefore, several techniques of brain imaging proposed the use of EEG in order to provide a full image of the electrical activity on the surface of the cortex. Based on the EEG signals, different sets of features can be derived. Classical features used in different BCI systems are first briefly described. Brain Imaging based features are then provided in detail.
3.2.2 EEG-Based Classical Features Several features have been classically derived from the EEG data and used by the decoding algorithm (Hammon & de Sa, 2007). The key idea is to derive some relevant and robust
www.intechopen.com

Brain Imaging and Machine Learning for Brain-Computer Interface 63
3.2.1 Electroencephalography The EEG is a recording of the rhythmic electrical activity that can be made from the cerebral cortex via electrodes placed on the surface of the skull. In clinical neurology, EEG is recorded from a grid of standard recording sites. EEG is recorded as a potential difference between a signal or active electrode (electrode that records the activity at the site of interest on the surface of the skull) and a reference or indifferent electrode (e.g. electrode placed at the ear lobe) (Westbrook, 2000). A conductive paste will be used to decrease contact impedance and electrode migration (Westbrook, 2000). Different EEG standard exist and mainly differ in the position of the electrodes on the skull. In the international 10-20 system EEG signals are recorded from a 59 electrodes placed on the skull as shown in Fig. 4 (Sajda et al., 2003). The signals are usually referenced to the left mastoid.
Fig. 4. The International 10-20 electrodes placement system (From Jasper HH. The ten-twenty electrode system of the international federation. In: Internal Federation of Societies for Electroencephalography and Clinical Neurophysiology. Recommendations for the practice of clinical electroencephalography. Elsevier, 1983: 3-10). EEG patterns are characterized by the frequency and amplitude of the electrical activity (Westbrook, 2000). The normal human EEG shows activity over the range of 1-30 Hz with amplitudes in the range of 20-100 V. The observed frequencies have been divided into several groups:
Alpha (8-13Hz): Alpha waves of moderate amplitude are typical of relaxed wakefulness and are most prominent over the parietal and occipital sites.
Beta (13-30 Hz): Lower amplitude beta activity is more prominent in frontal areas and over other regions during intense mental activity. They are associated with an
alert state of mind and can reach frequencies near 50 hertz during intense mental activity.
Delta (0.5-4 Hz): Delta waves are normal during drowsiness and early slow-wave sleep
Theta (4-7 Hz): Theta waves arise from emotional stress, especially frustration or disappointment.
Mu (8-12 Hz): Mu waves are linked to cortical motor activity and have been associated with beta activity. Mu waves diminish with movement or the intention to move. They occupy the same frequency band as Alpha waves.
Gamma (26-40 Hz): Gamma waves are considered to reflect the mechanism of consciousness.
These waves, especially Mu and Beta, have been used as features in several BCI systems. An example of EEG waves is provided in Fig. 5.
Fig. 5. EEG in a normal resting awake human. The recordings were made from eight channels at the same time. The electrode positions are indicated. (From Berne RM, Levy MN, Koeppen BM, Stanton BA. Physiology, Fourth edition, 1998). The importance of the EEG resides in its ability to describe the activity on the cortex surface. Therefore, several techniques of brain imaging proposed the use of EEG in order to provide a full image of the electrical activity on the surface of the cortex. Based on the EEG signals, different sets of features can be derived. Classical features used in different BCI systems are first briefly described. Brain Imaging based features are then provided in detail.
3.2.2 EEG-Based Classical Features Several features have been classically derived from the EEG data and used by the decoding algorithm (Hammon & de Sa, 2007). The key idea is to derive some relevant and robust
www.intechopen.com

Biomedical Imaging64
features from the EEG signals that would reliably represent the task to be detected. Time and frequency analysis of the EEG signals are used to derive such features. EEG patterns frequency based features The patterns described above, i.e. delta, theta, alpha/mu, beta and gamma (26-40Hz), may be used as features. Classical filters or Fast Fourier Transform permit to compute those patterns and their corresponding energies in the analysis window. Those energies define the feature vector that is used at the input of the decoding process. Advanced techniques make use of filter banks in order to determine the energies of the above patterns. Wavelet transform features Wavelet transform permits to apply an adequate filter bank on signals. Compared to classical filter banks, wavelet transform offer a more precise analysis since the time window is selected depending on the analysis frequency band leading to a more precise analysis. Several types of wavelets, Symlet, Daubechies and Coiflet, (Darvishi & Al Ani, 2007) (Xu et al. 2007) (Hammon et al., 2008) have been successfully used in state of the art BCI systems. Autoregressive models features Autoregressive (AR) modeling has been used successfully in several domains. A p-order AR model consists in predicting the current sample of the signal from a linear combination of the previous p samples. This leads to an all-pole model in the z-transform domain and the corresponding parametric spectrum can be determined. Estimating the linear combination coefficient in the model is generally done in order to minimize the prediction error following the minimum mean square error criterion. Several efficient algorithms are available to solve this estimation problem (Kay 1999). In BCI, both simple autoregressive (Hammon & de Sa, 2007) and multivariate autoregressive (Anderson et al., 1998) models have been experimented with satisfactory results. Independent Component Analysis features Principal component analysis (PCA) has been used with success to extract independent components from multi-electrode EEG signals (Lagerlund et al., 1997). Independent component analysis (ICA) has been proposed as an improvement of the PCA (Hyvarinen & Oja, 2000) (Vorobyov & Cichoki, 2002). Kohonen LVQs have been also used for this purpose (Pregenzer & Pfurtscheller, 1999).
3.2.3 EEG-Based Brain Imaging Features As stated earlier EEG is particularly useful in BCI, because EEG has a short time constant and is a relatively simple, inexpensive, and noninvasive procedure. Although EEG frequency bands give a general description of brain activity, EEG signals provide additional information to estimate electrical activity at the cortical surface. Several approaches have been proposed and successfully experimented to visualize the electrical activity at the cortex surface. This is part of the brain imaging field. Brain imaging is often used by practitioners in order to detect diseases. As discussed previously, the electrical activity on the cortex surface also reflects the movement to be executed. Therefore, it has been proposed (Khachab et al., 2007) to use brain imaging techniques in order to extract reliable features for the decoding process of a BCI
system. The underlying idea is to consider a grid representing the cortical surface and compute the electrical activity in every point of this grid. This provides relevant features for the BCI system. Several approaches for source imaging exist (Jung et al., 2001) (Gavit et al., 2001) (Rajapakse & Piyaratna, 2001) (Michel et al., 2004). While they may be all experimented in the case of BCI, the MUSIC-like brain imaging techniques (Mosher & Leahy, 1998, 1999) have been selected for their robustness. This approach is briefly represented here. Consider a current dipole located at a position r on the cortical surface and with a moment vectorq . This dipole creates (Sajda et al., 2003) a voltage potential v at the sensor position
s such as:
qrsgv ).,( (1)
where (.)g is the lead vector. Assume p the current dipole sources. The voltage for n time instances is recorded simultaneously at m sensors. The spatio-temporal data matrix can be written as:
)()(
)()(.
),(),(
),(),(
)()(
)()(
1
111
1
111
1
111
npp
n
pmT
mT
pTT
nmm
n
tqtq
tqtq
rsgrsg
rsgrsg
tvtv
tvtv
(2a)
or equivalently, TTp QGQrGrGV ..)()( 1
(2b)
where G(ri) represents the matrix of raw lead vectors associating the ith source dipole and the m sensors, and where Q is the matrix whose jth column represents the time series of the moment of the jth dipole source. Brain imaging or localization of current sources on the cortical surface can be seen as the solution to Eq. 2 where the current sources positions and moments are unknown (Mosher & Leahy, 1999). This is obviously a nonlinear problem with no direct solution. The complexity is increased by the fact that the measured voltage at the sensors includes some measurement noise. Including measurement noise, Eq. 2 becomes:
EQGV T . (3)
where E designates the measurement noise matrix. The measurement noise is supposed to be zero-mean and white and not correlated with the useful signals, i.e. the Ree = e2.I is a diagonal autocorrelation matrix. Moreover, the orientations of the moments of the current sources are assumed to be time-invariant. Let us consider the autocorrelation function of the voltage measurement, it can be estimated using:
IGQQGn
VVn
R eTTT
V....1.1 2
(4)
Applying singular value decomposition leads to:
InR eSSV2
(5)
www.intechopen.com

Brain Imaging and Machine Learning for Brain-Computer Interface 65
features from the EEG signals that would reliably represent the task to be detected. Time and frequency analysis of the EEG signals are used to derive such features. EEG patterns frequency based features The patterns described above, i.e. delta, theta, alpha/mu, beta and gamma (26-40Hz), may be used as features. Classical filters or Fast Fourier Transform permit to compute those patterns and their corresponding energies in the analysis window. Those energies define the feature vector that is used at the input of the decoding process. Advanced techniques make use of filter banks in order to determine the energies of the above patterns. Wavelet transform features Wavelet transform permits to apply an adequate filter bank on signals. Compared to classical filter banks, wavelet transform offer a more precise analysis since the time window is selected depending on the analysis frequency band leading to a more precise analysis. Several types of wavelets, Symlet, Daubechies and Coiflet, (Darvishi & Al Ani, 2007) (Xu et al. 2007) (Hammon et al., 2008) have been successfully used in state of the art BCI systems. Autoregressive models features Autoregressive (AR) modeling has been used successfully in several domains. A p-order AR model consists in predicting the current sample of the signal from a linear combination of the previous p samples. This leads to an all-pole model in the z-transform domain and the corresponding parametric spectrum can be determined. Estimating the linear combination coefficient in the model is generally done in order to minimize the prediction error following the minimum mean square error criterion. Several efficient algorithms are available to solve this estimation problem (Kay 1999). In BCI, both simple autoregressive (Hammon & de Sa, 2007) and multivariate autoregressive (Anderson et al., 1998) models have been experimented with satisfactory results. Independent Component Analysis features Principal component analysis (PCA) has been used with success to extract independent components from multi-electrode EEG signals (Lagerlund et al., 1997). Independent component analysis (ICA) has been proposed as an improvement of the PCA (Hyvarinen & Oja, 2000) (Vorobyov & Cichoki, 2002). Kohonen LVQs have been also used for this purpose (Pregenzer & Pfurtscheller, 1999).
3.2.3 EEG-Based Brain Imaging Features As stated earlier EEG is particularly useful in BCI, because EEG has a short time constant and is a relatively simple, inexpensive, and noninvasive procedure. Although EEG frequency bands give a general description of brain activity, EEG signals provide additional information to estimate electrical activity at the cortical surface. Several approaches have been proposed and successfully experimented to visualize the electrical activity at the cortex surface. This is part of the brain imaging field. Brain imaging is often used by practitioners in order to detect diseases. As discussed previously, the electrical activity on the cortex surface also reflects the movement to be executed. Therefore, it has been proposed (Khachab et al., 2007) to use brain imaging techniques in order to extract reliable features for the decoding process of a BCI
system. The underlying idea is to consider a grid representing the cortical surface and compute the electrical activity in every point of this grid. This provides relevant features for the BCI system. Several approaches for source imaging exist (Jung et al., 2001) (Gavit et al., 2001) (Rajapakse & Piyaratna, 2001) (Michel et al., 2004). While they may be all experimented in the case of BCI, the MUSIC-like brain imaging techniques (Mosher & Leahy, 1998, 1999) have been selected for their robustness. This approach is briefly represented here. Consider a current dipole located at a position r on the cortical surface and with a moment vectorq . This dipole creates (Sajda et al., 2003) a voltage potential v at the sensor position
s such as:
qrsgv ).,( (1)
where (.)g is the lead vector. Assume p the current dipole sources. The voltage for n time instances is recorded simultaneously at m sensors. The spatio-temporal data matrix can be written as:
)()(
)()(.
),(),(
),(),(
)()(
)()(
1
111
1
111
1
111
npp
n
pmT
mT
pTT
nmm
n
tqtq
tqtq
rsgrsg
rsgrsg
tvtv
tvtv
(2a)
or equivalently, TTp QGQrGrGV ..)()( 1
(2b)
where G(ri) represents the matrix of raw lead vectors associating the ith source dipole and the m sensors, and where Q is the matrix whose jth column represents the time series of the moment of the jth dipole source. Brain imaging or localization of current sources on the cortical surface can be seen as the solution to Eq. 2 where the current sources positions and moments are unknown (Mosher & Leahy, 1999). This is obviously a nonlinear problem with no direct solution. The complexity is increased by the fact that the measured voltage at the sensors includes some measurement noise. Including measurement noise, Eq. 2 becomes:
EQGV T . (3)
where E designates the measurement noise matrix. The measurement noise is supposed to be zero-mean and white and not correlated with the useful signals, i.e. the Ree = e2.I is a diagonal autocorrelation matrix. Moreover, the orientations of the moments of the current sources are assumed to be time-invariant. Let us consider the autocorrelation function of the voltage measurement, it can be estimated using:
IGQQGn
VVn
R eTTT
V....1.1 2
(4)
Applying singular value decomposition leads to:
InR eSSV2
(5)
www.intechopen.com

Biomedical Imaging66
where S corresponds to the first p eigenvectors. A least square estimation of the current sources consists in minimizing the cost function:
222 minminmin TT QGGVQGVE (6)
where G is the pseudo inverse of the gain matrix G .
Eq 6 is clearely non linear and would require high computational search in order to find a solution. The “MUltiple SIgnal Classification” (MUSIC) has been proposed in (Schmidt 1981) to reduce the complexity of this search. The MUSIC algorithm is briefly introduced hereafter in terms of subspace correlations. Given the rank of the Gain matrix p and the rank of the signal matrix Fs that is at least equal to p, the smallest subspace correlation value represents the minimum subspace correlation between principal vectors in the Gain matrix and the signal subspace matrix Fs. The subspace of any individual column gi with the signal subspace will exceed this smallest subspace correlation. While searching the parameters, if the minimum subspace correlation approaches unity, then all the subspace correlations approach unity. Thus, a search strategy of the parameter set consists in finding p peaks of the metric:
g
ggsubcorr
TSS
T ˆˆ2
(7)
The gain vectors g are considered for all points of a grid that represents the cortical surface. The point of the grid with the highest subcorrelation coefficient is selected and the algorithm may tries to have a fine detection of the dipole around this point or restart looking for the next dipole. However, and for the BCI system, the algorithm is stopped at the first stage and a feature vector is built including all the subspace correlations obtained in the different points of the grid. This vector is then used as input for the decoding process of the BCI system. The computation of the subspace correlation coefficients is performed on the points of a grid representing the cortical surface of the brain. Two grids have been studied: the first, a spherical grid defined to be 1 cm inside the skull; the second, a grid with no analytical form designed to follow, at 1cm distance, the skull. For the nonanalytic grid, the skull has been divided into layers on the z-axis. In every layer, the grid is defined as an ellipse that is 1cm distant from the skull position. For a few layers, skull points were lacking to precisely define the ellipse. In such cases points were borrowed from adjacent layers and a linear interpolation is performed to estimate the required skull point. The present study uses the MUSIC-like brain imaging techniques of signal subspace correlations and metrics to localize brain activity positions (Mosher & Leahy, 1999). Two pattern recognition algorithms have been tested as classifiers: the artificial neural network multilayer perceptron and the support vector machines. Experiments have been conducted on subject 1 of a reference database (NIPS 2001 Brain Computer Interface Workshop) (Sajda et al., 2003) .
4. Classifiers or Decoding Process
Several classifiers have been used in BCI systems. Two principal classifiers are presented here: Artificial neural network (ANN) and Support Vector Machines (SVM).
4.1 Artificial Neural Network (ANN) ANN, specifically the MultiLayer Perceptron (MLP), has been successfully used as a classifier in BCI systems. The units of computation in an ANN is called neuron, in reference to the human neuron it tries to simulate. These neurons are elementary machines that apply a nonlinear function, generally a sigmoid or a hyperbolic tangent, to a biased linear combination of its inputs. If xl, …, xl are the neuron input and y is its output, we can write:
bxafyl
kkk
1
(8)
where f( ) is the neuron function, b is the bias and {ak} are the linear combination weights representing the synapses connections. In the MLP structure, neurons are organized in layers. The neural units in a layer do not interact with each other. They take their inputs from the neurons of the preceding layer and provide their output to the neurons of the next layer. In other words, the outputs of neurons of layer i-1 excite the neurons of layer i. Therefore, MLP is completely defined by its structure and the connections weights. Once defined, the ANN parameters, the weights for each neuron, must be estimated. This is usually done according to a train set and using the gradient descent algorithm. In the train set, it is supposed available the inputs and desired outputs of the MLP for different experiments. The gradient descent will iteratively adjust the MLP parameters so as to have its output the closer to the desired output for the different experiments.
4.2 Support Vector Machines (SVM) SVM is a recent class of classification and/or regression techniques based on the statistical learning theory developed in (Vapnik, 1998). Starting from simple ideas on linear separable classes, the case of linear non-separable classes is studied. The separation of classes using linear separation functions is extended to the nonlinear case. By projecting the classification problem to a higher dimension space, high performance non-linear classification may be achieved. In the higher dimension space, linear separation functions are used while the passage to this space is done with a non-linear function. Kernel functions permit to implement this solution without needing the mapping function or the dimension of the higher space. More detail is provided in (Cristianini & Taylor, 2000). In (Khachab et al., 2007) several kernel functions have been used and compared.
5. Experiments
5.1 Database Experiments have been conducted on subject 1 of a reference database from the NIPS 2001 Brain Computer Interface Workshop (Sajda et al., 2003). The “EEG Synchronized Imagined Movement” database was considered. The task of the subjects was to synchronize an
www.intechopen.com

Brain Imaging and Machine Learning for Brain-Computer Interface 67
where S corresponds to the first p eigenvectors. A least square estimation of the current sources consists in minimizing the cost function:
222 minminmin TT QGGVQGVE (6)
where G is the pseudo inverse of the gain matrix G .
Eq 6 is clearely non linear and would require high computational search in order to find a solution. The “MUltiple SIgnal Classification” (MUSIC) has been proposed in (Schmidt 1981) to reduce the complexity of this search. The MUSIC algorithm is briefly introduced hereafter in terms of subspace correlations. Given the rank of the Gain matrix p and the rank of the signal matrix Fs that is at least equal to p, the smallest subspace correlation value represents the minimum subspace correlation between principal vectors in the Gain matrix and the signal subspace matrix Fs. The subspace of any individual column gi with the signal subspace will exceed this smallest subspace correlation. While searching the parameters, if the minimum subspace correlation approaches unity, then all the subspace correlations approach unity. Thus, a search strategy of the parameter set consists in finding p peaks of the metric:
g
ggsubcorr
TSS
T ˆˆ2
(7)
The gain vectors g are considered for all points of a grid that represents the cortical surface. The point of the grid with the highest subcorrelation coefficient is selected and the algorithm may tries to have a fine detection of the dipole around this point or restart looking for the next dipole. However, and for the BCI system, the algorithm is stopped at the first stage and a feature vector is built including all the subspace correlations obtained in the different points of the grid. This vector is then used as input for the decoding process of the BCI system. The computation of the subspace correlation coefficients is performed on the points of a grid representing the cortical surface of the brain. Two grids have been studied: the first, a spherical grid defined to be 1 cm inside the skull; the second, a grid with no analytical form designed to follow, at 1cm distance, the skull. For the nonanalytic grid, the skull has been divided into layers on the z-axis. In every layer, the grid is defined as an ellipse that is 1cm distant from the skull position. For a few layers, skull points were lacking to precisely define the ellipse. In such cases points were borrowed from adjacent layers and a linear interpolation is performed to estimate the required skull point. The present study uses the MUSIC-like brain imaging techniques of signal subspace correlations and metrics to localize brain activity positions (Mosher & Leahy, 1999). Two pattern recognition algorithms have been tested as classifiers: the artificial neural network multilayer perceptron and the support vector machines. Experiments have been conducted on subject 1 of a reference database (NIPS 2001 Brain Computer Interface Workshop) (Sajda et al., 2003) .
4. Classifiers or Decoding Process
Several classifiers have been used in BCI systems. Two principal classifiers are presented here: Artificial neural network (ANN) and Support Vector Machines (SVM).
4.1 Artificial Neural Network (ANN) ANN, specifically the MultiLayer Perceptron (MLP), has been successfully used as a classifier in BCI systems. The units of computation in an ANN is called neuron, in reference to the human neuron it tries to simulate. These neurons are elementary machines that apply a nonlinear function, generally a sigmoid or a hyperbolic tangent, to a biased linear combination of its inputs. If xl, …, xl are the neuron input and y is its output, we can write:
bxafyl
kkk
1
(8)
where f( ) is the neuron function, b is the bias and {ak} are the linear combination weights representing the synapses connections. In the MLP structure, neurons are organized in layers. The neural units in a layer do not interact with each other. They take their inputs from the neurons of the preceding layer and provide their output to the neurons of the next layer. In other words, the outputs of neurons of layer i-1 excite the neurons of layer i. Therefore, MLP is completely defined by its structure and the connections weights. Once defined, the ANN parameters, the weights for each neuron, must be estimated. This is usually done according to a train set and using the gradient descent algorithm. In the train set, it is supposed available the inputs and desired outputs of the MLP for different experiments. The gradient descent will iteratively adjust the MLP parameters so as to have its output the closer to the desired output for the different experiments.
4.2 Support Vector Machines (SVM) SVM is a recent class of classification and/or regression techniques based on the statistical learning theory developed in (Vapnik, 1998). Starting from simple ideas on linear separable classes, the case of linear non-separable classes is studied. The separation of classes using linear separation functions is extended to the nonlinear case. By projecting the classification problem to a higher dimension space, high performance non-linear classification may be achieved. In the higher dimension space, linear separation functions are used while the passage to this space is done with a non-linear function. Kernel functions permit to implement this solution without needing the mapping function or the dimension of the higher space. More detail is provided in (Cristianini & Taylor, 2000). In (Khachab et al., 2007) several kernel functions have been used and compared.
5. Experiments
5.1 Database Experiments have been conducted on subject 1 of a reference database from the NIPS 2001 Brain Computer Interface Workshop (Sajda et al., 2003). The “EEG Synchronized Imagined Movement” database was considered. The task of the subjects was to synchronize an
www.intechopen.com

Biomedical Imaging68
indicated response with a highly predictable timed cue. Subjects were trained until their responses were within 100 ms of the synchronization signal. Eight classes of trials (explicit or imagined for left/right/both/neither) were randomly performed within a 7 minute 12 seconds block. Each block is formed of 72 trials. A trial succession of events is shown in Fig. 6. The EEG was recorded from 59 electrodes placed on a site corresponding to the International 10-20 system and referenced to the left mastoid. In a preprocessing stage, artifacts were filtered out from the EEG signals (Ebrahimi et al., 2003), and signals were sampled at 100 Hz.
One trial – 6 seconds
2 seconds
500 ms
1 second
1 second
950 ms
250ms
50ms
Trial Event
Blank Screen
Fixation
Explicit/Imagined
Fixation
Left/Right/Both/Neither
Fixation
X
Fixation
Fig. 6. Illustration of one trial recording (reproduced from http://liinc.bme.columbia.edu/EEG_DATA/EEGdescription.htm).
5.2 Experimental Setup In order to test the BCI system, we have considered two segments from each period: A segment of 2 seconds corresponding to the blank screen, and a segment corresponding to the thinking of a movement. Only subject 1 was used in our experiments, for whom sensors coordinates (skull) were available. Ninety periods were available for this subject in the database. These were divided into 60 periods for training and 30 periods for testing. The cortical surface geometrical information was not available, however. Thus, two models have been defined for the grid. First, the spherical grid of a radius approximately equal to half of the distance between T7 and T8 of the International 10-20 system was used to represent the cortical surface. This sphere defined the grid that contains 100 points. Second, the non analytic grid defined in section 3.1 leading to approximately 120 points.
5.3 Brain Imaging Using MUSIC Because the BCI system is based upon the calculation of neural activity on the cortical surface of the brain, it would be interesting to measure the ability of the MUSIC algorithm to detect this activity. Fig. 7 and Fig. 8 illustrate the subcorrelation coefficients for the 120 points of the non parametric grid in left action and right action. The figures also show the placement of the skull sensors (International 10-20 system). Figures were obtained using the MAP3D software. It is clear that electrical activity occurs in the same part of the cortical surface with deviation depending on the direction of the actions.
Fig. 7. Subcorrelation coefficients for left action.
Fig. 8. Subcorrelation coefficients for right action.
5.4 MLP-Based Classifier The first set of experiments aimed to optimize the classifier complexity, the number of cells in the hidden layer of the ANN. The analysis window on which the MUSIC algorithm is applied had a duration of 640 ms. It was assumed that the space dimension (number of dipoles) is equal to 10. The spherical grid was used in these experiments. The optimal number of hidden cells was found to be 15. One critical issue in the subspace correlation method is the dimension of the space, i.e. to determine the number of dipoles. Experiments have been conducted varying this number. Fig. 9 shows that the optimal dimension ranged between 10 and 15.
www.intechopen.com

Brain Imaging and Machine Learning for Brain-Computer Interface 69
indicated response with a highly predictable timed cue. Subjects were trained until their responses were within 100 ms of the synchronization signal. Eight classes of trials (explicit or imagined for left/right/both/neither) were randomly performed within a 7 minute 12 seconds block. Each block is formed of 72 trials. A trial succession of events is shown in Fig. 6. The EEG was recorded from 59 electrodes placed on a site corresponding to the International 10-20 system and referenced to the left mastoid. In a preprocessing stage, artifacts were filtered out from the EEG signals (Ebrahimi et al., 2003), and signals were sampled at 100 Hz.
One trial – 6 seconds
2 seconds
500 ms
1 second
1 second
950 ms
250ms
50ms
Trial Event
Blank Screen
Fixation
Explicit/Imagined
Fixation
Left/Right/Both/Neither
Fixation
X
Fixation
Fig. 6. Illustration of one trial recording (reproduced from http://liinc.bme.columbia.edu/EEG_DATA/EEGdescription.htm).
5.2 Experimental Setup In order to test the BCI system, we have considered two segments from each period: A segment of 2 seconds corresponding to the blank screen, and a segment corresponding to the thinking of a movement. Only subject 1 was used in our experiments, for whom sensors coordinates (skull) were available. Ninety periods were available for this subject in the database. These were divided into 60 periods for training and 30 periods for testing. The cortical surface geometrical information was not available, however. Thus, two models have been defined for the grid. First, the spherical grid of a radius approximately equal to half of the distance between T7 and T8 of the International 10-20 system was used to represent the cortical surface. This sphere defined the grid that contains 100 points. Second, the non analytic grid defined in section 3.1 leading to approximately 120 points.
5.3 Brain Imaging Using MUSIC Because the BCI system is based upon the calculation of neural activity on the cortical surface of the brain, it would be interesting to measure the ability of the MUSIC algorithm to detect this activity. Fig. 7 and Fig. 8 illustrate the subcorrelation coefficients for the 120 points of the non parametric grid in left action and right action. The figures also show the placement of the skull sensors (International 10-20 system). Figures were obtained using the MAP3D software. It is clear that electrical activity occurs in the same part of the cortical surface with deviation depending on the direction of the actions.
Fig. 7. Subcorrelation coefficients for left action.
Fig. 8. Subcorrelation coefficients for right action.
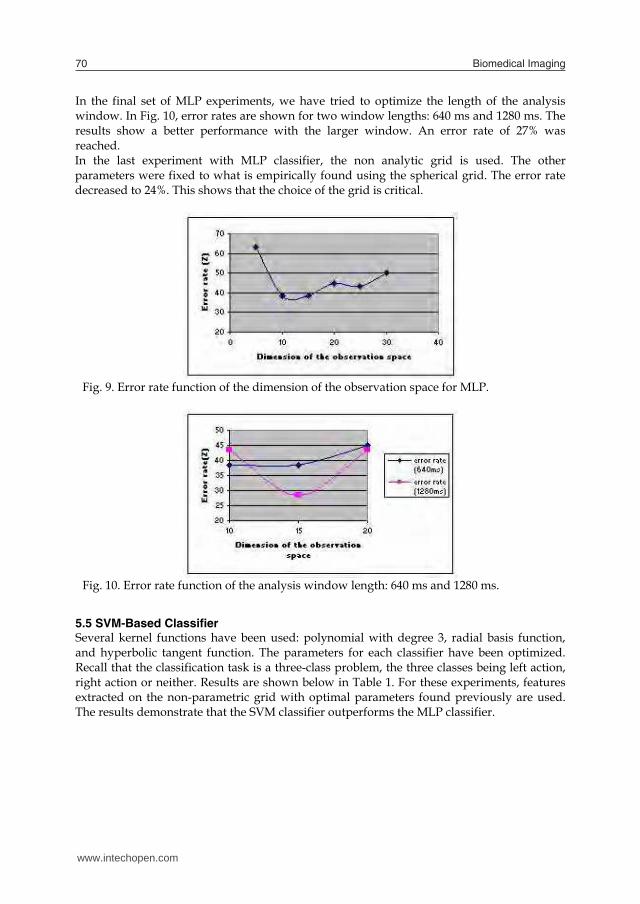
5.4 MLP-Based Classifier The first set of experiments aimed to optimize the classifier complexity, the number of cells in the hidden layer of the ANN. The analysis window on which the MUSIC algorithm is applied had a duration of 640 ms. It was assumed that the space dimension (number of dipoles) is equal to 10. The spherical grid was used in these experiments. The optimal number of hidden cells was found to be 15. One critical issue in the subspace correlation method is the dimension of the space, i.e. to determine the number of dipoles. Experiments have been conducted varying this number. Fig. 9 shows that the optimal dimension ranged between 10 and 15.
www.intechopen.com
Biomedical Imaging70
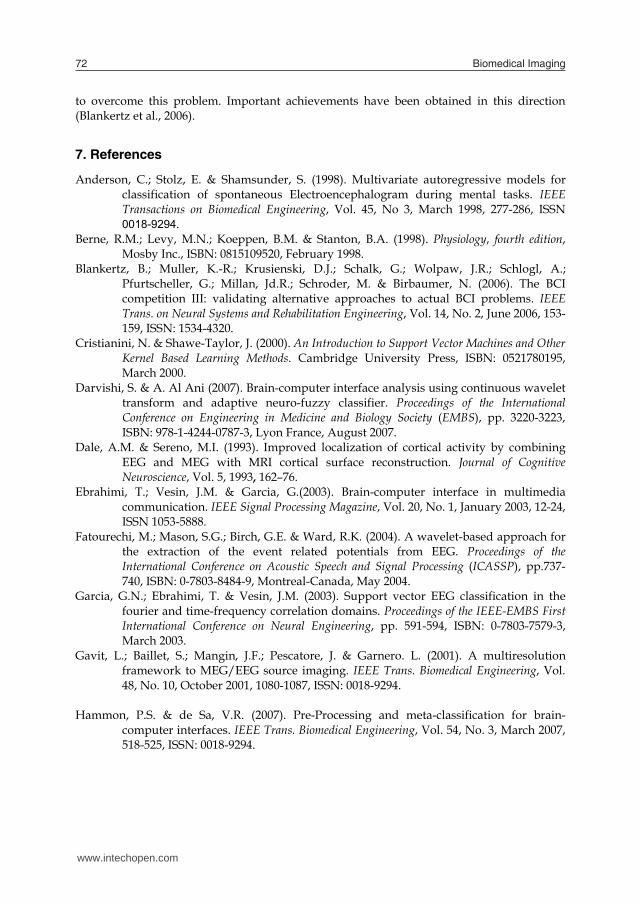
In the final set of MLP experiments, we have tried to optimize the length of the analysis window. In Fig. 10, error rates are shown for two window lengths: 640 ms and 1280 ms. The results show a better performance with the larger window. An error rate of 27% was reached. In the last experiment with MLP classifier, the non analytic grid is used. The other parameters were fixed to what is empirically found using the spherical grid. The error rate decreased to 24%. This shows that the choice of the grid is critical.
Fig. 9. Error rate function of the dimension of the observation space for MLP.
Fig. 10. Error rate function of the analysis window length: 640 ms and 1280 ms.
5.5 SVM-Based Classifier Several kernel functions have been used: polynomial with degree 3, radial basis function, and hyperbolic tangent function. The parameters for each classifier have been optimized. Recall that the classification task is a three-class problem, the three classes being left action, right action or neither. Results are shown below in Table 1. For these experiments, features extracted on the non-parametric grid with optimal parameters found previously are used. The results demonstrate that the SVM classifier outperforms the MLP classifier.
Classifier Error rate (%) Artificial Neural Network MLP 24 % SVM Polynomial Kernel 17 % SVM Radial Basis Kernel 16.7 % SVM Hyperbolic Tangent Kernel 20 %
Table 1. Error rates obtained with SVM classifiers compared to MLP. In order to quantify the ability of the system to distinguish between “action” and “no action” events and between “left action” and “right action” events, experiments with a two classes-classification have been conducted. The results shown in Table 2 demonstrate that it is much easier to distinguish between “action” and “no action” classes than to determine which action has been thought. The Radial basis Kernel seems to provide the best results. These results outperform the best result obtained in (Sajda 2003), i.e. 24%.
Error rate (%) Classifier action/no action left/right SVM Polynomial Kernel 4% 23 % SVM Radial Basis Kernel 4% 16.7 % SVM Hyperbolic Tangent Kernel 4% 27 %
Table 2. SVM classification performance in a two classes- classification problems.
6. Conclusions
Brain computer interfaces have gained large interest in the last decade. Two classes of approaches are distinguished: invasive and non-invasive. While invasive approaches require the implantation of sensors in a high risk surgery, non-invasive approaches rely on advanced signal processing and pattern recognition algorithms. Those algorithms are divided into two stages: a feature extraction stage and decoding/classification stage. Classical feature extraction algorithms try to explore the time-frequency characteristics of the EEG signals (Wavelet, Filter banks) or to statistically analyze the EEG signals (PCA, ICA) in order to reduce relevant features that would help to decode the intended action. An approach proposed by (Khachab et al., 2007) consists of using a brain imaging algorithm to deduce the electrical activity on a grid defined on the cortical surface. These activations are considered to form a feature vector. Several decoding/classification algorithms have been proposed in the literature. They take at their input the feature vectors and, based on those inputs, identify the intended action. Several machine learning algorithms have been used for this purpose. The chapter has briefly described the Artificial Neural Networks (ANN) and the Support Vector Machines (SVM). The results obtained with a BCI system that we have developed on a reference database have shown that the use of brain imaging permits to improve the performance of the BCI. They also show that SVM classifier outperforms the ANN in all the experiments conducted. Finally, one should notice that both the human control system (Fig. 3) and the BCI system (Fig. 1) include a feedback mechanism. However, the feedback mechanism in the BCI replaces somehow the human integrated one. This is due to the slow rate of information that can be processed by the BCI. Recent development tries to bypass the trial structure in order
www.intechopen.com

Brain Imaging and Machine Learning for Brain-Computer Interface 71
In the final set of MLP experiments, we have tried to optimize the length of the analysis window. In Fig. 10, error rates are shown for two window lengths: 640 ms and 1280 ms. The results show a better performance with the larger window. An error rate of 27% was reached. In the last experiment with MLP classifier, the non analytic grid is used. The other parameters were fixed to what is empirically found using the spherical grid. The error rate decreased to 24%. This shows that the choice of the grid is critical.
Fig. 9. Error rate function of the dimension of the observation space for MLP.
Fig. 10. Error rate function of the analysis window length: 640 ms and 1280 ms.
5.5 SVM-Based Classifier Several kernel functions have been used: polynomial with degree 3, radial basis function, and hyperbolic tangent function. The parameters for each classifier have been optimized. Recall that the classification task is a three-class problem, the three classes being left action, right action or neither. Results are shown below in Table 1. For these experiments, features extracted on the non-parametric grid with optimal parameters found previously are used. The results demonstrate that the SVM classifier outperforms the MLP classifier.
Classifier Error rate (%) Artificial Neural Network MLP 24 % SVM Polynomial Kernel 17 % SVM Radial Basis Kernel 16.7 % SVM Hyperbolic Tangent Kernel 20 %
Table 1. Error rates obtained with SVM classifiers compared to MLP. In order to quantify the ability of the system to distinguish between “action” and “no action” events and between “left action” and “right action” events, experiments with a two classes-classification have been conducted. The results shown in Table 2 demonstrate that it is much easier to distinguish between “action” and “no action” classes than to determine which action has been thought. The Radial basis Kernel seems to provide the best results. These results outperform the best result obtained in (Sajda 2003), i.e. 24%.
Error rate (%) Classifier action/no action left/right SVM Polynomial Kernel 4% 23 % SVM Radial Basis Kernel 4% 16.7 % SVM Hyperbolic Tangent Kernel 4% 27 %
Table 2. SVM classification performance in a two classes- classification problems.
6. Conclusions
Brain computer interfaces have gained large interest in the last decade. Two classes of approaches are distinguished: invasive and non-invasive. While invasive approaches require the implantation of sensors in a high risk surgery, non-invasive approaches rely on advanced signal processing and pattern recognition algorithms. Those algorithms are divided into two stages: a feature extraction stage and decoding/classification stage. Classical feature extraction algorithms try to explore the time-frequency characteristics of the EEG signals (Wavelet, Filter banks) or to statistically analyze the EEG signals (PCA, ICA) in order to reduce relevant features that would help to decode the intended action. An approach proposed by (Khachab et al., 2007) consists of using a brain imaging algorithm to deduce the electrical activity on a grid defined on the cortical surface. These activations are considered to form a feature vector. Several decoding/classification algorithms have been proposed in the literature. They take at their input the feature vectors and, based on those inputs, identify the intended action. Several machine learning algorithms have been used for this purpose. The chapter has briefly described the Artificial Neural Networks (ANN) and the Support Vector Machines (SVM). The results obtained with a BCI system that we have developed on a reference database have shown that the use of brain imaging permits to improve the performance of the BCI. They also show that SVM classifier outperforms the ANN in all the experiments conducted. Finally, one should notice that both the human control system (Fig. 3) and the BCI system (Fig. 1) include a feedback mechanism. However, the feedback mechanism in the BCI replaces somehow the human integrated one. This is due to the slow rate of information that can be processed by the BCI. Recent development tries to bypass the trial structure in order
www.intechopen.com
Biomedical Imaging72
to overcome this problem. Important achievements have been obtained in this direction (Blankertz et al., 2006).
7. References
Anderson, C.; Stolz, E. & Shamsunder, S. (1998). Multivariate autoregressive models for classification of spontaneous Electroencephalogram during mental tasks. IEEE Transactions on Biomedical Engineering, Vol. 45, No 3, March 1998, 277-286, ISSN 0018-9294.
Berne, R.M.; Levy, M.N.; Koeppen, B.M. & Stanton, B.A. (1998). Physiology, fourth edition, Mosby Inc., ISBN: 0815109520, February 1998.
Blankertz, B.; Muller, K.-R.; Krusienski, D.J.; Schalk, G.; Wolpaw, J.R.; Schlogl, A.; Pfurtscheller, G.; Millan, Jd.R.; Schroder, M. & Birbaumer, N. (2006). The BCI competition III: validating alternative approaches to actual BCI problems. IEEE Trans. on Neural Systems and Rehabilitation Engineering, Vol. 14, No. 2, June 2006, 153-159, ISSN: 1534-4320.
Cristianini, N. & Shawe-Taylor, J. (2000). An Introduction to Support Vector Machines and Other Kernel Based Learning Methods. Cambridge University Press, ISBN: 0521780195, March 2000.
Darvishi, S. & A. Al Ani (2007). Brain-computer interface analysis using continuous wavelet transform and adaptive neuro-fuzzy classifier. Proceedings of the International Conference on Engineering in Medicine and Biology Society (EMBS), pp. 3220-3223, ISBN: 978-1-4244-0787-3, Lyon France, August 2007.
Dale, A.M. & Sereno, M.I. (1993). Improved localization of cortical activity by combining EEG and MEG with MRI cortical surface reconstruction. Journal of Cognitive Neuroscience, Vol. 5, 1993, 162–76.
Ebrahimi, T.; Vesin, J.M. & Garcia, G.(2003). Brain-computer interface in multimedia communication. IEEE Signal Processing Magazine, Vol. 20, No. 1, January 2003, 12-24, ISSN 1053-5888.
Fatourechi, M.; Mason, S.G.; Birch, G.E. & Ward, R.K. (2004). A wavelet-based approach for the extraction of the event related potentials from EEG. Proceedings of the International Conference on Acoustic Speech and Signal Processing (ICASSP), pp.737-740, ISBN: 0-7803-8484-9, Montreal-Canada, May 2004.
Garcia, G.N.; Ebrahimi, T. & Vesin, J.M. (2003). Support vector EEG classification in the fourier and time-frequency correlation domains. Proceedings of the IEEE-EMBS First International Conference on Neural Engineering, pp. 591-594, ISBN: 0-7803-7579-3, March 2003.
Gavit, L.; Baillet, S.; Mangin, J.F.; Pescatore, J. & Garnero. L. (2001). A multiresolution framework to MEG/EEG source imaging. IEEE Trans. Biomedical Engineering, Vol. 48, No. 10, October 2001, 1080-1087, ISSN: 0018-9294.
Hammon, P.S. & de Sa, V.R. (2007). Pre-Processing and meta-classification for brain-
computer interfaces. IEEE Trans. Biomedical Engineering, Vol. 54, No. 3, March 2007, 518-525, ISSN: 0018-9294.
Hammon, P.S.; Makeig, S.; Poizner, H.; Todorov, E. & de Sa, V.R. (2008). Predicting reaching target from human EEG. IEEE Signal Processing Magazine, Vol. 25, No. 1, 2008, 69-77, ISSN: 1053-5888.
Hyvarinen, A. & Oja, E. (2000). Independent component analysis: Algorithms and applications. Neural Networks, Vol. 13, No. 4-5, 2000, 411-430, ISSN: 0893-6080.
Jakson, S.R.; Jakson, G.M. & Roberts, M. (1999). The selection and suppression of action: ERP correlates of executive control in humans. Neuroreport, Vol. 10, No. 4, 1999, 861-865, ISSN 0959-4965.
Jasper, H.H. The ten-twenty electrode system of the international federation. In: Internal Federation of Societies for Electroencephalography and Clinical Neurophysiology. Recommendations for the practice of clinical electroencephalography. Elsevier, Amsterdam, 1983: 3-10
Jung, T.P.; Makeig, S.; McKeown, M.J.; Bell, A.; Lee, T.W. & Sejnowski, T.J. (2001). Imaging Brain dynamics using independent component analysis. Proceedings of the IEEE. Vol. 89, No. 7, July 2001, 1107-1122, ISSN 0018-9219.
Kay, S.M. (1999). Modern spectral Estimation: theory and application. Prentice Hall, ISBN: 0130151599, Nj.
Khachab, M.; Kaakour, S. & Mokbel, C. (2007). Brain imaging and support vector machines for brain computer interface. International Symposium on Biomedical Imaging, From Nano to Macro, pp 1032-1035, ISBN 1-4244-0672-2, April 2007, Arlington.
Knuutila, J.E.; Ahonen, A.I.; Hamalainen, M.S.; Kajola, M.J.; Laine, P.P. & Lounasmaa, O.V. (1993). A 122-channel whole-cortex SQUID system for measuring the brain’s magnetic fields. IEEE Trans. Magnetics, Vol. 29, No. 6, November 1993, 3315-3320, ISSN 0018-9464.
Lagerlund, T.D.; Sharbrough, F.W. & Busacker, N.E. (1997). Spatial filtering of multichannel electroencephalographic recordings through principal component analysis by singular value decomposition. Journal Clinical Neurophysiology, Vol. 14, No. 1, January 1997, 73-82, ISSN 0736-0258.
Michel, C.; Murray, M.; Lantz, G.; Gonzalez, S.; Spinelli, L. & Grave de Peralta, R. (2004). EEG source imaging. Clinical Neurophysiology. Vol. 115, No. 10, October 2004, 2195-2222, ISSN 1388-2457.
Mosher, J.C.; Lewis, P.S. & Leahy, R.M. (1992). Multiple dipole modeling and localization from spatio-temporal MEG data. IEEE Trans. Biomedical Engineering, Vol. 39, No. 6, June 1992, 541–557, ISSN 0018-9294.
Mosher, J.C. & Leahy. R.M. (1998). Recursive music: A framework for EEG and MEG source localization. IEEE Trans. on Biomedical Engineering. Vol. 45, No. 11, November 1998, 1342-1354, ISSN 0018-9294.
Mosher, J.C. & Leahy. R.M. (1999). Source localization using recursively applied and projected (rap) MUSIC. IEEE Trans. on Signal Processing, Vol. 47, No. 2, February 1999, 332-340, ISSN 1053-587X.
Pregenzer, M. & Pfurtscheller, G. (1999). Frequency component selection for an EEG-based brain to computer interface. IEEE Trans. Rehabilitation Engineering, Vol. 7, No. 4, December 1999, 413-417, ISSN 1063-6528.
Rajapakse, J.C. & Piyaratna, J. (2001). Bayesian Approach to segmentation of statistical parametric maps. IEEE Trans. Biomedical Engineering. Vol. 48, No. 10, October 2001, 1186-1194, ISSN 0018-9294.
www.intechopen.com

Brain Imaging and Machine Learning for Brain-Computer Interface 73
to overcome this problem. Important achievements have been obtained in this direction (Blankertz et al., 2006).
7. References
Anderson, C.; Stolz, E. & Shamsunder, S. (1998). Multivariate autoregressive models for classification of spontaneous Electroencephalogram during mental tasks. IEEE Transactions on Biomedical Engineering, Vol. 45, No 3, March 1998, 277-286, ISSN 0018-9294.
Berne, R.M.; Levy, M.N.; Koeppen, B.M. & Stanton, B.A. (1998). Physiology, fourth edition, Mosby Inc., ISBN: 0815109520, February 1998.
Blankertz, B.; Muller, K.-R.; Krusienski, D.J.; Schalk, G.; Wolpaw, J.R.; Schlogl, A.; Pfurtscheller, G.; Millan, Jd.R.; Schroder, M. & Birbaumer, N. (2006). The BCI competition III: validating alternative approaches to actual BCI problems. IEEE Trans. on Neural Systems and Rehabilitation Engineering, Vol. 14, No. 2, June 2006, 153-159, ISSN: 1534-4320.
Cristianini, N. & Shawe-Taylor, J. (2000). An Introduction to Support Vector Machines and Other Kernel Based Learning Methods. Cambridge University Press, ISBN: 0521780195, March 2000.
Darvishi, S. & A. Al Ani (2007). Brain-computer interface analysis using continuous wavelet transform and adaptive neuro-fuzzy classifier. Proceedings of the International Conference on Engineering in Medicine and Biology Society (EMBS), pp. 3220-3223, ISBN: 978-1-4244-0787-3, Lyon France, August 2007.
Dale, A.M. & Sereno, M.I. (1993). Improved localization of cortical activity by combining EEG and MEG with MRI cortical surface reconstruction. Journal of Cognitive Neuroscience, Vol. 5, 1993, 162–76.
Ebrahimi, T.; Vesin, J.M. & Garcia, G.(2003). Brain-computer interface in multimedia communication. IEEE Signal Processing Magazine, Vol. 20, No. 1, January 2003, 12-24, ISSN 1053-5888.
Fatourechi, M.; Mason, S.G.; Birch, G.E. & Ward, R.K. (2004). A wavelet-based approach for the extraction of the event related potentials from EEG. Proceedings of the International Conference on Acoustic Speech and Signal Processing (ICASSP), pp.737-740, ISBN: 0-7803-8484-9, Montreal-Canada, May 2004.
Garcia, G.N.; Ebrahimi, T. & Vesin, J.M. (2003). Support vector EEG classification in the fourier and time-frequency correlation domains. Proceedings of the IEEE-EMBS First International Conference on Neural Engineering, pp. 591-594, ISBN: 0-7803-7579-3, March 2003.
Gavit, L.; Baillet, S.; Mangin, J.F.; Pescatore, J. & Garnero. L. (2001). A multiresolution framework to MEG/EEG source imaging. IEEE Trans. Biomedical Engineering, Vol. 48, No. 10, October 2001, 1080-1087, ISSN: 0018-9294.
Hammon, P.S. & de Sa, V.R. (2007). Pre-Processing and meta-classification for brain-
computer interfaces. IEEE Trans. Biomedical Engineering, Vol. 54, No. 3, March 2007, 518-525, ISSN: 0018-9294.
Hammon, P.S.; Makeig, S.; Poizner, H.; Todorov, E. & de Sa, V.R. (2008). Predicting reaching target from human EEG. IEEE Signal Processing Magazine, Vol. 25, No. 1, 2008, 69-77, ISSN: 1053-5888.
Hyvarinen, A. & Oja, E. (2000). Independent component analysis: Algorithms and applications. Neural Networks, Vol. 13, No. 4-5, 2000, 411-430, ISSN: 0893-6080.
Jakson, S.R.; Jakson, G.M. & Roberts, M. (1999). The selection and suppression of action: ERP correlates of executive control in humans. Neuroreport, Vol. 10, No. 4, 1999, 861-865, ISSN 0959-4965.
Jasper, H.H. The ten-twenty electrode system of the international federation. In: Internal Federation of Societies for Electroencephalography and Clinical Neurophysiology. Recommendations for the practice of clinical electroencephalography. Elsevier, Amsterdam, 1983: 3-10
Jung, T.P.; Makeig, S.; McKeown, M.J.; Bell, A.; Lee, T.W. & Sejnowski, T.J. (2001). Imaging Brain dynamics using independent component analysis. Proceedings of the IEEE. Vol. 89, No. 7, July 2001, 1107-1122, ISSN 0018-9219.
Kay, S.M. (1999). Modern spectral Estimation: theory and application. Prentice Hall, ISBN: 0130151599, Nj.
Khachab, M.; Kaakour, S. & Mokbel, C. (2007). Brain imaging and support vector machines for brain computer interface. International Symposium on Biomedical Imaging, From Nano to Macro, pp 1032-1035, ISBN 1-4244-0672-2, April 2007, Arlington.
Knuutila, J.E.; Ahonen, A.I.; Hamalainen, M.S.; Kajola, M.J.; Laine, P.P. & Lounasmaa, O.V. (1993). A 122-channel whole-cortex SQUID system for measuring the brain’s magnetic fields. IEEE Trans. Magnetics, Vol. 29, No. 6, November 1993, 3315-3320, ISSN 0018-9464.
Lagerlund, T.D.; Sharbrough, F.W. & Busacker, N.E. (1997). Spatial filtering of multichannel electroencephalographic recordings through principal component analysis by singular value decomposition. Journal Clinical Neurophysiology, Vol. 14, No. 1, January 1997, 73-82, ISSN 0736-0258.
Michel, C.; Murray, M.; Lantz, G.; Gonzalez, S.; Spinelli, L. & Grave de Peralta, R. (2004). EEG source imaging. Clinical Neurophysiology. Vol. 115, No. 10, October 2004, 2195-2222, ISSN 1388-2457.
Mosher, J.C.; Lewis, P.S. & Leahy, R.M. (1992). Multiple dipole modeling and localization from spatio-temporal MEG data. IEEE Trans. Biomedical Engineering, Vol. 39, No. 6, June 1992, 541–557, ISSN 0018-9294.
Mosher, J.C. & Leahy. R.M. (1998). Recursive music: A framework for EEG and MEG source localization. IEEE Trans. on Biomedical Engineering. Vol. 45, No. 11, November 1998, 1342-1354, ISSN 0018-9294.
Mosher, J.C. & Leahy. R.M. (1999). Source localization using recursively applied and projected (rap) MUSIC. IEEE Trans. on Signal Processing, Vol. 47, No. 2, February 1999, 332-340, ISSN 1053-587X.
Pregenzer, M. & Pfurtscheller, G. (1999). Frequency component selection for an EEG-based brain to computer interface. IEEE Trans. Rehabilitation Engineering, Vol. 7, No. 4, December 1999, 413-417, ISSN 1063-6528.
Rajapakse, J.C. & Piyaratna, J. (2001). Bayesian Approach to segmentation of statistical parametric maps. IEEE Trans. Biomedical Engineering. Vol. 48, No. 10, October 2001, 1186-1194, ISSN 0018-9294.
www.intechopen.com

Biomedical Imaging74
Sajda, P.; Gerson, A.; Muller, K.R.; Blankertz, B. & Parra, L. (2003). A data analysis competition to evaluate machine learning algorithms for use in brain-computer interfaces. IEEE Trans. Neural Systems and rehabilitation Engineering, Vol. 11, No. 2, June 2003, 184-185, ISSN 1534-4320.
Sajda, P.; Muller, K-R. & Shenoy, K.V. (2008), Brain-Computer Interfaces, IEEE Signal Processing Magazine, Vol. 25, No. 1, January 2008, 16-17, ISSN 1053-5888.
Schmidt, R.O. (1981). A signal subspace approach to multiple emitter location and spectral estimation. PhD Thesis, Stanford University. 1981.
Shenoy, K.V.; Santhanam, G.; Ryu, S.I. ; Afshar, A. ; Yu, B.M.; Kalmar, R.S.; Cunningham, J.P.; Kemere, C.T.; Batista, A.P.; Churchland, M.M. & Meng, T.H. (2006). Increasing the performance of cortically-controlled protheses. Proceedings of the International Conference on Engineering in Medicine and Biology Society (EMBS), pp. 6652-6656, ISBN 1-4244-0032-5, New York, September 2006.
Vapnik, V. (1998). Statistical Learning Theory. Wiley, ISBN 0-471-03003-1, NY, 1998. Veltink, P.H.; Koopman, H.F.J.M.; van der Helm, F.C.T. & Nene, A.V. (2001).
Biomechatronics-assisting the impaired motor system. Archives of physiology and Biochemistry, Vol. 109, No. 1, 2001, 1-9.
Müller, K-R. & Blankertz, B. (2006). Toward non-invasive brain-computer interfaces. IEEE Signal Processing Magazine, Vol. 128, No. 1, September 2006, 125-128, ISSN 1053-5888.
Vorobyov, S. & Cichoki, A. (2002). Blind noise reduction for multisensory signals using ICA and subspace filtering, with application to EEG analysis. Biological Cybernetics. Vol. 86, No. 4, April 2002, 293-303, ISSN 0340-1200.
Westbrook. G.L. (2000). Seizures and epilepsy. In: Principles of Neural Science. Kandel, E.R., Schwartz, J.H., and Jessel, T.M., Editors. Fourth edition., 910-935, McGraw Hill, ISBN 0838577016.
Wolpaw, J.R.; Birbaumer, N.; McFarland, D.J.; Pfurtscheller, G. & Vaughan, T. (2002). Brain-computer interfaces for communication and control. Clinical Neurophysiology, Vol. 113, No. 6, June 2002, 767-791, ISSN 1388-2457.
Xu, B.; Song, A. & Wu, J. (2007). Algorithm of imagined left-right hand movement classification based on wavelet transform and AR parameter model. Proceedings of the International Conference on Bioinformatics and Biomedical Engineering (ICBBE), pp. 539-542, ISBN 1-4244-1120-3, Wuhan, July 2007.
http://software.sci.utah.edu/map3d.
www.intechopen.com

Biomedical ImagingEdited by Youxin Mao
ISBN 978-953-307-071-1Hard cover, 100 pagesPublisher InTechPublished online 01, March, 2010Published in print edition March, 2010
InTech EuropeUniversity Campus STeP Ri Slavka Krautzeka 83/A 51000 Rijeka, Croatia Phone: +385 (51) 770 447 Fax: +385 (51) 686 166www.intechopen.com
InTech ChinaUnit 405, Office Block, Hotel Equatorial Shanghai No.65, Yan An Road (West), Shanghai, 200040, China
Phone: +86-21-62489820 Fax: +86-21-62489821
Biomedical imaging is becoming an indispensable branch within bioengineering. This research field hasrecently expanded due to the requirement of high-level medical diagnostics and rapid development ofinterdisciplinary modern technologies. This book is designed to present the most recent advances ininstrumentation, methods, and image processing as well as clinical applications in important areas ofbiomedical imaging. It provides broad coverage of the field of biomedical imaging, with particular attention toan engineering viewpoint. The goal of the book is to provide a wide-ranging forum in the biomedical imagingfield that integrates interdisciplinary research and development of interest to scientists, engineers, teachers,students, and clinical providers.
How to referenceIn order to correctly reference this scholarly work, feel free to copy and paste the following:
Maha Khachab, Chafic Mokbel, Salim Kaakour, Nicolas Saliba and Gerard Chollet (2010). Brain Imaging andMachine Learning for Brain-Computer Interface, Biomedical Imaging, Youxin Mao (Ed.), ISBN: 978-953-307-071-1, InTech, Available from: http://www.intechopen.com/books/biomedical-imaging/brain-imaging-and-machine-learning-for-brain-computer-interface

© 2010 The Author(s). Licensee IntechOpen. This chapter is distributedunder the terms of the Creative Commons Attribution-NonCommercial-ShareAlike-3.0 License, which permits use, distribution and reproduction fornon-commercial purposes, provided the original is properly cited andderivative works building on this content are distributed under the samelicense.