Brain Feasibility of a visual prosthesis for the blind ... · Feasibility of a visual prosthesis...
16
Brain (1996), 119, 507-522 Feasibility of a visual prosthesis for the blind based on intracorticai microstimulation of the visual cortex E. M. Schmidt, 1 M. J. Bak, 1 F. T. Hambrecht, 2 C. V. Kufta, 3 D. K. O'Rourke 3 and P. Vallabhanath 4 1 Laboratory of Neural Control, the 2 Neural Prosthesis Program, the ^Surgical Neurology Branch, National Institute of Neurological Disorders and Stroke, National Institutes of Health and the ^Howard Hughes Medical Institute, Bethesda, USA Correspondence to: E. M. Schmidt, Laboratory of Neural Control, National Institute of Neurological Disorders and Stroke, National Institutes of Health, Building 49, Room 3A50, Bethesda, MD 20892-4455, USA Summary The feasibility of producing a visual prosthesis for the blind using intracorticai microstimulation (ICMS) of the visual cortex was studied in a 42-year-old woman who had been totally blind for 22 years secondary to glaucoma. Thirty- eight microelectrodes were implanted in the right visual cortex, near the occipital pole, for a period of 4 months. Percepts reported as small spots of light, called phosphenes, were produced with 34 of the 38 implanted microelectrodes. Threshold currents for phosphene generation with trains of biphasic pulses were as low as 1.9 fiA, and most of the microelectrodes had thresholds below 25 jlA. Phosphene brightness could be modified with stimulus amplitude, frequency and pulse duration. Repeated stimulation over a period of minutes produced a gradual decrease in phosphene brightness. Phosphenes did not flicker. The apparent size of phosphenes ranged from a 'pin-point' to a 'nickel' (20 mm diameter coin) held at arm's length. Phosphene size usually decreased as stimulation current was increased but increased slightly as the train length (TL) was increased. At levels of stimulation near threshold, the phosphenes were often reported to have colours. As the stimulation level was increased, the phosphenes generally became white, greyish or yellowish. Individual phosphenes appeared at different distances from the subject. When two phosphenes were simultaneously generated, the apparent distances of the individual phosphenes sometimes changed to make them appear to be at about the same distance. When three or more Keywords: human; electrical stimulation; visual cortex phosphenes were simultaneously generated, they became coplanar. Except for rare occasions, phosphenes extinguished rapidly at the termination of the stimulation train. When stimulation TLs were increased beyond 1 s, phosphenes usually disappeared before the end of the train. The duration of phosphene perception could be increased by interrupting a long stimulation train with brief pauses in stimulation. Intracorticai microelectrodes spaced 500 \lm apart generated separate phosphenes, but microelectrodes spaced 250 pan typically did not. This two-point resolution was about five times closer than has typically been achieved with surface stimulation. With some individual microelectrodes, a second closely spaced phosphene was sometimes produced by increasing the stimulation current. Phosphenes moved with eye movements. When up to six phosphenes were simultaneously elicited they all moved with the same relative orientation during eye movements. All phosphenes were located in the left hemi-field with the majority above the horizontal meridian. There was a clustering of most of the phosphenes within a relatively small area of visual space. The potentially greater microelectrode density and lower power requirements of ICMS compared with surface stimulation appears encouraging for a visual prosthesis. However, further studies with blind subjects are required to optimize stimulation parameters and test complex image recognition before the feasibility of a visual prosthesis based on ICMS can be established. Abbreviations: AF = anodic-first; BB = 4 mm diameter pellet; CF = cathodic-first; F = frequency; I = current; ICMS = intracorticai microstimulation; IPI = inter-phase interval; ITI = inter-train interval; PD = pulse duration; TL = train length © Oxford University Press 1996 by guest on April 5, 2011 brain.oxfordjournals.org Downloaded from
Transcript of Brain Feasibility of a visual prosthesis for the blind ... · Feasibility of a visual prosthesis...

Brain (1996), 119, 507-522
Feasibility of a visual prosthesis for the blindbased on intracorticai microstimulation of thevisual cortexE. M. Schmidt,1 M. J. Bak,1 F. T. Hambrecht,2 C. V. Kufta,3 D. K. O'Rourke3 and P. Vallabhanath4
1 Laboratory of Neural Control, the 2Neural ProsthesisProgram, the ^Surgical Neurology Branch, NationalInstitute of Neurological Disorders and Stroke, NationalInstitutes of Health and the ^Howard Hughes MedicalInstitute, Bethesda, USA
Correspondence to: E. M. Schmidt, Laboratory of NeuralControl, National Institute of Neurological Disorders andStroke, National Institutes of Health, Building 49,Room 3A50, Bethesda, MD 20892-4455, USA
SummaryThe feasibility of producing a visual prosthesis for the blindusing intracorticai microstimulation (ICMS) of the visualcortex was studied in a 42-year-old woman who had beentotally blind for 22 years secondary to glaucoma. Thirty-eight microelectrodes were implanted in the right visualcortex, near the occipital pole, for a period of 4 months.Percepts reported as small spots of light, called phosphenes,were produced with 34 of the 38 implanted microelectrodes.Threshold currents for phosphene generation with trains ofbiphasic pulses were as low as 1.9 fiA, and most of themicroelectrodes had thresholds below 25 jlA. Phosphenebrightness could be modified with stimulus amplitude,frequency and pulse duration. Repeated stimulation over aperiod of minutes produced a gradual decrease in phosphenebrightness. Phosphenes did not flicker. The apparent size ofphosphenes ranged from a 'pin-point' to a 'nickel' (20 mmdiameter coin) held at arm's length. Phosphene size usuallydecreased as stimulation current was increased but increasedslightly as the train length (TL) was increased. At levels ofstimulation near threshold, the phosphenes were oftenreported to have colours. As the stimulation level wasincreased, the phosphenes generally became white, greyishor yellowish. Individual phosphenes appeared at differentdistances from the subject. When two phosphenes weresimultaneously generated, the apparent distances of theindividual phosphenes sometimes changed to make themappear to be at about the same distance. When three or more
Keywords: human; electrical stimulation; visual cortex
phosphenes were simultaneously generated, they becamecoplanar. Except for rare occasions, phosphenes extinguishedrapidly at the termination of the stimulation train. Whenstimulation TLs were increased beyond 1 s, phosphenesusually disappeared before the end of the train. The durationof phosphene perception could be increased by interruptinga long stimulation train with brief pauses in stimulation.Intracorticai microelectrodes spaced 500 \lm apart generatedseparate phosphenes, but microelectrodes spaced 250 pantypically did not. This two-point resolution was about fivetimes closer than has typically been achieved with surfacestimulation. With some individual microelectrodes, a secondclosely spaced phosphene was sometimes produced byincreasing the stimulation current. Phosphenes movedwith eye movements. When up to six phosphenes weresimultaneously elicited they all moved with the same relativeorientation during eye movements. All phosphenes werelocated in the left hemi-field with the majority above thehorizontal meridian. There was a clustering of most of thephosphenes within a relatively small area of visual space.The potentially greater microelectrode density and lowerpower requirements of ICMS compared with surfacestimulation appears encouraging for a visual prosthesis.However, further studies with blind subjects are required tooptimize stimulation parameters and test complex imagerecognition before the feasibility of a visual prosthesis basedon ICMS can be established.
Abbreviations: AF = anodic-first; BB = 4 mm diameter pellet; CF = cathodic-first; F = frequency; I = current; ICMS =intracorticai microstimulation; IPI = inter-phase interval; ITI = inter-train interval; PD = pulse duration; TL = train length
© Oxford University Press 1996
by guest on April 5, 2011
brain.oxfordjournals.orgD
ownloaded from

508 E. M. Schmidt et al.
IntroductionThe concept of a cortical visual prosthesis for the blind isbased on the fact that localized electrical stimulation of thehuman visual cortex can excite topographically mapped visualpercepts called phosphenes. Early experiments by Brindley(Brindley and Lewin, 1968; Brindley et al., 1972; Rushtonand Brindley, 1977), Dobelle (Dobelle and Mladejovsky,1974; Dobelle et al., 1974, 1976), Pollen (1975) and otherswere designed to study the effects of visual corticalstimulation with relatively large electrodes placed on the pia-arachnoid surface in individuals who were totally blind,following lesions of the eyes and optic nerves. The resultsfrom these studies indicated that a prosthesis based on corticalsurface stimulation would have limited usefulness becauseof factors such as the high levels of current required toproduce phosphenes, interactions between phosphenes whenelectrodes were spaced closer than 2.4 mm, the productionof multiple non-contiguous phosphenes as current was raisedabove threshold, and the occasional elicitation of pain dueto meningeal or scalp stimulation.
As an alternative approach, we began the systematicdesign, development and evaluation of safe and effectivemeans of microstimulating cortical tissue. By implantingfloating microelectrodes within the visual cortex, withexposed tip sizes the same order of magnitude as the excitedneurons, much more selective stimulation can, in principle,be achieved, resulting in more precise control of neuronalfunction. For a visual prosthesis, we hypothesized that ICMSwould result in reduced phosphene interactions, a higherpossible density of microelectrodes, and lower overall powerrequirements due to a greater reduction in current permicroelectrode than increase in the total number of micro-electrodes.
In order to derive engineering design data for a prototypechronic implant, acute ICMS studies were performed insighted patients undergoing occipital craniotomy for otherreasons (Bak et al., 1990). The results from those studieswere encouraging and provided the necessary engineeringspecifications to develop a long-term implant for a blindsubject.
The initial questions to be answered by this implant were:(i) Does the visual cortex of a person, blind for a long periodof time, remain responsive to ICMS and, if so, what visualpercepts can be elicited by ICMS? (ii) Are the visual perceptsstable over months of stimulation? (iii) With stimulation ofmany sites, do the elementary visual percepts (phosphenes)integrate to form meaningful spatial patterns that can berecognized by the subject? The present work provides partialor complete answers to these questions. The results areencouraging for the development of a prosthesis that mightassist the blind in daily activities such as reading and mobility.
Material and methodsSubject selectionAlthough we did not actively solicit a research subject, over50 blind individuals contacted us following several articles
Teflon coated stainlesssteel wires
Kapton
3 5 (im Parytene-C
2.0 mm
Pure goW wife (25 (im)
3S3ND Bkxompatlble epoxy
Gold to irkfum weld joint
Cyanoacrytate to reinforceweld joint
3 S | i m Parytene-C
Pure ridKim (37 5 |im)
250 urnor
500 (imor
750 (im
Exposed activated Irkfcjma approximately 20 \im
Fig. 1 Schematic diagram (not to scale) of a dual 'Hat-Pin'microelectrode used in this study for intracorticalmicrostimulation (ICMS).
about our work in the popular press. From this group,four were brought to the National Institutes of Health forpreliminary medical and psychological evaluation. A 42-year-old woman who had been blind without light perceptionfor 22 years secondary to glaucoma was selected.
The human research protocol was approved by theInstitute's Clinical Research Subpanel. The procedures andrisks were fully explained to the subject prior to theexperiments and informed consent obtained. The implantdesign was not permanent and the subject was fully awarethat she would receive no direct benefit from this experiment.She understood that its main purpose was to gain knowledgeessential to the future development of a visual prosthesis forthe blind.
MicroelectrodesTo fabricate each microelectrode (see Fig. 1), a 3 mm lengthof indium wire, 37.5 |im in diameter, was micro welded toa flexible 25 |im gold wire with a free length of 12-40 mm.The gold wire was the centre conductor of a seven strandTeflon insulated cable. Six strands of 25 \im stainless steelwire surrounded the gold wire to provide strength so that the
by guest on April 5, 2011
brain.oxfordjournals.orgD
ownloaded from

Visual prosthesis 509
cable could be passed through the scalp and attached to anexternal connector. The non-welded end of the iridium wirewas electroetched to a length of 2 mm and a tip diameterof ~2 \im (Loeb et al., 1977). In addition to 12 singlemicroelectrodes, 13 pairs were constructed by fastening twoiridium microelectrodes together with interelectrode spacingof 250, 500 or 750 |im. The microelectrodes and connectingleads were insulated with Parylene-C. The insulation wasremoved from the tip of each microelectrode with a highvoltage arc discharge (Loeb et al, 1977) to expose ~200 |im2
of iridium. Activated iridium oxide was formed • on theexposed iridium surface to increase the charge^carryingcapacity of the microelectrodes (Robblee et al, 1983). Themicroelectrode leads were assembled into three groups witheight or 10 microelectrodes per assembly. The Teflon coatedcables in each group were passed through one of four siliconetubes and terminated on one of four miniature printed circuitconnectors. Platinum ground leads were wrapped aroundeach of the silicone tubes. These leads provided a returncurrent path for the microelectrodes during stimulation.
Computer controlled stimulatorsA Digital Equipment PDP-11 computer was used to generatethe stimulation waveforms that controlled four opticallyisolated constant current stimulators. Each stimulator wasconnected to 10 microelectrodes via relays with open andclosure times of <1 ms. Each stimulator could also beconnected to any one of the microelectrodes through a patchpanel. Multiple microelectrodes could be activated from asingle stimulator by interleaving die stimulation waveformsduring a stimulation train. The stimulators were equippedwith optically isolated voltage monitors so that the voltageacross each microelectrode, as referenced to the platinumground leads, could be observed on an oscilloscope duringall stimulation sequences. By monitoring these voltages,problems such as open or shorted lead wires could be detected.
The basic stimulation parameters that were under computercontrol are shown in Fig. 2. The frequency of the charge-balanced pulses was usually constant during a pulse train,but a number of frequency modulated pulse trains werealso tested.
Surgical proceduresThe implantation of the intracortical microelectrodes wascarried out in two stages. In the first procedure, an occipitalcraniotomy centred on the right occipital pole was performedunder general anaesthesia. Four ramp-like channels werefashioned in the skull and the bone plate in order to allowfuture compression-free passage of the microelectrode cablegroups. The second procedure was performed 8 days laterunder local anaesthesia with the intention of mapping thevisual cortex with a 1 mm diameter platinum surface electrodeprior to implanting the microelectrodes. The surfacestimulation parameters employed were constant current,
CATHODE-flRST (CF)
AXOOIC-flRST (AF)
Fig. 2 Diagram illustrating the parameters that were used for thebiphasic pulse waveforms. The polarities of the pulses were eithercathodic-first (CF) or anodic-first (AF). The frequency (F) ofstimulation was the reciprocal of the time between pulses. Theinter-phase interval (IPI) was the time between the leading phaseof the pulse and the repolarization phase. The pulse duration (PD)was the duration of one phase of the pulse. The train length (TL)was the time duration of the burst of stimulating pulses. Theinter-train interval (ITT) was the time between stimulation trains.A = amplitude.
capacitor-coupled, anodic-first (AF) charge-balanced biphasicpulses [amplitude = 1.0-2.5 mA, frequency (F) = 100 Hz,pulse duration (PD) = 200 (is, TL = 2 s]. These parametershad produced phosphenes in our sighted subjects (Bak et al,1990) but failed to do so in this blind subject. Despite thisfailure to produce phosphenes with surface stimulation, 38microelectrodes were implanted, normal to the cortical surfaceto a depth of 2 mm, in a wedge-shaped region near the poleof the right occipital cortex (Fig. 3), as planned from MRIstudies of the subject. The microelectrode cables were placedon the skull ramps, tunnelled beneath the scalp andexteriorized through four separate scalp incisions.
At the completion of 4 months of testing, a final surgicalprocedure was performed under general anaesthesia for theremoval of all of the percutaneous leads and five of themicroelectrodes. The four scalp incisions were closed at thistime. There were no intra- or post-operative complications.
Subject testingThe cables from the computer controlled stimulators wereattached to a lightweight bicycle helmet, wom by the subject,to provide strain relief between them and the percutaneousleads. A quadrant of the helmet was removed to provide easyaccess to the connectors. At the end of each testing session,the helmet was removed and a head dressing was applied tominimize movements of the percutaneous leads.
Initial stimulation of individual microelectrodes was carriedout with charge-balanced biphasic pulses that had the
by guest on April 5, 2011
brain.oxfordjournals.orgD
ownloaded from

510 E. M. Schmidt et al.
Fig. 3 Photograph of exposed surface of the right visual cortex of the blind subject The overlaid dots, at ~2.4 mm spacing, werereference points for surface stimulation. The numbers in the figure have been placed on the approximate positions of the intracorticalmicroelectrodes. The anatomical pole of the occipital cortex is estimated to be near microelectrodes 14 and 15. The terminal portion ofthe calcarine fissure is marked by an arrow and superior is to the left of the arrow. A centimetre scale is shown at the lower left.
following parameters: cathodic-first (CF), F = 100 Hz, PD =200 us, TL = 3000 ms and currents (I) up to 20 ^lA. Afterstimulus presentation, the subject was requested to describethe visual percepts. Audio and video tape records were madeof all testing sessions in order to preserve details of subjectresponses.
Microelectrode testingOn each day of post-implant testing, the impedance of eachmicroelectrode was measured by recording the voltage dropproduced during passage of a 100 nA, 1 kHz, sine wavecurrent. This determined the electrical integrity of themicroelectrode, lead wire and connector assembly. Moistureoccasionally accumulated in the cable connectors, producinga low impedance shunt When this occurred, the connectorswere flushed with alcohol and dried with an air stream.Impedances were also measured at the end of each testingsession.
Threshold testingThe threshold current required to produce a phosphene witha given microelectrode was determined using a successiveapproximation convergence technique. One-half of themaximum current for threshold testing (CF = 30 |iA, AF =80 (lA) was used as the initial value of stimulation current.The other parameters for the charge-balanced biphasic pulseswere F = 200 Hz, PD = 200 us and TL = 250 ms. Aftereach stimulation train, the subject depressed one of threepush buttons: the first if a phosphene was not perceived, thesecond to repeat the stimulus with the same parameters, andthe third if a phosphene was perceived. At the beginning ofeach stimulation train, a tone was generated to alert thesubject that a response was required. If a phosphene wasperceived, the current for the next stimulation was reducedto a value halfway between the present value and either 0uA or the highest value of current for which a phosphenehad not been perceived. If a phosphene was not perceived,the current for the next stimulation was increased to a value
by guest on April 5, 2011
brain.oxfordjournals.orgD
ownloaded from

Visual prosthesis 511
halfway between the present value and the lowest value ofcurrent for which a phosphene had been perceived, or themaximum current for threshold testing, whichever was lower.The process of determining threshold current continued untilthe change in current was <0.1 u_A. Threshold current foran individual microelectrode was the lowest current for whichthe subject perceived a phosphene.
Phosphene onset, extinction and durationThe onset and extinction of phosphenes were measured usinga simple reaction time task. The subject initiated a trial bydepressing a switch which started a stimulation train and atimer. The subject released the switch when a phosphene wasperceived and the time was measured. This onset time wasthe time to the beginning of the perceived phosphene plusthe subject's motor reaction time. The extinction time ofphosphenes was measured in a similar fashion but the subjectreleased the switch when the phosphene could no longer beperceived. Phosphene duration was estimated as the extinctiontime minus the onset time.
Phosphene mappingTwo mapping procedures were employed to estimate thelocation of phosphenes in the subject's perceived visualspace. The first employed a circular dart board divided intothe radial segments of a clock face, with five concentricannular zones to represent displacement between the foveaand the extreme visual periphery. The subject wouldconcentrate on holding her eye position as if she were lookingstraight ahead prior to and during the generation of eachphosphene. She would then place a dart in the board viatactile localization.
Computer mapping of phosphene location associated witheach microelectrode was a modification of the proceduredescribed by Mladejovsky et al. (1976). In their algorithm,the subject indicated the direction between two phospheneswith a touch-tone key pad indicating eight different directions.We expanded the resolution of this technique by using ajoystick input to the computer that could indicate 16 differentdirections. Two phosphenes were elicited by activating twomicroelectrodes. One phosphene was the reference whichhad already been mapped and the other was the phosphene tobe mapped. They were differentiated by order of presentation,differences in duration and/or brightness. The subjectindicated the direction vector of the phosphene to be mappedwith the joystick and pressed an acceptance button when aselection had been made. The computer determined therelative location of the phosphene from the directions ofpreviously mapped phosphenes. A binary search, first in thex direction and then in the y direction, through the locationsof phosphenes already mapped, determined the neighboursof the phosphene to be mapped.
ResultsStimulation was initiated 3 days after implantation of themicroelectrodes [CF, F = 100 Hz, PD = 200 u.s, inter-phaseinterval (IPI) = 0, TL = 3000 ms]. During the first eightstimulation sessions spanning 11 days, the describedphenomena were disregarded because the subject reportedvisual experiences resembling phosphenes during sham trials,when the stimulating current was set to zero. Our subjecthad pronounced, spontaneous, visual background activityagainst which we were trying to superimpose phosphenes. Itwas thus necessary to establish whether she was reportingvisual phenomena due to stimulation or to spontaneousfluctuations in her background activity. To aid the recognitionof phosphenes, starting with the ninth stimulation session,the stimulation TL was reduced from 3000 ms to 200 msand 10 trains were presented repetitively at 1-s intervals. Aspreviously reported by Brindley (Rushton and Brindley,1978), we found that this type of stimulus presentation greatlyenhanced the subject's ability to distinguish phosphenesfrom background activity. When repetitive trains were firstemployed, the subject immediately reported that she saw asmall spot of light that was blinking in synchrony with thetrains. After this change, the subject never again reported aphosphene when sham stimulations were included in thetesting sequence.
Phosphene threshold currentsThreshold currents for the detection of phosphenes were afunction of all of the parameters shown in Fig. 2. A setof parameters that produced satisfactory phosphenes wereinitially chosen for threshold determinations. With CF pulses(F = 200 Hz, PD = 200 |is, IPI = 0, TL = 125 ms), 25 ofthe microelectrodes had threshold currents below 25 |iA andthe lowest threshold was 1.9 (iA. Since activated iridiummicroelectrodes have a higher charge carrying capacity whenpulsed in the AF direction (Robblee et al, 1983),microelectrodes that did not produce phosphenes with CFstimulation at levels up to 30 \iA were subsequently testedwith AF stimulation at currents up to 80 |iA. Thresholdcurrents for nine additional microelectrodes with AFstimulation ranged from 40 to 77 (jA.
Two of the microelectrode gold leads were broken atthe time of implantation and only two of the 36 intactmicroelectrodes failed to produce phosphenes. During thesixth week of testing, four of the gold centre conductors inthe cables to the microelectrodes were broken, where theyexited the supporting stainless steel strands, due to accidentalmovement, during sleep, of the head dressing that protectedthe percutaneous cables between testing sessions. During thenext few weeks, more of the gold leads broke which severelylimited performance of a number of experiments.
Cathodic-first versus anodic-first stimulationAs noted above, the polarity of the leading phase of thecharge-balanced biphasic stimulating pulses affected
by guest on April 5, 2011
brain.oxfordjournals.orgD
ownloaded from

512 E. M. Schmidt et al.
40
36
30
I 2 6
10 17 IS
Mic rod ect rode
Fig. 4 Comparison of threshold currents of nine microelectrodesusing CF (closed bars) and AF (open bars) stimulation.Stimulation parameters: F = 200 Hz, PD = 200 us, TL = 250 ms.
threshold currents. Figure 4 illustrates the lower thresholdsobtained with CF compared with AF stimulation for ninemicroelectrodes tested systematically (F = 200 Hz, PD =200 us, IPI = 0, TL = 250 ms). The average increase incurrent threshold with AF stimulation was 36.9%. However,only microelectrodes 13 and 17 required a sizable increasein current (75.3%), while the remaining microelectrodesrequired only a 21.6% increase in current.
Effects of TL and frequencyThreshold current tests were conducted with five individualmicroelectrodes to determine the relationship between currentand TL over the frequency range of 75—200 Hz. The thresholdcurrents were constant at frequencies between 150 and200 Hz, but increased by -50% at 75 Hz. The averagethresholds at fixed frequencies for the 250 ms TL were 20%lower than those for the 125 ms TL. The subject reportedthat phosphenes produced with TLs of 250 ms were not asquick (i.e. of longer duration) as those produced with TLsof 125 ms, and were thus more easily recognized. Longerstimulation trains were investigated for prolongingphosphenes and the results are discussed below in the sectionon phosphene duration experiments.
Effects of pulse durationThe effects of stimulus PD were examined in detail for threemicroelectrodes. The reported average threshold currentsdecreased with increasing stimulus PD from 19.4 \iA atPD = 200 us to 11.7 nA at PD = 800 u s (F = 200 Hz,IPI = 0, TL = 250 ms). An unexpected finding was that thesubject preferred the phosphenes produced with the widerPDs, indicating that 'they were more substantial'.
When narrow biphasic pulses were employed forstimulation, delay of the repolarization phase reduced thestimulation threshold. With a PD of 200 us, the averagethreshold of five microelectrodes dropped by 5.4% when IPIwas increased from 0 to 100 \is.
Threshold stabilityAs the experiment progressed, it was found that wider PDsprovided a more pleasing percept to the subject. Thus the'standard' parameters for establishing stimulation thresholdsslowly evolved over the course of the experiment. Forexample, on day 35 post-implant, the threshold current formicroelectrode 18 was 15.9 \iA (F = 200 Hz, PD = 200 |is,IPI = 0, TL = 250 ms). The threshold initially dropped andthen rose to 24.8 uA on day 78 (mean = 16 \iA, SD = 3.8).Increasing the PD to 400 (is reduced the threshold current to11.9 |iA. When thresholds currents were determined withboth 200 and 400 |is PDs on the same day, the 200 |is PDrequired, on average, 1.51 times more current than the 400\is pulses. With these new parameters, the threshold currentremained relatively stable through day 108 (mean = 12.8|iA, SD = 1.4). The stimulation parameters were againchanged due to subject preference (F = 150 Hz, PD = 600(is) resulting in a threshold current of 12.2 |lA. The averagethreshold currents using the parameters (F = 200 Hz, PD =400 us) were 1.05 times higher than those obtained with thenew set of parameters (F = 150 Hz, PD = 600 |is). Themean threshold current until the end of the testing with thislast set of parameters was 12 U.A (SD = 1.3). With the 400or 600 |is PDs, there was less variation in threshold currentvalues than with a PD of 200 (is.
Selected characteristics of phosphenesPhosphene sizeThe size of the perceived phosphenes ranged from a 'pin-point' to a 'nickel' (20 mm diameter coin) held at arm'slength. Systematic studies were not conducted on each ofthe different stimulation parameters, but sufficient data wereobtained with current amplitude and TL to demonstrate thatapparent phosphene size was slightly modified with variationsin these parameters.
Phosphene sizes were estimated by the subject asstimulation currents were increased through 17 of themicroelectrodes. With nine, the size of the phosphenesdecreased as the current increased, while in the others,increasing current produced either no change in the size ofthe phosphenes or an increase and then decrease in size.
The sizes of the perceived phosphenes were tested withfour microelectrodes as the stimulation TL was varied. Allfour produced larger phosphenes as the TL was increasedfrom 200 to 500 ms.
Phosphene colourWhen individual microelectrodes were stimulated nearthreshold, the subject usually reported the evoked phosphenesas having distinct colours such as yellow, blue or red, butnot green. The results obtained with microelectrode 5 weretypical. Its threshold was 7.5 nA (F = 100 Hz, PD = 200(is, TL = 500 ms) and the colour reported was violet. As the
by guest on April 5, 2011
brain.oxfordjournals.orgD
ownloaded from

Visual prosthesis 513
current was increased to 11.3 lA, the phosphenes werereported as sometimes white, sometimes violet andoccasionally they consisted of both colours. At currents>12.5 (lA, percepts during stimulation were generally white,yellowish or greyish.
FlickerWhen a single continuous train of stimulation was delivered,the subject perceived a phosphene that did not flickerregardless of TL. When multiple trains were delivered, thesubject perceived a temporally separate phosphene for eachtrain as long as the inter-train interval (FIT) was >~25 ms.When the ITI was reduced below this value, the subjectperceived a continuous, non-flickering phosphene.
Perceived distance of phosphenesThe subject reported that phosphenes appeared at variousdistances, ranging from 8 cm in front of her face to far away,like a 'distant star'. The apparent distance of most phospheneswas under 60 cm.
Phosphene onset, duration and extinctionOnset response latencyThe average onset reaction time for phosphene perception{see Material and methods) was 395 ms when microelectrode18 was stimulated (F = 150 Hz, PD = 600 us, TL = 250 ms,current = 1.5 times threshold). The average onset reactiontime for phosphene perception with stimulation of micro-electrode 12 was 452 ms, but the subject reported that thephosphenes were harder to see than those generated bystimulation of microelectrode 18. Microelectrodes 32 and 33were stimulated simultaneously and the average onset reactiontime for phosphene perception was 418 ms.
Onset latency versus stimulation frequencyThe frequency of stimulation influenced the subject's reactiontimes to stimulus detection and cessation. Increasing thefrequency of stimulation reduced the reaction time to boththe onset of phosphene detection and cessation when stimulusintensity was set to 1.5 times threshold at F = 150 Hz.Beyond 150 Hz, the onset reaction times were relativelyconstant at 412 ms, while the reaction times to cessation ofthe phosphenes appeared to stabilize at 470 ms for F 5*250 Hz.
Phosphene durationWhen microelectrodes were tested with a stimulation TL of250 ms, the estimated phosphene durations were slightlylonger than the duration of the TL (259, 276 and 481 ms).The estimated phosphene durations remained slightly longerthan the stimulation TL for both 500 and 750 ms TLs. When
the stimulation TLs were increased to 1000 and 1500 ms,the estimated phosphene durations were less than the durationof stimulation and never exceeded 930 ms.
Method of increasing phosphene durationThe subject described phosphenes produced by longstimulation trains as having a rapid onset and cessation eventhough the stimulation continued beyond the time that thephosphene was perceived. To increase the apparent durationof phosphenes, interrupted stimulation was investigated. Witha TL of 125 ms, an ITI of 50 ms and 12 repetitive trains,the subject reported seeing 'a bunch of phosphenes that wereclose together in time'. They looked like 'they were recedingin space, but did not get dimmer'. The total time of thestimulation was 2050 ms and the subject indicated that thetotal duration of the phosphenes was 2177 ms.
When the ITI was reduced to 25 ms and 13 trains werepresented, the subject reported seeing 'one phosphene thatreceded in space, maintained the same brightness, butappeared to get smaller'. The total period of stimulation was1925 ms and the subject indicated that the phosphene lasted~2200 ms. Increasing the number of trains to 26 (period ofstimulation = 3875 ms) the subject reported the same visualpercept as before and indicated that it lasted ~2760 ms. Thispercept duration indicated that the phosphene ended beforethe end of stimulation, but was present for a much longertime than when continuous stimulation was employed.
Accommodation to repeated stimulationDuring stimulation of a microelectrode, the apparentbrightness of a phosphene reported by the subject decreased.To quantify this phenomenon, the subject calibrated herperception of phosphene brightness by assigning a maximumbrightness value of 5.0 to the first stimulus presentation.Brightness of each subsequent phosphene was rated relativeto the first on a scale of 0-5. Stimulation trains were presentedevery 4 s which allowed sufficient time for the subject torespond. Microelectrodes 2, 21 and 25 were stimulated attwice the threshold current level of each (F = 200 Hz, PD =100 [is, IPI = 100 us, TL = 125 ms). Figure 5 shows theresults of ~50 repeated stimulations of each microelectrode.The accommodation in brightness was very pronounced forall three microelectrodes. There was a sudden drop in thebrightness of the second phosphene produced bymicroelectrode 21, but then the slope of the accommodationcurve was very similar to the accommodation curves formicroelectrodes 2 and 25.
The threshold current for each of the three microelectrodeswas determined prior to and immediately after the 50-trialsequence of stimulation. The average increase in thresholdcurrent was 52%. On the day following the repeatedstimulation, the average threshold current of thesemicroelectrodes had returned to their initial value for thepreceding day.
by guest on April 5, 2011
brain.oxfordjournals.orgD
ownloaded from

514 E. M. Schmidt et al.
mlcroeltctrodt 25mlcrotltctrode 2microalectrode 21
15 20 25 30 35
Stimulation event number
40 45 50
Fig. 5 The perceived relative phosphene brightness produced byrepeated stimulation, at 4 s intervals, of three differentmicroelectrodes. Microelectrode 25 was stimulated with 46 trainsfollowed by stimulation of microelectrode 2 with 50 trains andthen microelectrode 21 was stimulated. Stimulation parameters:F = 200 Hz, PD =100 us, IPI = 100 us, TL = 125 ms.
Another series of accommodation experiments wasconducted with microelectrodes 3, 21 and 28. Stimulationwas again given at twice the threshold current level with thesame parameters as used on the first accommodation seriesconducted the previous day, except that the PD was increasedto 200 jis and the IPI was reduced to zero. The brightnessaccommodation curves for all microelectrodes declined at aslower rate than those of the previous day. The averageincrease in threshold current of these three microelectrodesproduced by the repeated stimulation was 20%.
To rule out the possibility that the accommodation curveswere due to the subject's scaling of perceived brightness,two sequential accommodation experiments were performed.At the completion of the first 50 stimulations the subject wasasked to recalibrate the perceived brightness of the nextobserved phosphene to a value of 5.0 and report the brightnessof the next 49 phosphenes on this new scale. The perceivedbrightness of the second set of 50 phosphenes decreased ata slower rate than the first set of 50 phosphenes.
To determine the rate of brightness recovery followingrepeated stimulation, the brightness was subsequentlyassessed at 3-min intervals with a single stimulation train.Figure 6 shows the accommodation curves on a longer time-scale, illustrating that apparent brightness does not recoverover a 16-min period following an initial 50 stimulationsequence lasting 200 s.
Wider stimulation PDs appeared to reduce the effects ofbrightness accommodation with repeated stimulation.Figure 7 shows the brightness accommodation with PDs of400 and 800 (is. Three hundred trains were first presentedwith PD = 400 (xs (I = 28 \iA, F = 200 Hz, TL = 250 ms,ITI = 4000 ms). The subject reported an initial decay inbrightness over the first 25 trials, a relatively constantbrightness for the next 130 trials and then a gradual decayto the end of the experiment. After 2 h of rest, a second
microelectrode 21micro* tectrode 28microelectrodes
200 400 600 800
Time of stimulation (s)
1000 1200
Fig. 6 Phosphene brightness accommodation and recoveryproduced by repeated stimulation of the three microelectrodes.The order of microelectrode stimulation was 21, 28 and 3. Themicroelectrodes were stimulated first at 4 s intervals for theaccommodation portion of the test followed by stimulation onceevery 200 s to ascertain the level of brightness recovery.Stimulation parameters: F = 200 Hz, PD = 200 us, TL = 125 ms.
60 75 100 126 160 176 200 226 260 276 300
Stimulation event number
Fig. 7 Repeated stimulation with two different pulse widths. Theperceived relative phosphene brightness produced with PDs of400 us G = 28 uA, F = 200 Hz, TL = 250 ms, ITI = 4000 ms)and after 2 h of rest with PDs of 800 us 0 = 19 u,A, otherparameters the same).
accommodation experiment was conducted with the sameparameters except PD was 800 us and I was 19 uA. Thebrightness again rapidly decreased during the first 25 trialsand then remained relatively stable for the next 250 trials.The brightness accommodation curves for both the 400 and800 (is PDs were similar over the first 150 stimulations withthe phosphenes produced at 800 (is being slightly brighter.Beyond 150 stimulations, there was a consistent separationin the brightness curves, with the perceived brightness of thephosphenes produced by the 800 |is PDs being greater thanthose produced by the 400 (is PDs.
Brightness modulationEffects of pulse durationThe relative brightness of phosphenes was determined from20 consecutive trials at PDs of 400, 800 and 1000 us,
by guest on April 5, 2011
brain.oxfordjournals.orgD
ownloaded from

Visual prosthesis 515
6
5.5
6
4.5
35
3
j» 2IS
EC 1 5
05
0
- PD = 400 tis
-P0«800n»
-PO=1000ns
0 5 tO 15 20 25 30 3b 40 45 50 56 80 85 70 75 SO 85 90 95 100
Stimulation event number
Fig. 8 Relative brightness using microelectrode 18 with differentstimulation PDs. Twenty stimulations were performed at each PD.Stimulation parameters: I = 20 uA, CF, F = 200 Hz, TL =250 ms, ITI = 4000 ms.
respectively. Figure 8 shows that the majority of phosphenesproduced by the 800 and 1000 us pulses were brighter thanthose produced with 400 (is pulses. The current for all trialswas the same but the total charge injected per stimulationpulse was a function of the PDs.
Effects of TLThree different TLs were evaluated for their effects onperceived brightness (microelectrode 18: F = 200 Hz, PD =400 us, AF, TL = 65, 125 or 250 ms). The level of current(33 uA) was selected to be 1.5 times threshold for theshortest TL. When the TL was alternated between 250 and65 ms, the phosphenes were always brighter with the longertrain of pulses. On two occasions, the phosphenes were notobserved with the 65 ms pulse train. When the TL was either125 or 250, the 250 ms train usually produced a slightincrease in brightness over the 125 ms train. However,the decrease in brightness from accommodation during theperiods of repeated stimulation at each TL was greater thanthis increase. The subject reported that all of the phosphenesin the TL experiments looked alike, except for the differencein brightness.
Effect of stimulation frequencyWhen either the TL or the number of stimulation pulses washeld constant, the threshold current declined as the F ofstimulation increased from 50 to 200 Hz.
To determine the effects of F on the perceived brightnessof phosphenes, the stimulation F was alternated between 100and 200 Hz while the current and TL were held constant(microelectrode 18: I = 25 uA, PD = 400 us, TL = 250 ms,CF, ITI = 4000 ms). Except for three consecutive stimulationswhen the brightnesses were equal, the brightness of the 100Hz stimulation was always lower than the preceding 200 Hzstimulation. During two stimulation trials at 100 Hz, aphosphene was not observed.
Visual phenomena caused by after-dischargeVisual phenomena apparently caused by after-dischargesfollowing stimulation occurred on three occasions, all withthe same microelectrode (number 18). The first was detectedduring stimulation with a continuous 20 Hz pulse train (PD =200 us, CF, biphasic pulses) that was interrupted with a highfrequency 125 ms pulse train (F =200 Hz, PD = 200 us,CF, biphasic pulses) occurring every 4 s. The current levelwas twice threshold (42 uA) for the high frequency burst ofstimulation, but was below threshold for the 20 Hz pulsetrain. After the third high F stimulation train, the phosphenedid not extinguish. The stimulator was turned off but thesubject continued to see something, apparently produced byan after-discharge. During stimulation, the phosphene wasreported to be an amorphous white-grey pea-sized spot.The visual percept persisted for 6 min after cessation ofstimulation. Over this period it became more diffuse,gradually expanding from pea size to fill the upper leftquadrant of the visual field, becoming multi-coloured as itgrew larger.
Four minutes after the end of the after-discharge a thresholdcurrent determination was performed. During the firststimulation train at 15 uA, a phosphene appeared andremained on after the termination of the train. The new after-discharge started in the periphery of the visual field wherethe last after-discharge had ended, and proceeded to fill theupper left quadrant. The second after-discharge lasted for 9min. Further stimulation of this microelectrode was abortedfor the day.
Two weeks later, another after-discharge was producedwith stimulation of the same microelectrode. Approximately640 stimulation trains were presented prior to the developmentof an after-discharge. After a set of 165 stimulus trains at25 uA (CF, F = 50 Hz, PD = 400 us, TL = 250 ms), a 2-strain of continuous stimulation (same parameters except TL)produced an after-discharge. The original phosphene wasreported to be a 'BB' sized (4 mm diameter) greyish-whitespot of reflected light. After cessation of stimulation, as theafter-discharge progressed, the phosphene became larger andbrighter. Four minutes after the end of stimulation it was thesize of a 'quarter' (24 mm diameter coin), with differentparts appearing as different colours. It moved as the subjectmoved her eyes. By 7 min, the size had grown to that of a'half dollar' (30 mm diameter coin). It slowly enlarged tofill the left hemi-field with the brightest area near theperiphery. Although this visual phenomenon disappearedafter 25 min, the subject felt that a bright light was pulsatingbeyond the extent of her visual field, especially in the regionbetween 9 and 12 o'clock. There were no further after-discharges during the remaining stimulation sessions, and atall times the subject remained fully alert; she never showedany signs of motor seizures.
While the after-discharge triggered by stimulation ofmicroelectrode 18 was still present, the phosphene producedby stimulation of microelectrode 12 (-4.3 mm from
by guest on April 5, 2011
brain.oxfordjournals.orgD
ownloaded from

516 E. M. Schmidt et al.
microelectrode 18) was determined to have a threshold of22.5 \iA, to be light yellow in colour and was easily perceivedsuperimposed on the visual phenomena generated by theafter-discharge. Five hours earlier, the threshold ofmicroelectrode 12 had been 15 ^iA, and the resultingphosphene was white. Thirty-five minutes after the end ofthe after-discharge, the threshold of microelectrode 12 haddropped to 15.4 \iA. The threshold of microelectrode 6 (~10mm from microelectrode 18) was tested 1 min after the endof the after-discharge and found to be 29.9 pA. Four hoursearlier, the threshold had been 20 (lA. The threshold ofmicroelectrode 6 dropped in value as time progressed afterthe end of the after-discharge. After 33 min the thresholdwas 24 (iA, and 21.5 |xA after 42 min.
Multiple phosphenes from a singlemicroelectrodeDepending on stimulation parameters, an individualmicroelectrode could either produce a single phosphene or apair. Stimulation of microelectrode 18 at 3.6 \iA (F =150 Hz, PD = 600 \is, TL = 250 ms) produced a singlephosphene. Increasing the current to 7.75 |iA produced apair. The high threshold phosphene appeared above the lowthreshold phosphene, was 'fuzzy' while the low thresholdphosphene was 'distinct, the size of a BB and just touchingthe high threshold phosphene'.
Microelectrode 12 also produced either one or twophosphenes depending on the stimulation current level. Thelow threshold phosphene appeared at 15.2 uA, while the pairappeared at 19.8 |iA. These two phosphenes were describedas being white-grey, round and solid, equal or greater in sizethan a pin-point and almost touching. These two phosphenesappeared above the phosphenes produced by microelectrode18, were in a straight line and all four phosphenes werealmost touching.
Microelectrodes 32 and 33 were 250 |im apart in thecortex and their stimulus fields were found to interact. Becausethe electrical characteristics of the two microelectrodes werealmost identical, they were connected in parallel to the outputof a single stimulator. With simultaneous stimulation of thetwo microelectrodes, approximately one-half of the totalcurrent flowed through each. The first phosphene appearedat a current level of 22.4 (lA (AF), and 'looked like a yellow-orange light, greater than a pin-point in size'. The secondphosphene appeared at a current level of 36 \xA, was 'bluish,less than a BB below the first and in a straight line with thephosphenes produced by microelectrodes 12 and 18'.
Phosphene mapsA typical phosphene 'dart board' map referred to thesubjective centre of gaze (see Material and methods) is shownin Fig. 9. All of the phosphenes were in the left hemi-fieldwith all but two above the horizontal meridian. There was a
12-00
11-00
10:00
9:00
Fig. 9 Phosphene map obtained by having the patient place a dartin a dart board at the perceived location in visual space after eachmicroelectrode was stimulated. The circular dart board wasdivided as the face of a clock with five concentric annular zonesrepresenting angular deviations from the most central (0°) to themost peripheral (80°) the subject remembered when she hadvision. The large circle at -22° represents a region that contained10 phosphenes whose individual locations could not be separatedby this mapping technique.
large clustering of phosphenes from 10 microelectrodes at~22° eccentricity and slightly above the horizontal meridian.
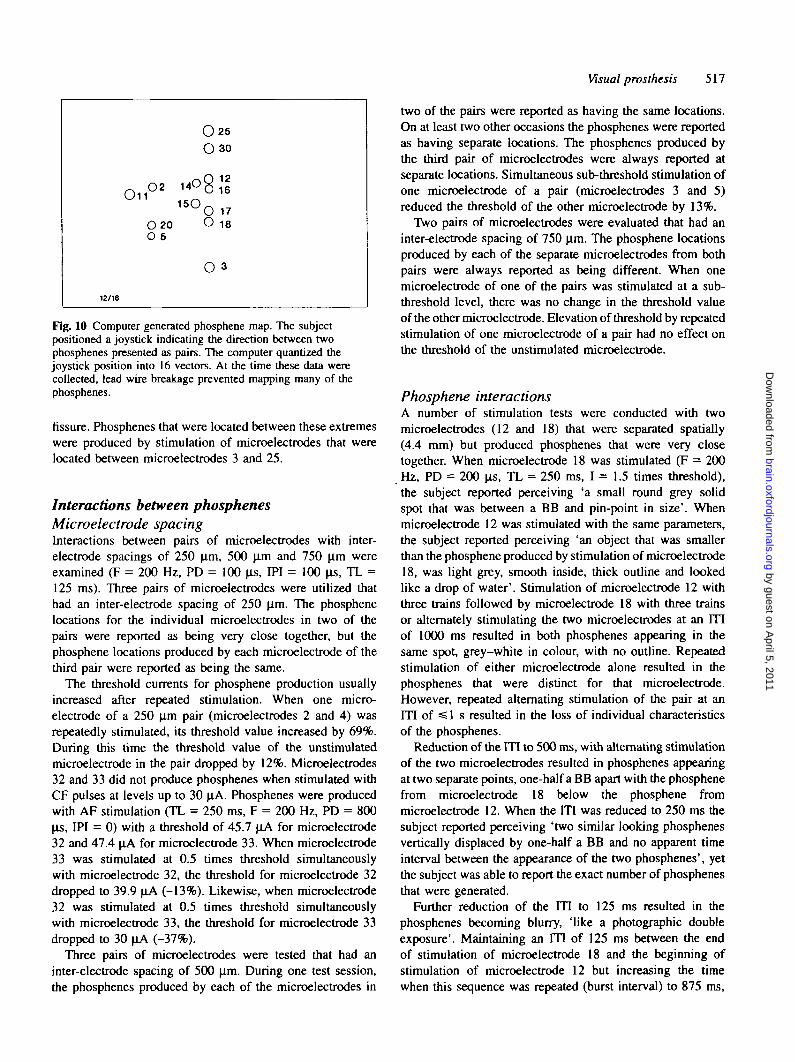
With a second position mapping technique the relativedirection between pairs of phosphenes as indicated by acomputer-coupled joystick was plotted (see Material andmethods). Figure 10 shows a map generated by this technique.A number of the phosphenes that appeared at the samelocation with the dartboard technique (see Fig. 9) were foundto be at separate locations with joystick mapping. This secondmap provided more information as to the relative location ofthe phosphenes, but did not contain information on theabsolute spacing between phosphenes or the location of themap in the perceived visual space. This latter informationwas obtained from the subject through verbal descriptions ofthe size, location and spacing between specific phosphenes.
There was a fairly good relationship between an invertedmap of computer located phosphene positions shown inFig. 10 and the placement of microelectrodes in the visualcortex shown in Fig. 3. Stimulation of microelectrode 3produced a phosphene that was the lowest in the visual field,near the horizontal meridian. This microelectrode was locatedsuperior to the calcarine fissure. Stimulation of microelectrode25 produced a phosphene that was highest in perceived visualspace and the microelectrode was inferior to the calcarine
by guest on April 5, 2011
brain.oxfordjournals.orgD
ownloaded from
Visual prosthesis 517
~ 02O11
0 2 0O 5
12/18
OO
14O815OQ
O
O
25
30
1216
1718
3
Fig. 10 Computer generated phosphene map. The subjectpositioned a joystick indicating the direction between twophosphenes presented as pairs. The computer quantized thejoystick position into 16 vectors. At the time these data werecollected, lead wire breakage prevented mapping many of thephosphenes.
fissure. Phosphenes that were located between these extremeswere produced by stimulation of microelectrodes that werelocated between microelectrodes 3 and 25.
Interactions between phosphenesMicroelectrode spacingInteractions between pairs of microelectrodes with inter-electrode spacings of 250 urn, 500 nm and 750 |im wereexamined (F = 200 Hz, PD = 100 |ls, IPI = 100 us, TL =125 ms). Three pairs of microelectrodes were utilized thathad an inter-electrode spacing of 250 |im. The phosphenelocations for the individual microelectrodes in two of thepairs were reported as being very close together, but thephosphene locations produced by each microelectrode of thethird pair were reported as being the same.
The threshold currents for phosphene production usuallyincreased after repeated stimulation. When one micro-electrode of a 250 urn pair (microelectrodes 2 and 4) wasrepeatedly stimulated, its threshold value increased by 69%.During this time the threshold value of the unstimulatedmicroelectrode in the pair dropped by 12%. Microelectrodes32 and 33 did not produce phosphenes when stimulated withCF pulses at levels up to 30 uA. Phosphenes were producedwith AF stimulation (TL = 250 ms, F = 200 Hz, PD = 800(is, IPI = 0) with a threshold of 45.7 jiA for microelectrode32 and 47.4 |iA for microelectrode 33. When microelectrode33 was stimulated at 0.5 times threshold simultaneouslywith microelectrode 32, the threshold for microelectrode 32dropped to 39.9 |iA (-13%). Likewise, when microelectrode32 was stimulated at 0.5 times threshold simultaneouslywith microelectrode 33, the threshold for microelectrode 33dropped to 30 nA (-37%).
Three pairs of micToelectrodes were tested that had aninter-electrode spacing of 500 u,m. During one test session,the phosphenes produced by each of the microelectrodes in
two of the pairs were reported as having the same locations.On at least two other occasions the phosphenes were reportedas having separate locations. The phosphenes produced bythe third pair of microelectrodes were always reported atseparate locations. Simultaneous sub-threshold stimulation ofone microelectrode of a pair (microelectrodes 3 and 5)reduced the threshold of the other microelectrode by 13%.
Two pairs of microelectrodes were evaluated that had aninter-electrode spacing of 750 urn. The phosphene locationsproduced by each of the separate microelectrodes from bothpairs were always reported as being different. When onemicroelectrode of one of the pairs was stimulated at a sub-threshold level, there was no change in the threshold valueof the other microelectrode. Elevation of threshold by repeatedstimulation of one microelectrode of a pair had no effect onthe threshold of the unstimulated microelectrode.
Phosphene interactionsA number of stimulation tests were conducted with twomicroelectrodes (12 and 18) that were separated spatially(4.4 mm) but produced phosphenes that were very closetogether. When microelectrode 18 was stimulated (F = 200Hz, PD = 200 ^s, TL = 250 ms, I = 1.5 times threshold),the subject reported perceiving 'a small round grey solidspot that was between a BB and pin-point in size'. Whenmicroelectrode 12 was stimulated with the same parameters,the subject reported perceiving 'an object that was smallerthan the phosphene produced by stimulation of microelectrode18, was light grey, smooth inside, thick outline and lookedlike a drop of water'. Stimulation of microelectrode 12 withthree trains followed by microelectrode 18 with three trainsor alternately stimulating the two microelectrodes at an ITIof 1000 ms resulted in both phosphenes appearing in thesame spot, grey-white in colour, with no outline. Repeatedstimulation of either microelectrode alone resulted in thephosphenes that were distinct for that microelectrode.However, repeated alternating stimulation of the pair at anITI of ^ 1 s resulted in the loss of individual characteristicsof the phosphenes.
Reduction of the ITI to 500 ms, with alternating stimulationof the two microelectrodes resulted in phosphenes appearingat two separate points, one-half a BB apart with the phosphenefrom microelectrode 18 below the phosphene frommicroelectrode 12. When the ITI was reduced to 250 ms thesubject reported perceiving 'two similar looking phosphenesvertically displaced by one-half a BB and no apparent timeinterval between the appearance of the two phosphenes', yetthe subject was able to report the exact number of phosphenesthat were generated.
Further reduction of the ITI to 125 ms resulted in thephosphenes becoming blurry, 'like a photographic doubleexposure'. Maintaining an ITI of 125 ms between the endof stimulation of microelectrode 18 and the beginning ofstimulation of microelectrode 12 but increasing the timewhen this sequence was repeated (burst interval) to 875 ms,
by guest on April 5, 2011
brain.oxfordjournals.orgD
ownloaded from

518 E. M. Schmidt et al.
the subject reported that 'phosphenes were now clear andseparated in space by one half a BB'. Reducing the ITI to75 ms and the burst interval to 400 ms resulted in blurryphosphenes, but an accurate count of the number ofphosphenes generated was maintained.
The last interaction experiment involved alternatelystimulating microelectrodes 12 and 18 with interleavedbiphasic pulses separated by 1 ms (F = 200 Hz, TL =250 ms), i.e. microelectrode 18 was stimulated with onebiphasic pulse pair followed 1 ms later with stimulationof microelectrode 12. The subject reported 'two verticallyoriented phosphenes that appeared at the same time, weretouching each other, and were at the same general locationas in the previous experiments'.
Current adjustments for multiple phosphenesWhen multiple phosphenes were produced by stimulation oftwo or more microelectrodes, dim phosphenes could beovershadowed by bright phosphenes and not perceived. Forthe subject to perceive all phosphenes in a group, adjustmentsof the individual stimulating currents were required. Nearthe end of testing when up to six phosphenes could besimultaneously generated, the subject was allowed to adjustthe current levels of the individual microelectrodes such thatall six phosphenes could be perceived. Allowing the subjectto make adjustments of stimulation parameters significantlyenhanced the perception of multiple phosphenes.
Perceived distance of multiple phosphenesWhen pairs of phosphenes were produced by the simul-taneous stimulation of two microelectrodes, the distances ofindividual phosphenes were modified, but usually did notbecome equidistant. For example, when microelectrode 5was individually stimulated, the perceived distance was 25 cmin front of the subject. However, when this microelectrodewas stimulated together with any one of five other micro-electrodes, the apparent distance of the phosphenes producedby microelectrode 5 ranged between 20 and 60 cm. Inexperiments when three or more phosphenes were simultan-eously generated, they appeared equidistant from the subject.
Percepts from multiple phosphenesWhen three single phosphenes were produced with currentsnear threshold (microelectrodes 12, 18 and 32 in parallelwith 33) the subject described them as closely spaced in avertical orientation. When currents were increased to a levelwhen six phosphenes were perceived, the subject felt thatthe initial phosphenes moved to allow space for the newphosphenes. During the presentation of these six simultaneousphosphenes that were in a vertical orientation and all justtouching, the subject reported that the size of the resultantimage was adequate to form a letter of the alphabet, such asT or the branch of a letter such as 'M'. The subject stated
that, because the multiple phosphenes looked alike and wereequidistant from her, more complex patterns or images shouldbe easier to interpret than if each phosphene had its ownunique depth, size, colour, shape and texture.
Perceptual changes with multiple phosphenesWhen multiple phosphenes were simultaneously generated,some of the distinctive characteristics of the individualphosphenes were lost. For example, when six phospheneswere simultaneously generated, all phosphenes appeared tobe equidistant from the subject and similar in appearance.The subject could no longer identify which microelectrodeproduced which phosphene.
While testing the spatial orientation of the six simultan-eously generated phosphenes, the stimulation TL waschanged. At 250 ms, the subject reported that the phosphenesappeared simultaneously in a vertical line. When the TL wasincreased to 375 ms or greater, the phosphenes that formeda vertical line of touching dots appeared to come on quicklyfrom bottom to top. When the TL was 333 ms or below, thesubject reported that the six phosphenes appeared at thesame time.
Phosphene movementWhen the subject observed phosphenes, she concentrated onkeeping her eyes straight ahead. When she was asked tomove her eyes, the position of the perceived phosphene movedin the direction of eye movements. When six simultaneousphosphenes in a vertical line were produced, the phosphenesmoved in the direction of eye movement and maintained thevertical alignment.
DiscussionAfter 22 years of blindness, our subject was consistently ableto perceive small spots of light at stable locations in visualspace, using ICMS. This is in contrast to the diffuse phos-phenes produced by surface stimulation in a subject blindfor over 30 years (Rushton and Brindley, 1978). The currentlevels for phosphene generation with ICMS are also verylow, being two orders of magnitude less than is requiredwhen surface stimulation is employed.
Stimulation parametersA number of different stimulation parameters was investigatedto determine design information for a visual prosthesis. Theinitial studies centred on finding the most energy efficientset of stimulus parameters (Geddes and Bourland, 1985).However, the subject indicated that the most efficientparameters did not necessarily produce the most easilyrecognized phosphenes. Instead we determined a set ofstimulation parameters (CF, charge-balanced biphasic pulses,F = 150 Hz, PD of -500 us, IPI = 0, TL = 250 ms, ITI of
by guest on April 5, 2011
brain.oxfordjournals.orgD
ownloaded from

Visual prosthesis 519
1-4 s) that produced phosphenes the subject could easilydetect and that we could use for assessment of phosphenestability over the several months of testing.
Pulse durationWith ICMS, our subject preferred the phosphenes generatedby longer duration pulses (5=400 (is) because they appeared'more substantial'. Phosphenes produced with 400 (is pulsesrequired only 25% more energy than those generated with200 (is pulses, because the peak currents were less.
Dobelle and Mladejovsky (1974), using surface stimula-tion, found that there was little effect on subjective sensationwhen PD was varied between 250 and 2000 us. However,Brindley (1973) found that short pulses produced morespatially diffuse phosphenes than long pulses.
FlickerWith ICMS of the primary visual cortex in sighted subjects(Bak et al, 1990) and in our blind subject, all phospheneshave appeared as a constant percept without flicker. This isin contrast to some of the reports from both sighted and blindsubjects who have perceived phosphenes from stimulation ofthe surface of the visual cortex. With both of Brindley'sblind subjects (Brindley and Lewin, 1968; Rushton andBrindley, 1978), all phosphenes flickered at a rate of ~10 s"1
regardless of stimulation parameters. Dobelle et al. (1974)found that surface stimulation of a subject who had beenblind for 28 years caused flickering phosphenes. A subjectblind for 7 years, experienced some phosphenes that flickeredand some that did not when the primary visual cortex wasstimulated, but all phosphenes flickered when surroundingassociation areas were stimulated. With sighted subjects,Dobelle and Mladejovsky (1974) noted that phosphenes mayor may not flicker with surface stimulation. Pollen (1975)noted that phosphenes produced with surface stimulation ofvisual cortex in sighted subjects did not flicker. It is not clearwhy some subjects experience flicker nor whether it wouldbe detrimental to the function of a visual prosthesis.
Phosphene distanceWith ICMS of visual cortex, we found that individuallyelicited phosphenes usually appeared to be at differentdistances, but when two microelectrodes were simultaneouslystimulated, the apparent distance of each phospheneapproached an equidistant position. However, when threeor more phosphenes were simultaneously produced, theyappeared to be equidistant. In previous reports using surfacestimulation (Dobelle and Mladejovsky, 1974; Dobelle et al,1974; Rushton and Brindley, 1978), subjects also haveperceived phosphenes at different distances from their eyeswhen individual electrodes were stimulated and when two ormore electrodes were simultaneously stimulated, the subjectsreported that the phosphenes were at the same distance
(Dobelle and Mladejovsky, 1974; Dobelle et al, 1974). Sincemost images that would be produced by a visual prosthesiswould result from the simultaneous activation of a numberof microelectrodes, all of the resultant phosphenes wouldprobably appear at the same distance from the subject. Oursubject felt that this would make pattern recognition easierfor her.
Phosphene latencyA subject's phosphene onset and extinction reaction timesprovide data on the possible rate at which visual informationcan be transferred to the CNS by stimulation of the visualcortex. Onset reaction time measures both the time forconscious perception of a phosphene plus the time requiredto produce a motor output signalling this perception.
With ICMS of two different microelectrodes, we obtainedaverage onset reaction times of 395 and 452 ms. Pollen(1975) stimulated a surface electrode in one of his subjectsand obtained onset reaction times of 480-650 ms at athreshold current of 1.0 mA. When the current was increasedto 1.5 mA, the onset reaction times ranged between 292 and365 ms. Rushton and Brindley (1978) measured an averageonset reaction time produced by surface stimulation of 174.3ms. The sizes of the phosphenes for this subject were quitelarge (~4°xll°). The onset reaction time values that weobtained with ICMS fall between those reported by Pollen(1975) at threshold and those at 1.5 times thresholdstimulation, but are much longer than those reported byRushton and Brindley (1978). Pollen's (1975) tests indicatedthat increased phosphene brightness was associated withreduced onset reaction time.
With the ICMS onset reaction times we have observed, asubject may only be capable of recognizing three to fourindividual phosphenes per second. Similar studies have notbeen conducted when two or more phosphenes are generatedsimultaneously. Since both increased size and brightness ofa visual stimulus are associated with reduced reaction time(Kohfeld, 1971; Mansfield, 1973; E. M. Schmidt andJ. A. Bragg, unpublished results), one would assume that theonset reaction time would decrease when multiple phosphenesare simultaneously elicited, resulting in useful informationtransfer rates for a visual prosthesis.
Phosphene extinction reaction time provides informationon the actual duration of a phosphene. Pollen (1975), usingsurface stimulation and TLs of 2000 ms, found that somephosphenes could be longer than 2000 ms, suggestingpersistence due to after-discharge. With Brindley's secondsubject (Rushton and Brindley, 1978), extinction reactiontime measurements were not conducted because 'continuoustrains of several seconds result in fading and persistence ofthe phosphene', again suggesting after-discharges.
Using ICMS with TLs up to 750 ms, our subject's perceivedphosphenes were of similar durations, while with longer TLsthe phosphenes extinguished prior to the termination ofstimulation. We have tentatively concluded, pending further
by guest on April 5, 2011
brain.oxfordjournals.orgD
ownloaded from

520 E. M. Schmidt et al.
study, that stimulation TLs should be < 1 s to minimize thepossibility of after-discharges or phosphene termination priorto the end of stimulation.
15 s of continuous stimulation. Regardless of what causesaccommodation, this phenomenon must be accounted for inthe design of a useful visual prosthesis.
Phosphene repetition rateIn the present study, we found that interrupted pulse trainstimulation (ITI = 25 ms) extends the duration of theperception of a continuous phosphene and also reduced thetotal energy transfer of the stimulation system. With surfacestimulation, Pollen (1975) found that introduction of a 24ms ITI resulted in a continuous phosphene that did not flicker.When the ITI was 30 ms, the phosphene seemed to flicker alittle and at 80 ms the phosphene was definitely flickering.These results indicate that more efficient stimulation can beproduced by introducing short gaps in the stimulation train.
Brightness accommodationThe first stimulations each day produced phosphenes thatwere much brighter than those produced after long periodsof stimulation. One factor that might influence this brightnessaccommodation to repeated stimulation is the amount ofneuronal activity that the cortex has experienced over time.The primary visual cortex of a person blind for a long timemust experience significantly modified neuronal activity overthis period. Initial electrical stimulation may produce a rapidfatigue of neuronal circuitry, but as stimulation is repeatedover many days the neurons may become more fatigueresistant. There was some evidence to support this hypothesisfrom the large accommodation that occurred early in thestudy (Fig. 5) compared with the relatively small amount ofaccommodation seen after several months of testing (Fig. 8).The latter accommodation may also be due to the inactivationof neurons close to the microelectrode, where higher currentdensities are present, resulting in fewer neurons respondingto each stimulus train as time progresses.
Knowing the rates of brightness accommodation andrecovery after stimulation, one might, in principle, be ableto predict phosphene brightness from the past history ofstimulation, and adjust stimulation parameters to producephosphenes of a more constant brightness. The rapid initialaccommodation and slow and variable brightness recoverythat we found with our subject suggest that it is not feasibleto maintain phosphene brightness simply from knowing thepast history of stimulation, at least in individuals blind for along period of time.
With surface stimulation, the reports on brightnessaccommodation in the literature are varied. Brindley foundthat continuous stimulation of 30 min in a subject who wasrecently blind, produced a phosphene that did not fade(Brindley and Rushton, 1977). On the other hand, a subject,who had been blind for over 30 years, was unable to perceivecontinuous phosphenes of several seconds (Rushton andBrindley, 1978). With sighted subjects, Dobelle andMladejovsky (1974) found that phosphenes faded after 10-
Brightness modulationAll of the stimulation parameters that we have investigated(I, F, PD and TL) have an effect on phosphene brightness,although brightness accommodation can mask brightnessvariations due to parameter changes. Previous studies thatused surface stimulation (Dobelle and Mladejovsky, 1974;Dobelle et al, 1974; Pollen, 1975; Rushton and Brindley,1978; Evans et al, 1979; Henderson et al, 1979) have alsoindicated that most parameters affect the brightness of theperceived phosphenes. Evans et al. (1979) noted that currentwas the most potent variable in determining phosphenebrightness. Rushton and Brindley (1978) estimated that theirsubject could distinguish at least 12 levels of brightnesswhile Evans et al (1979) estimated that one of their subjectscould distinguish five to eight levels of brightness. All of thetests with surface stimulation were conducted with long timeintervals between stimulation trains so that accommodationin phosphene brightness should not have been significant.In a practical visual prosthesis, phosphene repetition rateswill undoubtedly be high enough that some brightnessaccommodation will occur, at least in some subjects. Thisaccommodation might limit the number of brightness levelsthat can be utilized.
Another factor that may further limit the range of usefulphosphene brightness modulation is the masking of dimphosphenes by nearby bright phosphenes. When sixphosphenes were generated with ICMS, adjustments ofindividual microelectrode currents were required before thesubject saw all of them simultaneously. This is similar tothe results reported by Dobelle et al. (1974) with surfacestimulation of the visual cortex.
Multiple phosphenes from a singlemicroelectrodeMultiple phosphenes from a single electrode were originallyreported by Brindley and Lewin (1968). Stimulation ofindividual electrodes on the cortical surface could produceone, two, three or a cluster of 10 or more phosphenes over15° of visual field. In addition, some electrodes produced asingle phosphene at low levels of stimulation and a secondphosphene in another part of the visual field with highlevels of stimulation. Two different mechanisms might beresponsible. The first may involve the stimulation of multipleadjacent cortical columns that produce closely spacedphosphenes, while the second (particularly with surfaceelectrodes) could result from current spread to adjoining gyrion the surface of the cortex resulting in widely spacedphosphenes.
Dobelle and Mladejovsky (1974) also reported clusters of
by guest on April 5, 2011
brain.oxfordjournals.orgD
ownloaded from

Visual prosthesis 521
phosphenes produced from some surface electrodes and couldnot find a level of current that would produce just a singlephosphene. They were also able to generate one or twophosphenes with other electrodes depending on the level ofstimulation. The second phosphene was a conjugate of thefirst inverted about the horizontal meridian.
Shakhnovich et al. (1982) also reported the production ofone or two phosphenes with intracortical stimulation thatdepended on the level of excitation, but did not indicate therelative locations of the two phosphenes.
With our subject, using ICMS, we were able to produceone or two phosphenes depending upon the current level.The production of the second nearby phosphene occurredwhen stimulation current levels were as low as 1.3 and ashigh as 2.2 times threshold for a single phosphene.
The generation of multiple phosphenes with individualmicroelectrodes appears to be a function of the stimulationparameters. If the second phosphene is always spatially closeto the first, as has always been the case with ICMS, then thesecond phosphene could easily be included in the processingand presentation of images for a visual prosthesis. If thesecond phosphene is at a considerable distance from the first,as has been observed with surface stimulation, a significantproblem might exist in image generation for a visualprosthesis.
Electrode spacingWhen two electrodes on the surface of the cortex aresimultaneously stimulated, subjects report either one or twophosphenes depending on the distance between the electrodes.Brindley and Lewin (1968) and Brindley (1973) reportedthat electrodes spaced 2.4 mm apart produced either singlephosphenes or pairs of phosphenes depending on their locationon the visual cortex. Dobelle et al. (1974) confirmed theseresults and stated that 2-3 mm separation between electrodeswas required to produce separate phosphenes when electrodeswere simultaneously stimulated. Pollen's results (Pollen,1975) suggested that electrodes had to be spaced 5 mm apartbefore separate phosphenes were observed. These largespacings would significantly limit the number of electrodesand the ultimate resolution in a functional visual prosthesisbased on surface stimulation.
Our earlier work (Bak et al., 1990), with intracorticalmicroelectrodes in sighted individuals, showed that simultan-eous stimulation of two microelectrodes with a spacing of0.3 mm produced a single phosphene, while stimulation oftwo microelectrodes spaced 0.7-1 mm produced two separatephosphenes. In our current study, we found that simultaneousstimulation of microelectrodes spaced 0.5 mm usuallyproduced separate phosphenes, while at times microelectrodesspaced 0.25 mm apart could produce separate phosphenes.This resolution is about five times finer than with surfacestimulation. These results suggest that the spatial density ofintracortical microelectrodes can be roughly an order of
magnitude greater than can be obtained with surfaceelectrodes.
Phosphene movementFor a feasible visual prosthesis, simultaneously generatedphosphenes must move as a group with eye movements andretain the same positional orientation. We found that a groupof six phosphenes, produced with ICMS, moved with eyemovements and maintained the same orientation regardlessof eye position. When Dobelle et al. (1974) simultaneouslystimulated a group of surface electrodes, the subject reportedthat all phosphenes moved proportionally with eye movementand that their relative position did not change. Thus bothsurface and intracortical stimulation can produce a pattern ofphosphenes that remain stable with respect to each otherduring eye movements.
Pattern recognitionDue to the breakage of lead wires early in the experimentonly limited tests were conducted on pattern recognition.When a group of six phosphenes were produced that formeda series of closely spaced dots with a vertical orientation,the subject felt that the size of the resultant image would beadequate to represent a letter T or one leg of the letter 'M'.These results suggest that a 5X7 array of phosphenes mightbe adequate to represent the alphabet for a reading aid. Toincrease reading speed, multiple letters would probably needto be produced simultaneously.
Concluding remarksThe results of this study on visual cortex ICMS in a subject,blind for 22 years, are very encouraging in terms of thefeasibility of a visual prosthesis. Because the currents requiredfor the production of phosphenes with intracortical micro-electrodes were two to three orders of magnitude smallerthan those required for surface stimulation, microelectrodescan be placed about five times closer together beforesignificant interactions occur. In addition, the overall powerrequirements of an intracortical stimulating system would stillbe smaller than a lower resolution surface stimulating system.
Further studies with blind subjects are required foroptimizing stimulation parameters. In addition, the implant-ation of several hundred microelectrodes will be essential fordetermining a blind subject's ability to recognize compleximages and evaluate information transfer rates. With thisinformation, it should be possible to determine the feasibilityof a visual prosthesis based on ICMS.
AcknowledgementsThe authors would like to express their sincere appreciationto our research subject, Mary Anne, whose courage,enthusiasm and dedication will never be forgotten and to her
by guest on April 5, 2011
brain.oxfordjournals.orgD
ownloaded from

522 E. M. Schmidt et al.
family for their understanding and steadfast support. We alsowish to thank Drs E. Streicher, R. Burke, E. Oldfield, R. Porterand M. Goldstein for their encouragement. The originalcomputer programs for patient testing were developed byS. Charagundla. The National Institutes of NeurologicalDisorders and Stroke provided support for this project.P. Vallabhanath is an NIH Research Scholar.
ReferencesBak M, Girvin JP, Hambrecht FT, Kufta CV, Loeb GE, SchmidtEM. Visual sensations produced by intracortical microstimulationof the human occipital cortex. Med Biol Eng Comput 1990; 28:257-9.
Brindley GS. Sensory effects of electrical stimulation of the visualand paravisual cortex in man. In: Jung R, editor. Handbook ofsensory physiology, Vol. VII/3. Berlin: Springer-Verlag, 1973:583-94.
Brindley GS, Lewin WS. The sensations produced by electricalstimulation of the visual cortex. J Physiol (Lond) 1968; 196: 479-93.
Brindley GS, Rushton DN. Observations on the representation ofthe visual field on the human occipital cortex. In: Hambrecht FT,Reswick JB, editors. Functional electrical stimulation: applicationsin neural prostheses. New York: Marcel Dekker, 1977: 261-76.
Brindley GS, Donaldson PEK, Falconer MA, Rushton DN. Theextent of the region of occipital cortex that when stimulated givesphosphenes fixed in the visual field. J Physiol (Lond) 1972; 225:57P-8P.
Dobelle WH, Mladejovsky MG. Phosphenes produced by electricalstimulation of human occipital cortex, and their application to thedevelopment of a prosthesis for the blind. J Physiol (Lond) 1974;243: 553-76.
Dobelle WH, Mladejovsky MG, Girvin JP. Artificial vision for theblind: electrical stimulation of visual cortex offers hope for afunctional prosthesis. Science 1974; 183: 440—4.
Dobelle WH, Mladejovsky MG, Evans JR, Roberts TS, Girvin JP.'Braille' reading by a blind volunteer by visual cortex stimulation.Nature 1976; 259: 111-12.
Evans JR, Gordon J, Abramov I, Mladejovsky MG, Dobelle WH.Brightness of phosphenes elicited by electrical stimulation of humanvisual cortex. Sens Processes 1979; 3: 82-94.
Geddes LA, Bourland JD. The strength-duration curve. IEEE TransBiomed Eng 1985; 32: 458-9.
Henderson DC, Evans JR, Dobelle WH. The relationship betweenstimulus parameters and phosphene threshold/brightness, duringstimulation of human visual cortex. Trans Am Soc Artif InternOrgans 1979; 25: 367-71.
Kohfeld DL. Simple reaction time as a function of stimulus intensityin decibels of light and sound. J Exp Psychol 1971; 88: 251-7.
Loeb GE, Bak MJ, Salcman M, Schmidt EM. Parylene as achronically stable, reproducible microelectrode insulator. IEEE TransBiomed Eng 1977; 24: 121-8.
Mansfield RJW. Latency functions in human vision. Vision Res1973; 13: 2219-34.
Mladejovsky MG, Eddington DK, Evans JR, Dobelle WH. Acomputer-based brain stimulation system to investigate sensoryprostheses for the blind and deaf. IEEE Trans Biomed Eng 1976;23: 286-96.
Pollen DA. Some perceptual effects of electrical stimulation of thevisual cortex in man. In: Tower DB, editor. The nervous system,Vol. 2: the clinical neurosciences. New York: Raven Press, 1975:519-28.
Robblee LS, Lefko JL, Brummer SB. Activated In an electrodesuitable for reversible charge injection in saline solution. JElectrochem Soc 1983; 130: 731-3.
Rushton DN, Brindley GS. Short- and long-term stability of corticalelectrical phosphenes. In: Rose FC, editor. Physiological aspects ofclinical neurology. Oxford: Blackwell, 1977: 123-53.
Rushton DN, Brindley GS. Properties of cortical electricalphosphenes. hi: Cool SJ, Smith EL, editors. Frontiers in visualscience. New York: Springer-Verlag, 1978: 574-93.
Schmidt EM, Bragg JA. Simple visual reaction time as a means ofquantifying brightness of electrically produced phosphenes. VisionRes 1995. In press.
Shakhnovich AR, Ogleznev KY, Abakumova LY, Tishchenko LS,Razumovskii AE. Phosphene formation during electrical stimulationof the visual cortex. Hum Physiol 1982; 8: 34-9.
Received June 1, 1995. Revised August 23, 1995.Accepted October 18, 1995
by guest on April 5, 2011
brain.oxfordjournals.orgD
ownloaded from


![INDEX [microdentsystem.com] · INTRODUCTION REMOVABLE AND IMMEDIATE . PROSTHESIS MULTIPLE PROSTHESIS. CEMENTED PROSTHESIS. Microdent Genius conical (straight) abutment or Microdent](https://static.fdocuments.us/doc/165x107/5facd9ef77a5ed547a36b19e/index-introduction-removable-and-immediate-prosthesis-multiple-prosthesis.jpg)