BPFI SME Market Monitor Final Report is the fourteenth publication of the BPFI SME Market Monitor,...
19
BPFI SME Market Monitor Final Report June 2018
Transcript of BPFI SME Market Monitor Final Report is the fourteenth publication of the BPFI SME Market Monitor,...

BPFI SME Market
Monitor
Final Report
June 2018

This is the fourteenth publication of the BPFI SME Market Monitor, prepared for the Banking & Payments Federation Ireland (BPFI) . The purpose of this Market Monitor is
to present up to date trends across a range of indicators which are important for the performance of the SME sector. With SMEs (employing less than 250 persons)
accounting for the overwhelming majority of enterprises, 69% of persons engaged, 56% of turnover and 50% of Gross Valued Added (GVA), their performance is very
closely linked with the overall health of the economy. How consumers feel about the overall state of the economy, their personal financial situation and their ability to make
purchases will influence the performance of SMEs. The level of confidence amongst businesses is equally important, as the more confident business owners and managers
are, the greater the prospects for their companies, overall employment and incomes. They are also more likely to make investment and purchase decisions.
In a report prepared for the BPFI in 2013 , it was noted that the highest concentration of Irish SMEs are in Accommodation and Food services, Construction and Real Estate
activities, while Motor and Wholesale Trades as well as Professional, Scientific and Technical services also figure prominently in terms of employment. A number of
challenges have existed for SMEs following the unprecedented economic adjustment over the recession years which hit many SMEs especially hard. While the environment
is improving, the return to more sustainable growth and trading conditions should ensure that SMEs remain central to Ireland’s economic and jobs recovery.
This publication monitors a number of indicators that influence the circumstances under which SMEs conduct their business. A total of 15 indicators, which are published on
a quarterly and/or monthly basis, are presented in tabular and graphical form with a brief commentary. This publication also contains a summary commentary which seeks to
bring an overall assessment of what these indicators are telling us about the environment for SMEs. The indicators presented are grouped under four headings: sentiment,
macroeconomic, sectoral and lending.
The data includes a number of the published sentiment indicators, including those from the ESRI, KBC and Investec. Much of the macroeconomic and sectoral data comes
from the Central Statistics Office while the SME lending data is from the Central Bank of Ireland. Where data is known to be affected by seasonal patterns, the CSO
presents seasonally adjusted (SA) data which allow month on month (MoM) or quarter on quarter (QoQ) trends to be analysed. The seasonally adjusted data can vary each
month/quarter as new observations are added and these changes will be reflected in subsequent issues of the BPFI SME Market Monitor. Unadjusted data are analysed on
a year-on-year (YoY) basis.
This publication appears in electronic form on BPFI’s website: http://www.bpfi.ie and is available on http://www.ey.com/ie/en/services/transactions/ey-dkm-economic-
advisory . The analysis is based on data available up to 8 June 2018.
Introduction
BPFI SME Market Monitor Final Report 1
Sentiment
indicators
Macroeconomic
indicators
Sectoral indicators
Lending indicators
DisclaimerThis report has been prepared by Ernst & Young, in accordance with an engagement agreement for professional services with the Banking and Payments Federation Ireland. Ernst & Young’s obligations to
BPFI are governed by that engagement agreement. This disclaimer applies to all other parties (including BPFI’s affiliates and advisors).
This report has been prepared for general informational purposes only and is not intended to be relied upon as accounting, tax, or other professional advice. You should refer to your advisors for specific
advice.
Ernst & Young accepts no responsibility to update this report in light of subsequent events or for any other reason.
This report does not constitute a recommendation or endorsement by Ernst & Young to invest in, sell, or otherwise use any markets or companies that may be referred to in it.
To the fullest extent permitted by law, Ernst & Young and its members, employees and agents do not accept or assume any responsibility or liability in respect of this report, or decisions based on it, to any
reader of the report. Should such readers choose to rely on this report, then they do so at their own risk.
Ernst & Young reserves all rights in the Report.
We were given editorial independence by BPFI to prepare the analysis and commentary on data and statistical trends related to the SME sector. Any views expressed herein are the views of Ernst &
Young and may not necessarily coincide with the views of BPFI.

Solid growth in domestic activity supports SMEs, but international risks persist
The latest review of the SME economic environment provides further evidence of continued
improvement in the domestic economy, with the vast majority of macroeconomic indicators
trending favourably when compared to corresponding levels in the previous year.
For 2017 as a whole, Modified Domestic Demand experienced solid annual growth, with much of
this progress predominantly credited to a double digit increase in Gross Domestic Fixed Capital
Formation. In a period of low inflation, Irish Households throughout 2017 saw modest increases
in their disposable incomes, while labour market conditions continue to edge closer to full
employment levels. Such favourable trends are reflected in the fact that the latest ESRI/KBC
Consumer Sentiment Index shows further improvements in terms of consumer confidence,
particularly with regard to households’ spending plans. That said, consumers were less optimistic
with respect to their expectations for the Irish economy and their household finances over the
coming year but nevertheless, the mood of the average consumer is one of guarded optimism.
Encouragingly, the growing Irish economy is continuing to filter down to industries where SMEs
tend to operate. For example, the Retail sector saw growth in sales when compared to the
previous year, with considerably stronger year-on-year increases in the sale of Furniture and
Lighting (+11.4%), Motor sales (+9%), and Electrical goods (+7.4%). The latest Investec
Manufacturing PMI in April saw a marked acceleration in the rate of growth in new business,
while exports also expanded at a significant rate. Despite an above average rise in input costs,
business confidence in the sector remains quite strong, with the 12-month outlook for production
reaching a 38-month high. There was also an encouraging performance from the
Accommodation and Food service sector, with output expanding by 11.5%, while employment in
the sector was up 8.8% on the previous year.
Therefore, while it is clear that the Irish SME market has experienced solid growth in the past
year, the medium term prospects are unclear given the ever changing global environment,
particularly given recent developments in the United States.
By authorising the imposition of a 25% tariff on steel imports and 10% on aluminium imports from
Canada, Mexico and the European Union, the US government has undoubtedly raised the
prospect of a global trade war. Whether such a trade war comes to fruition remains to be seen,
but the imposition of these trade tariffs by one of Ireland’s key trading partners raises the
possibility of a more protectionist global trading environment in the medium term, an impact which
will invariably affect an open economy like Ireland and thus the Irish SME environment.
In conjunction with this, slow progress in terms of Brexit talks continues to create uncertainty
about the future relationship of Ireland’s biggest trading partner, with continued exchange rate
volatility being the likely factor in declining food production levels. That said, the likelihood of a
“No Deal” scenario occurring, coupled with a potentially more protectionist trading environment
globally, although very unclear at this moment, remains a possibility.
Despite these global concerns, the current state of the Irish SME environment is quite positive.
Interestingly, following consistent years of decline, total outstanding debt provided to SMEs in key
sectors has expanded in December 2017, with annual growth in Retail (+7.6%), Hotels and
Restaurants (+1.6%), and Business and Administrative services (+1%). Other SME sectors such
as Agriculture have also seen total outstanding debt expand in three of the four quarters in 2017.
BPFI SME Market Monitor Final Report 2
In summary, while the Irish economy continues to experience notable
improvements in domestic activity, employment and investment, the
risks of global factors will inevitability remain on the horizon in the
medium term. The extent to which these factors will affect the Irish
economy remains unclear.

3
Indicator Latest Trends Highlight LevelMoM
% Change
QoQ
% Change
YoY
% ChangeDate
Consumer Sentiment Consumer confidence edges higher in May 106.7 Households more willing to make large purchases May-18
Manufacturing PMI Exports up strongly in the month 55.4 Business confidence reaches a 38 month high May-18
Modified Domestic Demand Modified GDFCF fell by 5.4% YoY €43,293m-
-2.4% +0.1% Q4’17
Unemployment rate Monthly unemployment at 5.9% in April 6.4% - - 0.3pp -1.2pp Q4’17
Disposable Income Savings ratio up 2pp relative to 2016 €25,817m - - 0.1% +3% Q4’17
Employment 66,800 new jobs created since last year 2.23m - +1.1% +3.1% Q4’17
Retail Sales Index up 2% in the year to date 110.9 +1.5% - +4.8% Apr-18
Retail Sales excl. Motor Trades Motor sales up 1.2% MoM 109.5 +1.0% - +3.8% Apr-18
Overseas Trips to Ireland Total of 9.94 million visitors in 2017 2.58m - +5.0% +6.2% Q4’17
Industrial Production Modern sector records exceptional monthly
growth of 31.8%96.7 +9.2% - -4.5% Apr-18
Services Service Index rebounds strongly in April 114.7 +5.3% - +6.5% Apr-18
Construction Production Output remains 55% below Q4 2006 peak 167.0 - +7.4% +20.6% Q1’18
Food Production In the year to date output is down 17.1% 88.5 -0.8% - -8.6% Apr-18
BPFI SME Market Monitor Final Report

Section 1
Sentiment indicators

Sentiment indicators
The Consumer Sentiment Index increased to 106.7 in May from 104 in April, reversing about
two thirds of the decline recorded between March and April.
In the May survey, three of the five key elements of the index registered higher readings
relative to April, with the remaining two being slightly weaker than in the previous month.
Encouragingly for SMEs, the strongest element of the May survey was in relation to household
spending plans, with the rise in sentiment due to a greater willingness by households to make
large purchases.
That said, the two elements of the May survey that were weaker than the previous month,
were consumers expectations for the Irish economy and their household finances over the
next twelve months. Regardless, this month’s reading suggests the mood of Irish consumers
remains one of guarded optimism.
The Investec Manufacturing PMI rose to 55.4 in May from 55.3 in April, with the latest reading
suggesting that the industry continues to grow at a reasonable rate.
May saw a marked acceleration in the rate of growth in new business, with new orders
growing at their fastest rate since January. Panellists highlighted the impact of new export
orders on new business, as growth in exports rebounded strongly in the month. As a result of
this, manufacturers increased production at a marked rate, implying that output has now risen
in each of the last 22 months.
There was notable input cost inflation in May, with the latest increase sharper than the series
average. Such cost inflation was credited to higher oil prices, while increases in plastics and
metals were also noted. Nevertheless, business confidence remains quite strong, with the 12-
month outlook for production reaching a 38-month high.
BPFI SME Market Monitor Final Report 5
Dec-17 Jan-18 Feb-18 Mar-18 Apr-18 May-18
Monthly Index 103.2 110.4 105.2 108.1 104.0 106.7
Annual change in the level 7.1 7.3 4.5 6.2 2.0 6.1
Monthly change in the level -0.4 7.2 -5.2 2.8 -4.0 2.6
3 month moving average 103.9 105.8 106.3 107.9 105.8 106.3
Figure 1:
Consumer
Sentiment
Index
Source: KBC/ESRI
Figure 2:
Manufacturing
PMI (SA)
Source: Markit/Investec
Households were more willing to make large purchases in May May saw manufacturers increase production levels at a notable rate
Source: KBC/ESRI
Dec-17 Jan-18 Feb-18 Mar-18 Apr-18 May-18
PMI (SA) 59.1 57.6 56.2 54.1 55.3 55.4
Monthly Change 1.0 -1.5 1.4 -2.1 1.2 0.1
Source: Markit/Investec
Consumer Sentiment Index Manufacturing PMI

Section 2
Macroeconomic indicators

Macroeconomic indicators
In the final quarter of 2017, Modified Final Domestic Demand experienced a quarterly decline
of 2.4%. That said, the corresponding figure for the year as a whole, grew at a rate of 4.2%
when compared to the previous year.
Growth in 2017 was predominantly driven by Gross Domestic Fixed Capital Formation, with
annual growth up by 10.4%. Specifically, investments in Intangible assets (excluding IP
imports) and Building and Construction were up by 28.8% and 17.6% respectively. That said,
investment in Machinery and Equipment recorded a significant decline of 11.9% when
compared to 2016.
Relative to 2016, the remaining categories of Modified Domestic Demand recorded relatively
modest growth, with Government Expenditure and Personal Consumption up by 1.8% and
2.1% YoY respectively.
The seasonally adjusted unemployment rate fell to 6.4% in Q4 2017, with the total number of
people unemployed falling to 151,500. This implies that over the course of the year,
unemployment fell by 24,900, while relative to the previous quarter, unemployment was down
by 5,100.
In April the seasonally adjusted unemployment rate was 5.9%, down 0.1 percentage points
from the revised rate in March and down from 6.8% in April 2017. This implies that the number
of persons unemployed was 140,300 in April, representing a decline of 16,700 relative to the
previous year. However, the unemployment rate amongst 15-24 year olds was 12% in April.
An ever improving labour market can only be positive for the SME sector, as increased
employment should enhance consumer confidence and consumers’ respective spending
plans, subsequently inducing companies to expand production levels accordingly.
BPFI SME Market Monitor Final Report7
Q3-16 Q4-16 Q1-17 Q2-17 Q3-17 Q4-17
Total Domestic Demand 41,539 44,464 41,925 44,534 45,844 43,980
QoQ % Change -0.3% 7.0% -5.7% 6.2% 2.9% -4.1%
Final Domestic Demand 41,763 43,253 43,023 42,993 44,380 43,293
QoQ % Change 1.3% 3.6% -0.5% -0.1% 3.2% -2.4%
Figure 3:
Domestic
Demand SA
(€m, constant
2015 prices)
Source: CSO, National Accounts
Figure 4:
Unemployment
Rate (SA)
Source: CSO, Labour Force Survey (LFS)
For 2017, growth in Modified Domestic Demand primarily due to uplift in InvestmentMonthly unemployment falls below 6% in April 2017
Source: CSO, (SA): Difference between Total and Final Modified Domestic Demand is the change in the value of
physical stock. This item measures the actual value change in stocks between the start and end of Quarter
Q3 16 Q4 16 Q1 17 Q2 17 Q3 17 Q4 17
Rate (SA) 8.3% 7.6% 7.2% 6.7% 6.7% 6.4%
Number (000s SA) 192.9 176.4 167.8 155.0 156.6 151.5
Source: CSO, Labour Force Survey (LFS) (SA)
Modified Domestic Demand Unemployment Rate

Q3'16 Q4'16 Q1'17 Q2'17 Q3'17 Q4'17
Total Disp.
Income24,488 25,058 25,142 25,806 25,853 25,817
QoQ % Change 2.5% 2.3% 0.3% 2.6% 0.2% -0.1%
Consumption Exp. 22,614 22,939 23,197 23,258 23,592 23,723
QoQ % Change 0.0% 1.4% 1.1% 0.3% 1.4% 0.6%
Gross Saving 1,839 2,082 1,860 2,727 2,234 2,011
QoQ % Change 31.7% 13.2% -10.7% 46.6% -18.1% -10.0%
Savings Ratio 7.5% 8.3% 7.4% 10.6% 8.6% 7.8%
Following three successive quarters of growth in 2017, total disposable income fell marginally
by 0.1% to €25.8 billion in Q4 2017. Nevertheless, annual growth was up by 3%. For 2017 as
a whole, total disposable income totalled €102.6 billion, which was €5.2 billion or 5.4% higher
than the previous year. Likewise, consumer expenditure in the year was up €2.9 billion or
3.2% relative to 2016.
Total gross savings amounted to €8.8 billion in the year, representing substantial double digit
growth of 34.9% or €2.3 billion compared to the previous year. Such growth implies that over
the course of the year, the savings ratio rose by just under 2 percentage points to 8.6% in
2017.
BPFI SME Market Monitor Final Report8
Figure 5:
Household
Disposable
Income and
Savings Ratio
(€ millions,
current prices)
SA
Source: CSO. *Consumption Expenditure (CE) here excludes Government social
transfers which are included in the CE definition for National Accounts purposes
Total disposable income was 5.4% higher when compared to 2016
Source: CSO (SA)
Disposable Income and Savings
Macroeconomic indicators

Section 3
Sectoral Indicators

Sectoral indicators
Following annual growth of 2.6%, average weekly earnings across the economy increased to
€738 or €38,383 per annum in Q1 2018. Relative to its low point of Q3 2011, when weekly
earnings stood at €688, this represents an improvement of 7.2%.
Further examination of the data shows that earnings in medium-sized companies with
between 50 and 250 employees recorded the largest annual increase in Q1 2018, up 3.1%.
Encouragingly, earnings in small companies have now surpassed their previous peak level in
Q3 2008, while earnings in small firms are now 9.6% higher than the low point of Q4 2011.
Earnings growth in large sized companies continued to grow in 2018, with the opening quarter
of the year recording annual growth of 2.5%.
Total employment increased by 3.1% or 66,800 in the year to Q4, 2017, bringing total
employment to 2.23 million. This implies that total employment has now grown on an annual
basis in each of the last 22 quarters, and is now at its highest level in a decade. Of the 66,800
new jobs created in 2017, 45% were in the four sectors with the greatest concentration of
SMEs.
Of these four sectors, the Construction sector continued to record the largest rate of growth,
with employment up by 9.9% relative to the previous year. There was also significant growth in
the Accommodation and Food Service sector, where employment was up 8.8%. The
Wholesale and Retail Trade sector registered relatively modest annual growth of 1.8%, while
employment in Real Estate activities was down by 9.5%.
BPFI SME Market Monitor Final Report10
Q4 16 Q1 17 Q2 17 Q3 17 Q4 17 Q1 18
Under 50 562.8 567.3 567.3 567.3 566.5 578.7
YoY% Change 1.5% 2.5% 2.7% 2.4% 0.7% 2.0%
50 - 250 650.7 656.2 663.9 670.7 673.0 676.8
YoY% Change -1.5% -0.8% 1.0% 2.2% 3.4% 3.1%
250 + 849.0 852.8 856.3 863.0 869.2 874.5
YoY% Change 2.3% 2.4% 2.8% 2.3% 2.4% 2.5%
Figure 6:
Weekly
Earnings by
Size of
Business (€) SA
Source: CSO
Figure 7:
Employment by
Sector YoY %
Change
Source: CSO, LFS, not SA
Average weekly earnings amounted to €738 in Q1’18, up 2.6% on previous year A total of 66,800 jobs were created in 2017
Source: CSO
YoY% Change Q3 16 Q4 16 Q1 17 Q2 17 Q3 17 Q4 17
All sectors 3.8% 3.8% 3.7% 2.5% 2.2% 3.1%
Construction 8.4% 10.3% 9.3% 6.8% 6.9% 9.9%
Wholesale and retail trade 3.0% 1.7% 2.0% 2.2% 1.5% 1.8%
Accommodation and food 8.1% 1.5% 5.6% 2.7% 1.3% 8.8%
Real estate -0.9% 21.2% -3.3% -11.2% -7.8% -9.5%
Source: CSO, LFS, (NSA)
Weekly Earnings by size of Business Employment by Sector

Following a monthly decline of 1.9% in March, the Retail Sales Index registered modest
monthly growth of 1.5% in April. When car sales are excluded, monthly growth eases to 1%.
On an annual basis, retail sales were up by 4.8%, while the Index in the year to date is 2%
higher than the same period last year. When car sales are excluded, the corresponding growth
rates are 3.8% and 4.3%.
A further examination of the data showed that the vast majority of retail sectors recorded
monthly increases in April, most notably for sales in furniture and lighting (+13.2%),
Automotive Fuels (+5.6%), Clothing and Footwear (+3.6%), Specialised Stores (+3.6%) and
Hardware, Paints and Glass (+3.1%). The only Retail Sectors to record monthly declines in
sales were Electrical goods (-3%), Department Stores (-1%) and Non-Specialised Stores (-
0.2%).
A total of 2.58 million visits were made to Ireland in Q4 2017, representing a notable increase
of 5% on the previous quarter, while annual growth was up by 6.2%. For the year as a whole,
9.94 million tourists visited Ireland, which was an increase of 3.5% on 2016. The latest data
from Fáilte Ireland, showing that revenue from overseas visitors amounted to €5.1 billion per
annum, will be welcome news for SMEs operating in the sector.
For the first time since the Brexit referendum result, there was an increase in the number of
visitors coming from Great Britain (GB), with strong quarterly growth of 5.4% in the final
quarter. The corresponding annual growth was a very modest 0.8% in 2017.
Visitor numbers coming from North America and Mainland Europe, experienced exceptional
annual growth, increasing by 9.1% and 12% respectively YoY in Q4 2017. For the fourth
quarter in a row, visitors from other areas (outside of GB, US and Europe) fell, with numbers
down 0.2% on an annual basis.
BPFI SME Market Monitor Final Report
11
Nov-17 Dec-17 Jan-18 Feb-18 Mar-18 Apr-18
Retail Sales Index 112.3 111.6 111.1 111.4 109.3 110.9
MoM % Change 2.2% -0.7% -0.4% 0.2% -1.9% 1.5%
Index ex. Motor 110.1 108.8 109.7 109.8 108.4 109.5
MoM % Change 2.2% -1.1% 0.8% 0.1% -1.3% 1.0%
Figure 8:
Retail Sales
Volume Index
(2010 = 100) SA
Source: CSO
Figure 9:
Overseas Trips
to Ireland SA
Source: CSO
In the year to date, Retail Sales, with and without motor sales, posted solid growth A total of 9.94 million tourists visited Ireland in 2017, up 3.5% on 2016
Source: CSO. (SA)
Q3 16 Q4 16 Q1 17 Q2 17 Q3 17 Q4 17
Overseas Visitors (SA) 2.42 2.43 2.44 2.47 2.46 2.58
QoQ % Change 1.6% 0.3% 0.3% 1.4% -0.5% 5.0%
Source: CSO. (SA)
Retail Sales Volume Index Overseas Trips to Ireland
Sectoral indicators
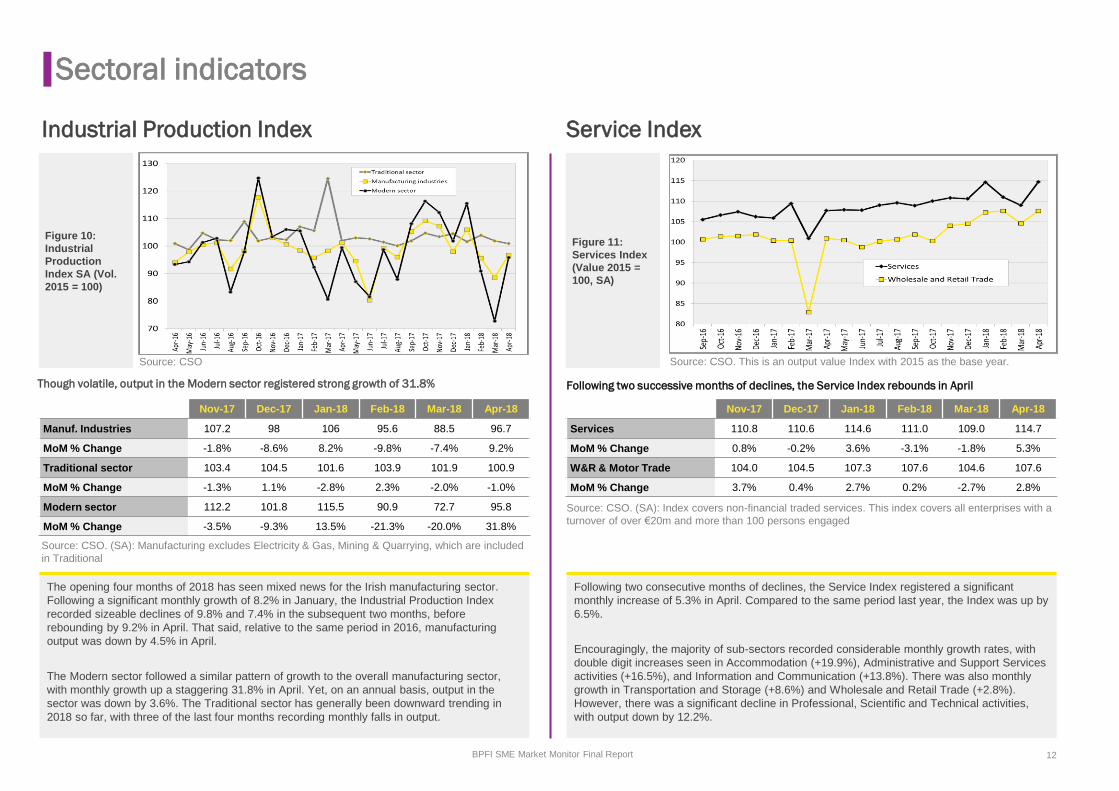
The opening four months of 2018 has seen mixed news for the Irish manufacturing sector.
Following a significant monthly growth of 8.2% in January, the Industrial Production Index
recorded sizeable declines of 9.8% and 7.4% in the subsequent two months, before
rebounding by 9.2% in April. That said, relative to the same period in 2016, manufacturing
output was down by 4.5% in April.
The Modern sector followed a similar pattern of growth to the overall manufacturing sector,
with monthly growth up a staggering 31.8% in April. Yet, on an annual basis, output in the
sector was down by 3.6%. The Traditional sector has generally been downward trending in
2018 so far, with three of the last four months recording monthly falls in output.
Following two consecutive months of declines, the Service Index registered a significant
monthly increase of 5.3% in April. Compared to the same period last year, the Index was up by
6.5%.
Encouragingly, the majority of sub-sectors recorded considerable monthly growth rates, with
double digit increases seen in Accommodation (+19.9%), Administrative and Support Services
activities (+16.5%), and Information and Communication (+13.8%). There was also monthly
growth in Transportation and Storage (+8.6%) and Wholesale and Retail Trade (+2.8%).
However, there was a significant decline in Professional, Scientific and Technical activities,
with output down by 12.2%.
BPFI SME Market Monitor Final Report 12
Nov-17 Dec-17 Jan-18 Feb-18 Mar-18 Apr-18
Manuf. Industries 107.2 98 106 95.6 88.5 96.7
MoM % Change -1.8% -8.6% 8.2% -9.8% -7.4% 9.2%
Traditional sector 103.4 104.5 101.6 103.9 101.9 100.9
MoM % Change -1.3% 1.1% -2.8% 2.3% -2.0% -1.0%
Modern sector 112.2 101.8 115.5 90.9 72.7 95.8
MoM % Change -3.5% -9.3% 13.5% -21.3% -20.0% 31.8%
Figure 10:
Industrial
Production
Index SA (Vol.
2015 = 100)
Source: CSO
Figure 11:
Services Index
(Value 2015 =
100, SA)
Source: CSO. This is an output value Index with 2015 as the base year.
Though volatile, output in the Modern sector registered strong growth of 31.8% Following two successive months of declines, the Service Index rebounds in April
Source: CSO. (SA): Manufacturing excludes Electricity & Gas, Mining & Quarrying, which are included
in Traditional
Nov-17 Dec-17 Jan-18 Feb-18 Mar-18 Apr-18
Services 110.8 110.6 114.6 111.0 109.0 114.7
MoM % Change 0.8% -0.2% 3.6% -3.1% -1.8% 5.3%
W&R & Motor Trade 104.0 104.5 107.3 107.6 104.6 107.6
MoM % Change 3.7% 0.4% 2.7% 0.2% -2.7% 2.8%
Source: CSO. (SA): Index covers non-financial traded services. This index covers all enterprises with a
turnover of over €20m and more than 100 persons engaged
Industrial Production Index Service Index
Sectoral indicators

The B&C Production Index expanded by double digit figures for eighth quarter in a row, with
Q4 2017 recording significant annual growth of 16.3%. For the year as a whole, output in the
sector was up 17% relative to the previous year. That said, output is 60% lower when
compared to the unsustainable levels of 2006.
Of the three sub-sectors that make up the Index, Residential building remains the fastest
growing, with annual growth up by 26.7% in Q4 2017. Likewise, Non-Residential building
experienced strong year-on-year growth of 19.7%, while activity in Civil Engineering was also
up by 10.1% relative to the previous year.
The April reading from the Ulster Bank Construction PMI signalled a sharp expansion across
the Irish construction sector, the second-fastest since May 2017. The report notes that activity
was driven by an increase in new projects following poor weather in the first few months of the
year.
The downward trend in the Food Production Index continued into 2018, with monthly declines
recorded in three of the last four months. In the year to date, food production was down by
17.1% compared to the corresponding figure last year. The continuous exchange rate volatility
as a result of Brexit is likely to be the cause of such declines.
The monthly fall in April is mainly due to poor performances across all of the sub-sectors, with
declines recorded in Meat and Meat Products (-0.1%), Bakery and farinaceous products (-
0.3%), Grain Mill and Starch Products (-1.1%), and Other Foods (-1.2%), (which include the
Processing and Preserving of Fish and Fruit and Vegetables, the Manufacture of Vegetable
and Animal Oils and Fats, Sugar, Chocolate and Sugar Confectionary, Condiments and
Seasonings and Prepared Meals and dishes and the Processing of Tea and Coffee). The sub-
sector to record the largest monthly decline in April was Dairy Products, with output down by
2.9%.
BPFI SME Market Monitor Final Report
13
Q3'16 Q4'16 Q1'17 Q2'17 Q3'17 Q4'17
All building and construction
SA126.9 130.6 139.1 143.5 151 151.9
QoQ % Change -1.1% 2.9% 6.5% 3.2% 5.2% 0.6%
YoY% Change 19.0% 17.6% 21.3% 11.8% 19.0% 16.3%
Figure 12:
Construction
Production
Index SA
(Volume 2010
= 100)
Source: CSO
Figure 13:
Food
Production
Index SA (Vol.
2015 = 100)
Residential building was by far the fastest growing sub sector of B&C Index Food production was down by 17.1% in year to date
Source: CSO. (SA)
Nov-17 Dec-17 Jan-18 Feb-18 Mar-18 Apr-18
Food products 90.8 93.4 89.8 92.6 89.1 88.5
MoM % Change -5.2% 2.9% -3.9% 3.1% -3.8% -0.8%
Source: CSO. (SA)
Source: CSO
Construction Production Index Food Production Index
Sectoral indicators

Section 4
Lending indicators

Lending indicators
New lending recorded annual growth of 16.5% in Q4 2017, which was equivalent to €1.55
billion, the highest level registered since records began in 2010.
Real Estate Activities was the largest recipient of total new lending in the quarter, accounting
for 25.7% or €397 million. Compared to Q4 2016, Real Estate’s share of total new lending
increased by 6.7 percentage points. Other sectors to record notable shares in Q4 2017
included:
► Wholesale and Retail Trade (15.8% of total new lending)
► Primary Industries (14.3%)
► Human Health and Social Work (8.6%)
► Business and Administrative Services (8%)
► Hotels and Restaurants (7.6%)
Total outstanding debt accrued by Irish SMEs amounted to €26.2 billion in Q4 2017,
representing a decline of 4.5% or €86 million on the previous year, when adjustments by the
Central Bank are taken into account*.
Of the fourteen sectors covered, six registered declines in debt levels in Q4 2017, with Real
Estate Activities recording the largest absolute fall (-€413 million). Other sectors to record
notable declines in debt levels at the end of 2017 included:
► Manufacturing (-€117 million)
► Primary Industries (-€50 million)
► Construction (-€31 million)
Of the sectors to record an increase in outstanding debt, Wholesale and Retail Trade
registered the highest, with debt levels increasing by €250 million.
BPFI SME Market Monitor Final Report 15
Q3'16 Q4'16 Q1'17 Q2'17 Q3'17 Q4'17
Total New Lending (€m) 1,119 1,327 1,192 1,203 1,090 1,546
YoY % Change 47.2% 36.1% 21.8% 4.3% -2.6% 16.5%
Figure 14:
New Lending to
SMEs (€m) and
Rate of Change
Source: Central Bank
Figure 15:
Outstanding
Debt (€m) and
Rate of Change
Source: Central Bank: *Total outstanding debt ex Financial Intermediation
New lending to SMEs expands by double digit figures in Q4’17Total outstanding debt amounted to €26.2 billion in Q4’17
Source: Central Bank *Total lending ex Financial Intermediation Source: Central Bank *Data relates to Transactions and the growth rates of outstanding debt amounts that take
account of adjustments in debt reclassifications, foreign exchange revaluations and other revaluations
New Lending to SME’s Outstanding Debt of SME’s
Q3'16 Q4'16 Q1'17 Q2'17 Q3'17 Q4'17
Total Outstanding Debt (€m) 30,543 28,207 27,829 27,359 26,534 26,222
Annual change (€m)* -1,064 -684 -351 -222 -588 -86
Growth rates (%)* -9.3 -8.0 -7.0 -7.4 -6.3 -4.5

Indicators – Data sources

Indicators – Data sources
BPFI SME Market Monitor Final Report 17
Indicator Source Frequency Seas adj.
Sentiment Indicators
1 Consumer Sentiment Index ESRI/KBC Monthly No
2 Purchasing Managers’ Index Investec Monthly Yes
Macroeconomic Indicators
3 Domestic Demand CSO National Accounts Quarterly Yes
4 Unemployment CSO Quarterly Yes
5 Disposable Income CSO Quarterly Yes
Sectoral Indicators
6 Earnings by Business Size CSO Quarterly Yes
7 Employment by sector (QNHS) CSO Quarterly No
8 Retail Sales Volume Index CSO Monthly Yes
9 Overseas Trips to Ireland CSO Quarterly Yes
10 Industrial Production Index CSO Monthly Yes
11 Services Index CSO Monthly Yes
12 Building and Construction Production Index CSO Quarterly Yes
13 Food Production Volume Index CSO Monthly Yes
Lending Indicators
14 Outstanding SME debt by sector Central Bank Quarterly No
15 New Lending to SMEs by sector Central Bank Quarterly No

EY | Assurance | Tax | Transactions | Advisory
About EY
EY is a global leader in assurance, tax, transaction and advisory
services. The insights and quality services we deliver help build trust
and confidence in the capital markets and in economies the world over.
We develop outstanding leaders who team to deliver on our promises
to all of our stakeholders. In so doing, we play a critical role in building
a better working world for our people, for our clients and for our
communities.
EY refers to the global organisation and may refer to one or more of the
member firms of Ernst & Young Global Limited, each of which is a
separate legal entity. Ernst & Young Global Limited, a UK company
limited by guarantee, does not provide services to clients. For more
information about our organisation, please visit ey.com.
© 2018 Ernst & Young. Published in Ireland. All Rights Reserved.
57604.pptx. Produced by BSC (Ireland). 3/18. ED none.
The Irish firm Ernst & Young is a member practice of Ernst & Young
Global Limited. It is authorised by the Institute of Chartered
Accountants in Ireland to carry on investment business in the Republic
of Ireland.
Ernst & Young, Harcourt Centre, Harcourt Street, Dublin 2, Ireland.
Information in this publication is intended to provide only a general
outline of the subjects covered. It should neither be regarded as
comprehensive nor sufficient for making decisions, nor should it be
used in place of professional advice. Ernst & Young accepts no
responsibility for any loss arising from any action taken or not taken by
anyone using this material.
ey.com