
SME Finance Monitor - bdrc-group.com · PDF filegrowth, profitability and perceived barriers...
353
SME Finance Monitor Q2 2017 An independent report by BDRC Continental, September 2017
Transcript of SME Finance Monitor - bdrc-group.com · PDF filegrowth, profitability and perceived barriers...
SME Finance MonitorQ2 2017
An independent report by BDRC Continental, September 2017
2
www.bdrc-continental.com
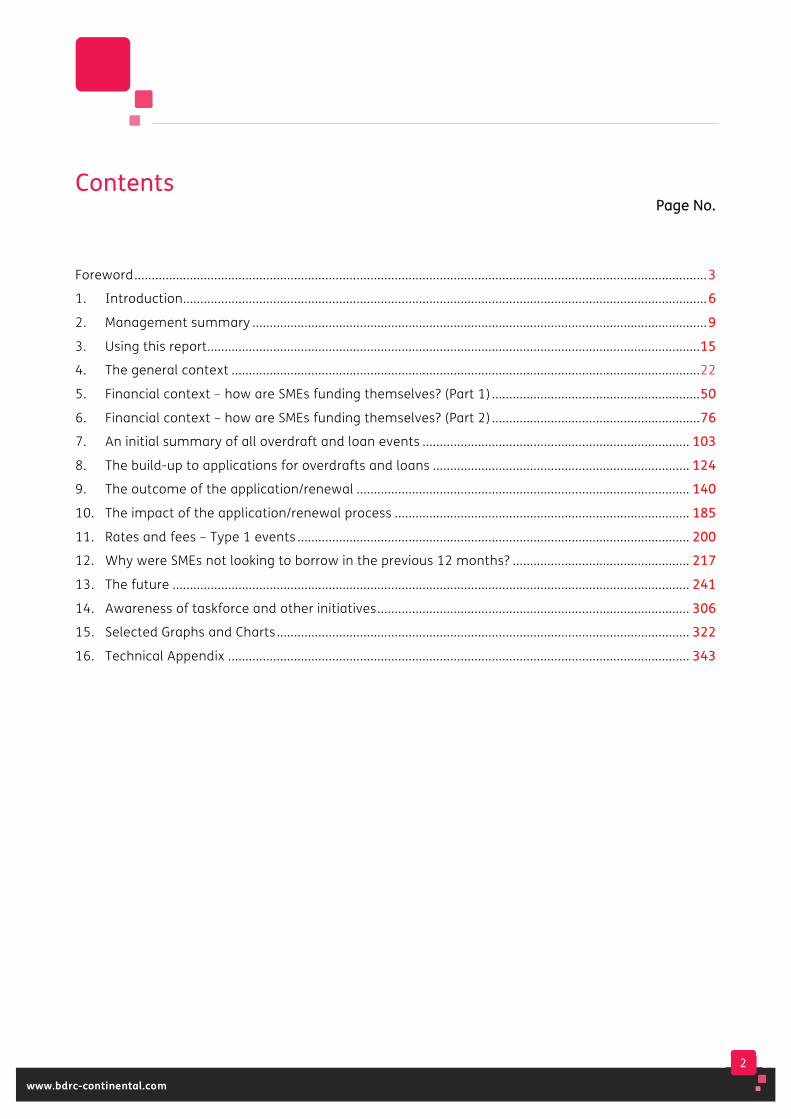
Contents PPaaggee NNoo..
Foreword ..................................................................................................................................................................... 331. Introduction ....................................................................................................................................................... 662. Management summary ................................................................................................................................... 993. Using this report .............................................................................................................................................. 11554. The general context ....................................................................................................................................... 225. Financial context – how are SMEs funding themselves? (Part 1) ............................................................ 55006. Financial context – how are SMEs funding themselves? (Part 2) ............................................................ 77667. An initial summary of all overdraft and loan events ............................................................................. 1100338. The build-up to applications for overdrafts and loans .......................................................................... 1122449. The outcome of the application/renewal ................................................................................................ 11440010. The impact of the application/renewal process ..................................................................................... 11885511. Rates and fees – Type 1 events ................................................................................................................. 22000012. Why were SMEs not looking to borrow in the previous 12 months? ................................................... 22117713. The future ..................................................................................................................................................... 22441114. Awareness of taskforce and other initiatives .......................................................................................... 33006615. Selected Graphs and Charts ....................................................................................................................... 33222216. Technical Appendix ..................................................................................................................................... 334433
3
www.bdrc-continental.com
Foreword
4
www.bdrc-continental.com
Welcome to the full report of the SME Finance Monitor for Q2 2017. After the significant events both in the UK and globally in 2016 (EU referendum, Donald Trump etc), the first half of 2017 included a snap general election and the start of the Brexit negotiations. This report provides an overview of how SMEs have reacted to these events over time.
The SME Finance Monitor surveys 4,500 businesses every quarter about past borrowing events and future borrowing intentions. It is the largest such survey in the UK and since the first report was published covering Q1-2 2011 has built into a robust and reliable independent data source for all parties interested in the issue of SME finance. In total, 25 waves of interviewing have been completed, with a full report now published every half year, following completion of the Q2 and Q4 fieldwork. For 2017 the full report will continue to be published every half year as before. Additional ‘deep dive’ reports are planned to explore the Monitor data set in more detail on specific topics of interest.
The survey was set up through the Business Finance Taskforce, which was itself established in July 2010 to review the key issue of bank finance and how the banks could help the UK to return to sustainable growth. It made a
commitment to fund and publish an independent survey to identify (and track) demand for finance and how SMEs feel about borrowing – the SME Finance Monitor.
This extensive dataset is recognized by both public and private sector stakeholders as the de facto authority on access to finance conditions for SMEs, because it is seen as reliable, trustworthy, and, crucially, as independent. The Monitor is cited regularly in Parliament, in government led reviews, and in evidence to the European Commission and OECD, as well as forming the basis for policy discussions between the banks and BEIS.
The data provides both a clear view of how SMEs are feeling now, and, increasingly, how this has changed over time. It also provides analysis by size of SME and sector, as SMEs should not be seen as one homogenous group: in particular, the smallest SMEs with no employees can often report different views and experiences to their larger peers.
This is an independent report, and I am pleased to confirm that this latest version has once again been written and published by BDRC Continental, with no influence sought or applied by any member of the Steering Group.
Shiona Davies Editor, The SME Finance Monitor September 2017
5
www.bdrc-continental.com
The Survey Steering Group comprises representatives of the following:
Association of Chartered Certified Accountants
Barclays Bank
UK Finance
Dept. for Business, Energy and Industrial Strategy
EEF the manufacturers’ organisation
Federation of Small Businesses
Forum of Private Business
HM Treasury
HSBC
Lloyds Banking Group
Royal Bank of Scotland
Santander
6
www.bdrc-continental.com
1. Introduction

7
www.bdrc-continental.com
The issue of SMEs and external finance continues to provoke debate. Over time, the emphasis has moved from access to finance to demand for finance amongst SMEs and the extent to which the right forms of funding are available to those businesses looking to grow and invest as economic conditions change. For some time the unstable economic atmosphere, including in the Eurozone, has affected business confidence and appetite for borrowing and the EU referendum result in June 2016 added an additional level of uncertainty. At present it appears that demand issues are contributing more to continued lower levels of lending to SMEs than supply issues.
The Business Finance Taskforce was set up in July 2010 to review this key issue of bank finance and how the banks could help the UK to return to sustainable growth. It made a commitment to fund and publish an
independent survey to identify (and track) demand for finance and how SMEs feel about borrowing.
BDRC Continental was appointed to conduct this survey in order to provide a robust and respected independent source of information. BDRC Continental continues to maintain full editorial control over the findings presented in this report.
The majority of this report is based on a total of 18,007 interviews with SMEs, conducted in Q3 and Q4 2016 and Q1 and Q2 2017. This means that the interviews conducted in 2011 (three waves), the 4 waves in each of 2012 to 2015, and the Q1 and Q2 2016 results are no longer included in the year-ending results but they are still shown in this report where data is reported quarterly or annually over time, or by application date.
The YEQ2 2017 data therefore includes the following four waves:
• July-September 2016 – 4,500 interviews conducted, referred to as Q3 2016
• October-December 2016 – 4,500 interviews conducted, referred to as Q4 2016
• January-March 2017 – 4,500 interviews conducted, referred to as Q1 2017
• April-June 2017 – 4,507 interviews conducted, referred to as Q2 2017.
The results from these most recent four waves have been combined as usual to cover a full 12 months of interviewing, and weighted to the overall profile of SMEs in the UK in such a way that it is possible to analyse results wave on wave where relevant – and the data reported for an individual quarter will be as originally reported. This combined dataset of 18,007 interviews is referred to as YEQ2 2017.
8
www.bdrc-continental.com
From 2016 onwards the overall sample size has been reduced slightly from 5,000 to 4,500 interviews per quarter which still provides a robust base size for analysis. At the same time the size, sector and region quotas and weighting were reviewed and, for the first time since the Monitor was established, minor changes were made to better reflect the current profile of SMEs. These new weights have been applied to all data in 2016, so the data for YEQ4 2016 was the first to be based entirely on the new weights.
The majority of reporting is based on interviews conducted in the year to Q2 2017. The exceptions to this rule are:
• Where data is reported by loan or overdraft application date over time. In these instances, all applicants to date are eligible for inclusion, split by the quarter in which they made their application for loan and/or overdraft facilities.
• From Q2 2013, when applications are analysed by sub-group such as employee size, this is also now based on application date rather than date of interview. For the Q2 2017 report, this means such tables are based on all applications occurring in the 18 months between Q1 2016 and Q2 2017, to provide robust base sizes for each sub-group.
• Where SMEs are asked about their planned future behaviour, and typically their expectations for the next 3 months, comparisons are made between individual quarters.
• For key questions new summary tables are now provided with annual figures over the longer term to set the current results in context. The charts in the final chapter of this report provide more detailed quarter on quarter data from the start of the Monitor.
The structure of the SME market is such that the overall ‘All SME’ figures quoted will be heavily influenced by the views of those with 0 employees, who make up three quarters of the SME population. As the views of these smallest SMEs can differ markedly from their larger peers, an ‘All employers’ figure is now also reported for some key questions, that is those SMEs with 1-249 employees.
A further quarter of 4,500 interviews, to the same sample structure, is being conducted July
to September 2017. In 2017, full reports will be published after the Q2 and Q4 fieldwork, with ‘deep dive’ and other analysis reported in-between these full reports.
A sixth edition of the annual report, published in June 2017, provided separate analysis at a regional level for an in-depth assessment of local conditions during 2015. A further regional report is planned for Spring 2018, to report on local conditions during 2017.

9
www.bdrc-continental.com
2. Management summary
This report covers the borrowing process from the SME’s perspective, with detailed information about those who have, or would have liked to have been, through the process of borrowing loan or overdraft funding for their business. It also provides broader context information about SMEs including growth, profitability and perceived barriers to running the business.
10
www.bdrc-continental.com
44 iinn 1100 SSMMEEss wweerree uussiinngg eexxtteerrnnaall ffiinnaannccee wwhhiillee sslliigghhttllyy mmoorree mmeett tthhee ddeeffiinniittiioonn ooff aa PPeerrmmaanneenntt nnoonn--bboorrrroowweerr.. TThheessee ggrroouuppss hhaavvee rreemmaaiinneedd ssttaabbllee oovveerr rreecceenntt yyeeaarrss.. DDeemmaanndd ffoorr ffiinnaannccee rreemmaaiinneedd mmuutteedd aanndd mmoosstt SSMMEEss hhaadd bbeeeenn aa HHaappppyy nnoonn--sseeeekkeerr ooff ffiinnaannccee iinn tthhee pprreevviioouuss 1122 mmoonntthhss..
OOvveerraallll uussee ooff eexxtteerrnnaall ffiinnaannccee wwaass ssttaabbllee
39% of SMEs were using any external finance (YEQ2 2017). This increased by size of SME from 35% of those with 0 employees to 69% of those with 50-249 employees.
This proportion has been stable since 2014 but remains lower than the 44% using finance in 2012. In the latest period (2016 to H1 2017) this stability was driven by the 0 employee SMEs where use of finance was unchanged at 33%. SMEs with employees all saw an increase in the use of finance in the same period, particularly those with 50-249 employees (64% in 2016 to 74% in H1 2017).
Current use of core finance (loans, overdrafts and/or credit cards) is stable at 30% for H1 2017 but lower than the 36% reported for 2012. Use of ‘other’ forms of finance has varied very little since 2012 (16-18%).
Including users of crowd funding does not increase the proportion using finance overall.
AAllmmoosstt hhaallff ooff SSMMEEss mmeett tthhee ddeeffiinniittiioonn ooff aa PPeerrmmaanneenntt nnoonn--bboorrrroowweerr
46% of SMEs (YEQ2 2017) met the definition of a Permanent non-borrower, an SME with no apparent current or future appetite for finance.
Over time this group has grown from 34% of all SMEs in 2012 to 47% in 2015 and has been stable since (46% for H1 2017).
Size is a key predictor of being a PNB, but not all PNBs are small. Whilst 51% of 0 employee SMEs met the definition in H1 2017, a fifth (20%) of the largest SMEs with 50-249 employees also met the definition.
Other predictors for being a PNB include lower levels of planning, growth or innovation and agreement that future plans were based on what they could afford.
DDeemmaanndd ffoorr nneeww oorr rreenneewweedd ffiinnaannccee rreemmaaiinneedd lliimmiitteedd
4% of SMEs reported having applied for a new or renewed loan or overdraft facility in the 12 months prior to interview (YEQ2 2017).
This has declined over time from 11% of SMEs in 2012 to 4% in H1 2017. Whilst larger SMEs remained more likely to apply than smaller ones (10% of those with 50-249 employees in H1 2017 compared to 3% of those with 0 employees) there has been a drop in applications for finance across all size bands.
88 iinn 1100 SSMMEEss hhaadd bbeeeenn HHaappppyy nnoonn--sseeeekkeerrss ooff ffiinnaannccee
Overall, 13% of SMEs reported a borrowing ‘event’ in the previous 12 months. 2% had wanted to apply but something stopped them (the Would-be seekers) leaving the largest group as the Happy non-seekers who had not sought, or wanted to seek, finance (85%).
Over time, the proportion of SMEs having an event has declined (23% in 2012 to 13% in H1 2017) as has the proportion of Would-be seekers (10% in 2012 to 2% in H1 2017) leaving the Happy non-seekers as an increasingly large group (68% in 2012 to 84% in H1 2017).
11
www.bdrc-continental.com
MMoorree SSMMEEss hhoolldd ££1100,,000000 oorr mmoorree iinn ccrreeddiitt bbaallaanncceess aanndd mmoosstt ssaayy iitt rreedduucceess tthheeiirr nneeeedd ffoorr eexxtteerrnnaall ffiinnaannccee.. OOtthheerr ssoouurrcceess ooff ffuunnddiinngg ((ttrraaddee ccrreeddiitt aanndd iinnjjeeccttiioonnss ooff ppeerrssoonnaall ffuunnddss)) rreemmaaiinneedd ssttaabbllee,, aass ddiidd tthhee pprrooppoorrttiioonn ooff SSMMEEss tthhaatt hhaadd ggrroowwnn ((aanndd tthhuuss ppootteennttiiaallllyy rreeqquuiirriinngg ffiinnaannccee)).. AAttttiittuuddiinnaallllyy,, tthheerree iiss aa ccoonnttiinnuueedd pprreeffeerreennccee ffoorr sseellff--ffuunnddiinngg wwhhiicchh iiss lliikkeellyy ttoo bbee iimmppaaccttiinngg oonn ddeemmaanndd ffoorr ffiinnaannccee::
MMoosstt SSMMEEss rreeppoorrtteedd mmaakkiinngg aa pprrooffiitt
81% of SMEs reported making a profit (YEQ2 2017, excluding DK answers). Over time this proportion has increased from 69% in 2012 to 82% in H1 2017 and across all size bands.
AAnn iinnccrreeaassiinngg pprrooppoorrttiioonn ooff SSMMEEss hhoolldd ££1100,,000000 oorr mmoorree iinn ccrreeddiitt bbaallaanncceess
Almost all SMEs hold some credit balances. The proportion holding £10,000 or more has increased from 16% in 2012 to 26% in H1 2017, and across all size bands. Most of those holding such funds said it reduced their need for external finance.
AA tthhiirrdd ooff SSMMEEss rreecceeiivveedd TTrraaddee CCrreeddiitt
35% of SMEs were using trade credit (YEQ2 2017), increasing by size of SME to two thirds of those with 10-249 employees. A consistent 7 in 10 of those receiving trade credit said that it reduced their need for external finance.
AA ssttaabbllee 33 iinn 1100 rreeppoorrtteedd aann iinnjjeeccttiioonn ooff ppeerrssoonnaall ffuunnddss iinnttoo tthhee bbuussiinneessss
28% of SMEs reported an injection of personal funds into the business YEQ2 2017. Smaller, younger SMEs and those with a worse than average risk rating remained more likely to receive such an injection.
The proportion reporting an injection of funds declined from 43% in 2012 to 29% in 2014 and has been stable since. The balance between having to put funds in and choosing to do so has also changed, with a higher proportion now choosing to put in funds to help the business develop.
44 iinn 1100 SSMMEEss ((eexxccll SSttaarrttss)) hhaadd ggrroowwnn
41% of SMEs (excluding Starts) reported that they had grown in the previous 12 months (YEQ2 2017).
This has varied very little since 2013 (39-42%) but this is due to consistent growth amongst those with 0 employees. SMEs with employees were more likely to have grown.
NNoott aallll SSMMEEss wwoouulldd ssppeeaakk ttoo tthheeiirr bbaannkk iiff aa nneeww ooppppoorrttuunniittyy rreeqquuiirreedd ffuunnddiinngg
Faced with a new business opportunity that required funding, 41% of SMEs said they would speak to their bank, but almost as many (38%) would fund it through the business or from the directors.
This is due to the 0 employee SMEs, as when size increases, so does the willingness to approach the bank (61% amongst those with 50-249 employees, with 32% looking to self-fund).
18% of SMEs would not approach the bank because they do not want debt or to take on the risk of debt, a view seen consistently across all SMEs by age and somewhat more prevalent amongst the smaller SMEs.
Continued
12
www.bdrc-continental.com
Continued
TThheerree iiss aa ccoonnttiinnuueedd aattttiittuuddee ooff sseellff--rreelliiaannccee aammoonnggsstt SSMMEEss
The proportion of SMEs willing to borrow to help the business grow is lower in H1 2017 (33%) than seen previously (42-45%), due to lower willingness to borrow amongst those with 0-9 employees.
There was more general agreement across SMEs that their plans for the business were based on what they could afford (81% agreed YEQ2 2017) and that they would accept a slower rate of growth rather than borrowing to grow faster (70% agreed YEQ2 2017), both little changed over time.
13
www.bdrc-continental.com
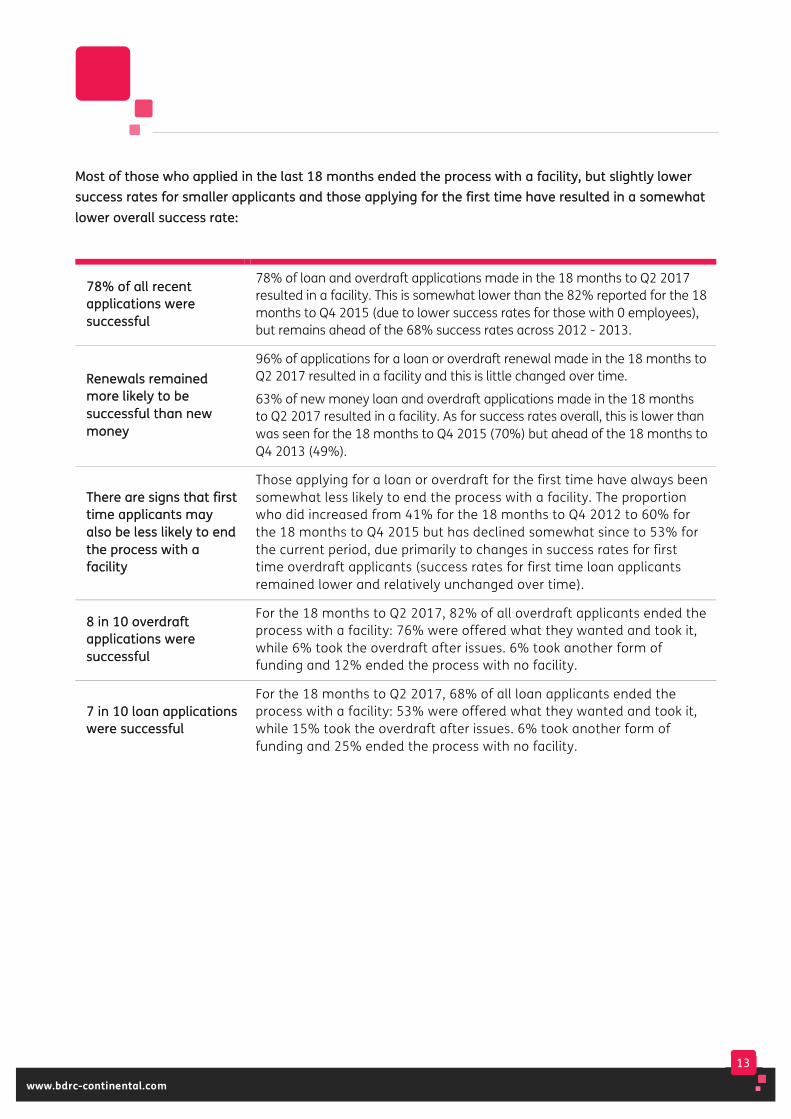
MMoosstt ooff tthhoossee wwhhoo aapppplliieedd iinn tthhee llaasstt 1188 mmoonntthhss eennddeedd tthhee pprroocceessss wwiitthh aa ffaacciilliittyy,, bbuutt sslliigghhttllyy lloowweerr ssuucccceessss rraatteess ffoorr ssmmaalllleerr aapppplliiccaannttss aanndd tthhoossee aappppllyyiinngg ffoorr tthhee ffiirrsstt ttiimmee hhaavvee rreessuulltteedd iinn aa ssoommeewwhhaatt lloowweerr oovveerraallll ssuucccceessss rraattee::
7788%% ooff aallll rreecceenntt aapppplliiccaattiioonnss wweerree ssuucccceessssffuull
78% of loan and overdraft applications made in the 18 months to Q2 2017 resulted in a facility. This is somewhat lower than the 82% reported for the 18 months to Q4 2015 (due to lower success rates for those with 0 employees), but remains ahead of the 68% success rates across 2012 - 2013.
RReenneewwaallss rreemmaaiinneedd mmoorree lliikkeellyy ttoo bbee ssuucccceessssffuull tthhaann nneeww mmoonneeyy
96% of applications for a loan or overdraft renewal made in the 18 months to Q2 2017 resulted in a facility and this is little changed over time.
63% of new money loan and overdraft applications made in the 18 months to Q2 2017 resulted in a facility. As for success rates overall, this is lower than was seen for the 18 months to Q4 2015 (70%) but ahead of the 18 months to Q4 2013 (49%).
TThheerree aarree ssiiggnnss tthhaatt ffiirrsstt ttiimmee aapppplliiccaannttss mmaayy aallssoo bbee lleessss lliikkeellyy ttoo eenndd tthhee pprroocceessss wwiitthh aa ffaacciilliittyy
Those applying for a loan or overdraft for the first time have always been somewhat less likely to end the process with a facility. The proportion who did increased from 41% for the 18 months to Q4 2012 to 60% for the 18 months to Q4 2015 but has declined somewhat since to 53% for the current period, due primarily to changes in success rates for first time overdraft applicants (success rates for first time loan applicants remained lower and relatively unchanged over time).
88 iinn 1100 oovveerrddrraafftt aapppplliiccaattiioonnss wweerree ssuucccceessssffuull
For the 18 months to Q2 2017, 82% of all overdraft applicants ended the process with a facility: 76% were offered what they wanted and took it, while 6% took the overdraft after issues. 6% took another form of funding and 12% ended the process with no facility.
77 iinn 1100 llooaann aapppplliiccaattiioonnss wweerree ssuucccceessssffuull
For the 18 months to Q2 2017, 68% of all loan applicants ended the process with a facility: 53% were offered what they wanted and took it, while 15% took the overdraft after issues. 6% took another form of funding and 25% ended the process with no facility.
14
www.bdrc-continental.com
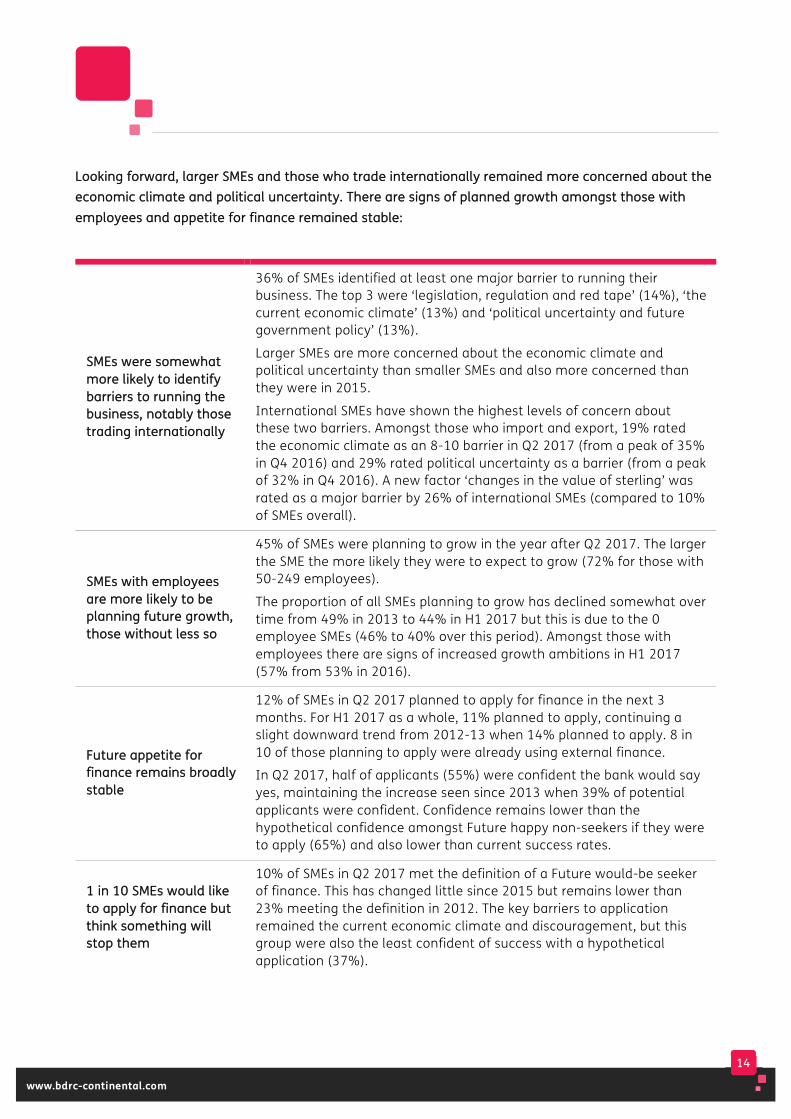
LLooookkiinngg ffoorrwwaarrdd,, llaarrggeerr SSMMEEss aanndd tthhoossee wwhhoo ttrraaddee iinntteerrnnaattiioonnaallllyy rreemmaaiinneedd mmoorree ccoonncceerrnneedd aabboouutt tthhee eeccoonnoommiicc cclliimmaattee aanndd ppoolliittiiccaall uunncceerrttaaiinnttyy.. TThheerree aarree ssiiggnnss ooff ppllaannnneedd ggrroowwtthh aammoonnggsstt tthhoossee wwiitthh eemmppllooyyeeeess aanndd aappppeettiittee ffoorr ffiinnaannccee rreemmaaiinneedd ssttaabbllee::
SSMMEEss wweerree ssoommeewwhhaatt mmoorree lliikkeellyy ttoo iiddeennttiiffyy bbaarrrriieerrss ttoo rruunnnniinngg tthhee bbuussiinneessss,, nnoottaabbllyy tthhoossee ttrraaddiinngg iinntteerrnnaattiioonnaallllyy
36% of SMEs identified at least one major barrier to running their business. The top 3 were ‘legislation, regulation and red tape’ (14%), ‘the current economic climate’ (13%) and ‘political uncertainty and future government policy’ (13%).
Larger SMEs are more concerned about the economic climate and political uncertainty than smaller SMEs and also more concerned than they were in 2015.
International SMEs have shown the highest levels of concern about these two barriers. Amongst those who import and export, 19% rated the economic climate as an 8-10 barrier in Q2 2017 (from a peak of 35% in Q4 2016) and 29% rated political uncertainty as a barrier (from a peak of 32% in Q4 2016). A new factor ‘changes in the value of sterling’ was rated as a major barrier by 26% of international SMEs (compared to 10% of SMEs overall).
SSMMEEss wwiitthh eemmppllooyyeeeess aarree mmoorree lliikkeellyy ttoo bbee ppllaannnniinngg ffuuttuurree ggrroowwtthh,, tthhoossee wwiitthhoouutt lleessss ssoo
45% of SMEs were planning to grow in the year after Q2 2017. The larger the SME the more likely they were to expect to grow (72% for those with 50-249 employees).
The proportion of all SMEs planning to grow has declined somewhat over time from 49% in 2013 to 44% in H1 2017 but this is due to the 0 employee SMEs (46% to 40% over this period). Amongst those with employees there are signs of increased growth ambitions in H1 2017 (57% from 53% in 2016).
FFuuttuurree aappppeettiittee ffoorr ffiinnaannccee rreemmaaiinnss bbrrooaaddllyy ssttaabbllee
12% of SMEs in Q2 2017 planned to apply for finance in the next 3 months. For H1 2017 as a whole, 11% planned to apply, continuing a slight downward trend from 2012-13 when 14% planned to apply. 8 in 10 of those planning to apply were already using external finance.
In Q2 2017, half of applicants (55%) were confident the bank would say yes, maintaining the increase seen since 2013 when 39% of potential applicants were confident. Confidence remains lower than the hypothetical confidence amongst Future happy non-seekers if they were to apply (65%) and also lower than current success rates.
11 iinn 1100 SSMMEEss wwoouulldd lliikkee ttoo aappppllyy ffoorr ffiinnaannccee bbuutt tthhiinnkk ssoommeetthhiinngg wwiillll ssttoopp tthheemm
10% of SMEs in Q2 2017 met the definition of a Future would-be seeker of finance. This has changed little since 2015 but remains lower than 23% meeting the definition in 2012. The key barriers to application remained the current economic climate and discouragement, but this group were also the least confident of success with a hypothetical application (37%).

15
www.bdrc-continental.com
3. Using this report
16
www.bdrc-continental.com
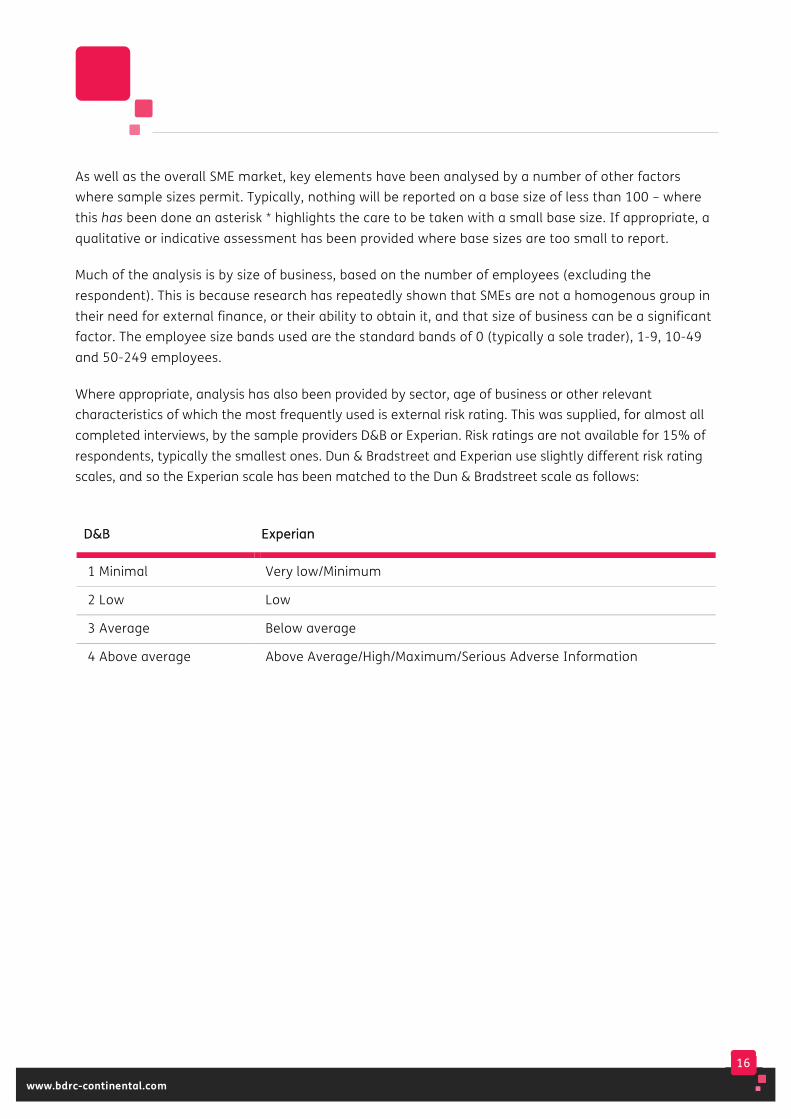
As well as the overall SME market, key elements have been analysed by a number of other factors where sample sizes permit. Typically, nothing will be reported on a base size of less than 100 – where this has been done an asterisk * highlights the care to be taken with a small base size. If appropriate, a qualitative or indicative assessment has been provided where base sizes are too small to report.
Much of the analysis is by size of business, based on the number of employees (excluding the respondent). This is because research has repeatedly shown that SMEs are not a homogenous group in their need for external finance, or their ability to obtain it, and that size of business can be a significant factor. The employee size bands used are the standard bands of 0 (typically a sole trader), 1-9, 10-49 and 50-249 employees.
Where appropriate, analysis has also been provided by sector, age of business or other relevant characteristics of which the most frequently used is external risk rating. This was supplied, for almost all completed interviews, by the sample providers D&B or Experian. Risk ratings are not available for 15% of respondents, typically the smallest ones. Dun & Bradstreet and Experian use slightly different risk rating scales, and so the Experian scale has been matched to the Dun & Bradstreet scale as follows:
DD&&BB EExxppeerriiaann
1 Minimal Very low/Minimum
2 Low Low
3 Average Below average
4 Above average Above Average/High/Maximum/Serious Adverse Information
17
www.bdrc-continental.com
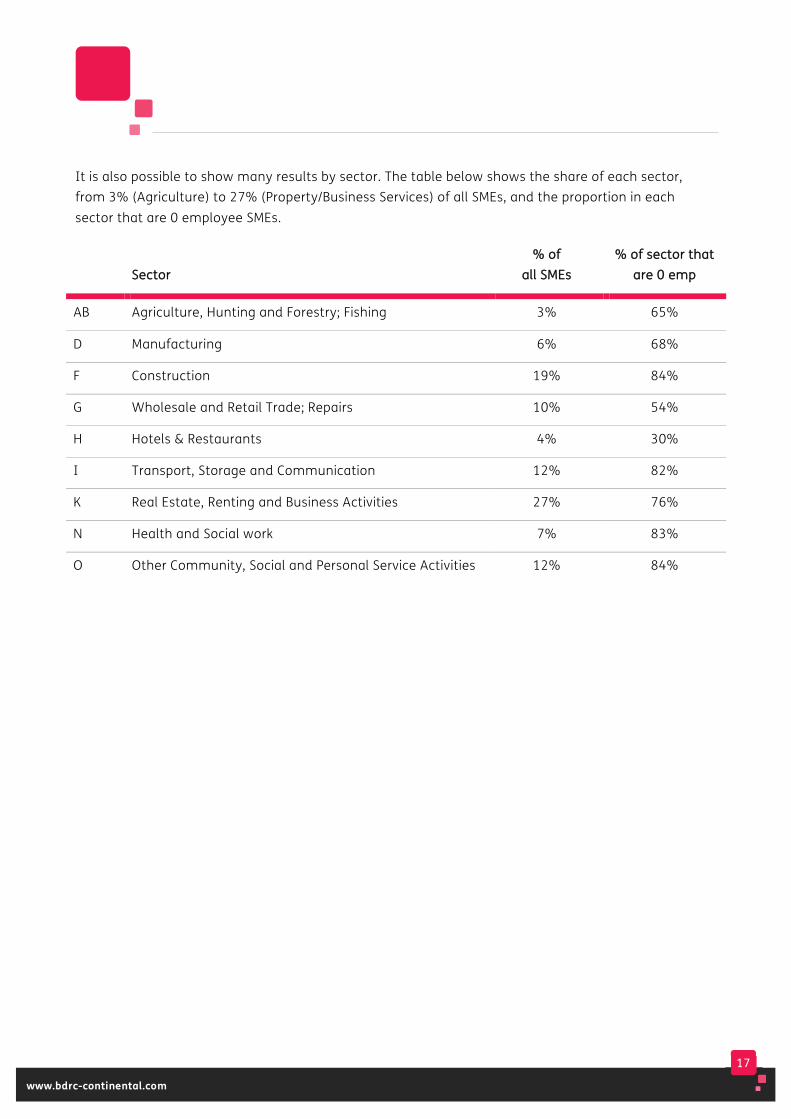
It is also possible to show many results by sector. The table below shows the share of each sector, from 3% (Agriculture) to 27% (Property/Business Services) of all SMEs, and the proportion in each sector that are 0 employee SMEs.
SSeeccttoorr
%% ooff aallll SSMMEEss
%% ooff sseeccttoorr tthhaatt aarree 00 eemmpp
AB Agriculture, Hunting and Forestry; Fishing 3% 65%
D Manufacturing 6% 68%
F Construction 19% 84%
G Wholesale and Retail Trade; Repairs 10% 54%
H Hotels & Restaurants 4% 30%
I Transport, Storage and Communication 12% 82%
K Real Estate, Renting and Business Activities 27% 76%
N Health and Social work 7% 83%
O Other Community, Social and Personal Service Activities 12% 84%

18
www.bdrc-continental.com
Analysis over time This report is based predominantly on four waves of data gathered across the 4 quarters to Q2 2017. In all four waves, SMEs were asked about their past behaviour during the previous 12 months, so there is an overlap in the time period each wave has reported on. These year-ending figures are defined by the date of iinntteerrvviieeww, i.e. all interviews conducted in the year concerned.
Where results can be shown by individual quarter over time, they have been. However, small sample sizes for some lines of questioning mean that in those instances data is reported based on four quarters combined (YEQ2 2017 in this report). This provides a robust sample size and allows for analysis by key sub-groups such as size, sector or external risk rating.
Each report also comments on changes in demand for credit and the outcome of applications over time. Here, it is more appropriate to analyse results based on when the aapppplliiccaattiioonn was made, rather than when the interview was conducted. Final data is now available for any applications made from 2010 up to and including Q2 2016 but for other more recent quarters data is still being gathered. Results for events occurring from Q3 2016 onwards are therefore still interim at this stage (respondents interviewed in Q3 2017 will report on events which occurred in Q3 2016 or later).
Where analysis is shown by date of application, this typically includes all interviews to date
(including those conducted 2011-2015 which are no longer included in the year-ending data reported elsewhere), and such tables are clearly labelled in the report. For all reportsfrom Q2 2013 onwards, when applications made are analysed by sub-group such as employee size, this is also now based on application date rather than date of interview. For the Q2 2017 report, this means such tables are based on all applications occurring in the 18 months between Q1 2016 and Q2 2017 to ensure a robust base size for analysis.
The exception to the approach outlined above is in the latter stages of the report where SMEs are asked about their planned future behaviour. In these instances, where we are typically reporting expectations for the next three months, comparisons are made between individual quarters as each provides an assessment of SME sentiment for the coming months and the comparison is an appropriate one.
Not all of the previous quarters are shown in the standard quarterly tables in this report. Quarterly data from 2011 -2014 is no longer routinely shown and subsequent reports will continue this policy of deleting the oldest wave before adding the latest.
However, a series of annual summary tables have been developed and were included for the first time in the Q2 2016 report. These complement the series of key charts in the final chapter of this report which show all results over time for key metrics.
19
www.bdrc-continental.com
Definitions used in this report Over time, a number of definitions have been developed for different SMEs and some standard terms are commonly used in this report. The most frequently used are summarised below:
SSMMEE ssiizzee – this is based on the number of employees (excluding the respondent). Those with more than 249 employees were excluded from the research
EExxtteerrnnaall rriisskk pprrooffiillee – this is provided by the sample providers (Dun & Bradstreet and Experian). Risk ratings are not available for 15% of respondents, typically the smallest ones. D&B and Experian use slightly different risk rating scales, and so the Experian scale has been matched to the D&B scale as shown at the start of this chapter
FFaasstt ggrroowwtthh – SMEs that report having grown by 20% or more each year, for each of the past 3 years (definition updated Q4 2012)
UUssee ooff eexxtteerrnnaall ffiinnaannccee – SMEs are asked whether they are currently using any of the following forms of finance: Bank overdraft, Credit cards, Bank loan, Commercial mortgage, Leasing or hire purchase, Loans/equity from directors, Loans/equity from family and friends, Invoice finance, Grants, Loans from other 3rd parties, Export/import finance
PPeerrmmaanneenntt nnoonn--bboorrrroowweerr – SMEs that seem firmly disinclined to borrow because they meet all of the following conditions: are not currently using external finance, have not used external finance in the past 5 years, have had no borrowing events in the past 12 months, have not applied for any other forms of finance in the last 12 months, said that they had had no desire to borrow in the past 12 months and reported no inclination to borrow in the next 3 months
BBoorrrroowwiinngg eevveenntt – these are defined as any Type 1 (new application or renewal), Type 2 (bank sought cancelation/renegotiation) or Type 3 (SME sought cancellation/reduction) borrowing event for loan or overdraft in the 12 months prior to interview. The definition also includes those SMEs that have seen their overdraft facility automatically renewed by their bank
WWoouulldd--bbee sseeeekkeerr – those SMEs that had not had a loan or overdraft borrowing event and said that something had stopped them applying for loan/overdraft funding in the previous 12 months (definition revised in Q1 2016 – the question is now asked once for both loan and overdraft events rather than separately, but the question wording has not changed)
20
www.bdrc-continental.com
HHaappppyy nnoonn--sseeeekkeerr – those SMEs that had not had a loan/overdraft borrowing event, and also said that nothing had stopped them applying for any (further) loan/overdraft funding in the previous 12 months (definition revised in Q4 2012)
IIssssuueess – something that needed further discussion before a loan or overdraft facility was agreed, typically the terms and conditions (security, fee or interest rate) or the amount initially offered by the bank
PPrriinncciippllee ooff bboorrrroowwiinngg – where an SME did not (or, looking ahead, will not) apply to borrow because they feared they might lose control of their business, or preferred to seek alternative sources of funding
PPrroocceessss ooff bboorrrroowwiinngg – where an SME did not (or, looking ahead, will not) apply to borrow because they thought it would be too expensive, too much hassle etc.
DDiissccoouurraaggeemmeenntt – where an SME did not (or, looking ahead, will not) apply to borrow because it had been put off, either directly (they made informal enquiries of the bank and felt put off) or indirectly (they thought they would be turned down by the bank so did not enquire)
MMaajjoorr oobbssttaaccllee – SMEs were asked to rate the extent to which each of a number of factors were perceived as obstacles to their running the business as they would wish in the next 12 months, using a 1 to 10 scale. Ratings of 8-10 are classed as a major obstacle
FFuuttuurree hhaappppyy nnoonn--sseeeekkeerrss – those that said they would not be applying to borrow (more) in the next three months because they said that they did not need to borrow (more) or already had the facilities they needed
FFuuttuurree wwoouulldd--bbee sseeeekkeerrss – those that felt that there were barriers that would stop them applying to borrow (more) in the next three months (such as discouragement, the economy or the principle or process of borrowing)
AAvveerraaggee – the arithmetic mean of values, calculated by adding the values together and dividing by the number of cases
MMeeddiiaann – a different type of average, found by arranging the values in order and then selecting the one in the middle. The median is a useful number in cases where there are very large extreme values which would otherwise skew the data, such as a few very large loans or overdraft facilities
21
www.bdrc-continental.com
Please note that the majority of data tables show ccoolluummnn percentages, which means that the percentage quoted is the percentage of the group described at the top of the column in which the figure appears. On some occasions, particularly for data shown over time, summary tables have been prepared which include rrooww percentages, which means that the percentage quoted is the percentage of the group described at the left hand side of the row in
which the figure appears. Where row percentages are shown, this is highlighted in the table.
From the Q2 2016 report onwards, additional summary tables have been prepared for key questions to show the changes year on year since 2012. This provides a longer term context for the changes being seen in the most recent quarters, upon which most reporting is based.
22
www.bdrc-continental.com
4. The general context
This chapter presents an overview of the characteristics of SMEs in the UK. Unless otherwise stated, figures are based on all interviews conducted in the year-ending Q2 2017 (YEQ2 17).
23
www.bdrc-continental.com
Key findings Most SMEs are profitable with 8 in 10 SMEs (81%) reporting making a profit YEQ2 2017. This proportion has increased steadily over time, from 69% in 2012 to 82% in the first half of 2017, and across all size bands, with the biggest increase seen amongst 0 employee SMEs (67% to 82%).
A consistent 4 in 10 SMEs (41%) reported having grown in the previous 12 months (excluding Starts). This has changed very little on an annual basis (39-42% since 2012), but was somewhat higher for Q2 2017 (46%).
• The proportion growing by 20% or more in the previous year has declined slightly over time, from 13% in 2014 to 8% for both 2016 and the first half of 2017
• 4% of all SMEs trading for 3 years or more had achieved scale up growth (20%+ growth for the 3 consecutive previous years).
The proportion of SMEs that innovate, whether through a new product or service or improving an aspect of the business, has declined over time from 40% in 2012 to 34% in the first half of 2017. Over the same period the proportion that plan has remained stable (currently 57%). The proportion trading internationally increased from 10% in 2012 to 16% in 2014 and has been stable since.
• Larger SMEs and those with a minimal or low risk rating are more likely to innovate, plan or be international
• 10% of SMEs export. Most of them (65%) say that exports make up a quarter or less of all sales and a similar proportion (62%) say that a minority, or none, of these sales are to the EU (a quarter of all exporters say that all or most or their sales are to the EU).
24
www.bdrc-continental.com
In H1 2017, 26% of SMEs held £10,000 or more in credit balances. This proportion has increased steadily over time (from 16% in 2012). Larger SMEs remained much more likely to hold such balances, but the proportion of 0 employee SMEs holding £10,000 or more has doubled since 2012 (from 10% to 19%). Amongst SMEs with such balances, 8 in 10 said that it reduced their need for external finance, the equivalent of 13% of all SMEs.
The external risk rating profile of SMEs is broadly stable over time. 22% have a minimal or low risk rating while just under half (47%) have a worse than average risk rating. This is much more likely to be the case for smaller SMEs (54% of those with 0 employees compared to 4% of those with 50-249 employees).
25
www.bdrc-continental.com
This chapter presents an overview of the characteristics of SMEs in the UK. Unless otherwise stated, figures are based on the 18,007 interviews conducted in the year ending Q2 2017 (that is Q3 and Q4 of 2016 and Q1 and Q2 of 2017). There were a number of trading challenges when the survey started in 2011, and analysis of this data over time provides an
indication of how SMEs have managed as conditions change. For example, in 2016, the Q1 and Q2 interviews were completed prior to the EU referendum result being known, while the Q3 and Q4 interviews were conducted in the months immediately afterwards and in 2017 the Q2 interviews were being conducted during and immediately after the General Election.
Profitability
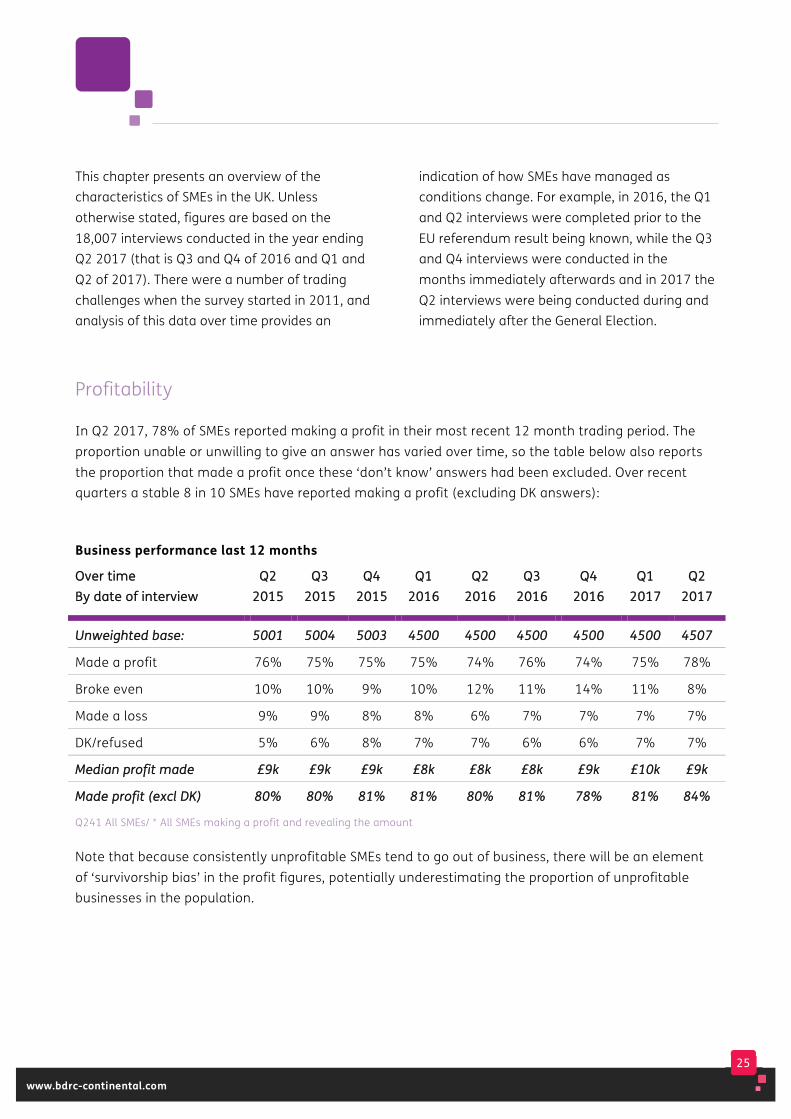
In Q2 2017, 78% of SMEs reported making a profit in their most recent 12 month trading period. The proportion unable or unwilling to give an answer has varied over time, so the table below also reports the proportion that made a profit once these ‘don’t know’ answers had been excluded. Over recent quarters a stable 8 in 10 SMEs have reported making a profit (excluding DK answers):
Business performance last 12 months
OOvveerr ttiimmee BByy ddaattee ooff iinntteerrvviieeww
QQ22 22001155
QQ33 22001155
QQ44 22001155
QQ11 22001166
QQ22 22001166
QQ33 22001166
QQ44 22001166
QQ11 22001177
QQ22 22001177
UUnnwweeiigghhtteedd bbaassee:: 55000011 55000044 55000033 44550000 44550000 44550000 44550000 44550000 44550077
Made a profit 76% 75% 75% 75% 74% 76% 74% 75% 78%
Broke even 10% 10% 9% 10% 12% 11% 14% 11% 8%
Made a loss 9% 9% 8% 8% 6% 7% 7% 7% 7%
DK/refused 5% 6% 8% 7% 7% 6% 6% 7% 7%
MMeeddiiaann pprrooffiitt mmaaddee ££99kk ££99kk ££99kk ££88kk ££88kk ££88kk ££99kk ££1100kk ££99kk
MMaaddee pprrooffiitt ((eexxccll DDKK)) 8800%% 8800%% 8811%% 8811%% 8800%% 8811%% 7788%% 8811%% 8844%%
Q241 All SMEs/ * All SMEs making a profit and revealing the amount
Note that because consistently unprofitable SMEs tend to go out of business, there will be an element of ‘survivorship bias’ in the profit figures, potentially underestimating the proportion of unprofitable businesses in the population.
26
www.bdrc-continental.com
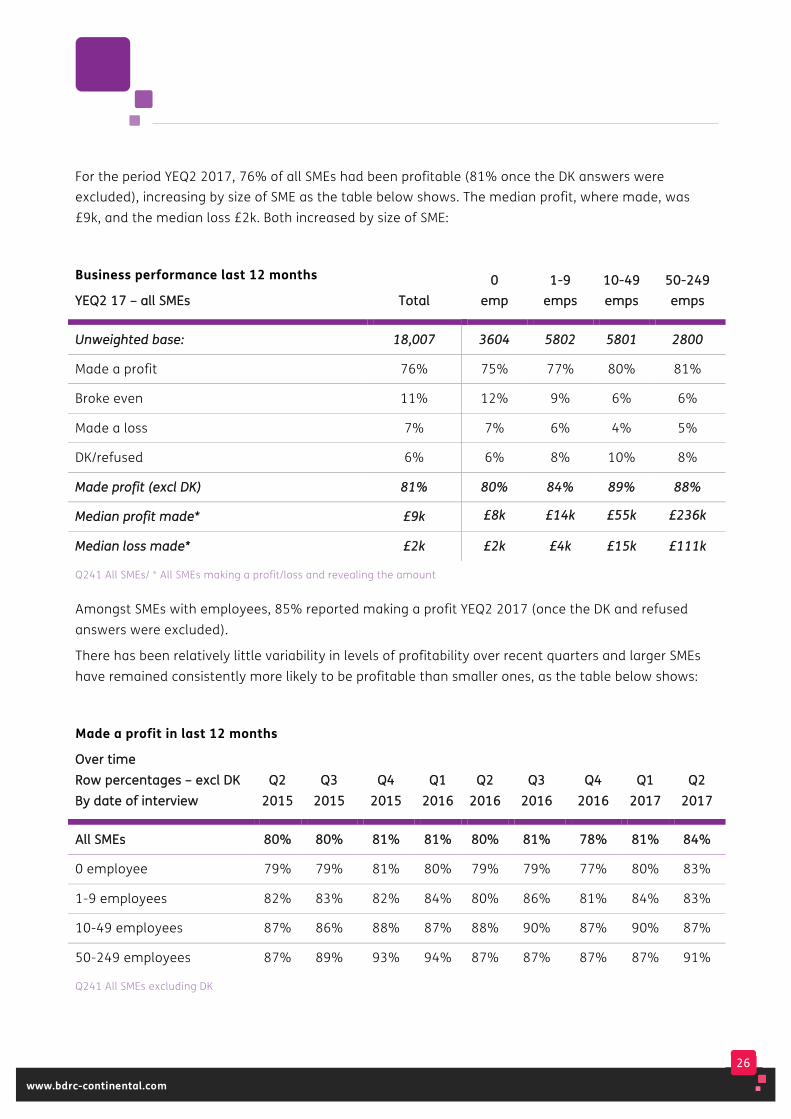
For the period YEQ2 2017, 76% of all SMEs had been profitable (81% once the DK answers were excluded), increasing by size of SME as the table below shows. The median profit, where made, was £9k, and the median loss £2k. Both increased by size of SME:
Business performance last 12 months
YYEEQQ22 1177 –– aallll SSMMEEss
TToottaall 00
eemmpp 11--99
eemmppss 1100--4499 eemmppss
5500--224499 eemmppss
UUnnwweeiigghhtteedd bbaassee:: 1188,,000077 33660044 55880022 55880011 22880000
Made a profit 76% 75% 77% 80% 81%
Broke even 11% 12% 9% 6% 6%
Made a loss 7% 7% 6% 4% 5%
DK/refused 6% 6% 8% 10% 8%
MMaaddee pprrooffiitt ((eexxccll DDKK)) 8811%% 8800%% 8844%% 8899%% 8888%%
MMeeddiiaann pprrooffiitt mmaaddee** ££99kk ££88kk ££1144kk ££5555kk ££223366kk
MMeeddiiaann lloossss mmaaddee** ££22kk ££22kk ££44kk ££1155kk ££111111kk
Q241 All SMEs/ * All SMEs making a profit/loss and revealing the amount
Amongst SMEs with employees, 85% reported making a profit YEQ2 2017 (once the DK and refused answers were excluded).
There has been relatively little variability in levels of profitability over recent quarters and larger SMEs have remained consistently more likely to be profitable than smaller ones, as the table below shows:
Q241 All SMEs excluding DK
Made a profit in last 12 months
OOvveerr ttiimmee RRooww ppeerrcceennttaaggeess –– eexxccll DDKK BByy ddaattee ooff iinntteerrvviieeww
QQ22 22001155
QQ33 22001155
QQ44 22001155
QQ11 22001166
QQ22 22001166
QQ33 22001166
QQ44 22001166
QQ11 22001177
QQ22 22001177
AAllll SSMMEEss 8800%% 8800%% 8811%% 8811%% 8800%% 8811%% 7788%% 8811%% 8844%%
0 employee 79% 79% 81% 80% 79% 79% 77% 80% 83%
1-9 employees 82% 83% 82% 84% 80% 86% 81% 84% 83%
10-49 employees 87% 86% 88% 87% 88% 90% 87% 90% 87%
50-249 employees 87% 89% 93% 94% 87% 87% 87% 87% 91%
27
www.bdrc-continental.com
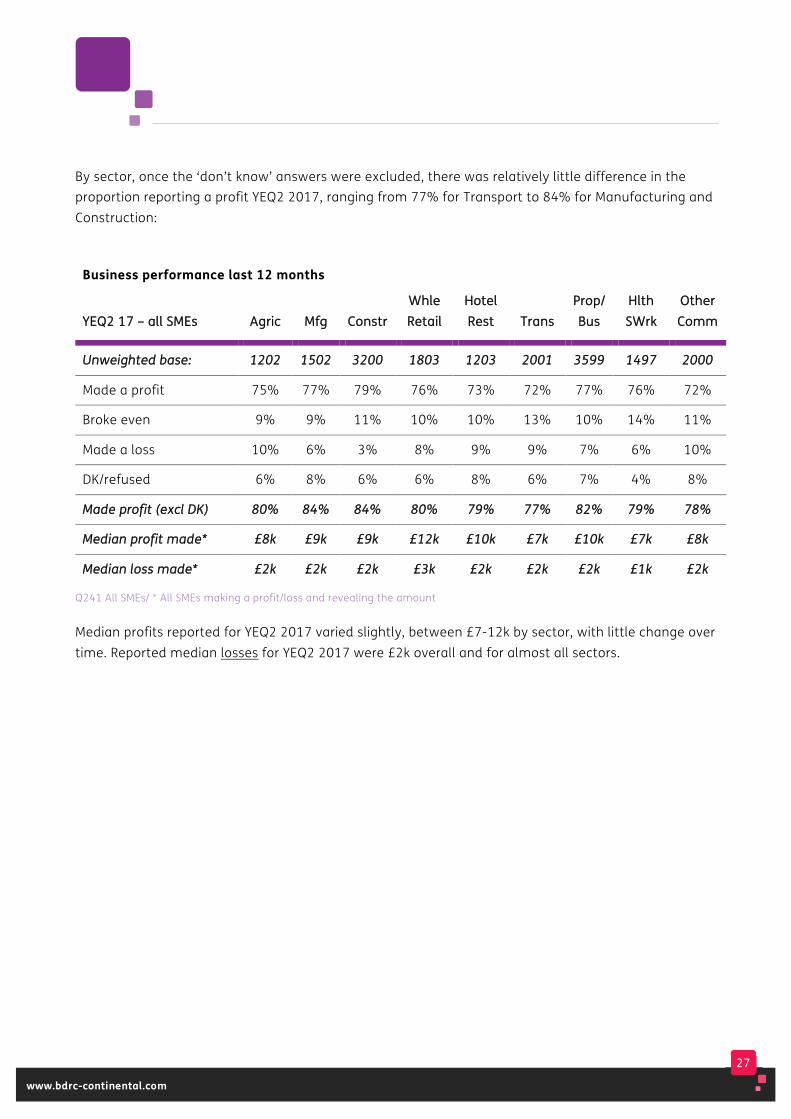
By sector, once the ‘don’t know’ answers were excluded, there was relatively little difference in the proportion reporting a profit YEQ2 2017, ranging from 77% for Transport to 84% for Manufacturing and Construction:
Business performance last 12 months
YYEEQQ22 1177 –– aallll SSMMEEss AAggrriicc MMffgg CCoonnssttrr WWhhllee RReettaaiill
HHootteell RReesstt TTrraannss
PPrroopp// BBuuss
HHlltthh SSWWrrkk
OOtthheerr CCoommmm
UUnnwweeiigghhtteedd bbaassee:: 11220022 11550022 33220000 11880033 11220033 22000011 33559999 11449977 22000000
Made a profit 75% 77% 79% 76% 73% 72% 77% 76% 72%
Broke even 9% 9% 11% 10% 10% 13% 10% 14% 11%
Made a loss 10% 6% 3% 8% 9% 9% 7% 6% 10%
DK/refused 6% 8% 6% 6% 8% 6% 7% 4% 8%
MMaaddee pprrooffiitt ((eexxccll DDKK)) 8800%% 8844%% 8844%% 8800%% 7799%% 7777%% 8822%% 7799%% 7788%%
MMeeddiiaann pprrooffiitt mmaaddee** ££88kk ££99kk ££99kk ££1122kk ££1100kk ££77kk ££1100kk ££77kk ££88kk
MMeeddiiaann lloossss mmaaddee** ££22kk ££22kk ££22kk ££33kk ££22kk ££22kk ££22kk ££11kk ££22kk
Q241 All SMEs/ * All SMEs making a profit/loss and revealing the amount
Median profits reported for YEQ2 2017 varied slightly, between £7-12k by sector, with little change over time. Reported median losses for YEQ2 2017 were £2k overall and for almost all sectors.
28
www.bdrc-continental.com
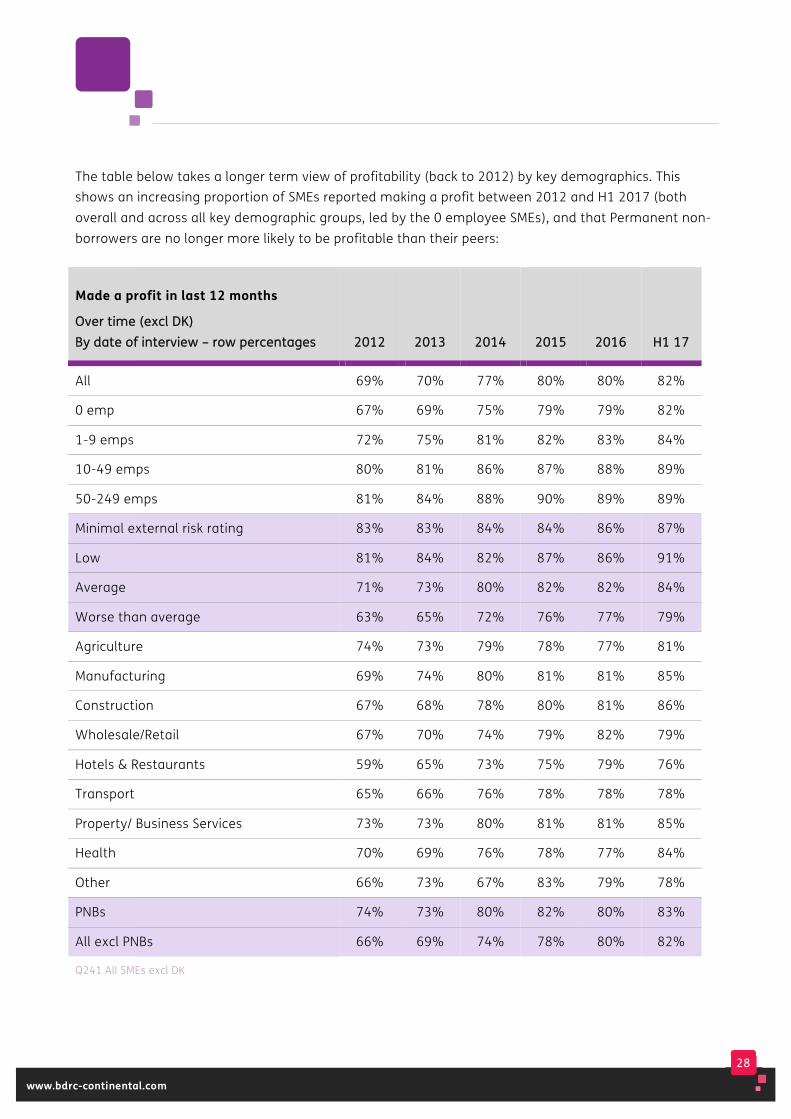
The table below takes a longer term view of profitability (back to 2012) by key demographics. This shows an increasing proportion of SMEs reported making a profit between 2012 and H1 2017 (both overall and across all key demographic groups, led by the 0 employee SMEs), and that Permanent non-borrowers are no longer more likely to be profitable than their peers:
Made a profit in last 12 months
OOvveerr ttiimmee ((eexxccll DDKK)) BByy ddaattee ooff iinntteerrvviieeww –– rrooww ppeerrcceennttaaggeess 22001122 22001133 22001144 22001155
22001166 HH11 1177
All 69% 70% 77% 80% 80% 82%
0 emp 67% 69% 75% 79% 79% 82%
1-9 emps 72% 75% 81% 82% 83% 84%
10-49 emps 80% 81% 86% 87% 88% 89%
50-249 emps 81% 84% 88% 90% 89% 89%
Minimal external risk rating 83% 83% 84% 84% 86% 87%
Low 81% 84% 82% 87% 86% 91%
Average 71% 73% 80% 82% 82% 84%
Worse than average 63% 65% 72% 76% 77% 79%
Agriculture 74% 73% 79% 78% 77% 81%
Manufacturing 69% 74% 80% 81% 81% 85%
Construction 67% 68% 78% 80% 81% 86%
Wholesale/Retail 67% 70% 74% 79% 82% 79%
Hotels & Restaurants 59% 65% 73% 75% 79% 76%
Transport 65% 66% 76% 78% 78% 78%
Property/ Business Services 73% 73% 80% 81% 81% 85%
Health 70% 69% 76% 78% 77% 84%
Other 66% 73% 67% 83% 79% 78%
PNBs 74% 73% 80% 82% 80% 83%
All excl PNBs 66% 69% 74% 78% 80% 82%
Q241 All SMEs excl DK
29
www.bdrc-continental.com
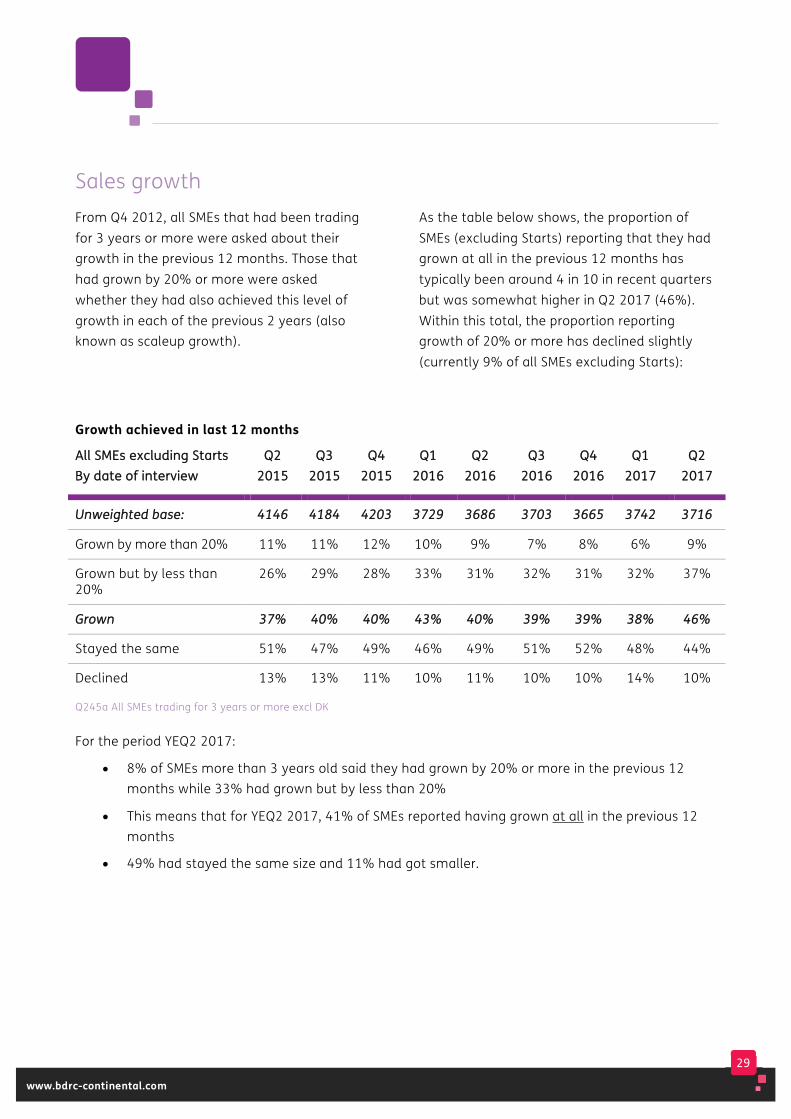
Sales growth From Q4 2012, all SMEs that had been trading for 3 years or more were asked about their growth in the previous 12 months. Those that had grown by 20% or more were asked whether they had also achieved this level of growth in each of the previous 2 years (also known as scaleup growth).
As the table below shows, the proportion of SMEs (excluding Starts) reporting that they had grown at all in the previous 12 months has typically been around 4 in 10 in recent quarters but was somewhat higher in Q2 2017 (46%). Within this total, the proportion reporting growth of 20% or more has declined slightly (currently 9% of all SMEs excluding Starts):
Growth achieved in last 12 months
AAllll SSMMEEss eexxcclluuddiinngg SSttaarrttss BByy ddaattee ooff iinntteerrvviieeww
QQ22 22001155
QQ33 22001155
QQ44 22001155
QQ11 22001166
QQ22 22001166
QQ33 22001166
QQ44 22001166
QQ11 22001177
QQ22 22001177
UUnnwweeiigghhtteedd bbaassee:: 44114466 44118844 44220033 33772299 33668866 33770033 33666655 33774422 33771166
Grown by more than 20% 11% 11% 12% 10% 9% 7% 8% 6% 9%
Grown but by less than 20%
26% 29% 28% 33% 31% 32% 31% 32% 37%
GGrroowwnn 3377%% 4400%% 4400%% 4433%% 4400%% 3399%% 3399%% 3388%% 4466%%
Stayed the same 51% 47% 49% 46% 49% 51% 52% 48% 44%
Declined 13% 13% 11% 10% 11% 10% 10% 14% 10%
Q245a All SMEs trading for 3 years or more excl DK
For the period YEQ2 2017:
• 8% of SMEs more than 3 years old said they had grown by 20% or more in the previous 12 months while 33% had grown but by less than 20%
• This means that for YEQ2 2017, 41% of SMEs reported having grown at all in the previous 12 months
• 49% had stayed the same size and 11% had got smaller.
30
www.bdrc-continental.com
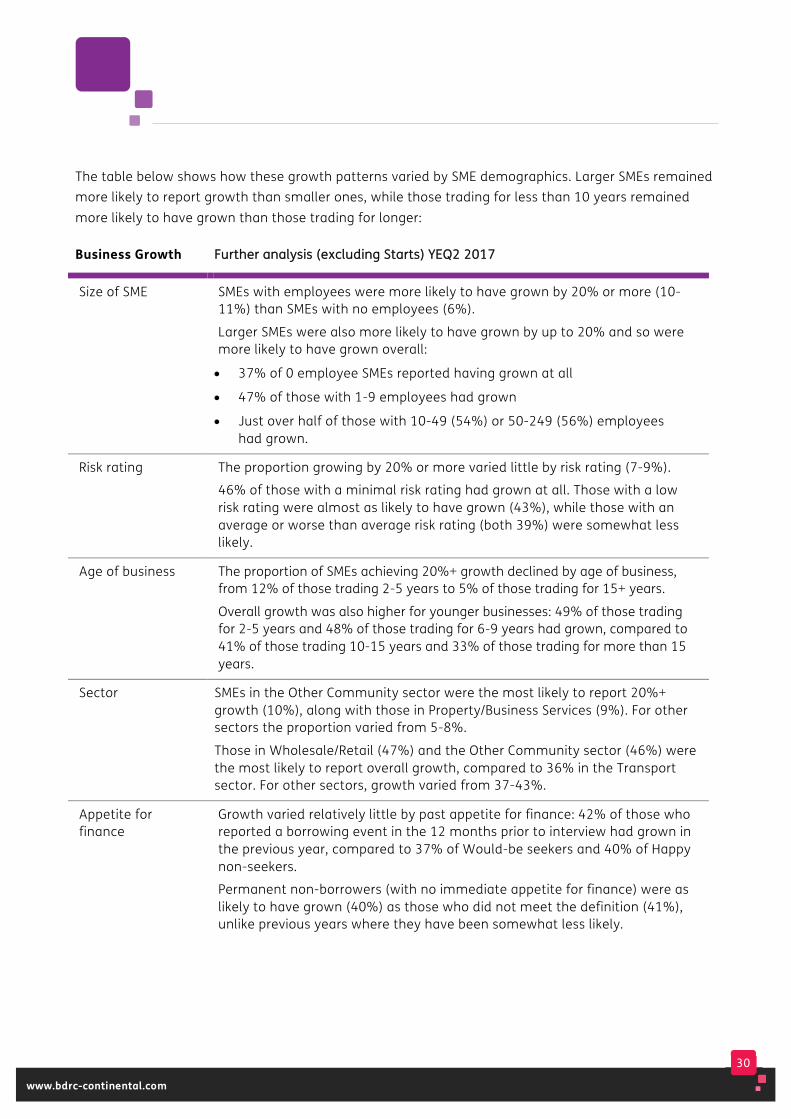
The table below shows how these growth patterns varied by SME demographics. Larger SMEs remained more likely to report growth than smaller ones, while those trading for less than 10 years remained more likely to have grown than those trading for longer:
Business Growth FFuurrtthheerr aannaallyyssiiss ((eexxcclluuddiinngg SSttaarrttss)) YYEEQQ22 22001177
Size of SME SMEs with employees were more likely to have grown by 20% or more (10-11%) than SMEs with no employees (6%).
Larger SMEs were also more likely to have grown by up to 20% and so were more likely to have grown overall:
• 37% of 0 employee SMEs reported having grown at all
• 47% of those with 1-9 employees had grown
• Just over half of those with 10-49 (54%) or 50-249 (56%) employees had grown.
Risk rating The proportion growing by 20% or more varied little by risk rating (7-9%).
46% of those with a minimal risk rating had grown at all. Those with a low risk rating were almost as likely to have grown (43%), while those with an average or worse than average risk rating (both 39%) were somewhat less likely.
Age of business The proportion of SMEs achieving 20%+ growth declined by age of business, from 12% of those trading 2-5 years to 5% of those trading for 15+ years.
Overall growth was also higher for younger businesses: 49% of those trading for 2-5 years and 48% of those trading for 6-9 years had grown, compared to 41% of those trading 10-15 years and 33% of those trading for more than 15 years.
Sector SMEs in the Other Community sector were the most likely to report 20%+ growth (10%), along with those in Property/Business Services (9%). For other sectors the proportion varied from 5-8%.
Those in Wholesale/Retail (47%) and the Other Community sector (46%) were the most likely to report overall growth, compared to 36% in the Transport sector. For other sectors, growth varied from 37-43%.
Appetite for finance
Growth varied relatively little by past appetite for finance: 42% of those who reported a borrowing event in the 12 months prior to interview had grown in the previous year, compared to 37% of Would-be seekers and 40% of Happy non-seekers.
Permanent non-borrowers (with no immediate appetite for finance) were as likely to have grown (40%) as those who did not meet the definition (41%), unlike previous years where they have been somewhat less likely.
31
www.bdrc-continental.com
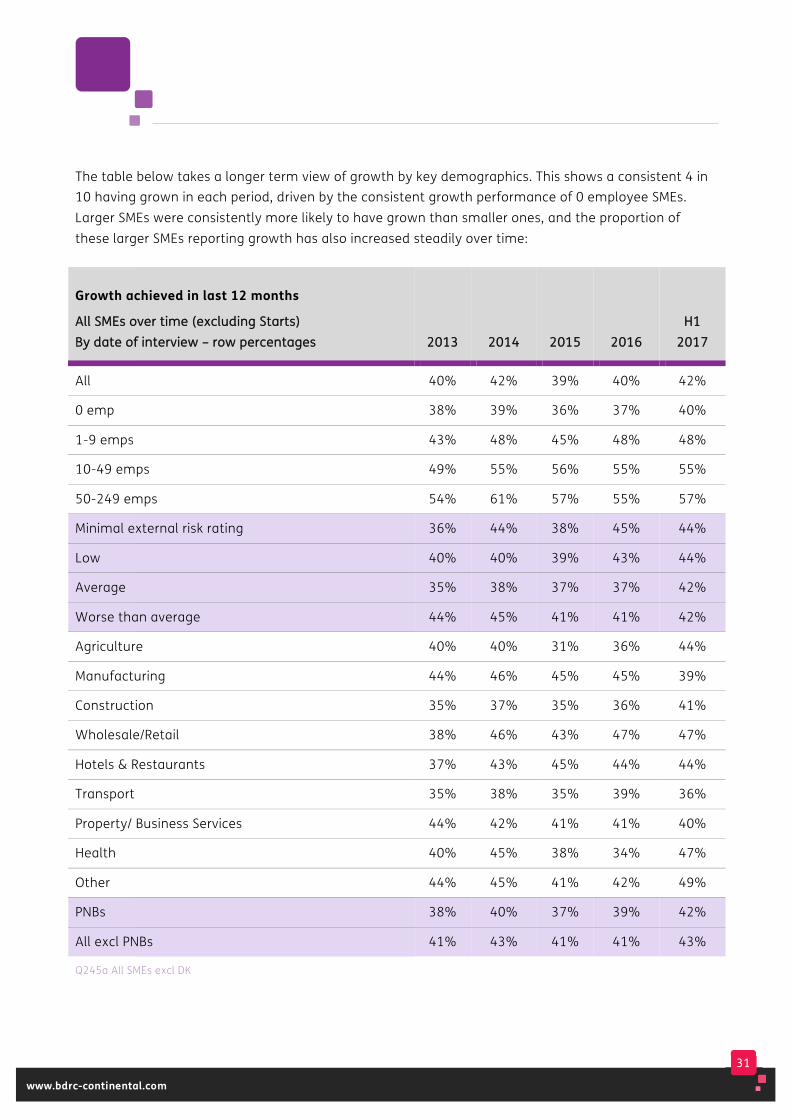
The table below takes a longer term view of growth by key demographics. This shows a consistent 4 in 10 having grown in each period, driven by the consistent growth performance of 0 employee SMEs. Larger SMEs were consistently more likely to have grown than smaller ones, and the proportion of these larger SMEs reporting growth has also increased steadily over time:
Growth achieved in last 12 months
AAllll SSMMEEss oovveerr ttiimmee ((eexxcclluuddiinngg SSttaarrttss)) BByy ddaattee ooff iinntteerrvviieeww –– rrooww ppeerrcceennttaaggeess 22001133 22001144 22001155 22001166
HH11 22001177
All 40% 42% 39% 40% 42%
0 emp 38% 39% 36% 37% 40%
1-9 emps 43% 48% 45% 48% 48%
10-49 emps 49% 55% 56% 55% 55%
50-249 emps 54% 61% 57% 55% 57%
Minimal external risk rating 36% 44% 38% 45% 44%
Low 40% 40% 39% 43% 44%
Average 35% 38% 37% 37% 42%
Worse than average 44% 45% 41% 41% 42%
Agriculture 40% 40% 31% 36% 44%
Manufacturing 44% 46% 45% 45% 39%
Construction 35% 37% 35% 36% 41%
Wholesale/Retail 38% 46% 43% 47% 47%
Hotels & Restaurants 37% 43% 45% 44% 44%
Transport 35% 38% 35% 39% 36%
Property/ Business Services 44% 42% 41% 41% 40%
Health 40% 45% 38% 34% 47%
Other 44% 45% 41% 42% 49%
PNBs 38% 40% 37% 39% 42%
All excl PNBs 41% 43% 41% 41% 43%
Q245a All SMEs excl DK
32
www.bdrc-continental.com
Scaleup growth
In the first half of 2017, 8% of SMEs (excluding Starts) reported that they had grown by 20% or more in the previous 12 months. The proportion was unchanged from 2016 but somewhat lower than seen in previous years (13% in 2014).
Amongst those trading for more than 2 years who reported for YEQ2 2017 that they had grown by 20% or more, 6 in 10 (58%) went on to report that they had also achieved this level of growth for each of the two previous years. The proportion reporting such growth increased with size (55% of those with 0 employees to 66% of those with 50-249 employees).
This is the equivalent of 4% of all SMEs 3+ years old achieving 3 years of 20%+ growth, also known as ‘scaleup’ growth.
• This increased slightly by size (3% for 0 employee SMEs and 6% for all employee bands)
• By sector, 6% Other Community sector had achieved such growth
• PNBs were no more or less likely to have achieved scaleup growth (4%) than non-PNBs (5%)
• Those using external finance were no more or less likely to have achieved scaleup growth (4%) than non-users (4%)
• SMES trading 2-5 years were the most likely to be scaleups (7%) compared to 4% of those trading 6-15 years and 3% of older SMEs.
Past and future growth
The Monitor has recorded future growth expectations since it started in early 2011. This allows a comparison to be made between growth expectations recorded from 2011 onwards and growth subsequently achieved, albeit that these are based on ddiiffffeerreenntt samples of SMEs and so this is not a direct comparison between prediction and achievement.
The table below shows the proportion of SMEs 3+ years old that predicted they would grow in the first time period, and compares it to the
proportion of SMEs 3+ years old that reported having achieved growth in the second period. Since this analysis started, the predictions made have typically proved to be very close to the growth figures subsequently reported (by a different sample of SMEs). The growth achieved more recently, in Q4 2016 and Q1 2017, did not bear out the predictions made in 2015 but the growth achieved in Q2 2017 exceeded that predicted in Q1 2016 due to the performance of those with 0-9 employees (predicted growth of 38%, actual growth of 46%).
33
www.bdrc-continental.com
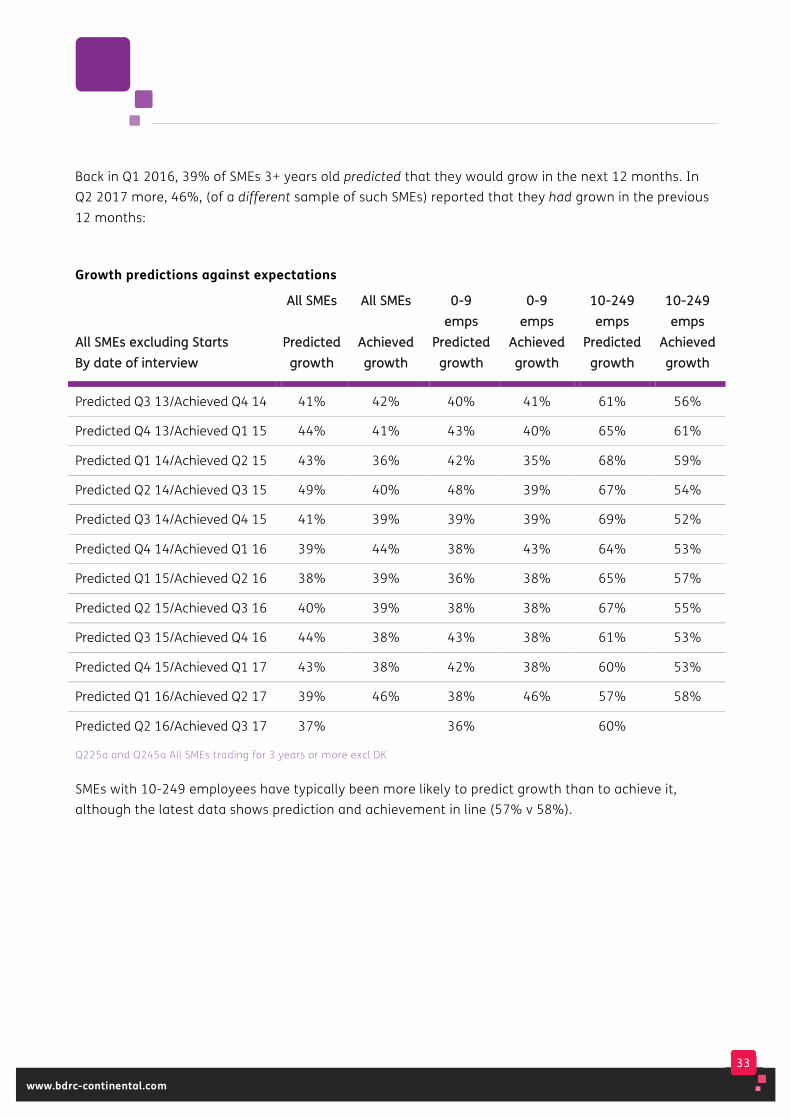
Back in Q1 2016, 39% of SMEs 3+ years old predicted that they would grow in the next 12 months. In Q2 2017 more, 46%, (of a different sample of such SMEs) reported that they had grown in the previous 12 months:
Growth predictions against expectations
AAllll SSMMEEss eexxcclluuddiinngg SSttaarrttss BByy ddaattee ooff iinntteerrvviieeww
AAllll SSMMEEss
PPrreeddiicctteedd ggrroowwtthh
AAllll SSMMEEss
AAcchhiieevveedd ggrroowwtthh
00--99 eemmppss
PPrreeddiicctteedd ggrroowwtthh
00--99 eemmppss
AAcchhiieevveedd ggrroowwtthh
1100--224499 eemmppss
PPrreeddiicctteedd ggrroowwtthh
1100--224499 eemmppss
AAcchhiieevveedd ggrroowwtthh
Predicted Q3 13/Achieved Q4 14 41% 42% 40% 41% 61% 56%
Predicted Q4 13/Achieved Q1 15 44% 41% 43% 40% 65% 61%
Predicted Q1 14/Achieved Q2 15 43% 36% 42% 35% 68% 59%
Predicted Q2 14/Achieved Q3 15 49% 40% 48% 39% 67% 54%
Predicted Q3 14/Achieved Q4 15 41% 39% 39% 39% 69% 52%
Predicted Q4 14/Achieved Q1 16 39% 44% 38% 43% 64% 53%
Predicted Q1 15/Achieved Q2 16 38% 39% 36% 38% 65% 57%
Predicted Q2 15/Achieved Q3 16 40% 39% 38% 38% 67% 55%
Predicted Q3 15/Achieved Q4 16 44% 38% 43% 38% 61% 53%
Predicted Q4 15/Achieved Q1 17 43% 38% 42% 38% 60% 53%
Predicted Q1 16/Achieved Q2 17 39% 46% 38% 46% 57% 58%
Predicted Q2 16/Achieved Q3 17 37% 36% 60%
Q225a and Q245a All SMEs trading for 3 years or more excl DK
SMEs with 10-249 employees have typically been more likely to predict growth than to achieve it, although the latest data shows prediction and achievement in line (57% v 58%).
34
www.bdrc-continental.com
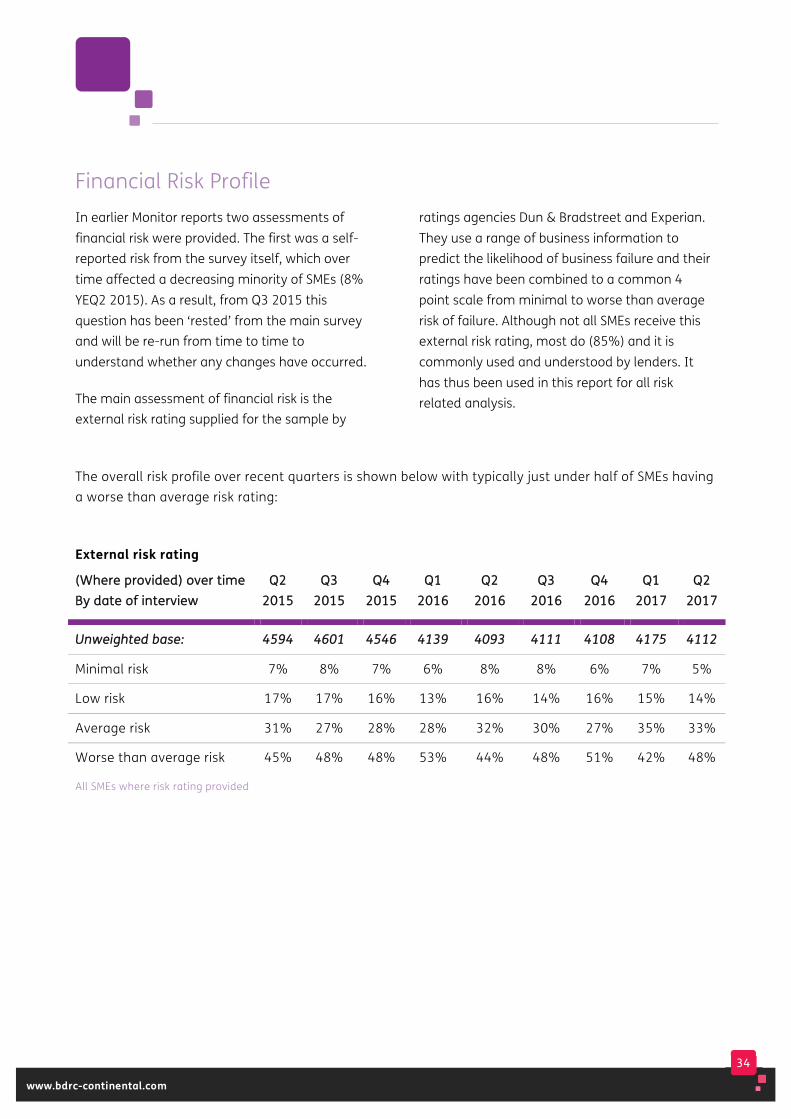
Financial Risk Profile In earlier Monitor reports two assessments of financial risk were provided. The first was a self-reported risk from the survey itself, which over time affected a decreasing minority of SMEs (8% YEQ2 2015). As a result, from Q3 2015 this question has been ‘rested’ from the main survey and will be re-run from time to time to understand whether any changes have occurred.
The main assessment of financial risk is the external risk rating supplied for the sample by
ratings agencies Dun & Bradstreet and Experian. They use a range of business information to predict the likelihood of business failure and their ratings have been combined to a common 4 point scale from minimal to worse than average risk of failure. Although not all SMEs receive this external risk rating, most do (85%) and it is commonly used and understood by lenders. It has thus been used in this report for all risk related analysis.
The overall risk profile over recent quarters is shown below with typically just under half of SMEs having a worse than average risk rating:
External risk rating
((WWhheerree pprroovviiddeedd)) oovveerr ttiimmee BByy ddaattee ooff iinntteerrvviieeww
QQ22 22001155
QQ33 22001155
QQ44 22001155
QQ11 22001166
QQ22 22001166
QQ33 22001166
QQ44 22001166
QQ11 22001177
QQ22 22001177
UUnnwweeiigghhtteedd bbaassee:: 44559944 44660011 44554466 44113399 44009933 44111111 44110088 44117755 44111122
Minimal risk 7% 8% 7% 6% 8% 8% 6% 7% 5%
Low risk 17% 17% 16% 13% 16% 14% 16% 15% 14%
Average risk 31% 27% 28% 28% 32% 30% 27% 35% 33%
Worse than average risk 45% 48% 48% 53% 44% 48% 51% 42% 48%
All SMEs where risk rating provided
35
www.bdrc-continental.com
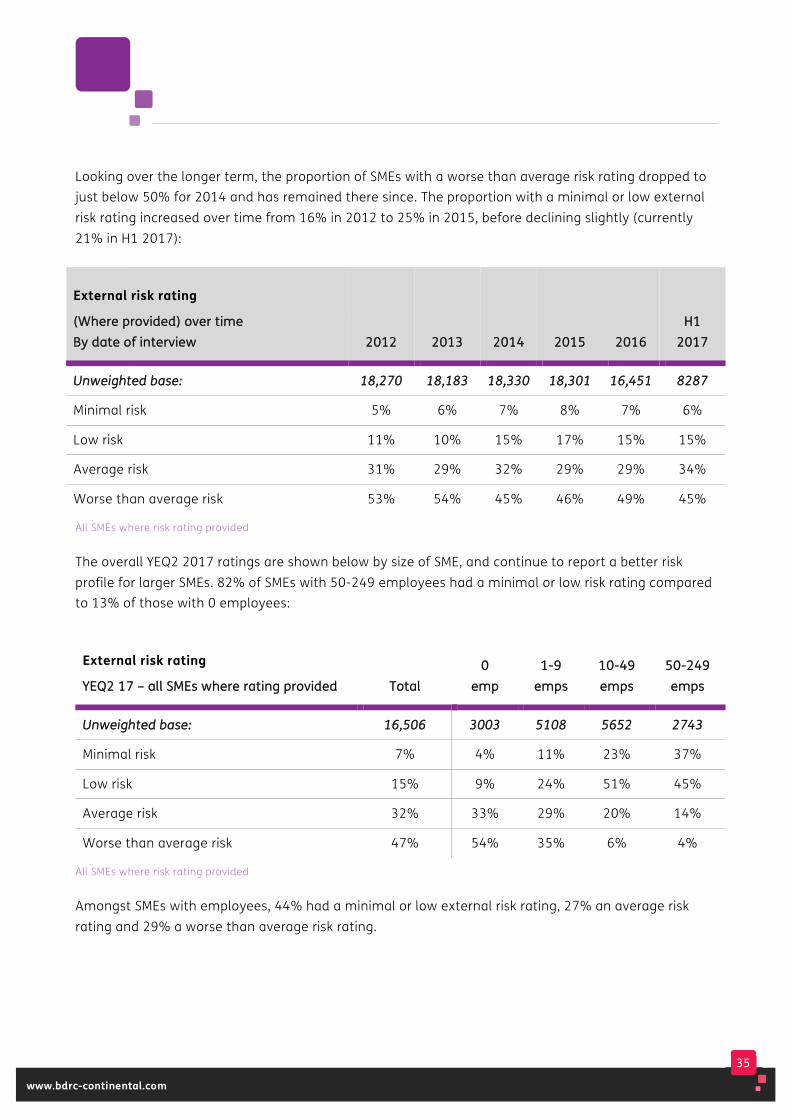
Looking over the longer term, the proportion of SMEs with a worse than average risk rating dropped to just below 50% for 2014 and has remained there since. The proportion with a minimal or low external risk rating increased over time from 16% in 2012 to 25% in 2015, before declining slightly (currently 21% in H1 2017):
External risk rating
((WWhheerree pprroovviiddeedd)) oovveerr ttiimmee BByy ddaattee ooff iinntteerrvviieeww 22001122 22001133 22001144 22001155
22001166
HH11 22001177
UUnnwweeiigghhtteedd bbaassee:: 1188,,227700 1188,,118833 1188,,333300 1188,,330011 1166,,445511 88228877
Minimal risk 5% 6% 7% 8% 7% 6%
Low risk 11% 10% 15% 17% 15% 15%
Average risk 31% 29% 32% 29% 29% 34%
Worse than average risk 53% 54% 45% 46% 49% 45%
All SMEs where risk rating provided
The overall YEQ2 2017 ratings are shown below by size of SME, and continue to report a better risk profile for larger SMEs. 82% of SMEs with 50-249 employees had a minimal or low risk rating compared to 13% of those with 0 employees:
External risk rating
YYEEQQ22 1177 –– aallll SSMMEEss wwhheerree rraattiinngg pprroovviiddeedd TToottaall 00
eemmpp 11--99
eemmppss 1100--4499 eemmppss
5500--224499 eemmppss
UUnnwweeiigghhtteedd bbaassee:: 1166,,550066 33000033 55110088 55665522 22774433
Minimal risk 7% 4% 11% 23% 37%
Low risk 15% 9% 24% 51% 45%
Average risk 32% 33% 29% 20% 14%
Worse than average risk 47% 54% 35% 6% 4%
All SMEs where risk rating provided
Amongst SMEs with employees, 44% had a minimal or low external risk rating, 27% an average risk rating and 29% a worse than average risk rating.
36
www.bdrc-continental.com
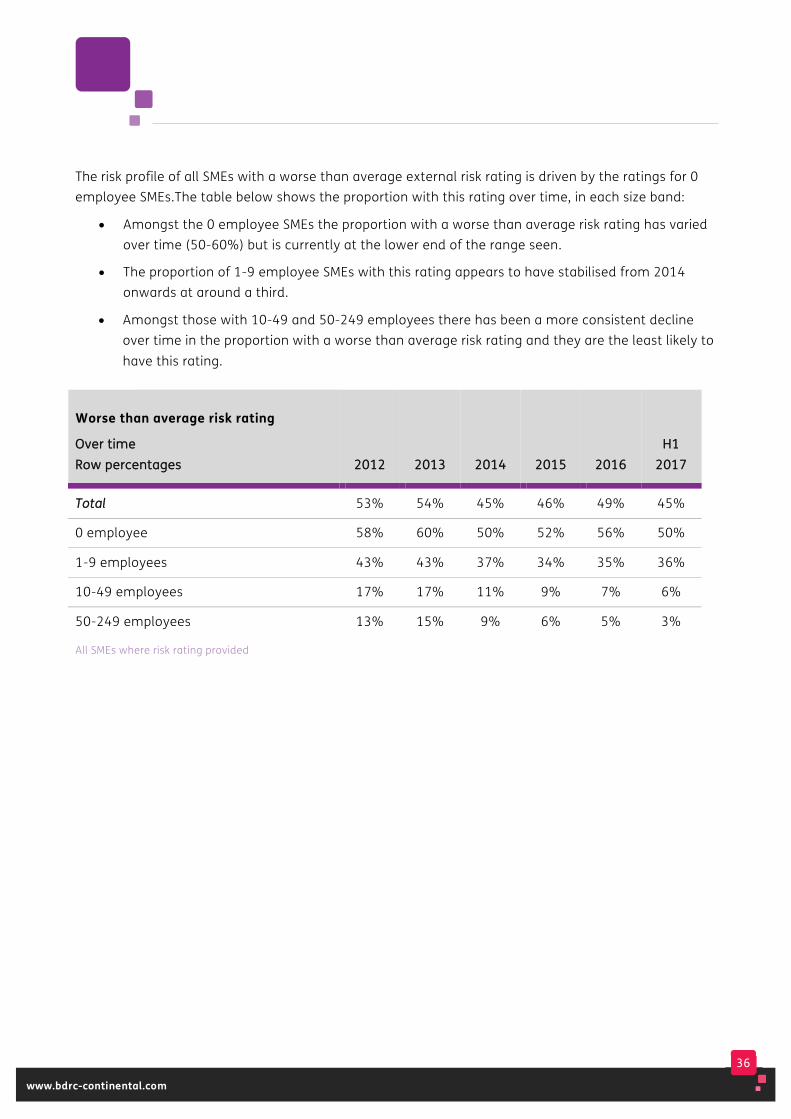
The risk profile of all SMEs with a worse than average external risk rating is driven by the ratings for 0 employee SMEs.The table below shows the proportion with this rating over time, in each size band:
• Amongst the 0 employee SMEs the proportion with a worse than average risk rating has varied over time (50-60%) but is currently at the lower end of the range seen.
• The proportion of 1-9 employee SMEs with this rating appears to have stabilised from 2014 onwards at around a third.
• Amongst those with 10-49 and 50-249 employees there has been a more consistent decline over time in the proportion with a worse than average risk rating and they are the least likely to have this rating.
Worse than average risk rating
OOvveerr ttiimmee RRooww ppeerrcceennttaaggeess 22001122 22001133 22001144 22001155
22001166
HH11 22001177
TToottaall 53% 54% 45% 46% 49% 45%
0 employee 58% 60% 50% 52% 56% 50%
1-9 employees 43% 43% 37% 34% 35% 36%
10-49 employees 17% 17% 11% 9% 7% 6%
50-249 employees 13% 15% 9% 6% 5% 3%
All SMEs where risk rating provided
37
www.bdrc-continental.com
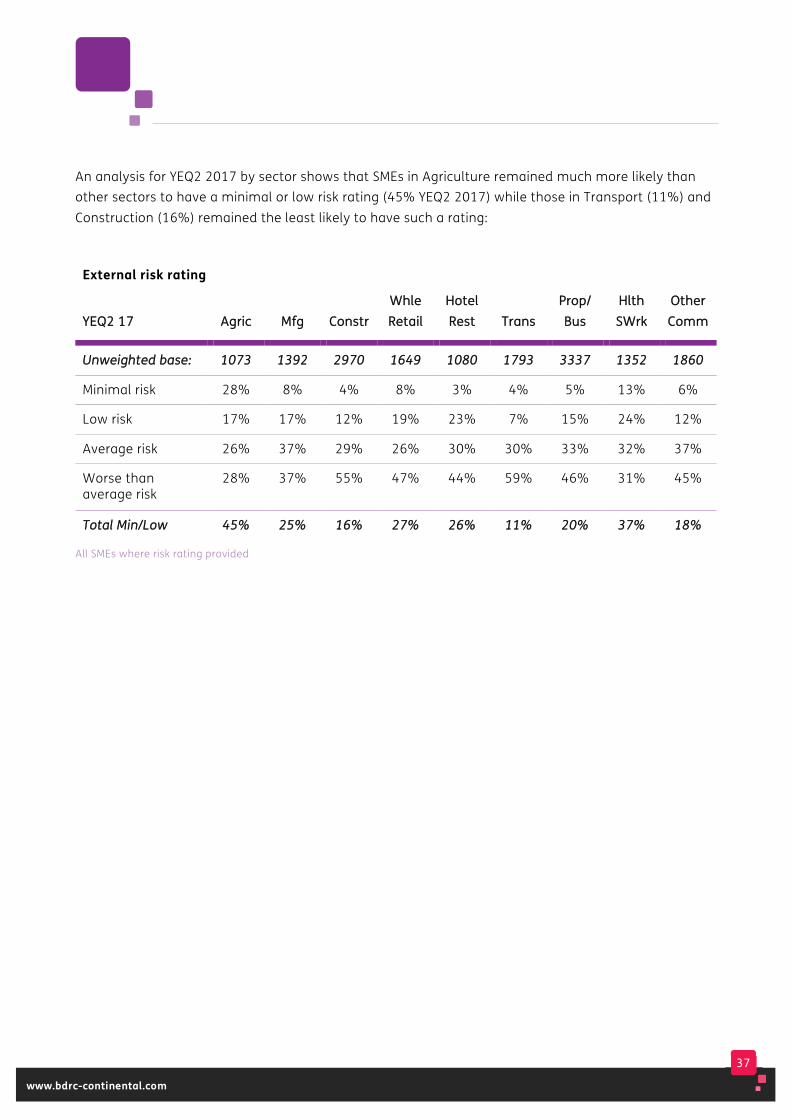
An analysis for YEQ2 2017 by sector shows that SMEs in Agriculture remained much more likely than other sectors to have a minimal or low risk rating (45% YEQ2 2017) while those in Transport (11%) and Construction (16%) remained the least likely to have such a rating:
External risk rating
YYEEQQ22 1177 AAggrriicc MMffgg CCoonnssttrr WWhhllee RReettaaiill
HHootteell RReesstt TTrraannss
PPrroopp// BBuuss
HHlltthh SSWWrrkk
OOtthheerr CCoommmm
UUnnwweeiigghhtteedd bbaassee:: 11007733 11339922 22997700 11664499 11008800 11779933 33333377 11335522 11886600
Minimal risk 28% 8% 4% 8% 3% 4% 5% 13% 6%
Low risk 17% 17% 12% 19% 23% 7% 15% 24% 12%
Average risk 26% 37% 29% 26% 30% 30% 33% 32% 37%
Worse than average risk
28% 37% 55% 47% 44% 59% 46% 31% 45%
TToottaall MMiinn//LLooww 4455%% 2255%% 1166%% 2277%% 2266%% 1111%% 2200%% 3377%% 1188%%
All SMEs where risk rating provided
38
www.bdrc-continental.com
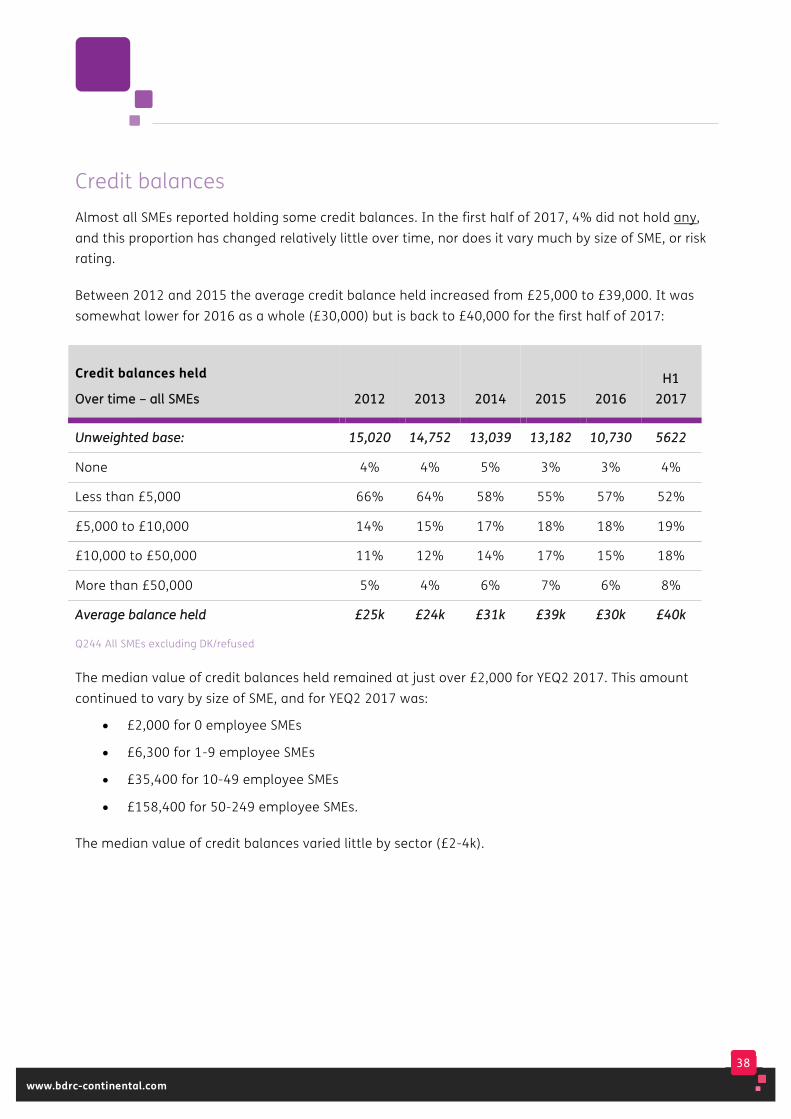
Credit balances Almost all SMEs reported holding some credit balances. In the first half of 2017, 4% did not hold any, and this proportion has changed relatively little over time, nor does it vary much by size of SME, or risk rating.
Between 2012 and 2015 the average credit balance held increased from £25,000 to £39,000. It was somewhat lower for 2016 as a whole (£30,000) but is back to £40,000 for the first half of 2017:
Credit balances held
OOvveerr ttiimmee –– aallll SSMMEEss 22001122 22001133 22001144 22001155
22001166 HH11
22001177
UUnnwweeiigghhtteedd bbaassee:: 1155,,002200 1144,,775522 1133,,003399 1133,,118822 1100,,773300 55662222
None 4% 4% 5% 3% 3% 4%
Less than £5,000 66% 64% 58% 55% 57% 52%
£5,000 to £10,000 14% 15% 17% 18% 18% 19%
£10,000 to £50,000 11% 12% 14% 17% 15% 18%
More than £50,000 5% 4% 6% 7% 6% 8%
AAvveerraaggee bbaallaannccee hheelldd ££2255kk ££2244kk ££3311kk ££3399kk ££3300kk ££4400kk
Q244 All SMEs excluding DK/refused
The median value of credit balances held remained at just over £2,000 for YEQ2 2017. This amount continued to vary by size of SME, and for YEQ2 2017 was:
• £2,000 for 0 employee SMEs
• £6,300 for 1-9 employee SMEs
• £35,400 for 10-49 employee SMEs
• £158,400 for 50-249 employee SMEs.
The median value of credit balances varied little by sector (£2-4k).
39
www.bdrc-continental.com
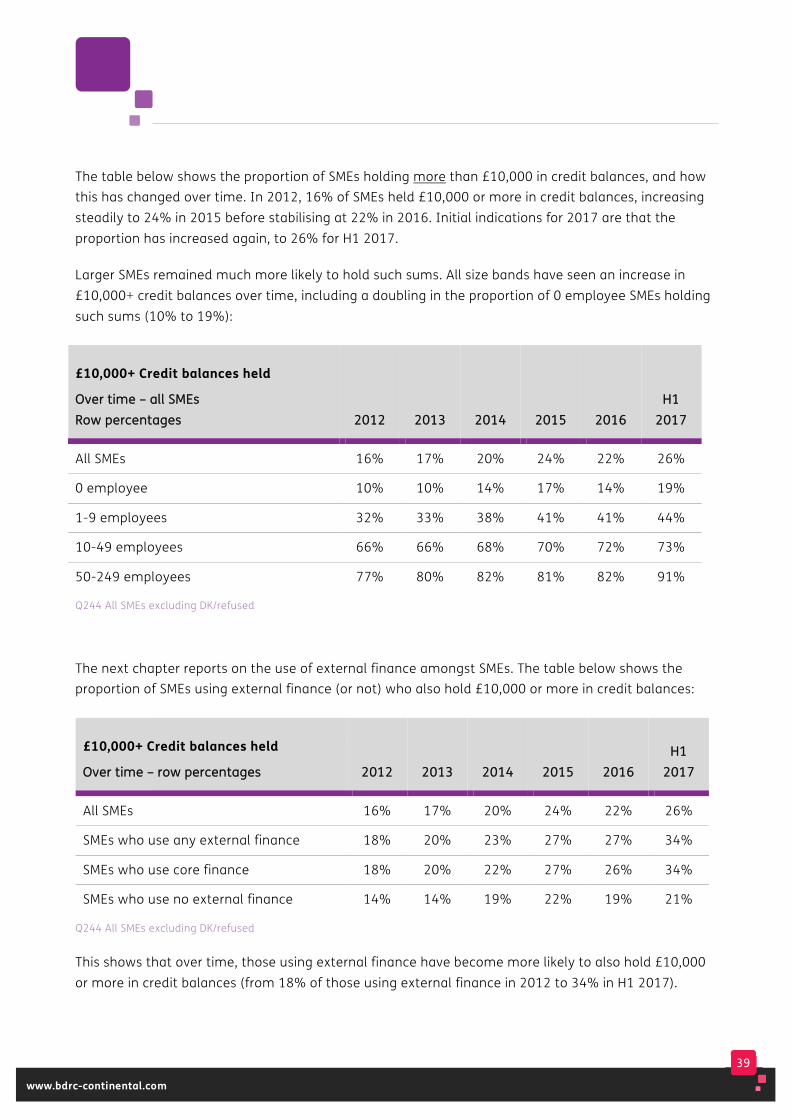
The table below shows the proportion of SMEs holding more than £10,000 in credit balances, and how this has changed over time. In 2012, 16% of SMEs held £10,000 or more in credit balances, increasing steadily to 24% in 2015 before stabilising at 22% in 2016. Initial indications for 2017 are that the proportion has increased again, to 26% for H1 2017.
Larger SMEs remained much more likely to hold such sums. All size bands have seen an increase in £10,000+ credit balances over time, including a doubling in the proportion of 0 employee SMEs holding such sums (10% to 19%):
£10,000+ Credit balances held
OOvveerr ttiimmee –– aallll SSMMEEss RRooww ppeerrcceennttaaggeess 22001122 22001133 22001144 22001155
22001166
HH11 22001177
All SMEs 16% 17% 20% 24% 22% 26%
0 employee 10% 10% 14% 17% 14% 19%
1-9 employees 32% 33% 38% 41% 41% 44%
10-49 employees 66% 66% 68% 70% 72% 73%
50-249 employees 77% 80% 82% 81% 82% 91%
Q244 All SMEs excluding DK/refused
The next chapter reports on the use of external finance amongst SMEs. The table below shows the proportion of SMEs using external finance (or not) who also hold £10,000 or more in credit balances:
£10,000+ Credit balances held
OOvveerr ttiimmee –– rrooww ppeerrcceennttaaggeess 22001122 22001133 22001144 22001155
22001166 HH11
22001177
All SMEs 16% 17% 20% 24% 22% 26%
SMEs who use any external finance 18% 20% 23% 27% 27% 34%
SMEs who use core finance 18% 20% 22% 27% 26% 34%
SMEs who use no external finance 14% 14% 19% 22% 19% 21%
Q244 All SMEs excluding DK/refused
This shows that over time, those using external finance have become more likely to also hold £10,000 or more in credit balances (from 18% of those using external finance in 2012 to 34% in H1 2017).
40
www.bdrc-continental.com
Amongst those who don’t use external finance (typically smaller SMEs), the proportion holding such balances increased somewhat from 14% in 2012 to 19% in 2014 but has been stable since.
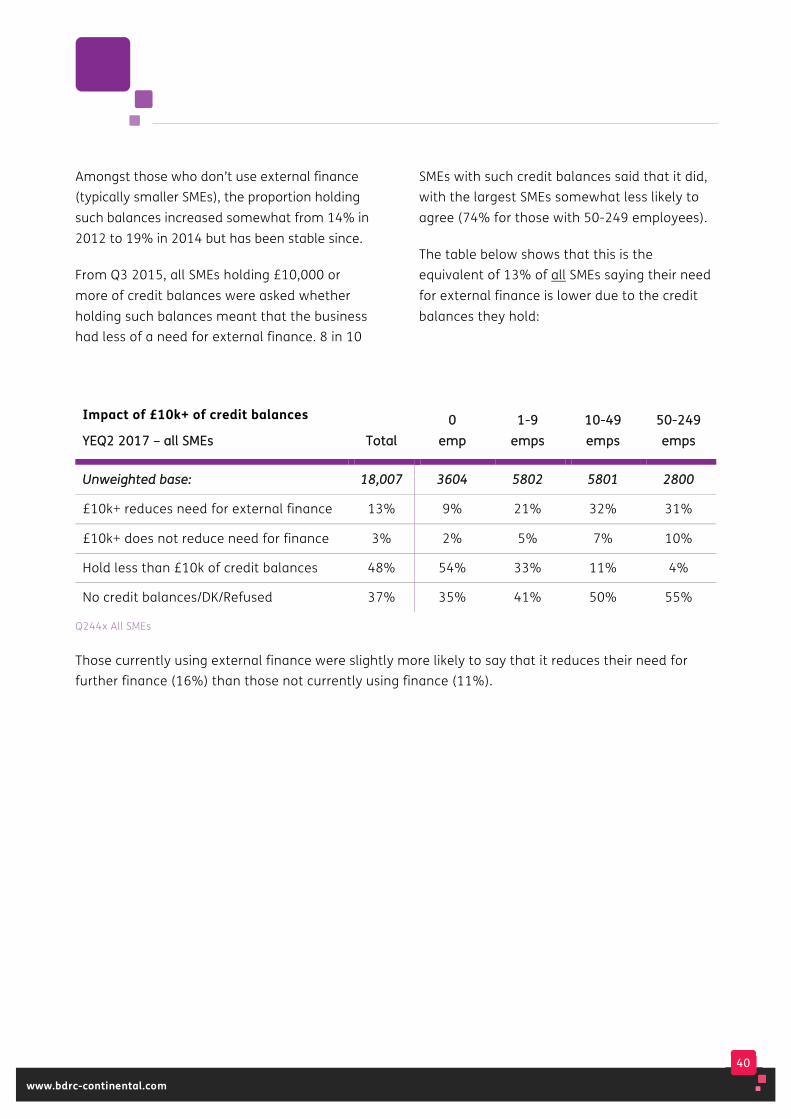
From Q3 2015, all SMEs holding £10,000 or more of credit balances were asked whether holding such balances meant that the business had less of a need for external finance. 8 in 10
SMEs with such credit balances said that it did, with the largest SMEs somewhat less likely to agree (74% for those with 50-249 employees).
The table below shows that this is the equivalent of 13% of all SMEs saying their need for external finance is lower due to the credit balances they hold:
Impact of £10k+ of credit balances
YYEEQQ22 22001177 –– aallll SSMMEEss TToottaall 00
eemmpp 11--99
eemmppss 1100--4499 eemmppss
5500--224499 eemmppss
UUnnwweeiigghhtteedd bbaassee:: 1188,,000077 33660044 55880022 55880011 22880000
£10k+ reduces need for external finance 13% 9% 21% 32% 31%
£10k+ does not reduce need for finance 3% 2% 5% 7% 10%
Hold less than £10k of credit balances 48% 54% 33% 11% 4%
No credit balances/DK/Refused 37% 35% 41% 50% 55%
Q244x All SMEs
Those currently using external finance were slightly more likely to say that it reduces their need for further finance (16%) than those not currently using finance (11%).
41
www.bdrc-continental.com
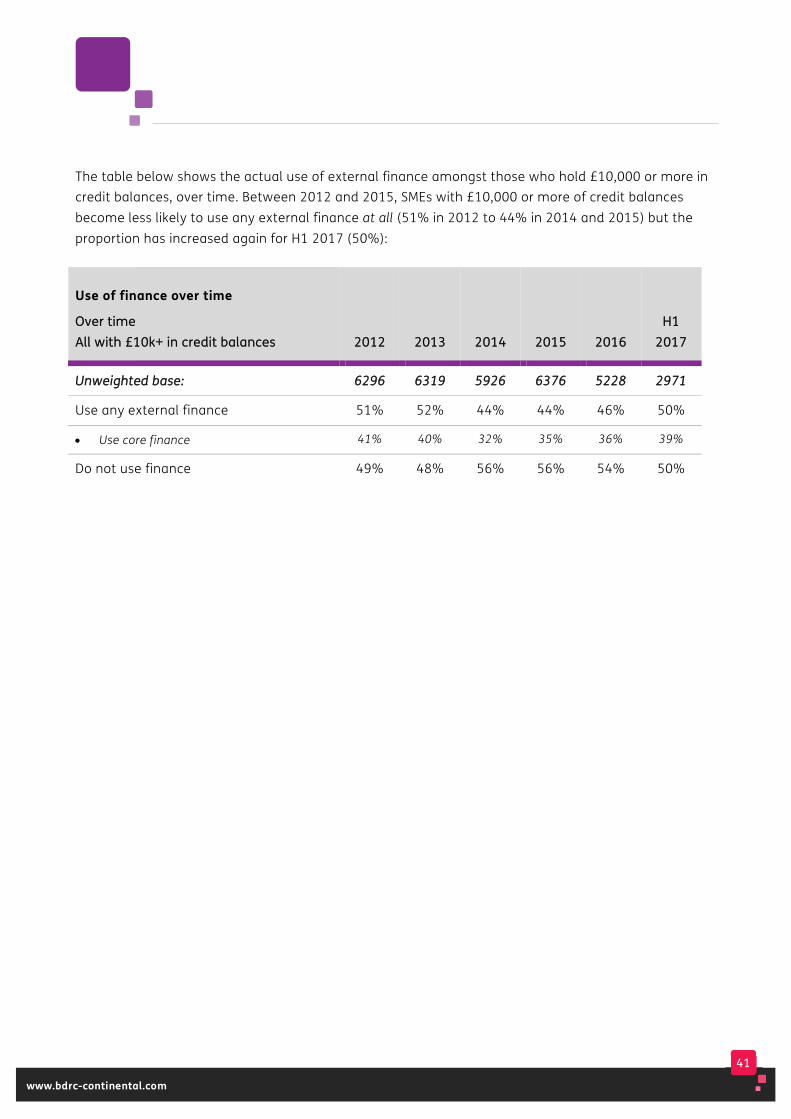
The table below shows the actual use of external finance amongst those who hold £10,000 or more in credit balances, over time. Between 2012 and 2015, SMEs with £10,000 or more of credit balances become less likely to use any external finance at all (51% in 2012 to 44% in 2014 and 2015) but the proportion has increased again for H1 2017 (50%):
Use of finance over time
OOvveerr ttiimmee AAllll wwiitthh ££1100kk++ iinn ccrreeddiitt bbaallaanncceess 22001122 22001133 22001144 22001155
22001166
HH11 22001177
UUnnwweeiigghhtteedd bbaassee:: 66229966 66331199 55992266 66337766 55222288 22997711
Use any external finance 51% 52% 44% 44% 46% 50%
• Use core finance 41% 40% 32% 35% 36% 39%
Do not use finance 49% 48% 56% 56% 54% 50%
42
www.bdrc-continental.com
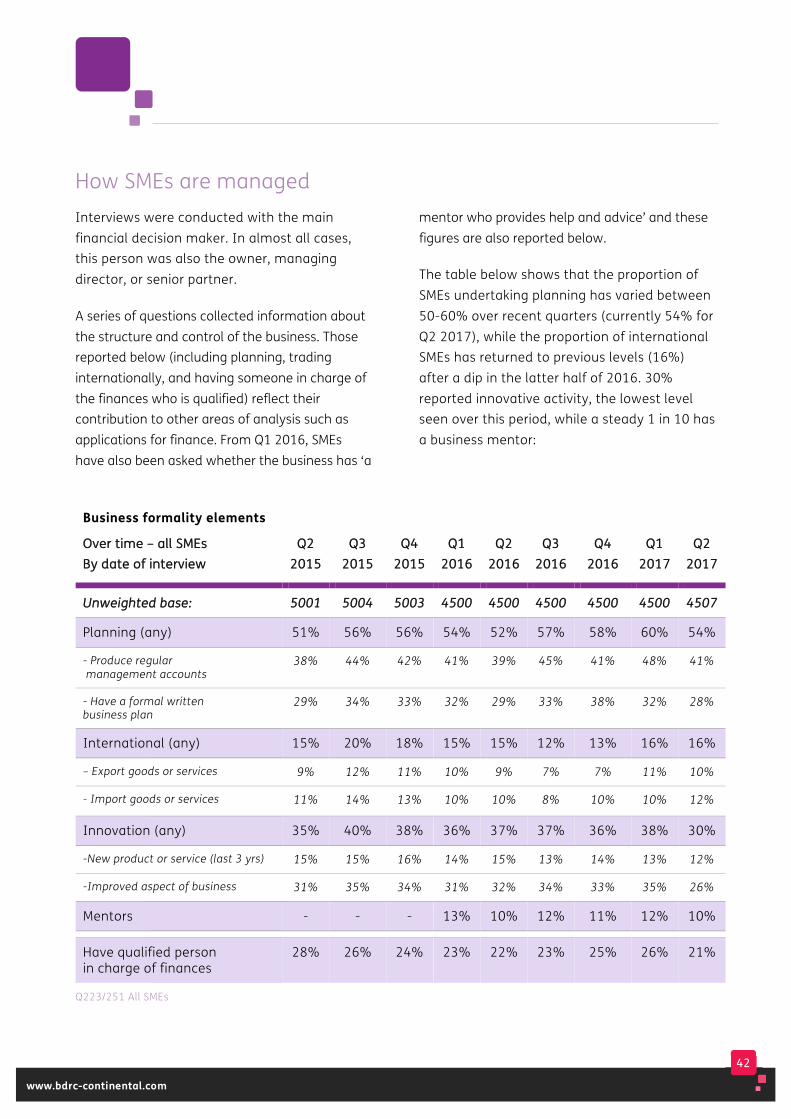
How SMEs are managed Interviews were conducted with the main financial decision maker. In almost all cases, this person was also the owner, managing director, or senior partner.
A series of questions collected information about the structure and control of the business. Those reported below (including planning, trading internationally, and having someone in charge of the finances who is qualified) reflect their contribution to other areas of analysis such as applications for finance. From Q1 2016, SMEs have also been asked whether the business has ‘a
mentor who provides help and advice’ and these figures are also reported below.
The table below shows that the proportion of SMEs undertaking planning has varied between 50-60% over recent quarters (currently 54% for Q2 2017), while the proportion of international SMEs has returned to previous levels (16%) after a dip in the latter half of 2016. 30% reported innovative activity, the lowest level seen over this period, while a steady 1 in 10 has a business mentor:
Business formality elements
OOvveerr ttiimmee –– aallll SSMMEEss BByy ddaattee ooff iinntteerrvviieeww
QQ22 22001155
QQ33 22001155
QQ44 22001155
QQ11 22001166
QQ22 22001166
QQ33 22001166
QQ44 22001166
QQ11 22001177
QQ22 22001177
UUnnwweeiigghhtteedd bbaassee:: 55000011 55000044 55000033 44550000 44550000 44550000 44550000 44550000 44550077
Planning (any) 51% 56% 56% 54% 52% 57% 58% 60% 54%
- Produce regular management accounts
38% 44% 42% 41% 39% 45% 41% 48% 41%
- Have a formal written business plan
29% 34% 33% 32% 29% 33% 38% 32% 28%
International (any) 15% 20% 18% 15% 15% 12% 13% 16% 16%
– Export goods or services 9% 12% 11% 10% 9% 7% 7% 11% 10%
- Import goods or services 11% 14% 13% 10% 10% 8% 10% 10% 12%
Innovation (any) 35% 40% 38% 36% 37% 37% 36% 38% 30%
-New product or service (last 3 yrs) 15% 15% 16% 14% 15% 13% 14% 13% 12%
-Improved aspect of business 31% 35% 34% 31% 32% 34% 33% 35% 26%
Mentors - - - 13% 10% 12% 11% 12% 10%
Have qualified person in charge of finances
28% 26% 24% 23% 22% 23% 25% 26% 21%
Q223/251 All SMEs
43
www.bdrc-continental.com
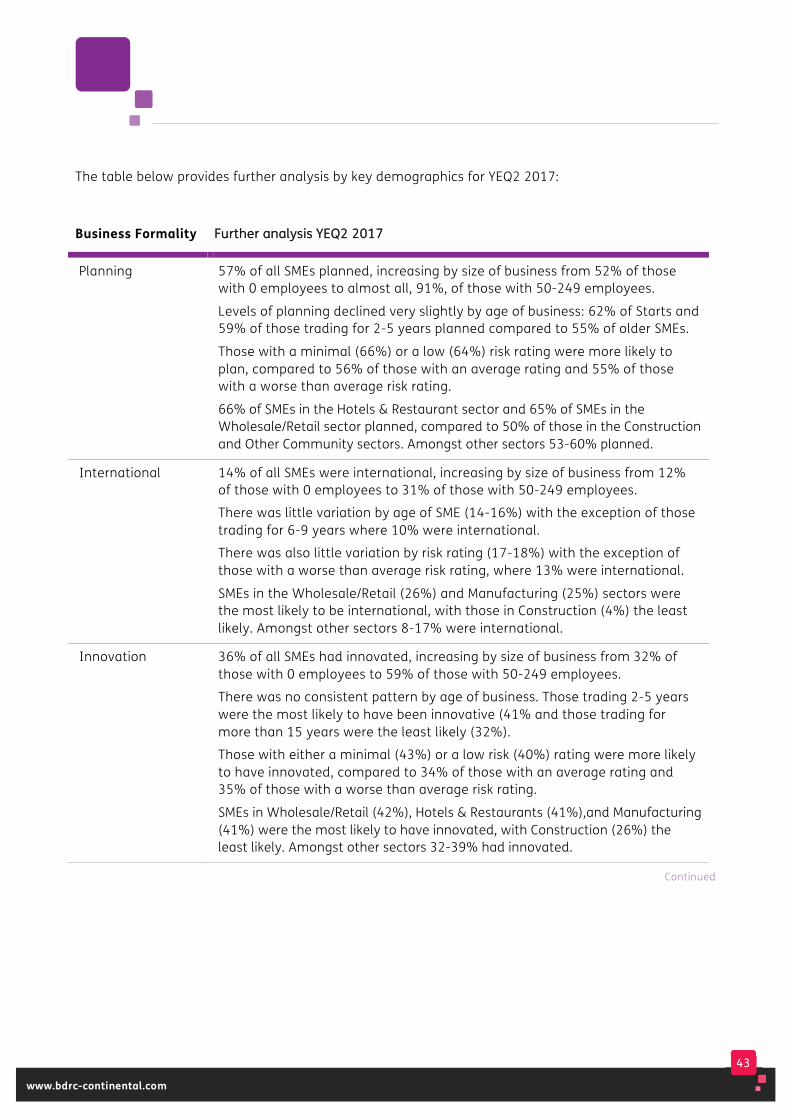
The table below provides further analysis by key demographics for YEQ2 2017:
Business Formality FFuurrtthheerr aannaallyyssiiss YYEEQQ22 22001177
Planning 57% of all SMEs planned, increasing by size of business from 52% of those with 0 employees to almost all, 91%, of those with 50-249 employees.
Levels of planning declined very slightly by age of business: 62% of Starts and 59% of those trading for 2-5 years planned compared to 55% of older SMEs.
Those with a minimal (66%) or a low (64%) risk rating were more likely to plan, compared to 56% of those with an average rating and 55% of those with a worse than average risk rating.
66% of SMEs in the Hotels & Restaurant sector and 65% of SMEs in the Wholesale/Retail sector planned, compared to 50% of those in the Construction and Other Community sectors. Amongst other sectors 53-60% planned.
International 14% of all SMEs were international, increasing by size of business from 12% of those with 0 employees to 31% of those with 50-249 employees.
There was little variation by age of SME (14-16%) with the exception of those trading for 6-9 years where 10% were international.
There was also little variation by risk rating (17-18%) with the exception of those with a worse than average risk rating, where 13% were international.
SMEs in the Wholesale/Retail (26%) and Manufacturing (25%) sectors were the most likely to be international, with those in Construction (4%) the least likely. Amongst other sectors 8-17% were international.
Innovation 36% of all SMEs had innovated, increasing by size of business from 32% of those with 0 employees to 59% of those with 50-249 employees.
There was no consistent pattern by age of business. Those trading 2-5 years were the most likely to have been innovative (41% and those trading for more than 15 years were the least likely (32%).
Those with either a minimal (43%) or a low risk (40%) rating were more likely to have innovated, compared to 34% of those with an average rating and 35% of those with a worse than average risk rating.
SMEs in Wholesale/Retail (42%), Hotels & Restaurants (41%),and Manufacturing (41%) were the most likely to have innovated, with Construction (26%) the least likely. Amongst other sectors 32-39% had innovated.
Continued
44
www.bdrc-continental.com
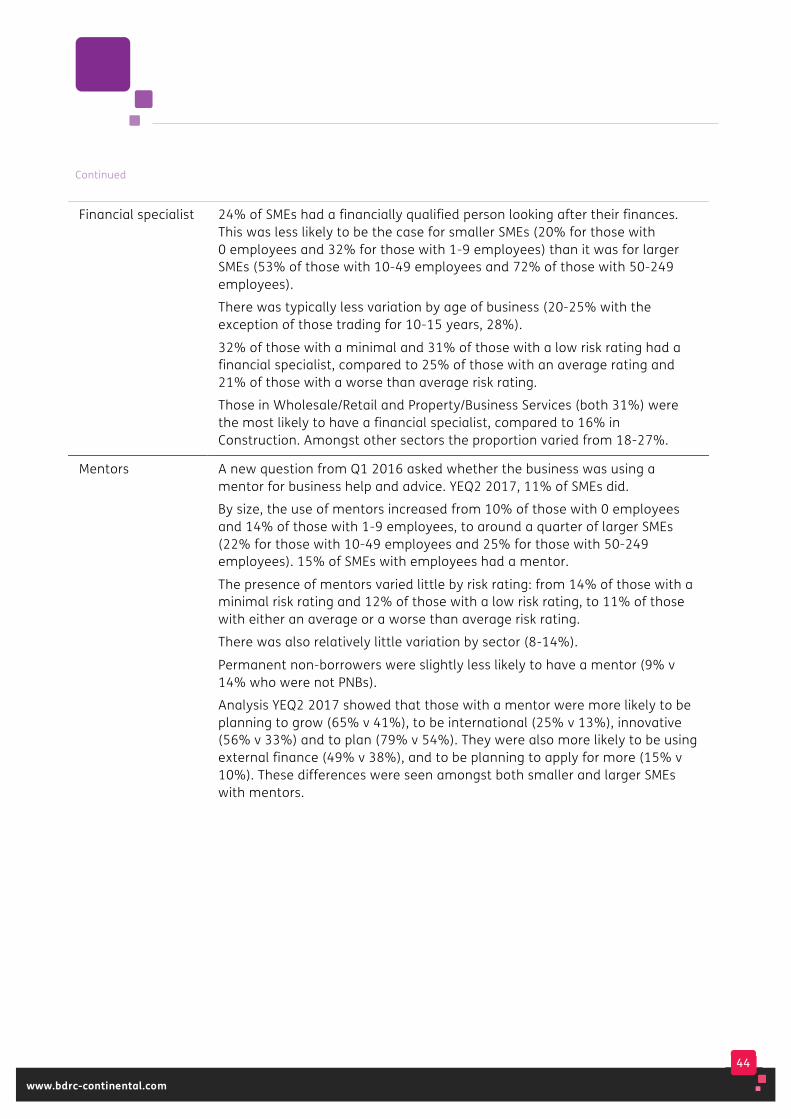
Continued
Financial specialist 24% of SMEs had a financially qualified person looking after their finances. This was less likely to be the case for smaller SMEs (20% for those with 0 employees and 32% for those with 1-9 employees) than it was for larger SMEs (53% of those with 10-49 employees and 72% of those with 50-249 employees).
There was typically less variation by age of business (20-25% with the exception of those trading for 10-15 years, 28%).
32% of those with a minimal and 31% of those with a low risk rating had a financial specialist, compared to 25% of those with an average rating and 21% of those with a worse than average risk rating.
Those in Wholesale/Retail and Property/Business Services (both 31%) were the most likely to have a financial specialist, compared to 16% in Construction. Amongst other sectors the proportion varied from 18-27%.
Mentors A new question from Q1 2016 asked whether the business was using a mentor for business help and advice. YEQ2 2017, 11% of SMEs did.
By size, the use of mentors increased from 10% of those with 0 employees and 14% of those with 1-9 employees, to around a quarter of larger SMEs (22% for those with 10-49 employees and 25% for those with 50-249 employees). 15% of SMEs with employees had a mentor.
The presence of mentors varied little by risk rating: from 14% of those with a minimal risk rating and 12% of those with a low risk rating, to 11% of those with either an average or a worse than average risk rating.
There was also relatively little variation by sector (8-14%).
Permanent non-borrowers were slightly less likely to have a mentor (9% v 14% who were not PNBs).
Analysis YEQ2 2017 showed that those with a mentor were more likely to be planning to grow (65% v 41%), to be international (25% v 13%), innovative (56% v 33%) and to plan (79% v 54%). They were also more likely to be using external finance (49% v 38%), and to be planning to apply for more (15% v 10%). These differences were seen amongst both smaller and larger SMEs with mentors.

45
www.bdrc-continental.com
The smallest SMEs remained less likely to undertake any of these activities. For YEQ2 2017, excluding the 0 employee SMEs sees the proportion of SMEs (with employees) who:
• Plan increase from 57% to 73%
• Trade internationally increase from 14% to 20%
• Innovate increase from 36% to 45%
• Have a mentor increase from 11% to 15%
• Have a qualified person in charge of the finances increase from 24% to 36%.
Taking a longer term view back to 2012:
• The proportion that plan has varied little over time (54-57%)
• The proportion of SMEs that are international has been somewhat higher since 2014 (with more exporters and more importers)
• The proportion of SMEs that have been innovative has declined somewhat over the period (from 40% to 34%), and the proportion with someone qualified in charge of the finances is also somewhat lower:
Business formality elements
OOvveerr ttiimmee –– aallll SSMMEEss BByy ddaattee ooff iinntteerrvviieeww 22001122 22001133 22001144 22001155
22001166
HH11 22001177
UUnnwweeiigghhtteedd bbaassee:: 2200,,005555 2200,,003366 2200,,005555 2200,,004466 1188,,000000 99000077
Planning (any) 55% 55% 54% 54% 55% 57%
- Produce regular management accounts 41% 42% 42% 41% 41% 44%
- Have a formal written business plan 33% 32% 32% 32% 33% 30%
International (any) 10% 13% 16% 17% 14% 16%
– Export goods or services 6% 8% 10% 10% 8% 10%
- Import goods or services 7% 9% 11% 12% 10% 11%
Innovation (any) 40% 38% 37% 37% 36% 34%
-New product or service (last 3 yrs) 17% 16% 16% 15% 14% 13%
-Improved aspect of business 35% 33% 34% 33% 32% 31%
Have qualified person in charge of finances
25% 26% 27% 26% 23% 23%
Q223/251 All SMEs
46
www.bdrc-continental.com
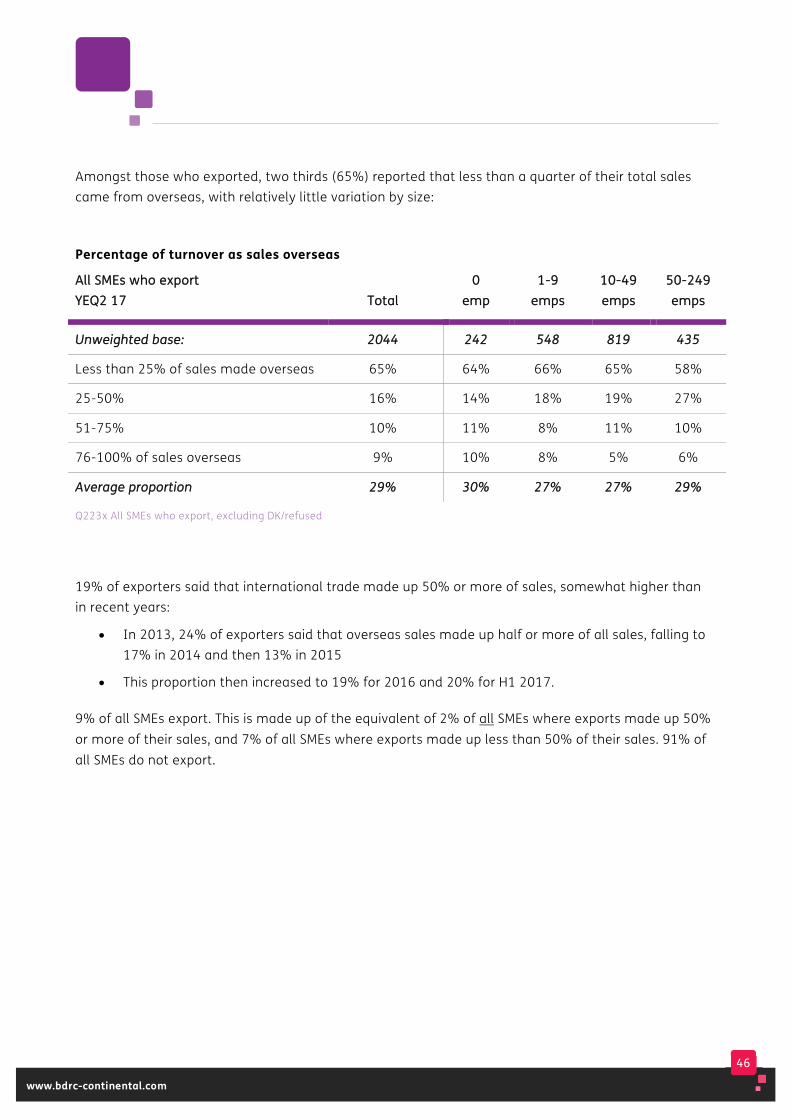
Amongst those who exported, two thirds (65%) reported that less than a quarter of their total sales came from overseas, with relatively little variation by size:
Percentage of turnover as sales overseas
AAllll SSMMEEss wwhhoo eexxppoorrtt YYEEQQ22 1177 TToottaall
00 eemmpp
11--99 eemmppss
1100--4499 eemmppss
5500--224499 eemmppss
UUnnwweeiigghhtteedd bbaassee:: 22004444 224422 554488 881199 443355
Less than 25% of sales made overseas 65% 64% 66% 65% 58%
25-50% 16% 14% 18% 19% 27%
51-75% 10% 11% 8% 11% 10%
76-100% of sales overseas 9% 10% 8% 5% 6%
AAvveerraaggee pprrooppoorrttiioonn 2299%% 3300%% 2277%% 2277%% 2299%%
Q223x All SMEs who export, excluding DK/refused
19% of exporters said that international trade made up 50% or more of sales, somewhat higher than in recent years:
• In 2013, 24% of exporters said that overseas sales made up half or more of all sales, falling to 17% in 2014 and then 13% in 2015
• This proportion then increased to 19% for 2016 and 20% for H1 2017.
9% of all SMEs export. This is made up of the equivalent of 2% of all SMEs where exports made up 50% or more of their sales, and 7% of all SMEs where exports made up less than 50% of their sales. 91% of all SMEs do not export.
47
www.bdrc-continental.com
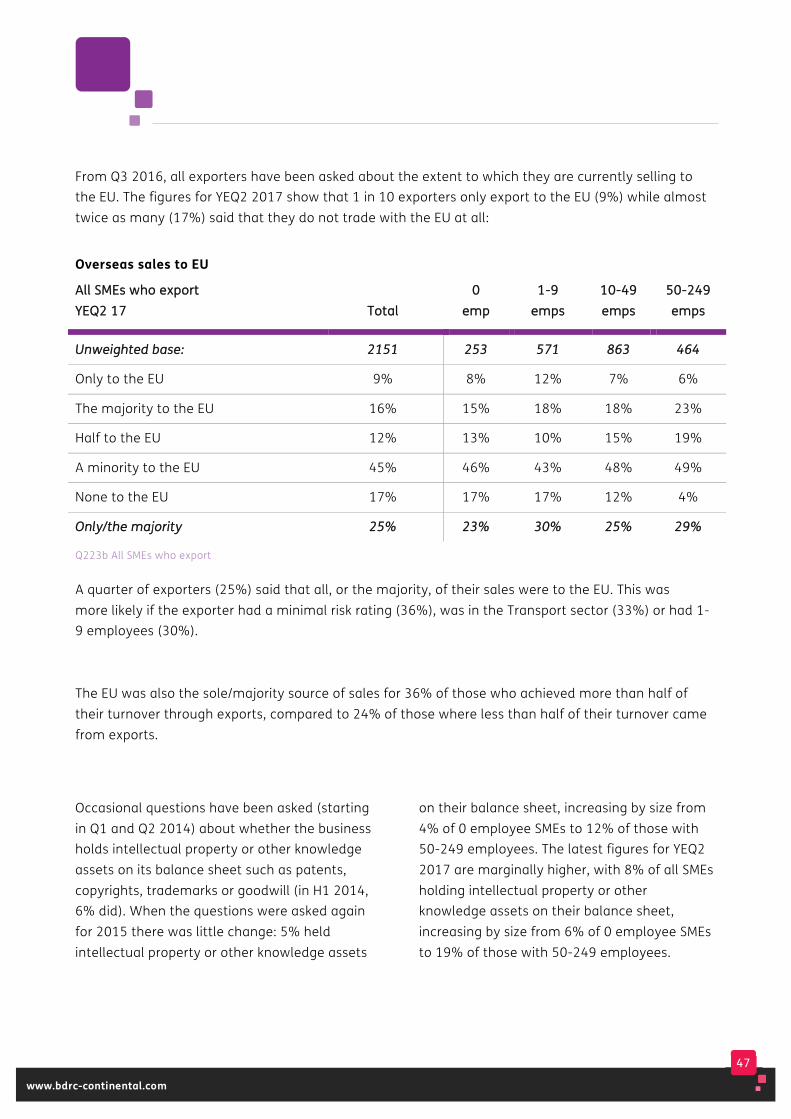
From Q3 2016, all exporters have been asked about the extent to which they are currently selling to the EU. The figures for YEQ2 2017 show that 1 in 10 exporters only export to the EU (9%) while almost twice as many (17%) said that they do not trade with the EU at all:
Overseas sales to EU
AAllll SSMMEEss wwhhoo eexxppoorrtt YYEEQQ22 1177 TToottaall
00 eemmpp
11--99 eemmppss
1100--4499 eemmppss
5500--224499 eemmppss
UUnnwweeiigghhtteedd bbaassee:: 22115511 225533 557711 886633 446644
Only to the EU 9% 8% 12% 7% 6%
The majority to the EU 16% 15% 18% 18% 23%
Half to the EU 12% 13% 10% 15% 19%
A minority to the EU 45% 46% 43% 48% 49%
None to the EU 17% 17% 17% 12% 4%
OOnnllyy//tthhee mmaajjoorriittyy 2255%% 2233%% 3300%% 2255%% 2299%%
Q223b All SMEs who export
A quarter of exporters (25%) said that all, or the majority, of their sales were to the EU. This was more likely if the exporter had a minimal risk rating (36%), was in the Transport sector (33%) or had 1-9 employees (30%).
The EU was also the sole/majority source of sales for 36% of those who achieved more than half of their turnover through exports, compared to 24% of those where less than half of their turnover came from exports.
Occasional questions have been asked (starting in Q1 and Q2 2014) about whether the business holds intellectual property or other knowledge assets on its balance sheet such as patents, copyrights, trademarks or goodwill (in H1 2014, 6% did). When the questions were asked again for 2015 there was little change: 5% held intellectual property or other knowledge assets
on their balance sheet, increasing by size from 4% of 0 employee SMEs to 12% of those with 50-249 employees. The latest figures for YEQ2 2017 are marginally higher, with 8% of all SMEs holding intellectual property or other knowledge assets on their balance sheet, increasing by size from 6% of 0 employee SMEs to 19% of those with 50-249 employees.
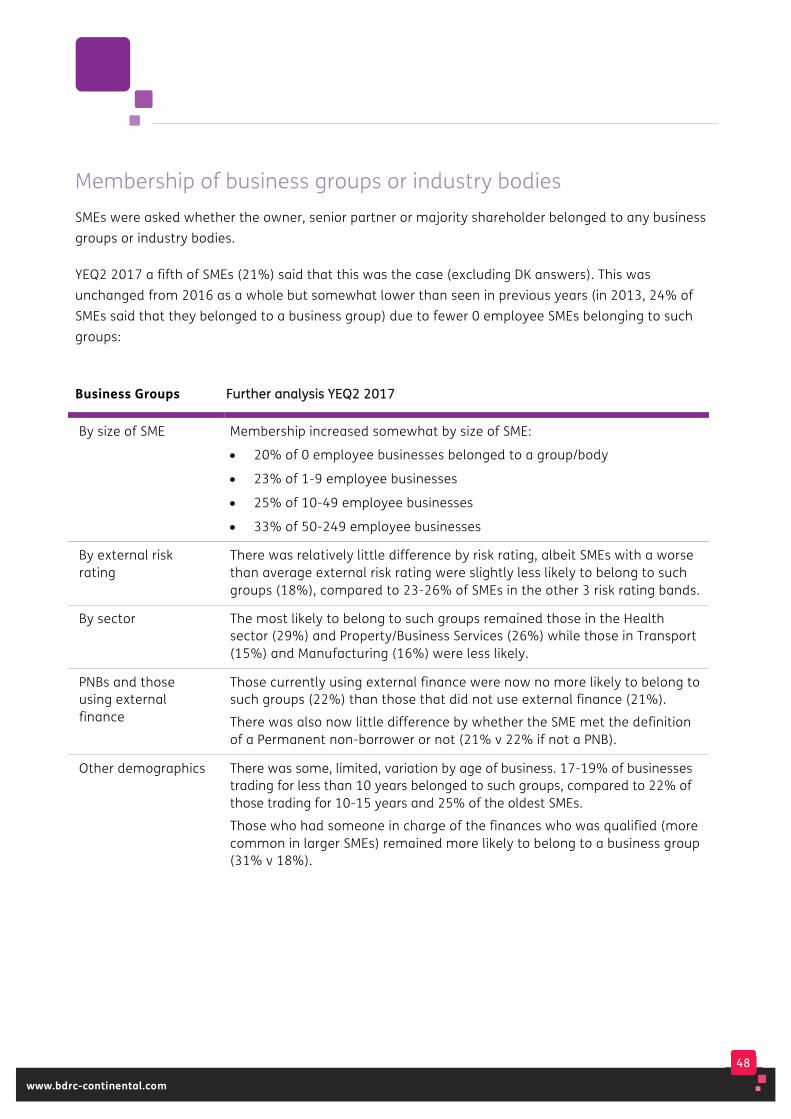
48
www.bdrc-continental.com
Membership of business groups or industry bodies SMEs were asked whether the owner, senior partner or majority shareholder belonged to any business groups or industry bodies.
YEQ2 2017 a fifth of SMEs (21%) said that this was the case (excluding DK answers). This was unchanged from 2016 as a whole but somewhat lower than seen in previous years (in 2013, 24% of SMEs said that they belonged to a business group) due to fewer 0 employee SMEs belonging to such groups:
Business Groups FFuurrtthheerr aannaallyyssiiss YYEEQQ22 22001177
By size of SME Membership increased somewhat by size of SME:
• 20% of 0 employee businesses belonged to a group/body
• 23% of 1-9 employee businesses
• 25% of 10-49 employee businesses
• 33% of 50-249 employee businesses
By external risk rating
There was relatively little difference by risk rating, albeit SMEs with a worse than average external risk rating were slightly less likely to belong to such groups (18%), compared to 23-26% of SMEs in the other 3 risk rating bands.
By sector The most likely to belong to such groups remained those in the Health sector (29%) and Property/Business Services (26%) while those in Transport (15%) and Manufacturing (16%) were less likely.
PNBs and those using external finance
Those currently using external finance were now no more likely to belong to such groups (22%) than those that did not use external finance (21%).
There was also now little difference by whether the SME met the definition of a Permanent non-borrower or not (21% v 22% if not a PNB).
Other demographics There was some, limited, variation by age of business. 17-19% of businesses trading for less than 10 years belonged to such groups, compared to 22% of those trading for 10-15 years and 25% of the oldest SMEs.
Those who had someone in charge of the finances who was qualified (more common in larger SMEs) remained more likely to belong to a business group (31% v 18%).
49
www.bdrc-continental.com
Business Ownership
68% of companies had one owner, declining by size from 89% of 0 employee companies to 38% of those with 50-249 employees. This means that of all SMEs, 86% are either sole proprietorships or companies with one owner.
A broader question explored the extent to which the owner of the SME was also involved in other businesses. For YEQ2 2017 (and excluding DK answers):
• 90% reported that this was the only business the owner was involved in, managerially or strategically, decreasing with size from 92% of 0 employee SMEs, to 81% of those with 50-249 employees.
• 9% reported that the owner currently ran another business as well (8% amongst 0 employee SMEs increasing to 18% amongst those with 50-249 employees).
• 4% reported that the owner had set up and run a business before (with little variation by size).
• Less than 1% said the owner had provided funds for another business in the past few years, again with little variation by size of SME.
From Q3 2014, SMEs with employees were asked whether theirs was a family business. For YEQ2 2017, 66% of those with employees said that theirs was a family owned business. This means that for SMEs as a whole:
• 16% have employees and are family owned
• 9% have employees and a different ownership structure
• 75% of all SMEs have no employees (so are not asked the question).

50
www.bdrc-continental.com
5. Financial context –how are SMEs funding themselves? (Part 1)
This chapter provides an overview of the types of external finance being used by SMEs, including the use of core and other forms of finance and crowd funding and the use of personal funds.
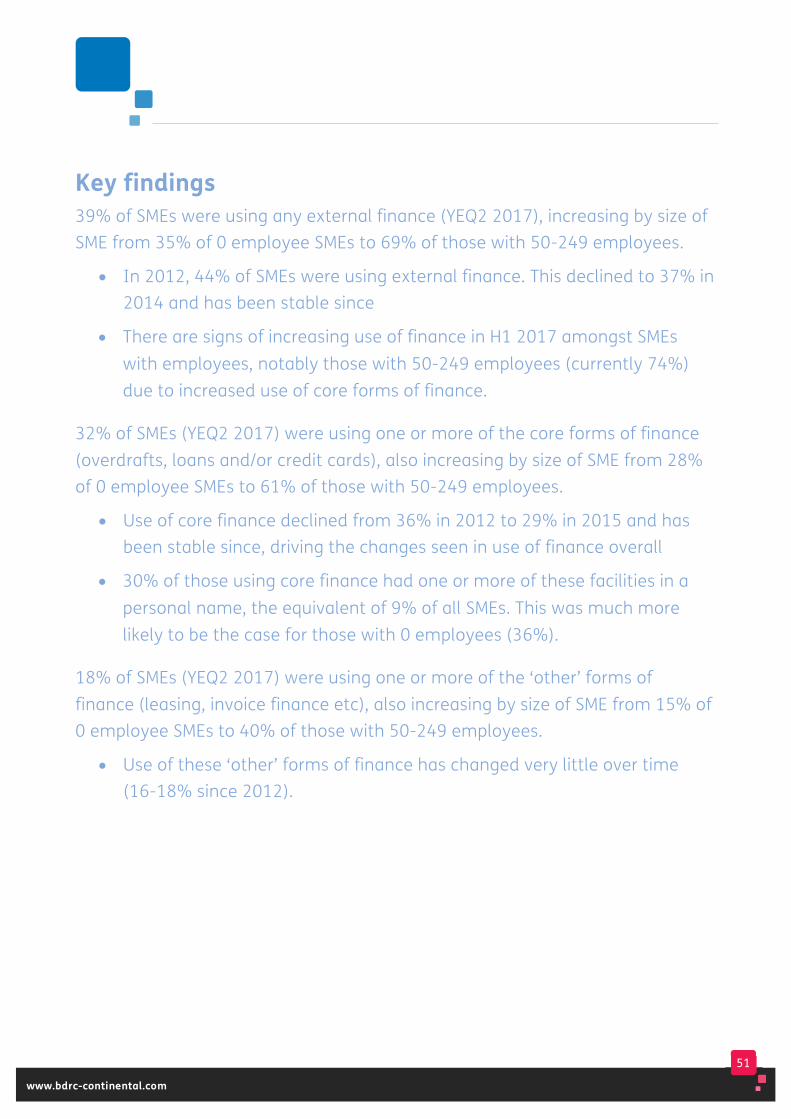
51
www.bdrc-continental.com
Key findings 39% of SMEs were using any external finance (YEQ2 2017), increasing by size of SME from 35% of 0 employee SMEs to 69% of those with 50-249 employees.
• In 2012, 44% of SMEs were using external finance. This declined to 37% in 2014 and has been stable since
• There are signs of increasing use of finance in H1 2017 amongst SMEs with employees, notably those with 50-249 employees (currently 74%) due to increased use of core forms of finance.
32% of SMEs (YEQ2 2017) were using one or more of the core forms of finance (overdrafts, loans and/or credit cards), also increasing by size of SME from 28% of 0 employee SMEs to 61% of those with 50-249 employees.
• Use of core finance declined from 36% in 2012 to 29% in 2015 and has been stable since, driving the changes seen in use of finance overall
• 30% of those using core finance had one or more of these facilities in a personal name, the equivalent of 9% of all SMEs. This was much more likely to be the case for those with 0 employees (36%).
18% of SMEs (YEQ2 2017) were using one or more of the ‘other’ forms of finance (leasing, invoice finance etc), also increasing by size of SME from 15% of 0 employee SMEs to 40% of those with 50-249 employees.
• Use of these ‘other’ forms of finance has changed very little over time (16-18% since 2012).

52
www.bdrc-continental.com
A stable 28% of SMEs reported an injection of personal funds into the business (YEQ2 2017). 17% chose to inject funds to help the business develop while 11% had felt that they had no choice.
• The proportion reporting an injection of funds has been unchanged since 2014, but was previously higher (43% in 2012)
• The proportion of all injections where the SME felt that there was no choice declined from 58% of all injections in 2012 to 39% in 2016, but was slightly higher, 45%, in the first half of 2017.
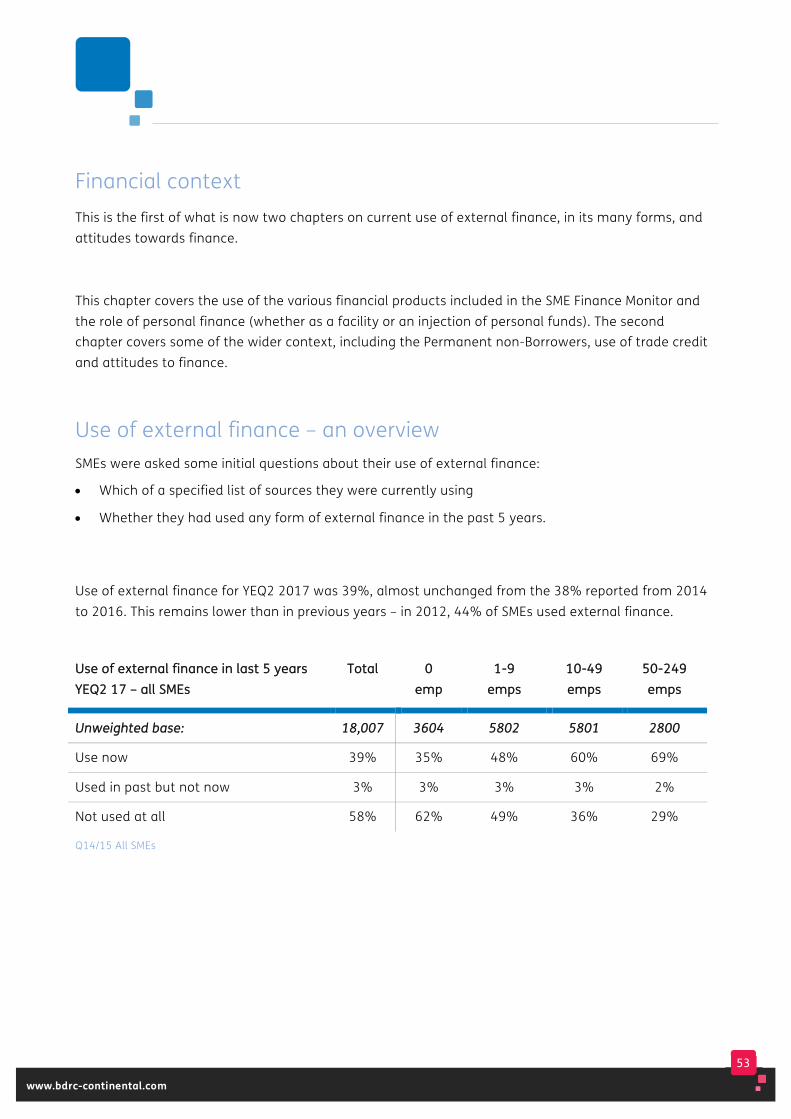
53
www.bdrc-continental.com
Financial context This is the first of what is now two chapters on current use of external finance, in its many forms, and attitudes towards finance.
This chapter covers the use of the various financial products included in the SME Finance Monitor and the role of personal finance (whether as a facility or an injection of personal funds). The second chapter covers some of the wider context, including the Permanent non-Borrowers, use of trade credit and attitudes to finance.
Use of external finance – an overview SMEs were asked some initial questions about their use of external finance:
• Which of a specified list of sources they were currently using
• Whether they had used any form of external finance in the past 5 years.
Use of external finance for YEQ2 2017 was 39%, almost unchanged from the 38% reported from 2014 to 2016. This remains lower than in previous years – in 2012, 44% of SMEs used external finance.
UUssee ooff eexxtteerrnnaall ffiinnaannccee iinn llaasstt 55 yyeeaarrss YYEEQQ22 1177 –– aallll SSMMEEss
TToottaall
00 eemmpp
11--99 eemmppss
1100--4499 eemmppss
5500--224499 eemmppss
UUnnwweeiigghhtteedd bbaassee:: 1188,,000077 33660044 55880022 55880011 22880000
Use now 39% 35% 48% 60% 69%
Used in past but not now 3% 3% 3% 3% 2%
Not used at all 58% 62% 49% 36% 29%
Q14/15 All SMEs
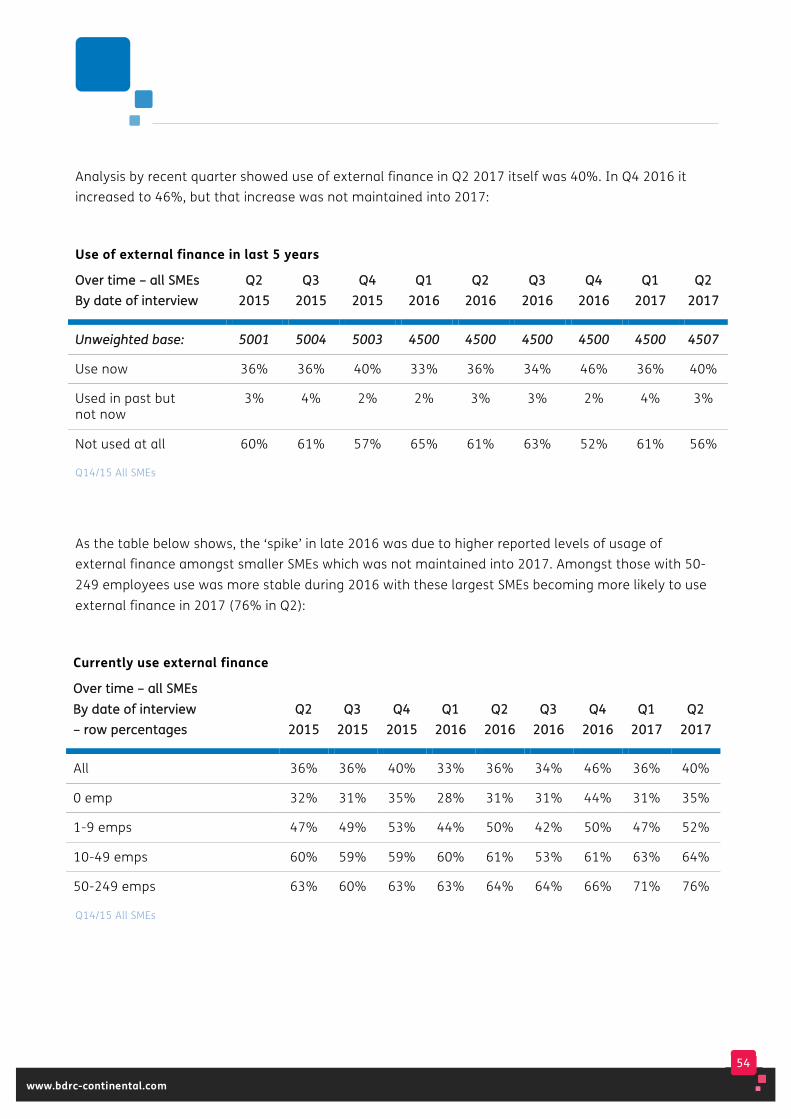
54
www.bdrc-continental.com
Analysis by recent quarter showed use of external finance in Q2 2017 itself was 40%. In Q4 2016 it increased to 46%, but that increase was not maintained into 2017:
Use of external finance in last 5 years
OOvveerr ttiimmee –– aallll SSMMEEss BByy ddaattee ooff iinntteerrvviieeww
QQ22 22001155
QQ33 22001155
QQ44 22001155
QQ11 22001166
QQ22 22001166
QQ33 22001166
QQ44 22001166
QQ11 22001177
QQ22 22001177
UUnnwweeiigghhtteedd bbaassee:: 55000011 55000044 55000033 44550000 44550000 44550000 44550000 44550000 44550077
Use now 36% 36% 40% 33% 36% 34% 46% 36% 40%
Used in past but not now
3% 4% 2% 2% 3% 3% 2% 4% 3%
Not used at all 60% 61% 57% 65% 61% 63% 52% 61% 56%
Q14/15 All SMEs
As the table below shows, the ‘spike’ in late 2016 was due to higher reported levels of usage of external finance amongst smaller SMEs which was not maintained into 2017. Amongst those with 50-249 employees use was more stable during 2016 with these largest SMEs becoming more likely to use external finance in 2017 (76% in Q2):
Currently use external finance
OOvveerr ttiimmee –– aallll SSMMEEss BByy ddaattee ooff iinntteerrvviieeww –– rrooww ppeerrcceennttaaggeess
QQ22 22001155
QQ33 22001155
QQ44 22001155
QQ11 22001166
QQ22 22001166
QQ33 22001166
QQ44 22001166
QQ11 22001177
QQ22 22001177
All 36% 36% 40% 33% 36% 34% 46% 36% 40%
0 emp 32% 31% 35% 28% 31% 31% 44% 31% 35%
1-9 emps 47% 49% 53% 44% 50% 42% 50% 47% 52%
10-49 emps 60% 59% 59% 60% 61% 53% 61% 63% 64%
50-249 emps 63% 60% 63% 63% 64% 64% 66% 71% 76%
Q14/15 All SMEs
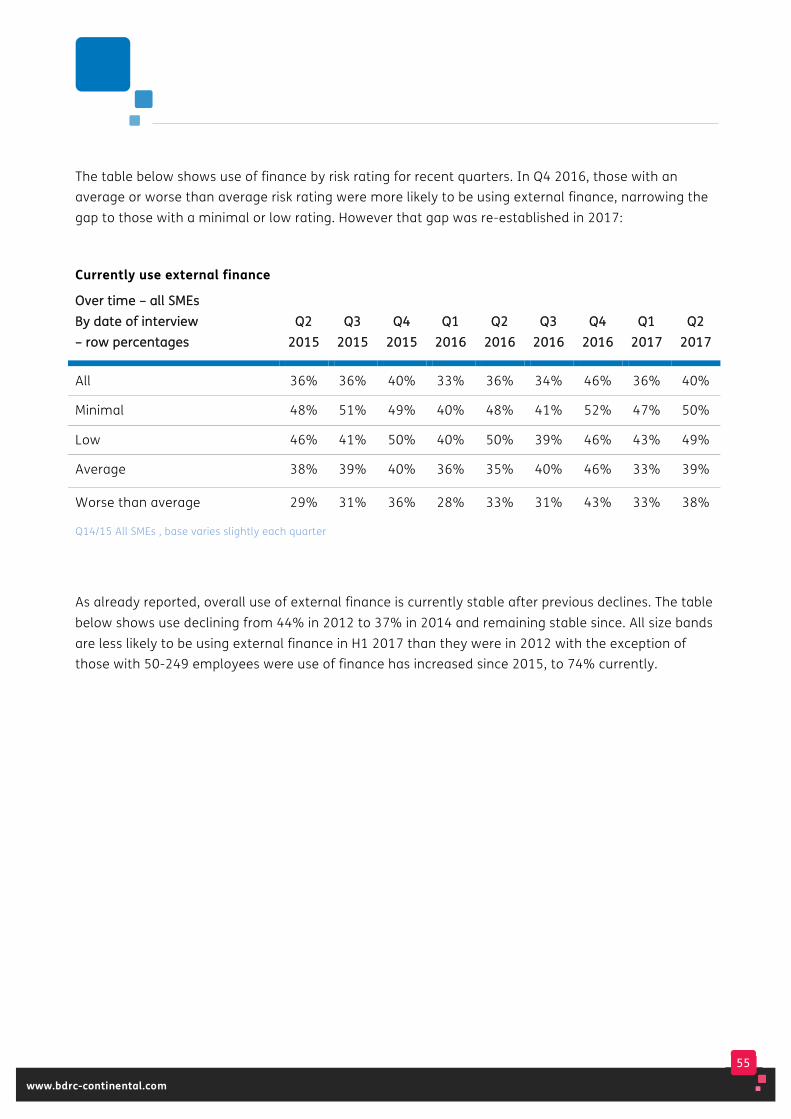
55
www.bdrc-continental.com
The table below shows use of finance by risk rating for recent quarters. In Q4 2016, those with an average or worse than average risk rating were more likely to be using external finance, narrowing the gap to those with a minimal or low rating. However that gap was re-established in 2017:
Currently use external finance
OOvveerr ttiimmee –– aallll SSMMEEss BByy ddaattee ooff iinntteerrvviieeww –– rrooww ppeerrcceennttaaggeess
QQ22 22001155
QQ33 22001155
QQ44 22001155
QQ11 22001166
QQ22 22001166
QQ33 22001166
QQ44 22001166
QQ11 22001177
QQ22 22001177
All 36% 36% 40% 33% 36% 34% 46% 36% 40%
Minimal 48% 51% 49% 40% 48% 41% 52% 47% 50%
Low 46% 41% 50% 40% 50% 39% 46% 43% 49%
Average 38% 39% 40% 36% 35% 40% 46% 33% 39%
Worse than average 29% 31% 36% 28% 33% 31% 43% 33% 38%
Q14/15 All SMEs , base varies slightly each quarter
As already reported, overall use of external finance is currently stable after previous declines. The table below shows use declining from 44% in 2012 to 37% in 2014 and remaining stable since. All size bands are less likely to be using external finance in H1 2017 than they were in 2012 with the exception of those with 50-249 employees were use of finance has increased since 2015, to 74% currently.
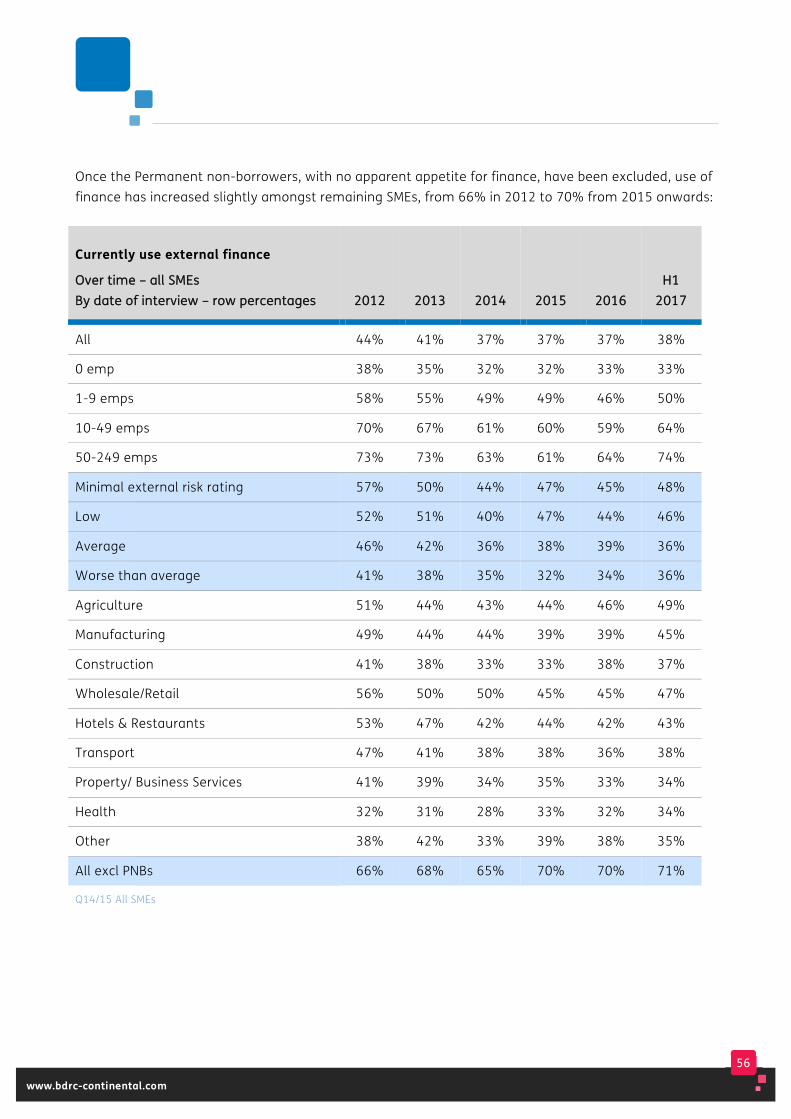
56
www.bdrc-continental.com
Once the Permanent non-borrowers, with no apparent appetite for finance, have been excluded, use of finance has increased slightly amongst remaining SMEs, from 66% in 2012 to 70% from 2015 onwards:
Currently use external finance
OOvveerr ttiimmee –– aallll SSMMEEss BByy ddaattee ooff iinntteerrvviieeww –– rrooww ppeerrcceennttaaggeess 22001122 22001133 22001144 22001155
22001166
HH11 22001177
All 44% 41% 37% 37% 37% 38%
0 emp 38% 35% 32% 32% 33% 33%
1-9 emps 58% 55% 49% 49% 46% 50%
10-49 emps 70% 67% 61% 60% 59% 64%
50-249 emps 73% 73% 63% 61% 64% 74%
Minimal external risk rating 57% 50% 44% 47% 45% 48%
Low 52% 51% 40% 47% 44% 46%
Average 46% 42% 36% 38% 39% 36%
Worse than average 41% 38% 35% 32% 34% 36%
Agriculture 51% 44% 43% 44% 46% 49%
Manufacturing 49% 44% 44% 39% 39% 45%
Construction 41% 38% 33% 33% 38% 37%
Wholesale/Retail 56% 50% 50% 45% 45% 47%
Hotels & Restaurants 53% 47% 42% 44% 42% 43%
Transport 47% 41% 38% 38% 36% 38%
Property/ Business Services 41% 39% 34% 35% 33% 34%
Health 32% 31% 28% 33% 32% 34%
Other 38% 42% 33% 39% 38% 35%
All excl PNBs 66% 68% 65% 70% 70% 71%
Q14/15 All SMEs
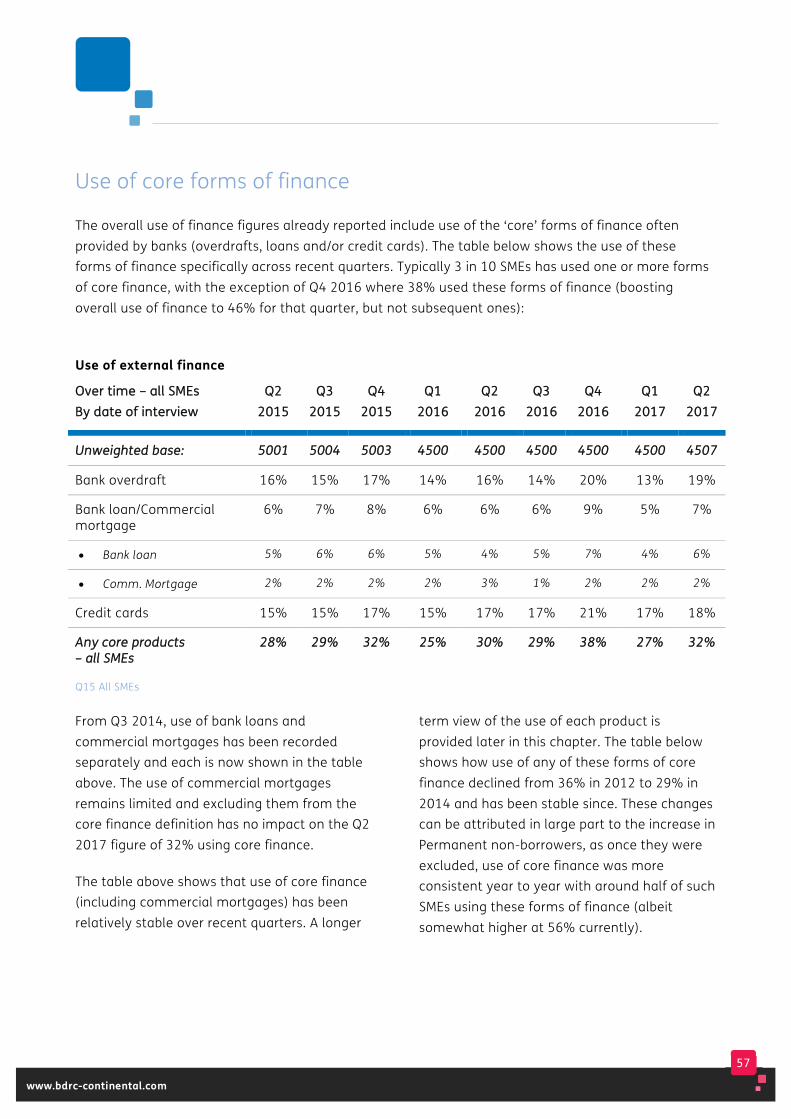
57
www.bdrc-continental.com
Use of core forms of finance
The overall use of finance figures already reported include use of the ‘core’ forms of finance often provided by banks (overdrafts, loans and/or credit cards). The table below shows the use of these forms of finance specifically across recent quarters. Typically 3 in 10 SMEs has used one or more forms of core finance, with the exception of Q4 2016 where 38% used these forms of finance (boosting overall use of finance to 46% for that quarter, but not subsequent ones):
Use of external finance
OOvveerr ttiimmee –– aallll SSMMEEss BByy ddaattee ooff iinntteerrvviieeww
QQ22 22001155
QQ33 22001155
QQ44 22001155
QQ11 22001166
QQ22 22001166
QQ33 22001166
QQ44 22001166
QQ11 22001177
QQ22 22001177
UUnnwweeiigghhtteedd bbaassee:: 55000011 55000044 55000033 44550000 44550000 44550000 44550000 44550000 44550077
Bank overdraft 16% 15% 17% 14% 16% 14% 20% 13% 19%
Bank loan/Commercial mortgage
6% 7% 8% 6% 6% 6% 9% 5% 7%
• Bank loan 5% 6% 6% 5% 4% 5% 7% 4% 6%
• Comm. Mortgage 2% 2% 2% 2% 3% 1% 2% 2% 2%
Credit cards 15% 15% 17% 15% 17% 17% 21% 17% 18%
AAnnyy ccoorree pprroodduuccttss –– aallll SSMMEEss
2288%% 2299%% 3322%% 2255%% 3300%% 2299%% 3388%% 2277%% 3322%%
Q15 All SMEs
From Q3 2014, use of bank loans and commercial mortgages has been recorded separately and each is now shown in the table above. The use of commercial mortgages remains limited and excluding them from the core finance definition has no impact on the Q2 2017 figure of 32% using core finance.
The table above shows that use of core finance (including commercial mortgages) has been relatively stable over recent quarters. A longer
term view of the use of each product is provided later in this chapter. The table below shows how use of any of these forms of core finance declined from 36% in 2012 to 29% in 2014 and has been stable since. These changes can be attributed in large part to the increase in Permanent non-borrowers, as once they were excluded, use of core finance was more consistent year to year with around half of such SMEs using these forms of finance (albeit somewhat higher at 56% currently).
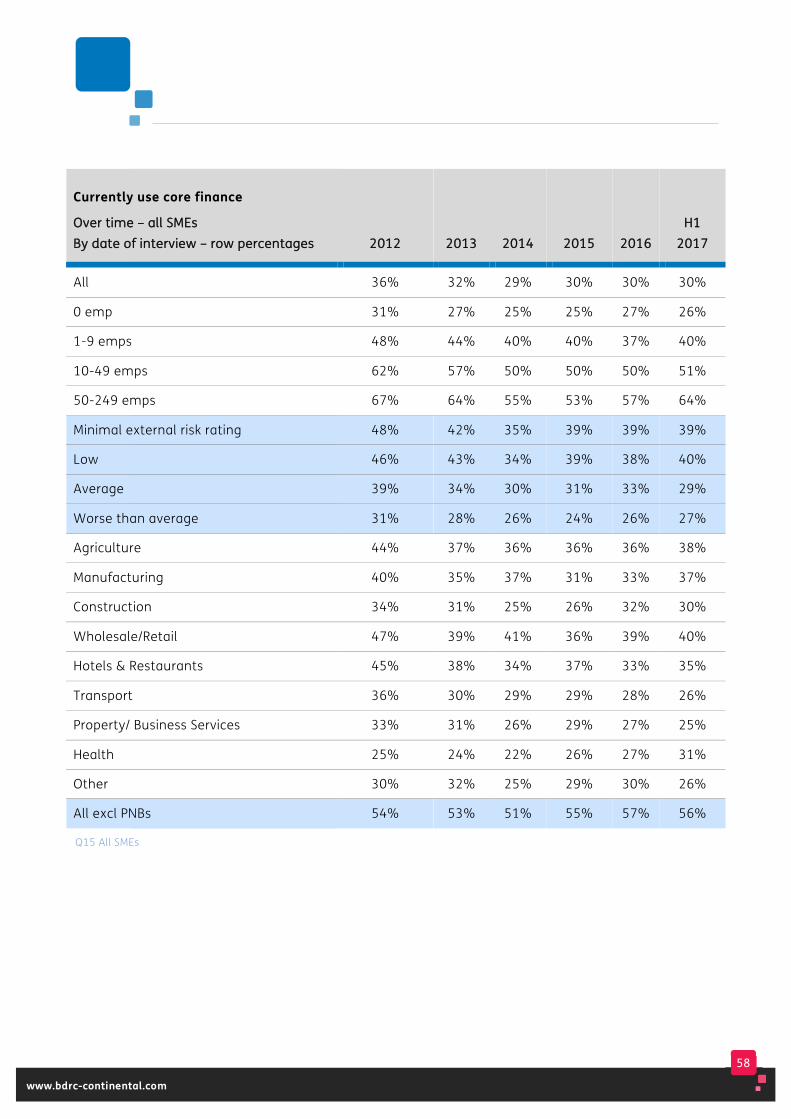
58
www.bdrc-continental.com
Currently use core finance
OOvveerr ttiimmee –– aallll SSMMEEss BByy ddaattee ooff iinntteerrvviieeww –– rrooww ppeerrcceennttaaggeess 22001122 22001133 22001144 22001155 22001166
HH11 22001177
All 36% 32% 29% 30% 30% 30%
0 emp 31% 27% 25% 25% 27% 26%
1-9 emps 48% 44% 40% 40% 37% 40%
10-49 emps 62% 57% 50% 50% 50% 51%
50-249 emps 67% 64% 55% 53% 57% 64%
Minimal external risk rating 48% 42% 35% 39% 39% 39%
Low 46% 43% 34% 39% 38% 40%
Average 39% 34% 30% 31% 33% 29%
Worse than average 31% 28% 26% 24% 26% 27%
Agriculture 44% 37% 36% 36% 36% 38%
Manufacturing 40% 35% 37% 31% 33% 37%
Construction 34% 31% 25% 26% 32% 30%
Wholesale/Retail 47% 39% 41% 36% 39% 40%
Hotels & Restaurants 45% 38% 34% 37% 33% 35%
Transport 36% 30% 29% 29% 28% 26%
Property/ Business Services 33% 31% 26% 29% 27% 25%
Health 25% 24% 22% 26% 27% 31%
Other 30% 32% 25% 29% 30% 26%
All excl PNBs 54% 53% 51% 55% 57% 56%
Q15 All SMEs
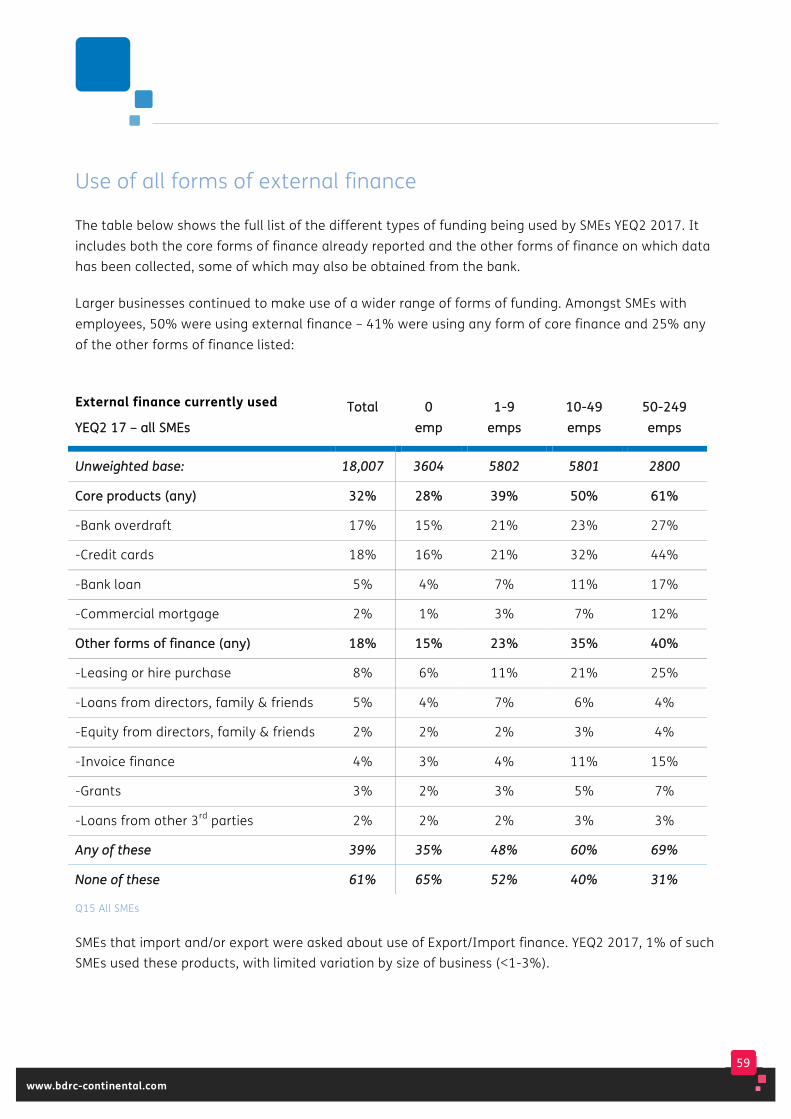
59
www.bdrc-continental.com
Use of all forms of external finance
The table below shows the full list of the different types of funding being used by SMEs YEQ2 2017. It includes both the core forms of finance already reported and the other forms of finance on which data has been collected, some of which may also be obtained from the bank.
Larger businesses continued to make use of a wider range of forms of funding. Amongst SMEs with employees, 50% were using external finance – 41% were using any form of core finance and 25% any of the other forms of finance listed:
External finance currently used
YYEEQQ22 1177 –– aallll SSMMEEss TToottaall
00
eemmpp 11--99
eemmppss 1100--4499 eemmppss
5500--224499 eemmppss
UUnnwweeiigghhtteedd bbaassee:: 1188,,000077 33660044 55880022 55880011 22880000
CCoorree pprroodduuccttss ((aannyy)) 3322%% 2288%% 3399%% 5500%% 6611%%
-Bank overdraft 17% 15% 21% 23% 27%
-Credit cards 18% 16% 21% 32% 44%
-Bank loan 5% 4% 7% 11% 17%
-Commercial mortgage 2% 1% 3% 7% 12%
OOtthheerr ffoorrmmss ooff ffiinnaannccee ((aannyy)) 1188%% 1155%% 2233%% 3355%% 4400%%
-Leasing or hire purchase 8% 6% 11% 21% 25%
-Loans from directors, family & friends 5% 4% 7% 6% 4%
-Equity from directors, family & friends 2% 2% 2% 3% 4%
-Invoice finance 4% 3% 4% 11% 15%
-Grants 3% 2% 3% 5% 7%
-Loans from other 3rd parties 2% 2% 2% 3% 3%
AAnnyy ooff tthheessee 3399%% 3355%% 4488%% 6600%% 6699%%
NNoonnee ooff tthheessee 6611%% 6655%% 5522%% 4400%% 3311%%
Q15 All SMEs
SMEs that import and/or export were asked about use of Export/Import finance. YEQ2 2017, 1% of such SMEs used these products, with limited variation by size of business (<1-3%).
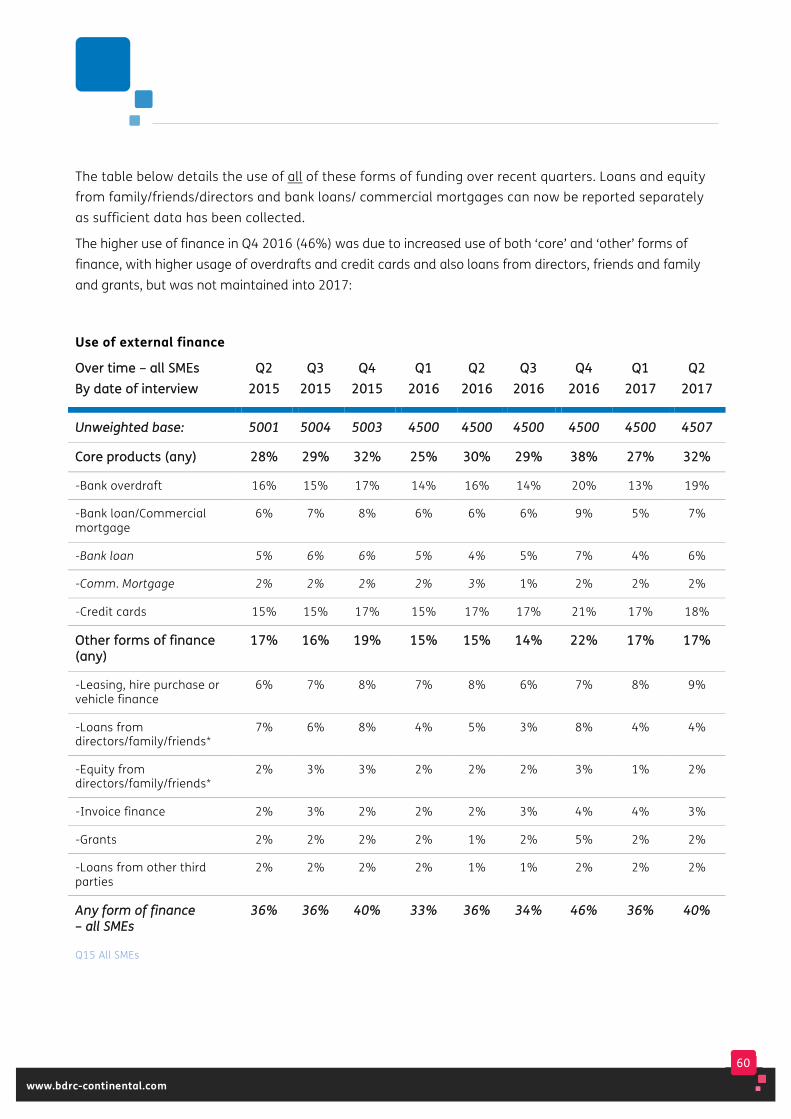
60
www.bdrc-continental.com
The table below details the use of all of these forms of funding over recent quarters. Loans and equity from family/friends/directors and bank loans/ commercial mortgages can now be reported separately as sufficient data has been collected.
The higher use of finance in Q4 2016 (46%) was due to increased use of both ‘core’ and ‘other’ forms of finance, with higher usage of overdrafts and credit cards and also loans from directors, friends and family and grants, but was not maintained into 2017:
Use of external finance
OOvveerr ttiimmee –– aallll SSMMEEss BByy ddaattee ooff iinntteerrvviieeww
QQ22 22001155
QQ33 22001155
QQ44 22001155
QQ11 22001166
QQ22 22001166
QQ33 22001166
QQ44 22001166
QQ11 22001177
QQ22 22001177
UUnnwweeiigghhtteedd bbaassee:: 55000011 55000044 55000033 44550000 44550000 44550000 44550000 44550000 44550077
CCoorree pprroodduuccttss ((aannyy)) 2288%% 2299%% 3322%% 2255%% 3300%% 2299%% 3388%% 2277%% 3322%%
-Bank overdraft 16% 15% 17% 14% 16% 14% 20% 13% 19%
-Bank loan/Commercial mortgage
6% 7% 8% 6% 6% 6% 9% 5% 7%
-Bank loan 5% 6% 6% 5% 4% 5% 7% 4% 6%
-Comm. Mortgage 2% 2% 2% 2% 3% 1% 2% 2% 2%
-Credit cards 15% 15% 17% 15% 17% 17% 21% 17% 18%
OOtthheerr ffoorrmmss ooff ffiinnaannccee ((aannyy))
1177%% 1166%% 1199%% 1155%% 1155%% 1144%% 2222%% 1177%% 1177%%
-Leasing, hire purchase or vehicle finance
6% 7% 8% 7% 8% 6% 7% 8% 9%
-Loans from directors/family/friends*
7% 6% 8% 4% 5% 3% 8% 4% 4%
-Equity from directors/family/friends*
2% 3% 3% 2% 2% 2% 3% 1% 2%
-Invoice finance 2% 3% 2% 2% 2% 3% 4% 4% 3%
-Grants 2% 2% 2% 2% 1% 2% 5% 2% 2%
-Loans from other third parties
2% 2% 2% 2% 1% 1% 2% 2% 2%
AAnnyy ffoorrmm ooff ffiinnaannccee –– aallll SSMMEEss
3366%% 3366%% 4400%% 3333%% 3366%% 3344%% 4466%% 3366%% 4400%%
Q15 All SMEs

61
www.bdrc-continental.com
The table below takes a longer term view of the use of these individual finance products, back to 2012. It shows how current use of loans and overdrafts is stable but at lower levels than seen in 2012-13 (in line with use of finance overall):
Use of forms of finance
OOvveerr ttiimmee –– aallll SSMMEEss BByy ddaattee ooff iinntteerrvviieeww 22001122 22001133 22001144 22001155
22001166
HH11 22001177
CCoorree pprroodduuccttss ((aannyy)) 3366%% 3322%% 2299%% 3300%% 3300%% 3300%%
-Bank overdraft 22% 18% 16% 16% 16% 16%
-Bank loan/Commercial mortgage 10% 8% 7% 7% 7% 6%
-Credit cards 18% 18% 15% 16% 17% 17%
OOtthheerr ffoorrmmss ooff ffiinnaannccee ((aannyy)) 1188%% 1188%% 1177%% 1177%% 1166%% 1177%%
-Leasing, hire purchase or vehicle finance 6% 8% 7% 7% 7% 9%
-Loans/Equity from directors/family/friends 6% 9% 8% 8% 6% 5%
-Invoice finance 3% 2% 3% 2% 3% 3%
-Grants 1% 1% 2% 2% 2% 2%
-Loans from other third parties 1% 1% 2% 2% 2% 2%
AAnnyy FFiinnaannccee 4444%% 4411%% 3377%% 3377%% 3377%% 3388%%
Q14/15 All SMEs
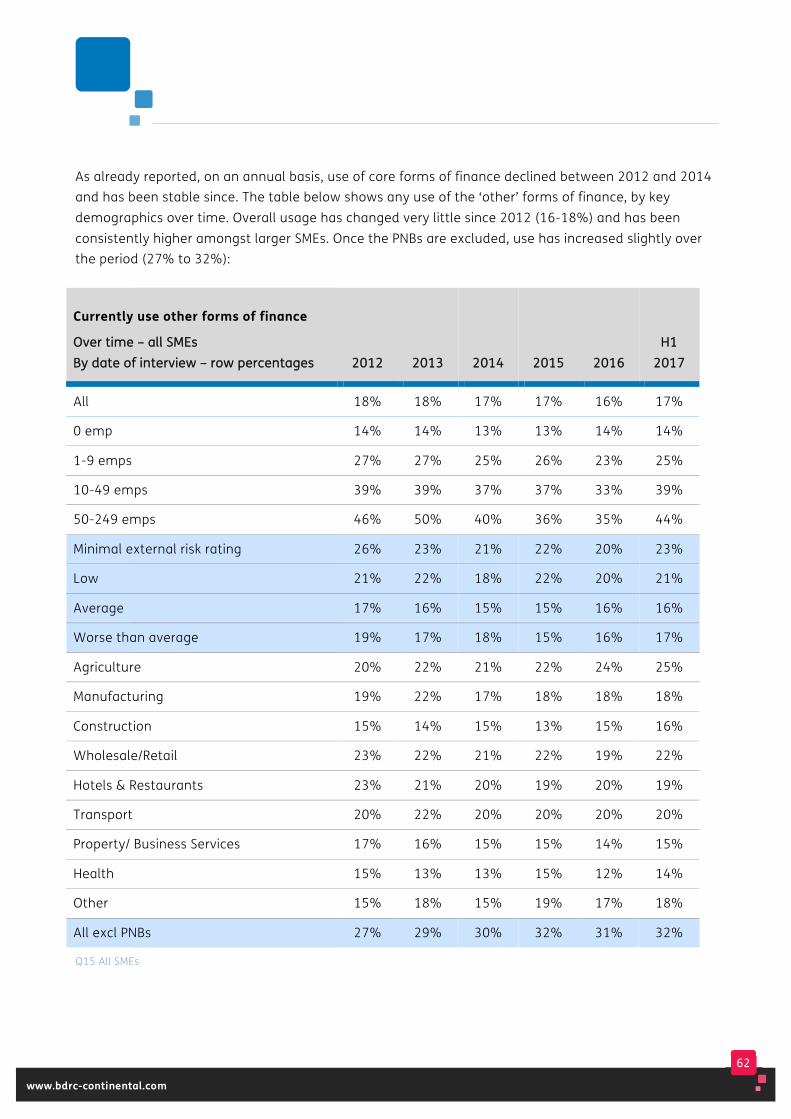
62
www.bdrc-continental.com
As already reported, on an annual basis, use of core forms of finance declined between 2012 and 2014 and has been stable since. The table below shows any use of the ‘other’ forms of finance, by key demographics over time. Overall usage has changed very little since 2012 (16-18%) and has been consistently higher amongst larger SMEs. Once the PNBs are excluded, use has increased slightly over the period (27% to 32%):
Currently use other forms of finance
OOvveerr ttiimmee –– aallll SSMMEEss BByy ddaattee ooff iinntteerrvviieeww –– rrooww ppeerrcceennttaaggeess 22001122 22001133 22001144 22001155 22001166
HH11 22001177
All 18% 18% 17% 17% 16% 17%
0 emp 14% 14% 13% 13% 14% 14%
1-9 emps 27% 27% 25% 26% 23% 25%
10-49 emps 39% 39% 37% 37% 33% 39%
50-249 emps 46% 50% 40% 36% 35% 44%
Minimal external risk rating 26% 23% 21% 22% 20% 23%
Low 21% 22% 18% 22% 20% 21%
Average 17% 16% 15% 15% 16% 16%
Worse than average 19% 17% 18% 15% 16% 17%
Agriculture 20% 22% 21% 22% 24% 25%
Manufacturing 19% 22% 17% 18% 18% 18%
Construction 15% 14% 15% 13% 15% 16%
Wholesale/Retail 23% 22% 21% 22% 19% 22%
Hotels & Restaurants 23% 21% 20% 19% 20% 19%
Transport 20% 22% 20% 20% 20% 20%
Property/ Business Services 17% 16% 15% 15% 14% 15%
Health 15% 13% 13% 15% 12% 14%
Other 15% 18% 15% 19% 17% 18%
All excl PNBs 27% 29% 30% 32% 31% 32%
Q15 All SMEs
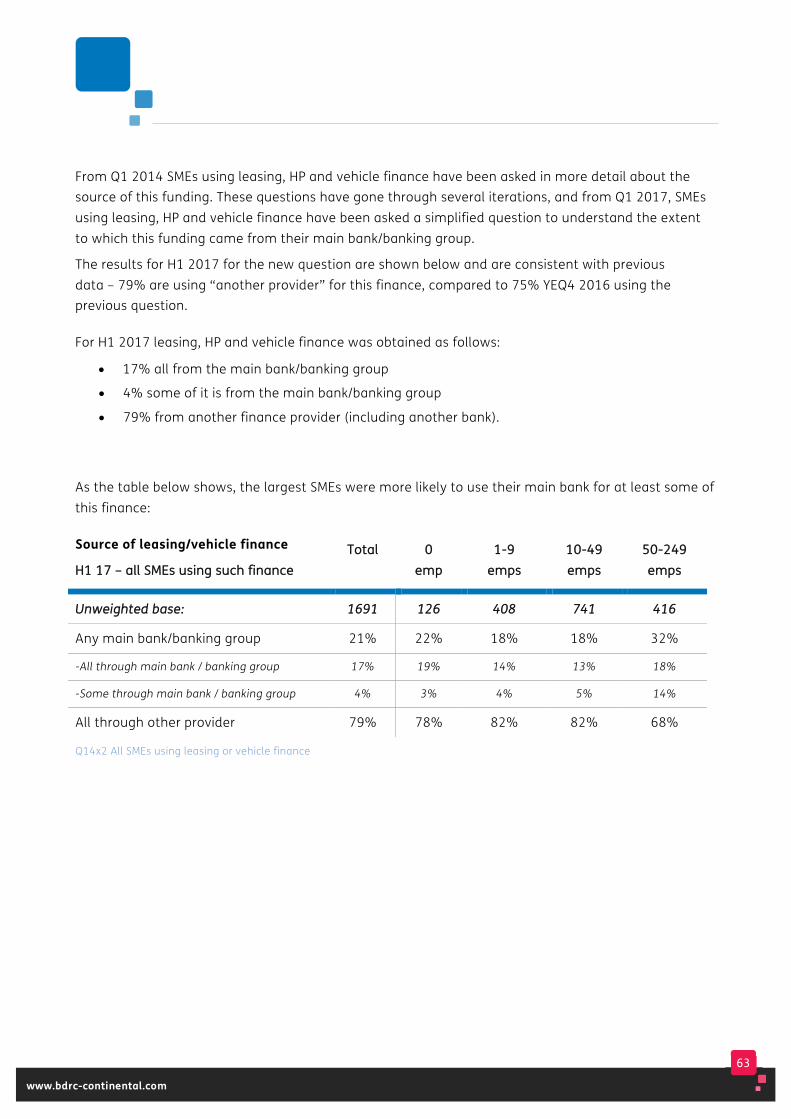
63
www.bdrc-continental.com
From Q1 2014 SMEs using leasing, HP and vehicle finance have been asked in more detail about the source of this funding. These questions have gone through several iterations, and from Q1 2017, SMEs using leasing, HP and vehicle finance have been asked a simplified question to understand the extent to which this funding came from their main bank/banking group.
The results for H1 2017 for the new question are shown below and are consistent with previous data – 79% are using “another provider” for this finance, compared to 75% YEQ4 2016 using the previous question.
For H1 2017 leasing, HP and vehicle finance was obtained as follows:
• 17% all from the main bank/banking group
• 4% some of it is from the main bank/banking group
• 79% from another finance provider (including another bank).
As the table below shows, the largest SMEs were more likely to use their main bank for at least some of this finance:
Source of leasing/vehicle finance
HH11 1177 –– aallll SSMMEEss uussiinngg ssuucchh ffiinnaannccee TToottaall
00
eemmpp 11--99
eemmppss 1100--4499 eemmppss
5500--224499 eemmppss
UUnnwweeiigghhtteedd bbaassee:: 11669911 112266 440088 774411 441166
Any main bank/banking group 21% 22% 18% 18% 32%
-All through main bank / banking group 17% 19% 14% 13% 18%
-Some through main bank / banking group 4% 3% 4% 5% 14%
All through other provider 79% 78% 82% 82% 68%
Q14x2 All SMEs using leasing or vehicle finance
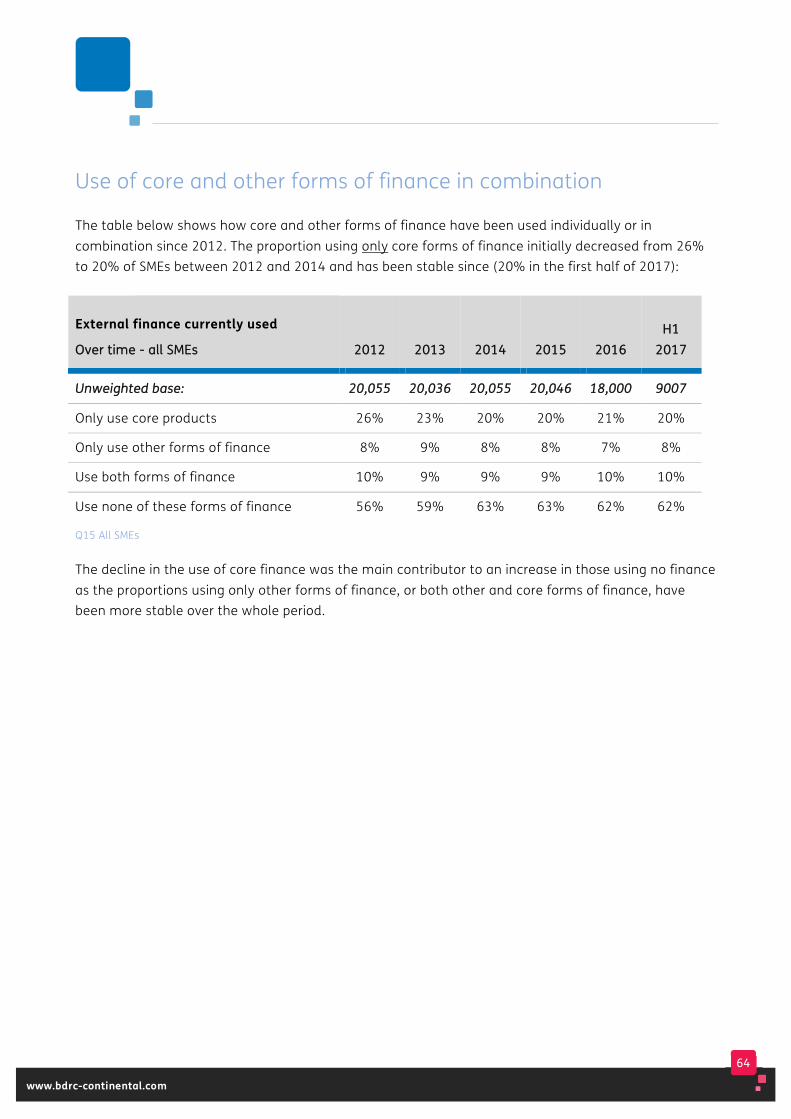
64
www.bdrc-continental.com
Use of core and other forms of finance in combination
The table below shows how core and other forms of finance have been used individually or in combination since 2012. The proportion using only core forms of finance initially decreased from 26% to 20% of SMEs between 2012 and 2014 and has been stable since (20% in the first half of 2017):
External finance currently used
OOvveerr ttiimmee -- aallll SSMMEEss 22001122 22001133 22001144 22001155
22001166 HH11
22001177
UUnnwweeiigghhtteedd bbaassee:: 2200,,005555 2200,,003366 2200,,005555 2200,,004466 1188,,000000 99000077
Only use core products 26% 23% 20% 20% 21% 20%
Only use other forms of finance 8% 9% 8% 8% 7% 8%
Use both forms of finance 10% 9% 9% 9% 10% 10%
Use none of these forms of finance 56% 59% 63% 63% 62% 62%
Q15 All SMEs
The decline in the use of core finance was the main contributor to an increase in those using no finance as the proportions using only other forms of finance, or both other and core forms of finance, have been more stable over the whole period.
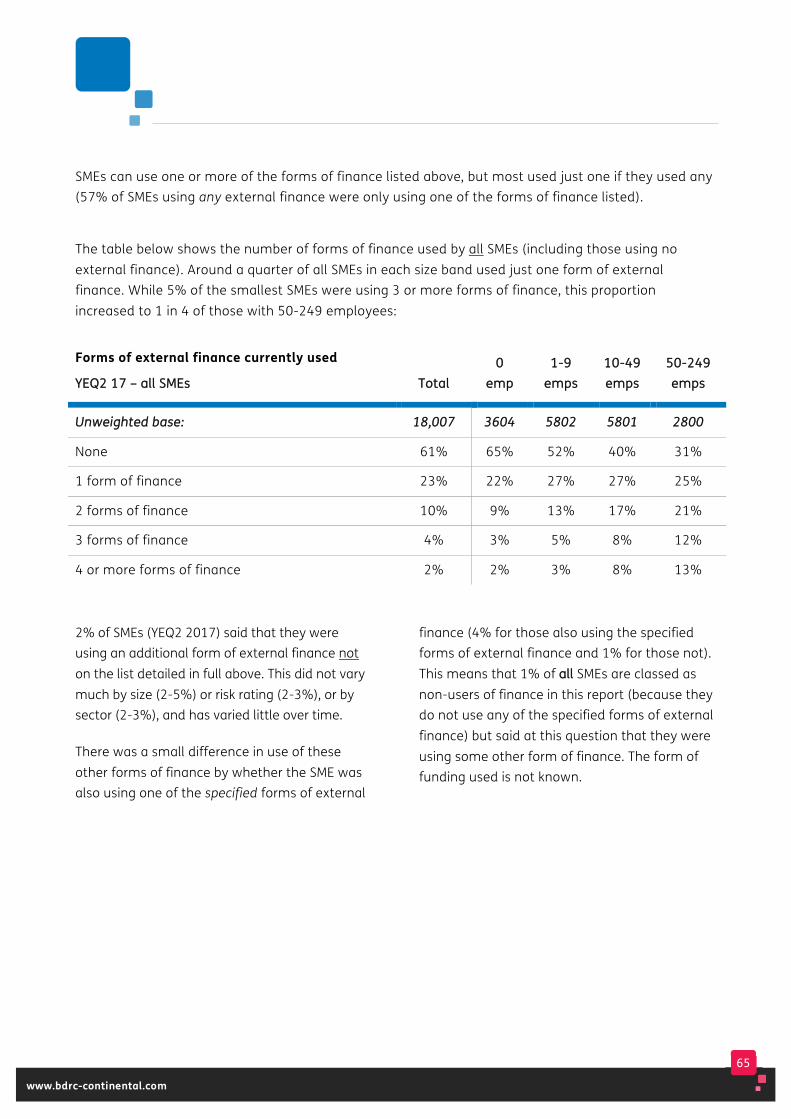
65
www.bdrc-continental.com
SMEs can use one or more of the forms of finance listed above, but most used just one if they used any (57% of SMEs using any external finance were only using one of the forms of finance listed).
The table below shows the number of forms of finance used by all SMEs (including those using no external finance). Around a quarter of all SMEs in each size band used just one form of external finance. While 5% of the smallest SMEs were using 3 or more forms of finance, this proportion increased to 1 in 4 of those with 50-249 employees:
Forms of external finance currently used
YYEEQQ22 1177 –– aallll SSMMEEss TToottaall 00
eemmpp 11--99
eemmppss 1100--4499 eemmppss
5500--224499 eemmppss
UUnnwweeiigghhtteedd bbaassee:: 1188,,000077 33660044 55880022 55880011 22880000
None 61% 65% 52% 40% 31%
1 form of finance 23% 22% 27% 27% 25%
2 forms of finance 10% 9% 13% 17% 21%
3 forms of finance 4% 3% 5% 8% 12%
4 or more forms of finance 2% 2% 3% 8% 13%
2% of SMEs (YEQ2 2017) said that they were using an additional form of external finance not on the list detailed in full above. This did not vary much by size (2-5%) or risk rating (2-3%), or by sector (2-3%), and has varied little over time.
There was a small difference in use of these other forms of finance by whether the SME was also using one of the specified forms of external
finance (4% for those also using the specified forms of external finance and 1% for those not). This means that 1% of aallll SMEs are classed as non-users of finance in this report (because they do not use any of the specified forms of external finance) but said at this question that they were using some other form of finance. The form of funding used is not known.
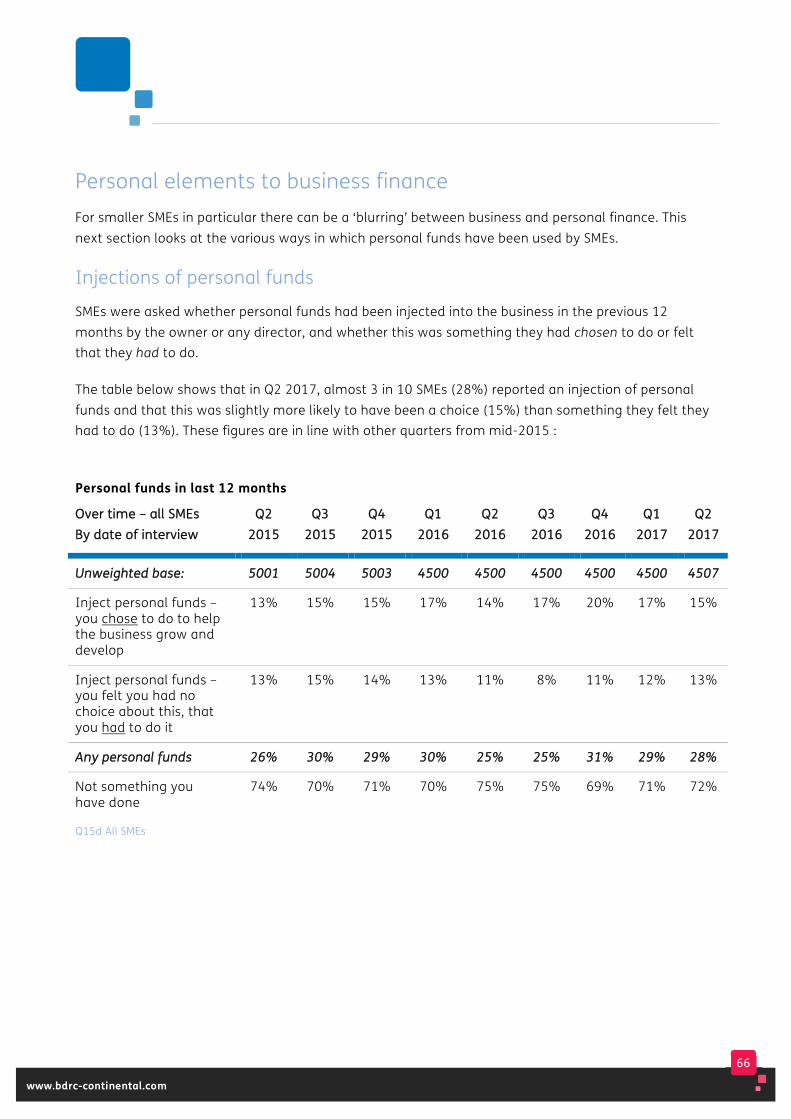
66
www.bdrc-continental.com
Personal elements to business finance For smaller SMEs in particular there can be a ‘blurring’ between business and personal finance. This next section looks at the various ways in which personal funds have been used by SMEs.
Injections of personal funds
SMEs were asked whether personal funds had been injected into the business in the previous 12 months by the owner or any director, and whether this was something they had chosen to do or felt that they had to do.
The table below shows that in Q2 2017, almost 3 in 10 SMEs (28%) reported an injection of personal funds and that this was slightly more likely to have been a choice (15%) than something they felt they had to do (13%). These figures are in line with other quarters from mid-2015 :
Personal funds in last 12 months
OOvveerr ttiimmee –– aallll SSMMEEss BByy ddaattee ooff iinntteerrvviieeww
QQ22 22001155
QQ33 22001155
QQ44 22001155
QQ11 22001166
QQ22 22001166
QQ33 22001166
QQ44 22001166
QQ11 22001177
QQ22 22001177
UUnnwweeiigghhtteedd bbaassee:: 55000011 55000044 55000033 44550000 44550000 44550000 44550000 44550000 44550077
Inject personal funds – you chose to do to help the business grow and develop
13% 15% 15% 17% 14% 17% 20% 17% 15%
Inject personal funds – you felt you had no choice about this, that you had to do it
13% 15% 14% 13% 11% 8% 11% 12% 13%
AAnnyy ppeerrssoonnaall ffuunnddss 2266%% 3300%% 2299%% 3300%% 2255%% 2255%% 3311%% 2299%% 2288%%
Not something you have done
74% 70% 71% 70% 75% 75% 69% 71% 72%
Q15d All SMEs
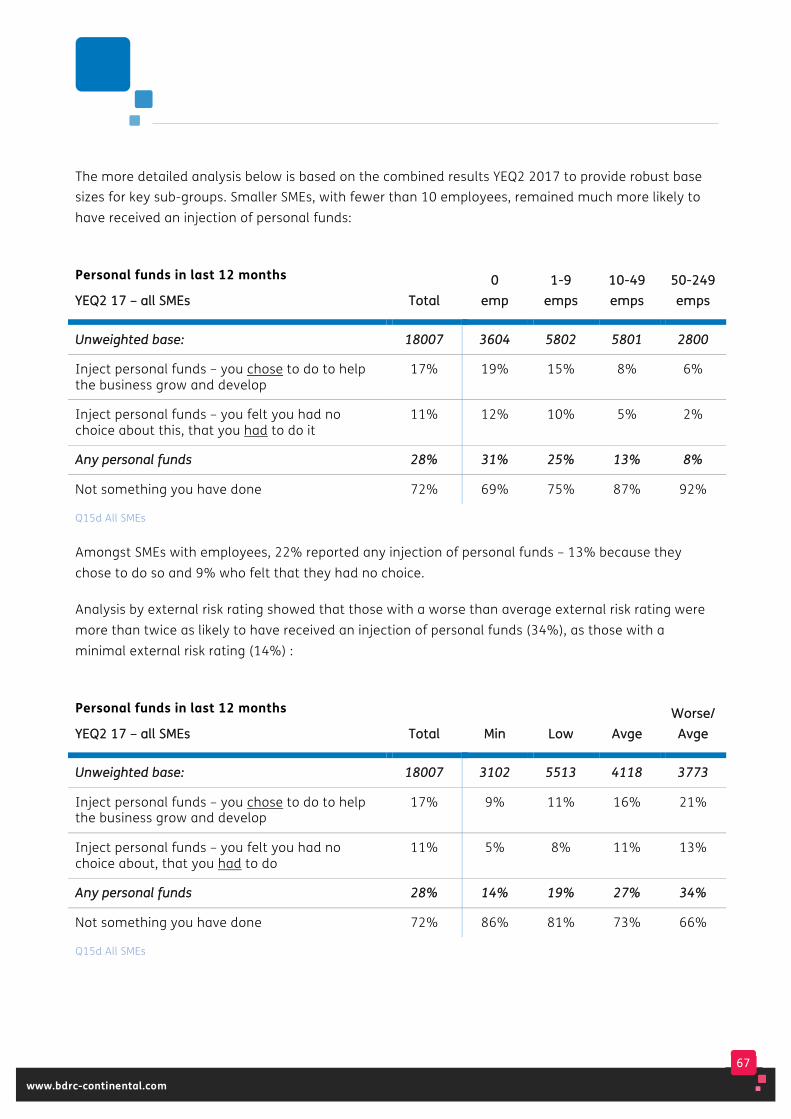
67
www.bdrc-continental.com
The more detailed analysis below is based on the combined results YEQ2 2017 to provide robust base sizes for key sub-groups. Smaller SMEs, with fewer than 10 employees, remained much more likely to have received an injection of personal funds:
Personal funds in last 12 months
YYEEQQ22 1177 –– aallll SSMMEEss TToottaall 00
eemmpp 11--99
eemmppss 1100--4499 eemmppss
5500--224499 eemmppss
UUnnwweeiigghhtteedd bbaassee:: 1188000077 33660044 55880022 55880011 22880000
Inject personal funds – you chose to do to help the business grow and develop
17% 19% 15% 8% 6%
Inject personal funds – you felt you had no choice about this, that you had to do it
11% 12% 10% 5% 2%
AAnnyy ppeerrssoonnaall ffuunnddss 2288%% 3311%% 2255%% 1133%% 88%%
Not something you have done 72% 69% 75% 87% 92%
Q15d All SMEs
Amongst SMEs with employees, 22% reported any injection of personal funds – 13% because they chose to do so and 9% who felt that they had no choice.
Analysis by external risk rating showed that those with a worse than average external risk rating were more than twice as likely to have received an injection of personal funds (34%), as those with a minimal external risk rating (14%) :
Personal funds in last 12 months
YYEEQQ22 1177 –– aallll SSMMEEss TToottaall MMiinn LLooww AAvvggee WWoorrssee//
AAvvggee
UUnnwweeiigghhtteedd bbaassee:: 1188000077 33110022 55551133 44111188 33777733
Inject personal funds – you chose to do to help the business grow and develop
17% 9% 11% 16% 21%
Inject personal funds – you felt you had no choice about, that you had to do
11% 5% 8% 11% 13%
AAnnyy ppeerrssoonnaall ffuunnddss 2288%% 1144%% 1199%% 2277%% 3344%%
Not something you have done 72% 86% 81% 73% 66%
Q15d All SMEs
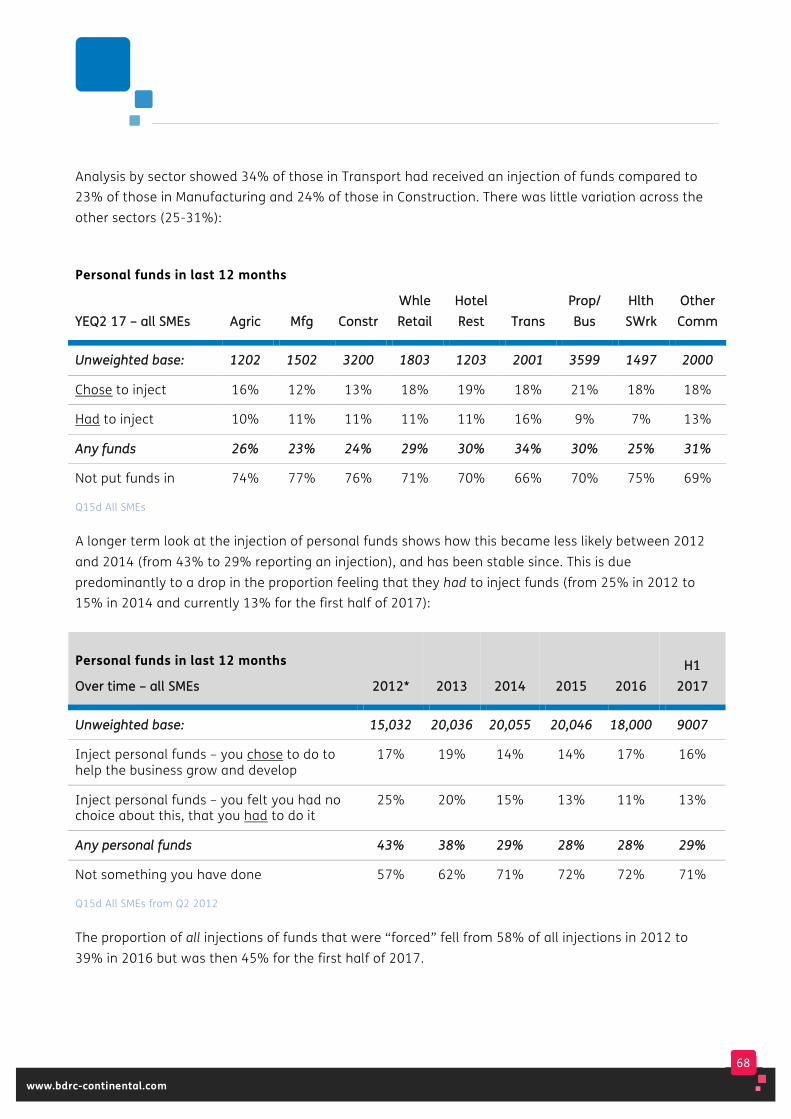
68
www.bdrc-continental.com
Analysis by sector showed 34% of those in Transport had received an injection of funds compared to 23% of those in Manufacturing and 24% of those in Construction. There was little variation across the other sectors (25-31%):
Personal funds in last 12 months
YYEEQQ22 1177 –– aallll SSMMEEss AAggrriicc MMffgg CCoonnssttrr WWhhllee RReettaaiill
HHootteell RReesstt TTrraannss
PPrroopp// BBuuss
HHlltthh SSWWrrkk
OOtthheerr CCoommmm
UUnnwweeiigghhtteedd bbaassee:: 11220022 11550022 33220000 11880033 11220033 22000011 33559999 11449977 22000000
Chose to inject 16% 12% 13% 18% 19% 18% 21% 18% 18%
Had to inject 10% 11% 11% 11% 11% 16% 9% 7% 13%
AAnnyy ffuunnddss 2266%% 2233%% 2244%% 2299%% 3300%% 3344%% 3300%% 2255%% 3311%%
Not put funds in 74% 77% 76% 71% 70% 66% 70% 75% 69%
Q15d All SMEs
A longer term look at the injection of personal funds shows how this became less likely between 2012 and 2014 (from 43% to 29% reporting an injection), and has been stable since. This is due predominantly to a drop in the proportion feeling that they had to inject funds (from 25% in 2012 to 15% in 2014 and currently 13% for the first half of 2017):
Personal funds in last 12 months
OOvveerr ttiimmee –– aallll SSMMEEss 22001122** 22001133 22001144 22001155 22001166 HH11
22001177
UUnnwweeiigghhtteedd bbaassee:: 1155,,003322 2200,,003366 2200,,005555 2200,,004466 1188,,000000 99000077
Inject personal funds – you chose to do to help the business grow and develop
17% 19% 14% 14% 17% 16%
Inject personal funds – you felt you had no choice about this, that you had to do it
25% 20% 15% 13% 11% 13%
AAnnyy ppeerrssoonnaall ffuunnddss 4433%% 3388%% 2299%% 2288%% 2288%% 2299%%
Not something you have done 57% 62% 71% 72% 72% 71%
Q15d All SMEs from Q2 2012
The proportion of all injections of funds that were “forced” fell from 58% of all injections in 2012 to 39% in 2016 but was then 45% for the first half of 2017.
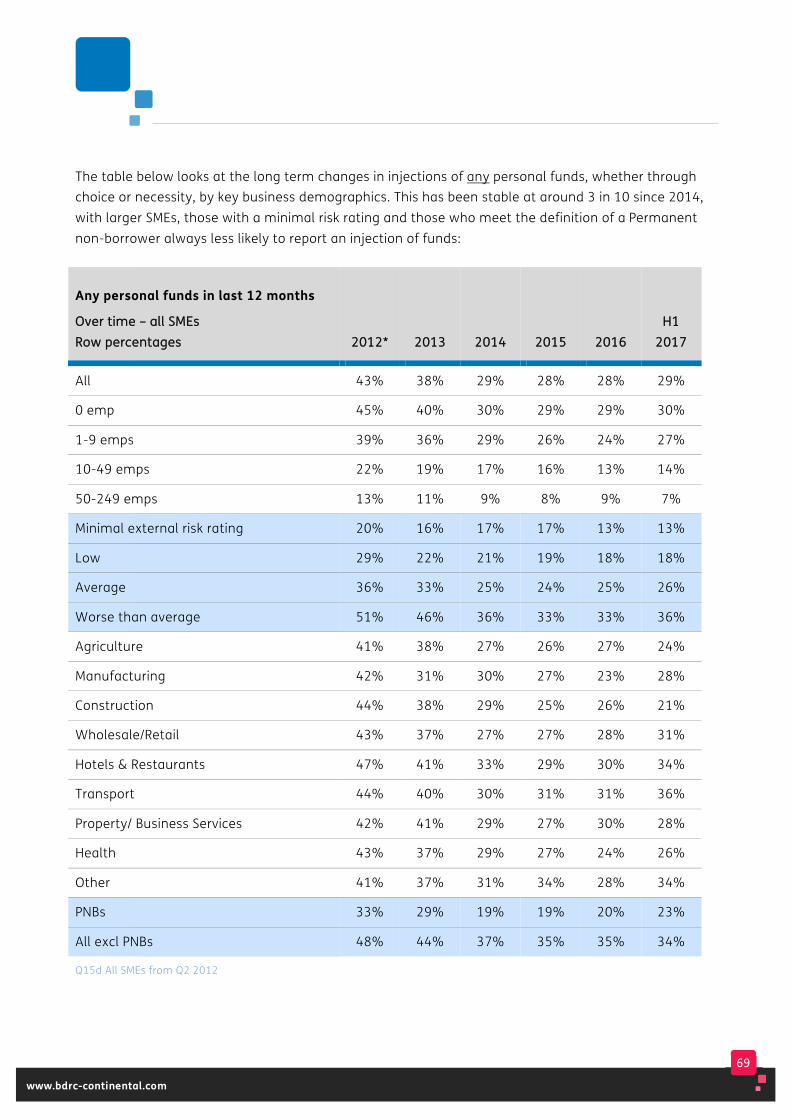
69
www.bdrc-continental.com
The table below looks at the long term changes in injections of any personal funds, whether through choice or necessity, by key business demographics. This has been stable at around 3 in 10 since 2014, with larger SMEs, those with a minimal risk rating and those who meet the definition of a Permanent non-borrower always less likely to report an injection of funds:
Any personal funds in last 12 months
OOvveerr ttiimmee –– aallll SSMMEEss RRooww ppeerrcceennttaaggeess 22001122** 22001133 22001144 22001155
22001166
HH11 22001177
All 43% 38% 29% 28% 28% 29%
0 emp 45% 40% 30% 29% 29% 30%
1-9 emps 39% 36% 29% 26% 24% 27%
10-49 emps 22% 19% 17% 16% 13% 14%
50-249 emps 13% 11% 9% 8% 9% 7%
Minimal external risk rating 20% 16% 17% 17% 13% 13%
Low 29% 22% 21% 19% 18% 18%
Average 36% 33% 25% 24% 25% 26%
Worse than average 51% 46% 36% 33% 33% 36%
Agriculture 41% 38% 27% 26% 27% 24%
Manufacturing 42% 31% 30% 27% 23% 28%
Construction 44% 38% 29% 25% 26% 21%
Wholesale/Retail 43% 37% 27% 27% 28% 31%
Hotels & Restaurants 47% 41% 33% 29% 30% 34%
Transport 44% 40% 30% 31% 31% 36%
Property/ Business Services 42% 41% 29% 27% 30% 28%
Health 43% 37% 29% 27% 24% 26%
Other 41% 37% 31% 34% 28% 34%
PNBs 33% 29% 19% 19% 20% 23%
All excl PNBs 48% 44% 37% 35% 35% 34%
Q15d All SMEs from Q2 2012
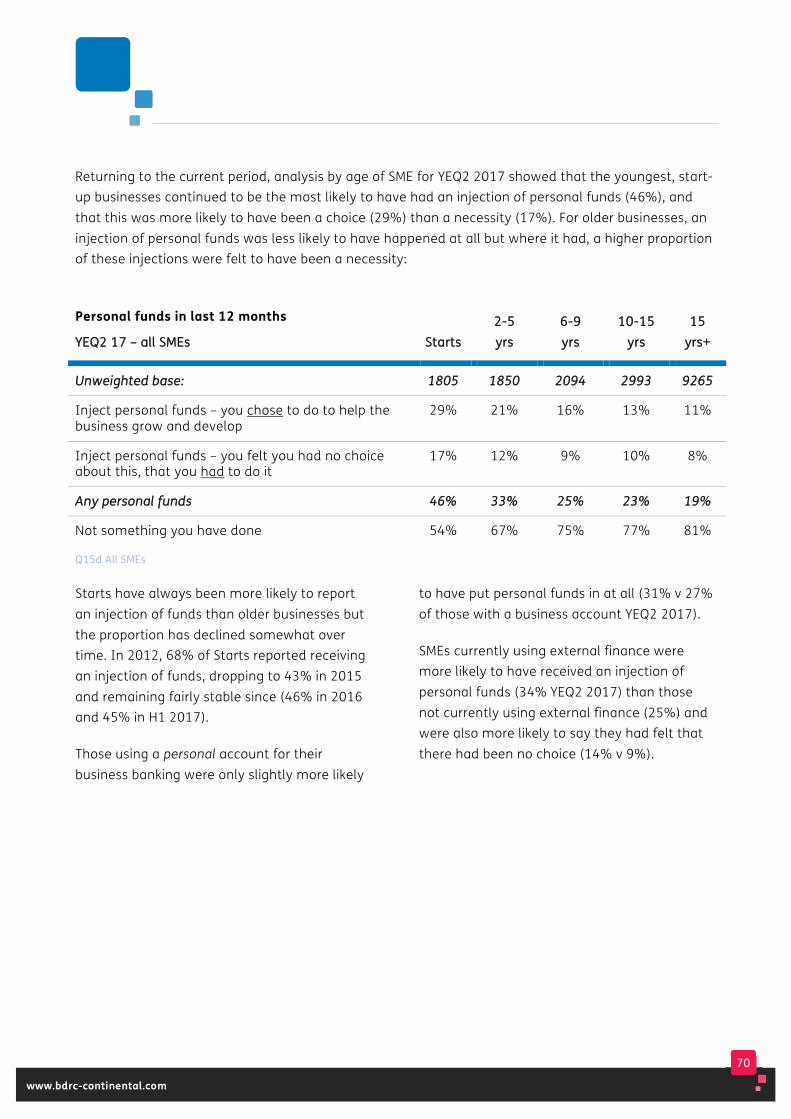
70
www.bdrc-continental.com
Returning to the current period, analysis by age of SME for YEQ2 2017 showed that the youngest, start-up businesses continued to be the most likely to have had an injection of personal funds (46%), and that this was more likely to have been a choice (29%) than a necessity (17%). For older businesses, an injection of personal funds was less likely to have happened at all but where it had, a higher proportion of these injections were felt to have been a necessity:
Personal funds in last 12 months
YYEEQQ22 1177 –– aallll SSMMEEss SSttaarrttss 22--55 yyrrss
66--99 yyrrss
1100--1155 yyrrss
1155 yyrrss++
UUnnwweeiigghhtteedd bbaassee:: 11880055 11885500 22009944 22999933 99226655
Inject personal funds – you chose to do to help the business grow and develop
29% 21% 16% 13% 11%
Inject personal funds – you felt you had no choice about this, that you had to do it
17% 12% 9% 10% 8%
AAnnyy ppeerrssoonnaall ffuunnddss 4466%% 3333%% 2255%% 2233%% 1199%%
Not something you have done 54% 67% 75% 77% 81%
Q15d All SMEs
Starts have always been more likely to report an injection of funds than older businesses but the proportion has declined somewhat over time. In 2012, 68% of Starts reported receiving an injection of funds, dropping to 43% in 2015 and remaining fairly stable since (46% in 2016 and 45% in H1 2017).
Those using a personal account for their business banking were only slightly more likely
to have put personal funds in at all (31% v 27% of those with a business account YEQ2 2017).
SMEs currently using external finance were more likely to have received an injection of personal funds (34% YEQ2 2017) than those not currently using external finance (25%) and were also more likely to say they had felt that there had been no choice (14% v 9%).
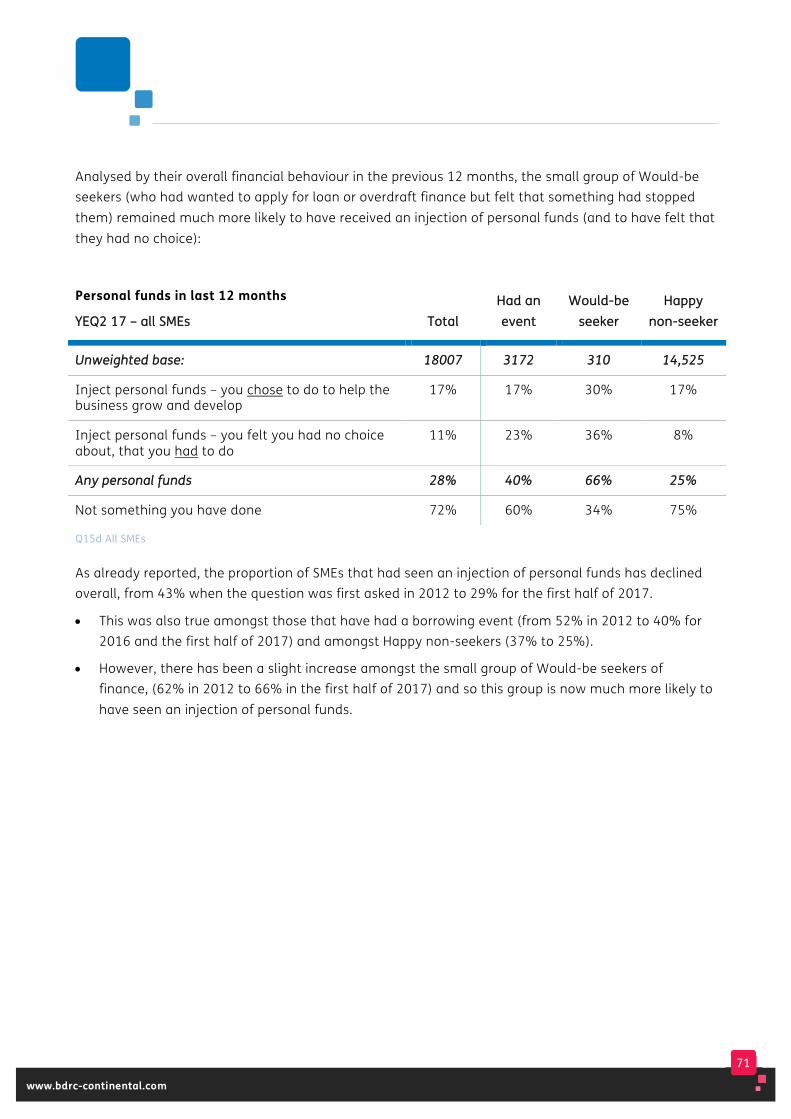
71
www.bdrc-continental.com
Analysed by their overall financial behaviour in the previous 12 months, the small group of Would-be seekers (who had wanted to apply for loan or overdraft finance but felt that something had stopped them) remained much more likely to have received an injection of personal funds (and to have felt that they had no choice):
Personal funds in last 12 months
YYEEQQ22 1177 –– aallll SSMMEEss TToottaall HHaadd aann eevveenntt
WWoouulldd--bbee sseeeekkeerr
HHaappppyy nnoonn--sseeeekkeerr
UUnnwweeiigghhtteedd bbaassee:: 1188000077 33117722 331100 1144,,552255
Inject personal funds – you chose to do to help the business grow and develop
17% 17% 30% 17%
Inject personal funds – you felt you had no choice about, that you had to do
11% 23% 36% 8%
AAnnyy ppeerrssoonnaall ffuunnddss 2288%% 4400%% 6666%% 2255%%
Not something you have done 72% 60% 34% 75%
Q15d All SMEs
As already reported, the proportion of SMEs that had seen an injection of personal funds has declined overall, from 43% when the question was first asked in 2012 to 29% for the first half of 2017.
• This was also true amongst those that have had a borrowing event (from 52% in 2012 to 40% for 2016 and the first half of 2017) and amongst Happy non-seekers (37% to 25%).
• However, there has been a slight increase amongst the small group of Would-be seekers of finance, (62% in 2012 to 66% in the first half of 2017) and so this group is now much more likely to have seen an injection of personal funds.

72
www.bdrc-continental.com
Use of personal accounts and accounts at other banks
Most SMEs used a business bank account (83% excluding DK answers).
Of the 17% that used a personal account, almost all (93%) were 0 employee businesses. So whilst 21% of 0 employee SMEs used a personal account for their business banking, amongst those with employees the figure was 5% or less.
SMEs more likely to be using a personal account included those in the Health sector (26%), Starts (23%), those with a worse than average risk rating (21%) and Permanent non-Borrowers (20%).
In most years around 1 in 5 SMEs has used a personal account, the slight exception being 2014 when 14% of SMEs used them. The latest figures for YEQ2 2017 (17%) are in line with the overall trend.
YEQ2 2017, SMEs using a personal account were:
• Less likely to be using external finance (28% used external finance, compared to 41% of those using a business account) and somewhat less likely to have applied for new or renewed facilities (2% v 5%).
• Somewhat more likely to have put personal funds into the business (31% v 27% of those with a business account) and more likely to be a Permanent non-borrower (54% v 44%).
In H1 2017, 99% of SMEs reported that they only used one bank for their business banking, with little difference by size. Multi-banking remains rare in this market:
Use one bank
OOvveerr ttiimmee -- rrooww ppeerrcceennttaaggeess 22001122 22001133 22001144 22001155 22001166 HH11
22001177
All 99% 99% 99% 98% 99% 99%
0 emps 99% 99% 99% 99% 99% 99%
1-9 emps 98% 99% 98% 98% 99% 98%
10-49 emps 97% 98% 97% 97% 97% 98%
50-249 emps 97% 98% 97% 98% 97% 96%
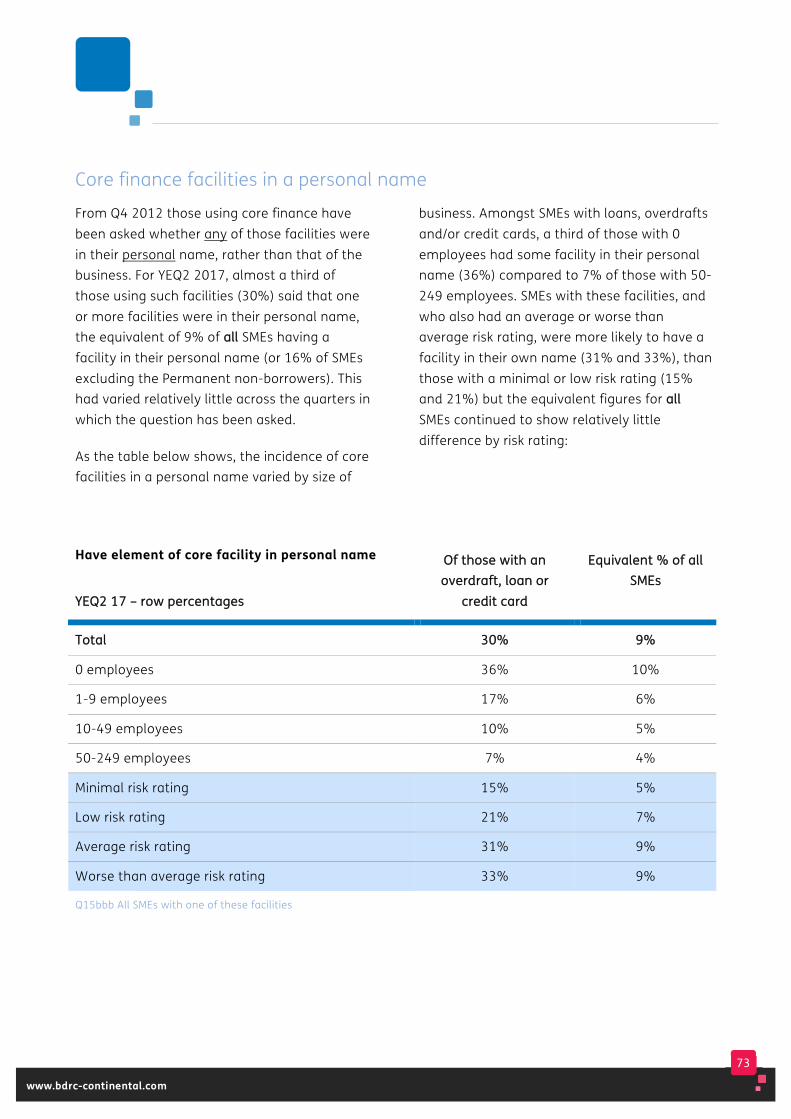
73
www.bdrc-continental.com
Core finance facilities in a personal name
From Q4 2012 those using core finance have been asked whether any of those facilities were in their personal name, rather than that of the business. For YEQ2 2017, almost a third of those using such facilities (30%) said that one or more facilities were in their personal name, the equivalent of 9% of aallll SMEs having a facility in their personal name (or 16% of SMEs excluding the Permanent non-borrowers). This had varied relatively little across the quarters in which the question has been asked.
As the table below shows, the incidence of core facilities in a personal name varied by size of
business. Amongst SMEs with loans, overdrafts and/or credit cards, a third of those with 0 employees had some facility in their personal name (36%) compared to 7% of those with 50-249 employees. SMEs with these facilities, and who also had an average or worse than average risk rating, were more likely to have a facility in their own name (31% and 33%), than those with a minimal or low risk rating (15% and 21%) but the equivalent figures for aallll
SMEs continued to show relatively little difference by risk rating:
Have element of core facility in personal name
YYEEQQ22 1177 –– rrooww ppeerrcceennttaaggeess
OOff tthhoossee wwiitthh aann oovveerrddrraafftt,, llooaann oorr
ccrreeddiitt ccaarrdd
EEqquuiivvaalleenntt %% ooff aallll SSMMEEss
TToottaall 3300%% 99%%
0 employees 36% 10%
1-9 employees 17% 6%
10-49 employees 10% 5%
50-249 employees 7% 4%
Minimal risk rating 15% 5%
Low risk rating 21% 7%
Average risk rating 31% 9%
Worse than average risk rating 33% 9%
Q15bbb All SMEs with one of these facilities
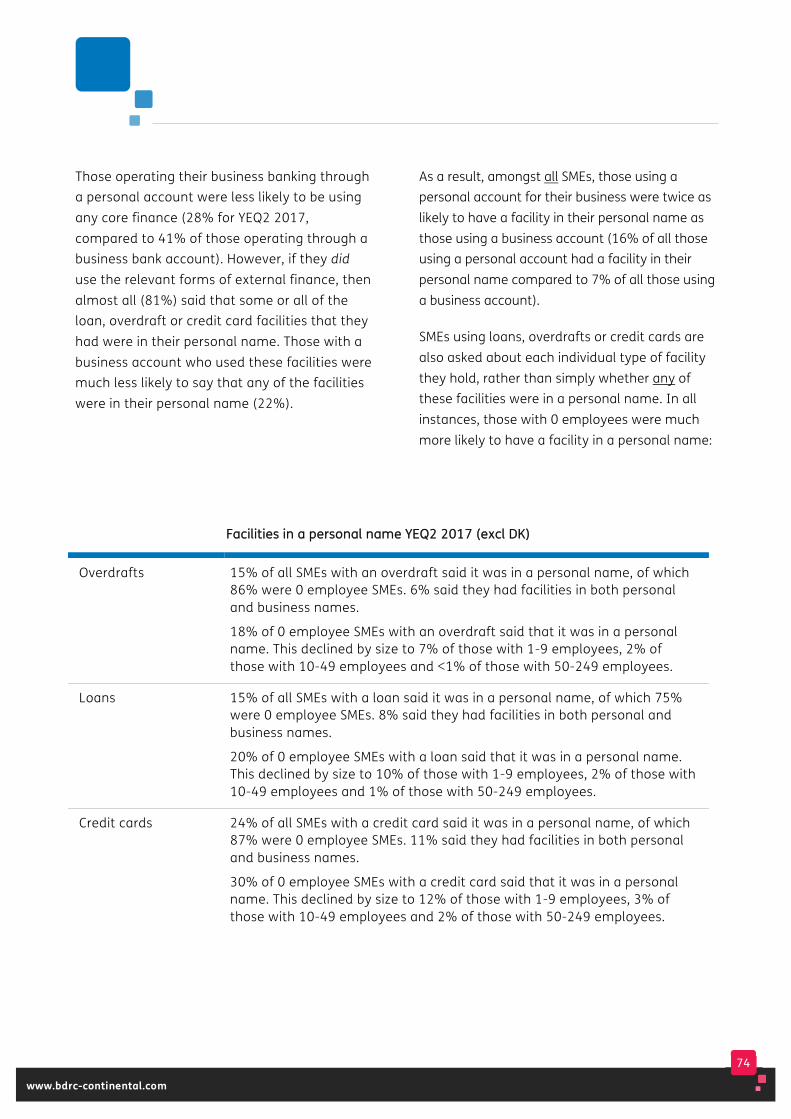
74
www.bdrc-continental.com
Those operating their business banking through a personal account were less likely to be using any core finance (28% for YEQ2 2017, compared to 41% of those operating through a business bank account). However, if they did use the relevant forms of external finance, then almost all (81%) said that some or all of the loan, overdraft or credit card facilities that they had were in their personal name. Those with a business account who used these facilities were much less likely to say that any of the facilities were in their personal name (22%).
As a result, amongst all SMEs, those using a personal account for their business were twice as likely to have a facility in their personal name as those using a business account (16% of all those using a personal account had a facility in their personal name compared to 7% of all those using a business account).
SMEs using loans, overdrafts or credit cards are also asked about each individual type of facility they hold, rather than simply whether any of these facilities were in a personal name. In all instances, those with 0 employees were much more likely to have a facility in a personal name:
FFaacciilliittiieess iinn aa ppeerrssoonnaall nnaammee YYEEQQ22 22001177 ((eexxccll DDKK))
Overdrafts 15% of all SMEs with an overdraft said it was in a personal name, of which 86% were 0 employee SMEs. 6% said they had facilities in both personal and business names.
18% of 0 employee SMEs with an overdraft said that it was in a personal name. This declined by size to 7% of those with 1-9 employees, 2% of those with 10-49 employees and <1% of those with 50-249 employees.
Loans 15% of all SMEs with a loan said it was in a personal name, of which 75% were 0 employee SMEs. 8% said they had facilities in both personal and business names.
20% of 0 employee SMEs with a loan said that it was in a personal name. This declined by size to 10% of those with 1-9 employees, 2% of those with 10-49 employees and 1% of those with 50-249 employees.
Credit cards 24% of all SMEs with a credit card said it was in a personal name, of which 87% were 0 employee SMEs. 11% said they had facilities in both personal and business names.
30% of 0 employee SMEs with a credit card said that it was in a personal name. This declined by size to 12% of those with 1-9 employees, 3% of those with 10-49 employees and 2% of those with 50-249 employees.
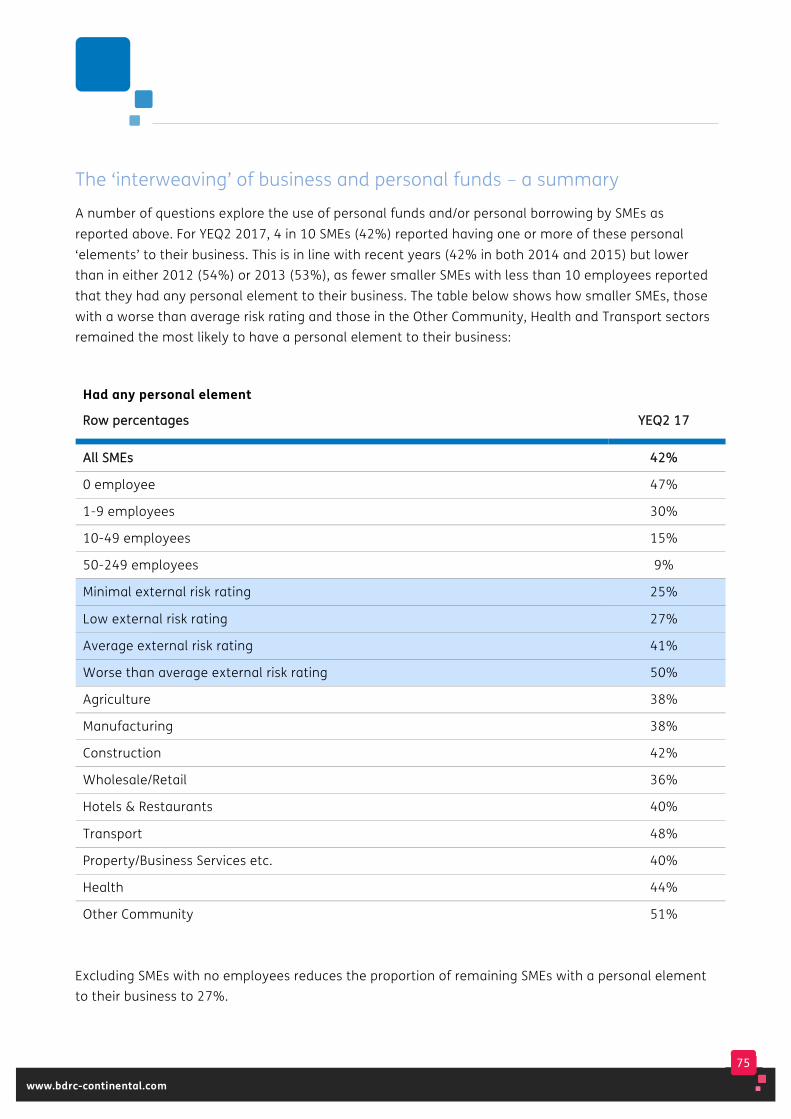
75
www.bdrc-continental.com
The ‘interweaving’ of business and personal funds – a summary
A number of questions explore the use of personal funds and/or personal borrowing by SMEs as reported above. For YEQ2 2017, 4 in 10 SMEs (42%) reported having one or more of these personal ‘elements’ to their business. This is in line with recent years (42% in both 2014 and 2015) but lower than in either 2012 (54%) or 2013 (53%), as fewer smaller SMEs with less than 10 employees reported that they had any personal element to their business. The table below shows how smaller SMEs, those with a worse than average risk rating and those in the Other Community, Health and Transport sectors remained the most likely to have a personal element to their business:
Had any personal element
RRooww ppeerrcceennttaaggeess YYEEQQ22 1177
AAllll SSMMEEss 4422%%
0 employee 47%
1-9 employees 30%
10-49 employees 15%
50-249 employees 9%
Minimal external risk rating 25%
Low external risk rating 27%
Average external risk rating 41%
Worse than average external risk rating 50%
Agriculture 38%
Manufacturing 38%
Construction 42%
Wholesale/Retail 36%
Hotels & Restaurants 40%
Transport 48%
Property/Business Services etc. 40%
Health 44%
Other Community 51%
Excluding SMEs with no employees reduces the proportion of remaining SMEs with a personal element to their business to 27%.
76
www.bdrc-continental.com
6. Financial context –how are SMEs funding themselves? (Part 2)
This chapter provides an overview of other aspects of external finance – trade credit, Permanent non-Borrowers and attitudes to using finance.
77
www.bdrc-continental.com
Key findings Fewer SMEs in the first half of 2017 were happy to use finance to help the business grow.
• Since this question was first asked, 41-45% of SMEs each half year have agreed they would use finance to help the business grow. In the first half of 2017, 33% agreed
• This lower appetite for finance in 2017 was seen most markedly amongst 0 employee SMEs (41% in 2016 to 30% in H1 2017) but all size bands were less willing to use finance with the exception of those with 50-249 employees where willingness to use finance increased slightly (51% to 54%).
Attitudinally, SMEs continued to prefer self-reliance, even if this meant slower growth.
• 81% agreed that their plans for the business were based on what they can afford and this has remained consistent over time
• 70% would accept a slower rate of growth rather than borrowing to grow and this has also remained consistent over time.
65% of all SMEs were using business funding, any combination of external finance, trade credit or injections of personal funds, and this has remained fairly stable over time.
• The ‘uplift’ between users of external finance and users of business funding was most marked for those with 0 employees (35% to 62%).
78
www.bdrc-continental.com
At the other end of the finance spectrum, 46% of SMEs met the definition of a Permanent non-borrower, an SME that seems firmly disinclined to borrow, based on their current and future finance plans.
• Whilst 0 employee SMEs remained more likely to be a PNB (49%), a quarter of those with 50-249 employees (23%) met the definition (YEQ2 2017)
• The proportion of PNBs increased from 34% of all SMEs in 2012 to 47% in 2015 and has been stable since
• The likelihood of being a PNB is affected by the size of the business, being less likely to plan, to innovate or to plan to grow and being more likely to see access to finance as a barrier.
79
www.bdrc-continental.com
Use of trade credit
Data has been gathered on the extent to which SMEs use trade credit from their suppliers and the impact it has on their use of, or need for, external finance.
35% of SMEs regularly purchased products or services from other businesses on credit (YEQ2 2017). As previously seen, use of trade credit increased by size of SME:
• 30% of those with 0 employees regularly purchased on credit
• 47% of those with 1-9 employees
• 63% of those with 10-49 employees
• 66% of those with 50-249 employees.
Those using external finance (loans, overdrafts etc) remained more likely to be using trade credit (52%) than those who were not using any external finance (25%).
As the table below shows, overall use of trade credit has increased very slightly over time (31 to 35%). In H1 2017, larger SMEs were more likely to report using trade credit, with around 7 in 10 of those with 10-49 or 50-249 employees now using trade credit, compared to 6 in 10 previously:
Currently use trade credit
OOvveerr ttiimmee –– aallll SSMMEEss BByy ddaattee ooff iinntteerrvviieeww –– rrooww ppeerrcceennttaaggeess 22001144 22001155 22001166
HH11 22001177
All 31% 33% 33% 35%
0 emp 26% 28% 28% 30%
1-9 emps 45% 47% 45% 48%
10-49 emps 58% 61% 59% 66%
50-249 emps 58% 60% 59% 71%
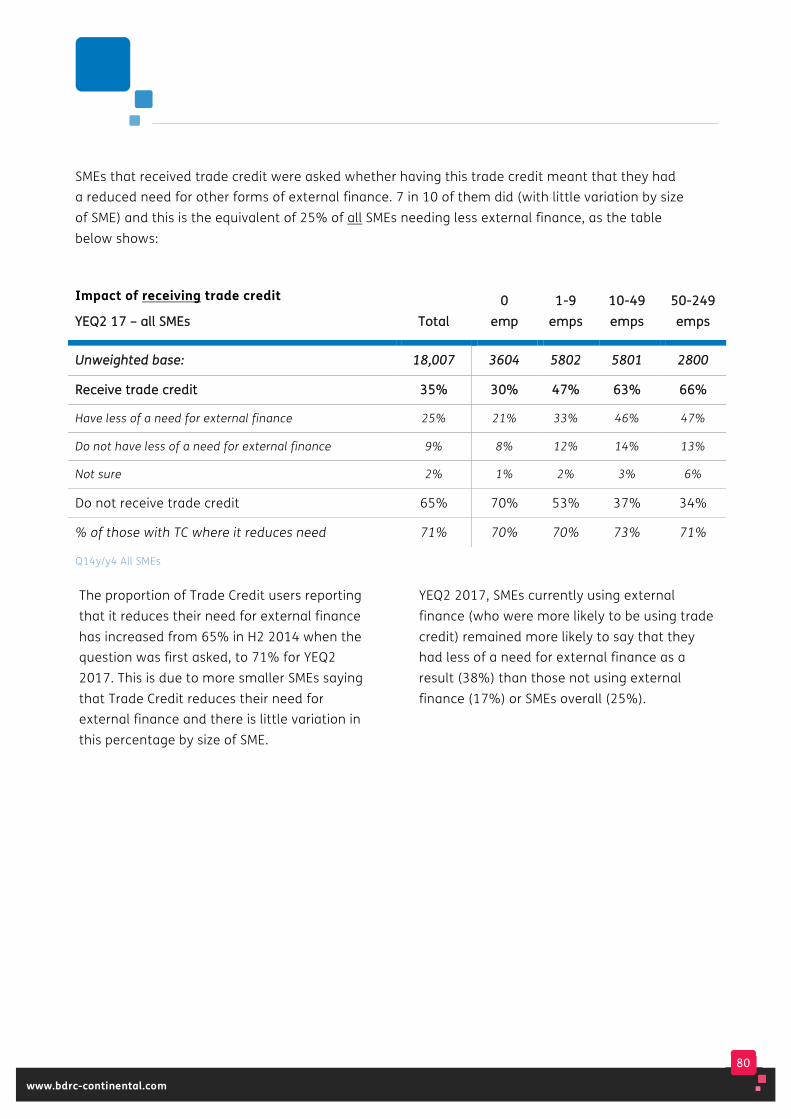
80
www.bdrc-continental.com
SMEs that received trade credit were asked whether having this trade credit meant that they had a reduced need for other forms of external finance. 7 in 10 of them did (with little variation by size of SME) and this is the equivalent of 25% of all SMEs needing less external finance, as the table below shows:
Impact of receiving trade credit
YYEEQQ22 1177 –– aallll SSMMEEss TToottaall 00
eemmpp 11--99
eemmppss 1100--4499 eemmppss
5500--224499 eemmppss
UUnnwweeiigghhtteedd bbaassee:: 1188,,000077 33660044 55880022 55880011 22880000
RReecceeiivvee ttrraaddee ccrreeddiitt 3355%% 3300%% 4477%% 6633%% 6666%%
Have less of a need for external finance 25% 21% 33% 46% 47%
Do not have less of a need for external finance 9% 8% 12% 14% 13%
Not sure 2% 1% 2% 3% 6%
Do not receive trade credit 65% 70% 53% 37% 34%
% of those with TC where it reduces need 71% 70% 70% 73% 71%
Q14y/y4 All SMEs
The proportion of Trade Credit users reporting that it reduces their need for external finance has increased from 65% in H2 2014 when the question was first asked, to 71% for YEQ2 2017. This is due to more smaller SMEs saying that Trade Credit reduces their need for external finance and there is little variation in this percentage by size of SME.
YEQ2 2017, SMEs currently using external finance (who were more likely to be using trade credit) remained more likely to say that they had less of a need for external finance as a result (38%) than those not using external finance (17%) or SMEs overall (25%).
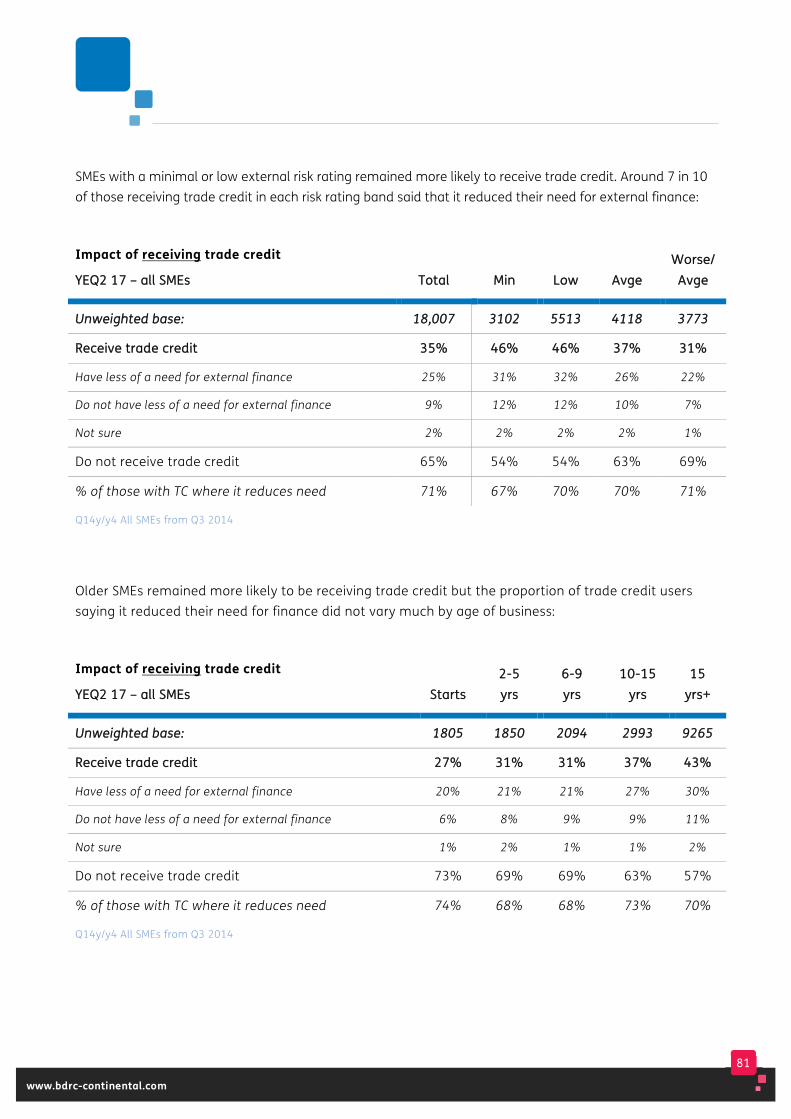
81
www.bdrc-continental.com
SMEs with a minimal or low external risk rating remained more likely to receive trade credit. Around 7 in 10 of those receiving trade credit in each risk rating band said that it reduced their need for external finance:
Impact of receiving trade credit
YYEEQQ22 1177 –– aallll SSMMEEss TToottaall MMiinn LLooww AAvvggee WWoorrssee//
AAvvggee
UUnnwweeiigghhtteedd bbaassee:: 1188,,000077 33110022 55551133 44111188 33777733
RReecceeiivvee ttrraaddee ccrreeddiitt 3355%% 4466%% 4466%% 3377%% 3311%%
Have less of a need for external finance 25% 31% 32% 26% 22%
Do not have less of a need for external finance 9% 12% 12% 10% 7%
Not sure 2% 2% 2% 2% 1%
Do not receive trade credit 65% 54% 54% 63% 69%
% of those with TC where it reduces need 71% 67% 70% 70% 71%
Q14y/y4 All SMEs from Q3 2014
Older SMEs remained more likely to be receiving trade credit but the proportion of trade credit users saying it reduced their need for finance did not vary much by age of business:
Impact of receiving trade credit
YYEEQQ22 1177 –– aallll SSMMEEss SSttaarrttss 22--55 yyrrss
66--99 yyrrss
1100--1155 yyrrss
1155 yyrrss++
UUnnwweeiigghhtteedd bbaassee:: 11880055 11885500 22009944 22999933 99226655
RReecceeiivvee ttrraaddee ccrreeddiitt 2277%% 3311%% 3311%% 3377%% 4433%%
Have less of a need for external finance 20% 21% 21% 27% 30%
Do not have less of a need for external finance 6% 8% 9% 9% 11%
Not sure 1% 2% 1% 1% 2%
Do not receive trade credit 73% 69% 69% 63% 57%
% of those with TC where it reduces need 74% 68% 68% 73% 70%
Q14y/y4 All SMEs from Q3 2014
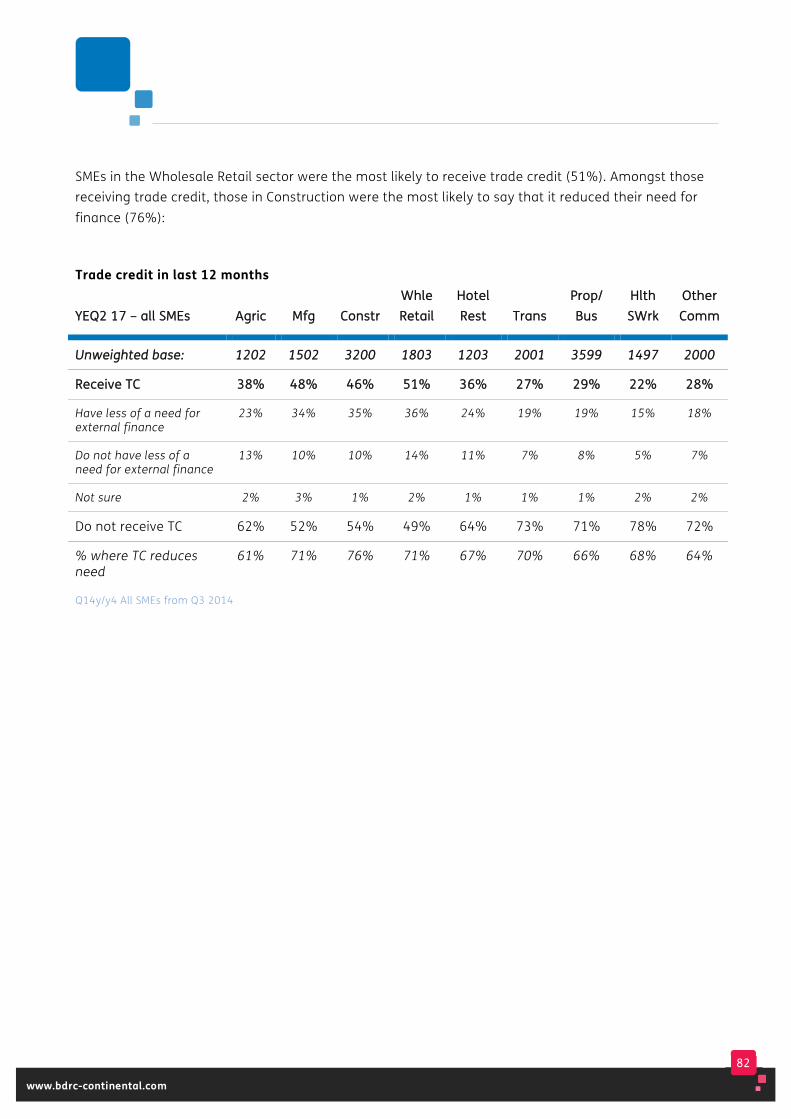
82
www.bdrc-continental.com
SMEs in the Wholesale Retail sector were the most likely to receive trade credit (51%). Amongst those receiving trade credit, those in Construction were the most likely to say that it reduced their need for finance (76%):
Trade credit in last 12 months
YYEEQQ22 1177 –– aallll SSMMEEss AAggrriicc MMffgg CCoonnssttrr WWhhllee RReettaaiill
HHootteell RReesstt TTrraannss
PPrroopp// BBuuss
HHlltthh SSWWrrkk
OOtthheerr CCoommmm
UUnnwweeiigghhtteedd bbaassee:: 11220022 11550022 33220000 11880033 11220033 22000011 33559999 11449977 22000000
RReecceeiivvee TTCC 3388%% 4488%% 4466%% 5511%% 3366%% 2277%% 2299%% 2222%% 2288%%
Have less of a need for external finance
23% 34% 35% 36% 24% 19% 19% 15% 18%
Do not have less of a need for external finance
13% 10% 10% 14% 11% 7% 8% 5% 7%
Not sure 2% 3% 1% 2% 1% 1% 1% 2% 2%
Do not receive TC 62% 52% 54% 49% 64% 73% 71% 78% 72%
% where TC reduces need
61% 71% 76% 71% 67% 70% 66% 68% 64%
Q14y/y4 All SMEs from Q3 2014

83
www.bdrc-continental.com
A wider definition of ‘Total business funding’ The questions on trade credit and injections of personal funds allow for an analysis of the use of ‘total business funding’ by SMEs in a wider sense, i.e. including both trade credit received and injections of personal funds as well as external finance. Note that the amount of trade credit received is not recorded, and that when last asked, the typical injection of personal funds was for a relatively small amount (often less than £5,000).
For YEQ2 2017:
• 39% of SMEs were using eexxtteerrnnaall ffiinnaannccee as defined in the previous chapter (i.e. loans, overdrafts, invoice finance etc).
• An additional 15% of SMEs were not using external finance but were receiving ttrraaddee ccrreeddiitt.
• And finally, a further 11% of SMEs were using neither external finance, nor trade credit, but had seen an iinnjjeeccttiioonn ooff ppeerrssoonnaall ffuunnddss into the business (also defined in the previous chapter).
Widening the definition of external funding to include not only finance but also trade credit and personal funds thus increases the proportion of SMEs using business funding from 39% to 65%.
Analysis by year shows that this has changed very little over the period for which this data is available, albeit the H1 2017 figure of 66% is the highest seen to date:
Use of business funding
OOvveerr ttiimmee –– aallll SSMMEEss 22001144 22001155 22001166 HH11
22001177
UUnnwweeiigghhtteedd bbaassee:: 2200,,005555 2200,,004466 1188,,000000 99000077
Use external finance 37% 37% 37% 38%
Do not use finance but do use trade credit 15% 16% 15% 16%
Do not use the above but injected personal funds 12% 11% 11% 12%
TToottaall bbuussiinneessss ffuunnddiinngg 6633%% 6644%% 6633%% 6666%%
All SMEs from 2014
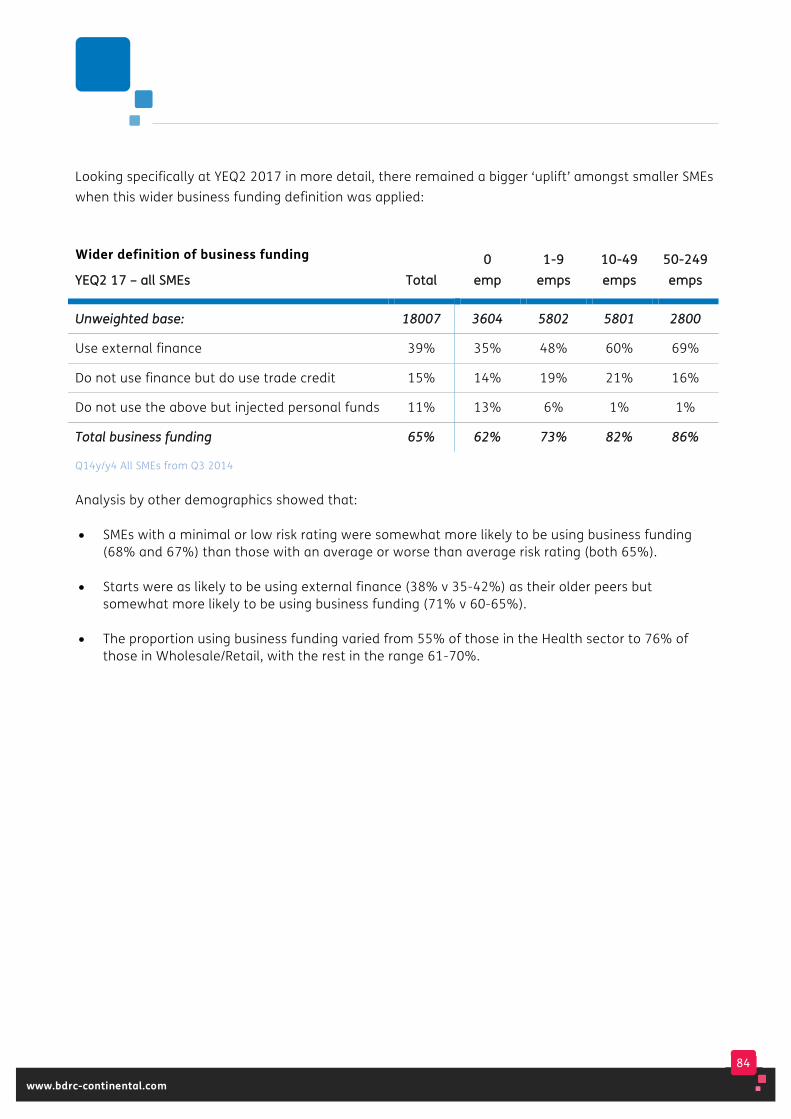
84
www.bdrc-continental.com
Looking specifically at YEQ2 2017 in more detail, there remained a bigger ‘uplift’ amongst smaller SMEs when this wider business funding definition was applied:
Wider definition of business funding
YYEEQQ22 1177 –– aallll SSMMEEss TToottaall 00
eemmpp 11--99
eemmppss 1100--4499 eemmppss
5500--224499 eemmppss
UUnnwweeiigghhtteedd bbaassee:: 1188000077 33660044 55880022 55880011 22880000
Use external finance 39% 35% 48% 60% 69%
Do not use finance but do use trade credit 15% 14% 19% 21% 16%
Do not use the above but injected personal funds 11% 13% 6% 1% 1%
TToottaall bbuussiinneessss ffuunnddiinngg 6655%% 6622%% 7733%% 8822%% 8866%%
Q14y/y4 All SMEs from Q3 2014
Analysis by other demographics showed that:
• SMEs with a minimal or low risk rating were somewhat more likely to be using business funding (68% and 67%) than those with an average or worse than average risk rating (both 65%).
• Starts were as likely to be using external finance (38% v 35-42%) as their older peers but somewhat more likely to be using business funding (71% v 60-65%).
• The proportion using business funding varied from 55% of those in the Health sector to 76% of those in Wholesale/Retail, with the rest in the range 61-70%.

85
www.bdrc-continental.com
The non-borrowing SME
As the previous chapter reported, 4 in 10 SMEs (39% YEQ2 2017) currently use external finance. Other data from this report allows for identification of those SMEs who seem firmly disinclined to borrow, defined as those that meet aallll of the following conditions:
• Are not currently using external finance
• Have not used external finance in the past 5 years
• Have had no loan or overdraft borrowing events in the past 12 months
• Have not applied for any other forms of finance in the last 12 months
• Said that they had had no desire to borrow in the past 12 months
• Reported no inclination to borrow in the next 3 months.
These PPeerrmmaanneenntt nnoonn--bboorrrroowweerrss made up 46% of SMEs (YEQ2 2017), and remained more likely to be found amongst the smaller SMEs, although not exclusively so (amongst SMEs with employees, 36% met the definition of a Permanent non-borrower):
• 49% of 0 employee SMEs met this non-borrowing definition
• 37% of 1-9 employee SMEs
• 30% of 10-49 employee SMEs
• 23% of 50-249 employee SMEs.
Half of SMEs in the Health (53%) or Property/Business Services (49%) sectors met the definition of a Permanent non-borrower, compared to 37% of those in Agriculture. Those using a personal account for their business banking (54%) were also somewhat more likely to meet the definition. This means that the equivalent of 9% of all SMEs are Permanent non-borrowers who use a personal bank account.
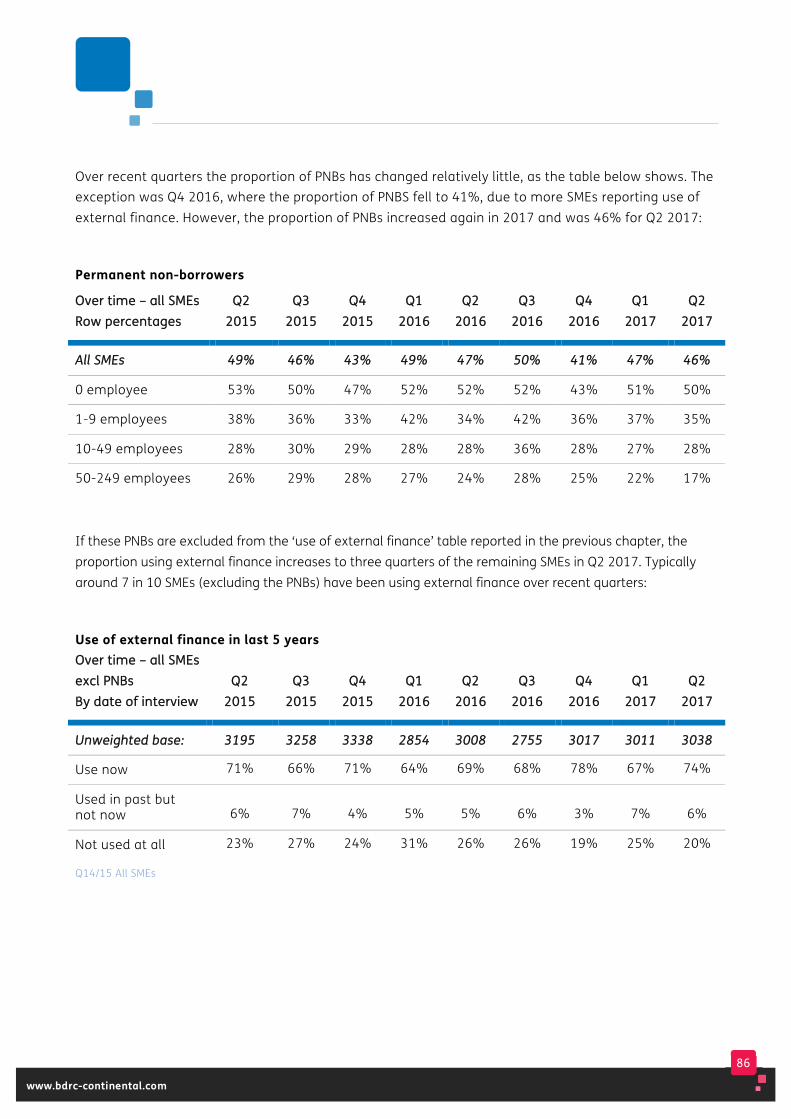
86
www.bdrc-continental.com
Over recent quarters the proportion of PNBs has changed relatively little, as the table below shows. The exception was Q4 2016, where the proportion of PNBS fell to 41%, due to more SMEs reporting use of external finance. However, the proportion of PNBs increased again in 2017 and was 46% for Q2 2017:
Permanent non-borrowers
OOvveerr ttiimmee –– aallll SSMMEEss RRooww ppeerrcceennttaaggeess
QQ22 22001155
QQ33 22001155
QQ44 22001155
QQ11 22001166
QQ22 22001166
QQ33 22001166
QQ44 22001166
QQ11 22001177
QQ22 22001177
AAllll SSMMEEss 4499%% 4466%% 4433%% 4499%% 4477%% 5500%% 4411%% 4477%% 4466%%
0 employee 53% 50% 47% 52% 52% 52% 43% 51% 50%
1-9 employees 38% 36% 33% 42% 34% 42% 36% 37% 35%
10-49 employees 28% 30% 29% 28% 28% 36% 28% 27% 28%
50-249 employees 26% 29% 28% 27% 24% 28% 25% 22% 17%
If these PNBs are excluded from the ‘use of external finance’ table reported in the previous chapter, the proportion using external finance increases to three quarters of the remaining SMEs in Q2 2017. Typically around 7 in 10 SMEs (excluding the PNBs) have been using external finance over recent quarters:
Use of external finance in last 5 years OOvveerr ttiimmee –– aallll SSMMEEss eexxccll PPNNBBss BByy ddaattee ooff iinntteerrvviieeww
QQ22 22001155
QQ33 22001155
QQ44 22001155
QQ11 22001166
QQ22 22001166
QQ33 22001166
QQ44 22001166
QQ11 22001177
QQ22 22001177
UUnnwweeiigghhtteedd bbaassee:: 33119955 33225588 33333388 22885544 33000088 22775555 33001177 33001111 33003388
Use now 71% 66% 71% 64% 69% 68% 78% 67% 74%
Used in past but not now 6% 7% 4% 5% 5% 6% 3% 7% 6%
Not used at all 23% 27% 24% 31% 26% 26% 19% 25% 20%
Q14/15 All SMEs
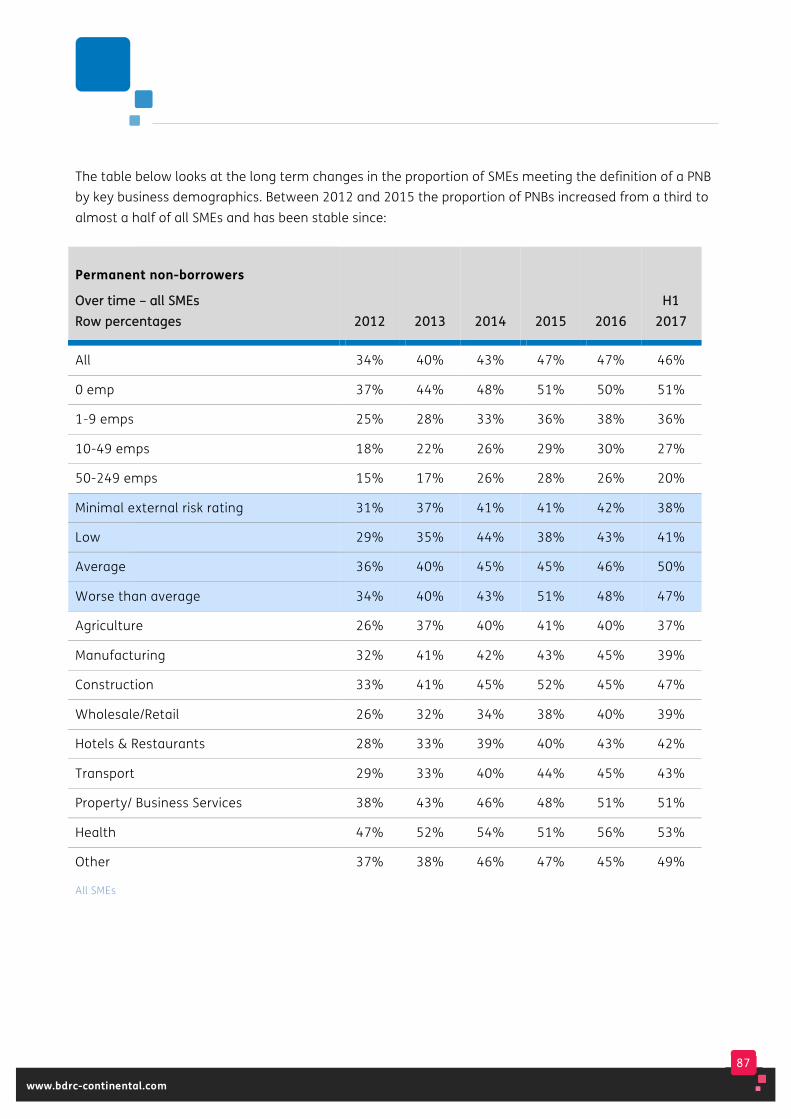
87
www.bdrc-continental.com
The table below looks at the long term changes in the proportion of SMEs meeting the definition of a PNB by key business demographics. Between 2012 and 2015 the proportion of PNBs increased from a third to almost a half of all SMEs and has been stable since:
Permanent non-borrowers
OOvveerr ttiimmee –– aallll SSMMEEss RRooww ppeerrcceennttaaggeess 22001122 22001133 22001144 22001155
22001166
HH11 22001177
All 34% 40% 43% 47% 47% 46%
0 emp 37% 44% 48% 51% 50% 51%
1-9 emps 25% 28% 33% 36% 38% 36%
10-49 emps 18% 22% 26% 29% 30% 27%
50-249 emps 15% 17% 26% 28% 26% 20%
Minimal external risk rating 31% 37% 41% 41% 42% 38%
Low 29% 35% 44% 38% 43% 41%
Average 36% 40% 45% 45% 46% 50%
Worse than average 34% 40% 43% 51% 48% 47%
Agriculture 26% 37% 40% 41% 40% 37%
Manufacturing 32% 41% 42% 43% 45% 39%
Construction 33% 41% 45% 52% 45% 47%
Wholesale/Retail 26% 32% 34% 38% 40% 39%
Hotels & Restaurants 28% 33% 39% 40% 43% 42%
Transport 29% 33% 40% 44% 45% 43%
Property/ Business Services 38% 43% 46% 48% 51% 51%
Health 47% 52% 54% 51% 56% 53%
Other 37% 38% 46% 47% 45% 49%
All SMEs

88
www.bdrc-continental.com
As already reported, since 2012, the proportion of all SMEs using external finance initially decreased and then stabilised, while the proportion that met the definition of a PNB increased and then stabilised. The table below shows that the relationship between these two elements is different over time for those with employees to those without:
Use of external finance and PNBs
OOvveerr ttiimmee RRooww ppeerrcceennttaaggeess 22001122 22001133 22001144 22001155
22001166
HH11 22001177
0 employees:
• Use external finance 38% 35% 32% 32% 33% 33%
• Permanent non-borrower 37% 44% 48% 51% 50% 51%
All with employees
• Use external finance 59% 57% 51% 51% 49% 52%
• Permanent non-borrower 24% 27% 32% 35% 37% 34%
All SMEs from 2012
Amongst 0 employee SMEs, the proportion using external finance and the proportion that met the definition of a PNB were the same in 2012. Between 2012 and 2015, use of external finance decreased and the proportion qualifying as PNBs increased, until there was a 19 percentage point difference between them in 2015 (32% v 51%), with little change since (18 points for the first half of 2017).
In 2012 twice as many SMEs with employees were using external finance (59%) as met the definition of a PNB (24%), a gap of 35 percentage points. Between 2012 and 2016
there was a decline in the proportion using external finance, and an increase in those meeting the definition of a PNB. As a result, the gap narrowed from 35 to 12 percentage points by the end of 2016. However, with use of finance increasing slightly in H1 2017 for this group, and the proportion of PNBs declining slightly, the gap has widened slightly to 18 points.
PNBs are a major influence on the overall position of SMEs regarding access to, and appetite for, external finance. Additional analysis has therefore been conducted, to understand the types of SME that fit the PNB definition.
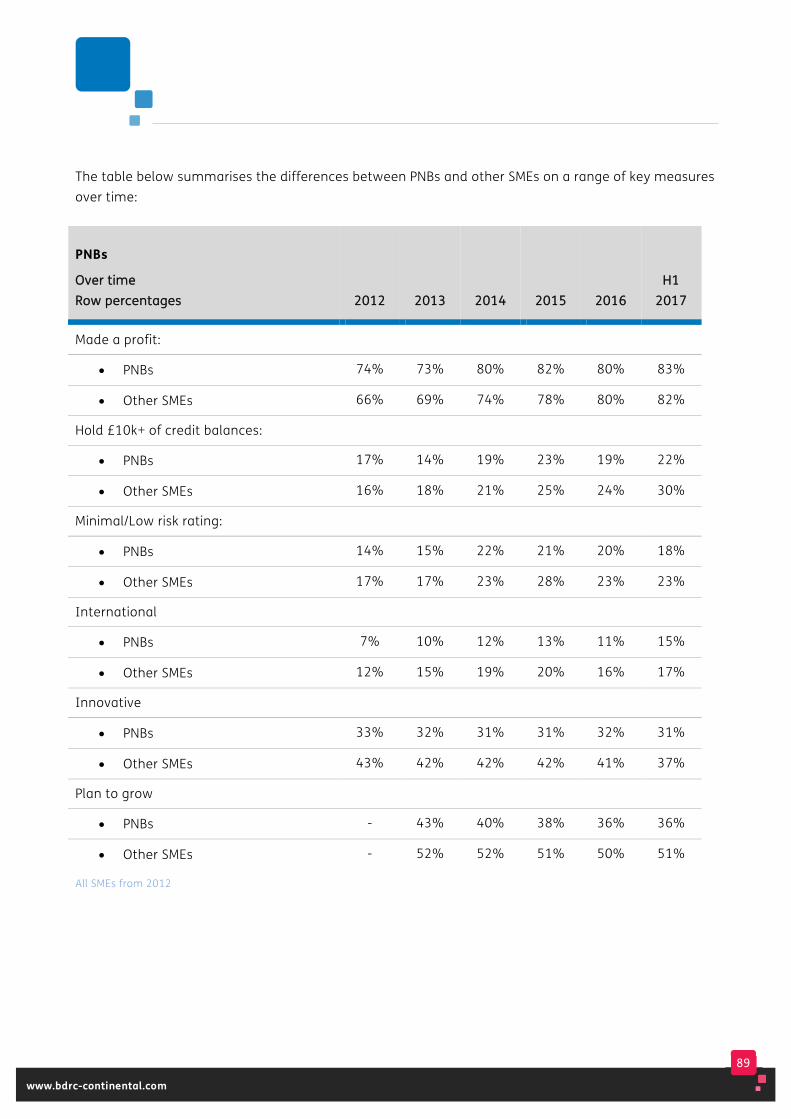
89
www.bdrc-continental.com
The table below summarises the differences between PNBs and other SMEs on a range of key measures over time:
PNBs
OOvveerr ttiimmee RRooww ppeerrcceennttaaggeess 22001122 22001133 22001144 22001155
22001166
HH11 22001177
Made a profit:
• PNBs 74% 73% 80% 82% 80% 83%
• Other SMEs 66% 69% 74% 78% 80% 82%
Hold £10k+ of credit balances:
• PNBs 17% 14% 19% 23% 19% 22%
• Other SMEs 16% 18% 21% 25% 24% 30%
Minimal/Low risk rating:
• PNBs 14% 15% 22% 21% 20% 18%
• Other SMEs 17% 17% 23% 28% 23% 23%
International
• PNBs 7% 10% 12% 13% 11% 15%
• Other SMEs 12% 15% 19% 20% 16% 17%
Innovative
• PNBs 33% 32% 31% 31% 32% 31%
• Other SMEs 43% 42% 42% 42% 41% 37%
Plan to grow
• PNBs - 43% 40% 38% 36% 36%
• Other SMEs - 52% 52% 51% 50% 51%
All SMEs from 2012
90
www.bdrc-continental.com
As the table above shows, there are some instances where differences between PNBs and non-PNBs have narrowed over time and others where they have widened:
• In 2012, PNBs were more likely than non PNBs to have been profitable (74% v 66%). Over time, profitability has improved for both groups, but to a greater degree for the non-PNBs and so the ‘gap’ is now closed (83% v 82% in H1 2017).
• There is now less to choose between the two groups in terms of being international. In 2012, 7% of PNBs were international compared to 12% of non-PNBs. By H1 2017 the proportion of PNBs that were international had doubled (to 15%), while for non-PNBs the proportion had initially increased to 20% but then reduced slightly to 17% for H1 2017.
• PNBs have always been less likely to be innovative and this proportion has been stable over time (33% in 2012 to 31% in H1 2017). Amongst non-PNBs, the proportion that have innovated was stable 2012 to 2016 (41-43%) but somewhat lower in H1 2017 (37%), narrowing the gap to PNBs.
• In 2012, PNBs were as likely to be holding £10,000 or more in credit balances as non-PNBs(17% v 16%). Since then, the proportion of non-PNBs holding this sum has increased more rapidly (to 30% for H1 2017) compared to PNBs (to 22% for H1 2017), widening the gap between them.
• Growth plans amongst the non-PNBs have been very stable over time, with half planning to grow. Amongst PNBs on the other hand, the proportion planning to grow has declined from 43% to 36%, widening the gap between them and the non-PNBs.
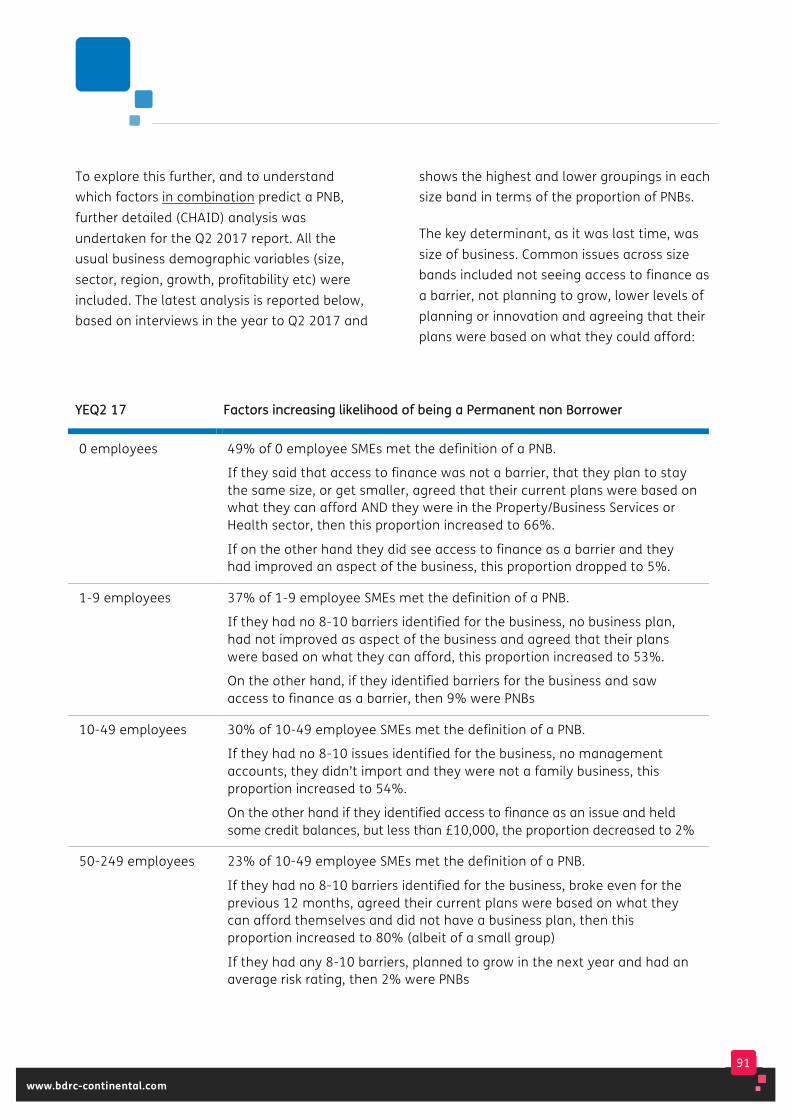
91
www.bdrc-continental.com
To explore this further, and to understand which factors in combination predict a PNB, further detailed (CHAID) analysis was undertaken for the Q2 2017 report. All the usual business demographic variables (size, sector, region, growth, profitability etc) were included. The latest analysis is reported below, based on interviews in the year to Q2 2017 and
shows the highest and lower groupings in each size band in terms of the proportion of PNBs.
The key determinant, as it was last time, was size of business. Common issues across size bands included not seeing access to finance as a barrier, not planning to grow, lower levels of planning or innovation and agreeing that their plans were based on what they could afford:
YYEEQQ22 1177 FFaaccttoorrss iinnccrreeaassiinngg lliikkeelliihhoooodd ooff bbeeiinngg aa PPeerrmmaanneenntt nnoonn BBoorrrroowweerr
0 employees 49% of 0 employee SMEs met the definition of a PNB.
If they said that access to finance was not a barrier, that they plan to stay the same size, or get smaller, agreed that their current plans were based on what they can afford AND they were in the Property/Business Services or Health sector, then this proportion increased to 66%.
If on the other hand they did see access to finance as a barrier and they had improved an aspect of the business, this proportion dropped to 5%.
1-9 employees 37% of 1-9 employee SMEs met the definition of a PNB.
If they had no 8-10 barriers identified for the business, no business plan, had not improved as aspect of the business and agreed that their plans were based on what they can afford, this proportion increased to 53%.
On the other hand, if they identified barriers for the business and saw access to finance as a barrier, then 9% were PNBs
10-49 employees 30% of 10-49 employee SMEs met the definition of a PNB.
If they had no 8-10 issues identified for the business, no management accounts, they didn’t import and they were not a family business, this proportion increased to 54%.
On the other hand if they identified access to finance as an issue and held some credit balances, but less than £10,000, the proportion decreased to 2%
50-249 employees 23% of 10-49 employee SMEs met the definition of a PNB.
If they had no 8-10 barriers identified for the business, broke even for the previous 12 months, agreed their current plans were based on what they can afford themselves and did not have a business plan, then this proportion increased to 80% (albeit of a small group)
If they had any 8-10 barriers, planned to grow in the next year and had an average risk rating, then 2% were PNBs

92
www.bdrc-continental.com
PNBs by their very definition are not currently using external finance. Adding use of trade credit and injections of personal funds results in 40% of PNBs using any ‘business funding’. If those who had injected personal funds and/or used trade credit were to be excluded from the PNB definition, the proportion of PNBs would reduce from 46% to 28% of all SMEs.
These PNBs have indicated that they are unlikely to be interested in borrowing, based on their current views. At various stages in this report, therefore, we have provided an alternative to the ‘All SME’ figure, which excludes these Permanent non-borrowers and provided an alternative figure that might be described as ‘All SMEs with a potential interest in external finance’.
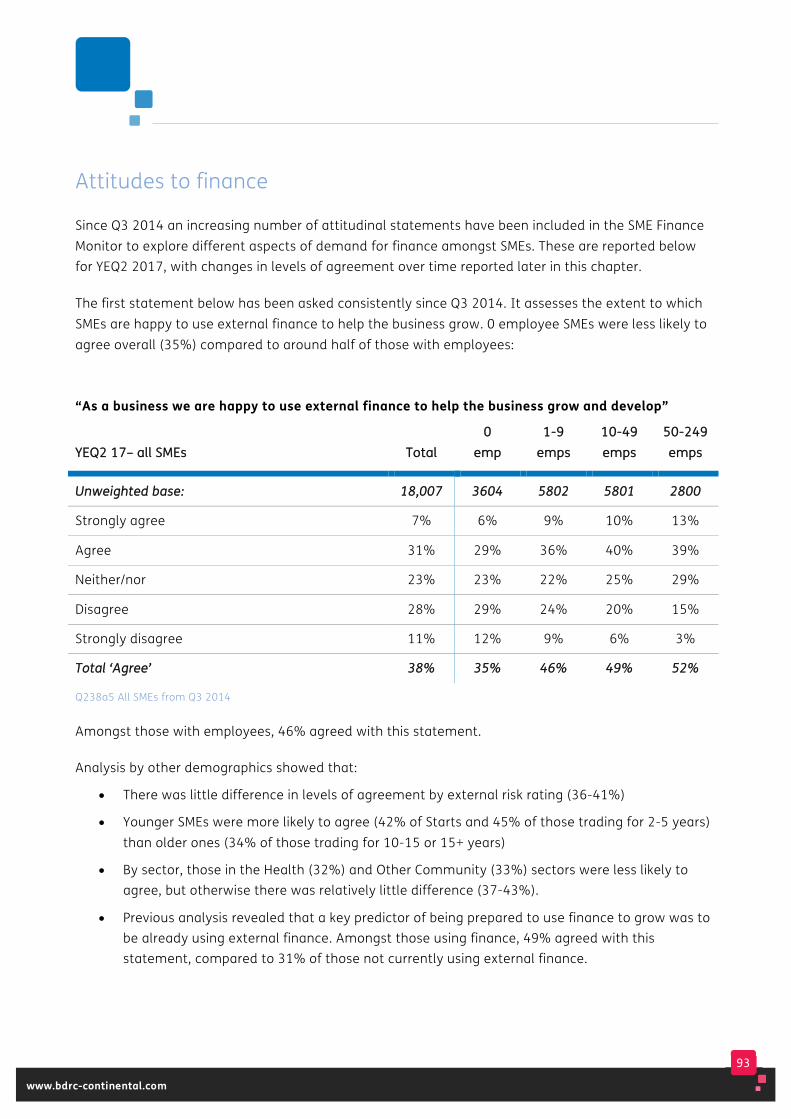
93
www.bdrc-continental.com
Attitudes to finance Since Q3 2014 an increasing number of attitudinal statements have been included in the SME Finance Monitor to explore different aspects of demand for finance amongst SMEs. These are reported below for YEQ2 2017, with changes in levels of agreement over time reported later in this chapter.
The first statement below has been asked consistently since Q3 2014. It assesses the extent to which SMEs are happy to use external finance to help the business grow. 0 employee SMEs were less likely to agree overall (35%) compared to around half of those with employees:
“As a business we are happy to use external finance to help the business grow and develop”
YYEEQQ22 1177–– aallll SSMMEEss TToottaall 00
eemmpp 11--99
eemmppss 1100--4499 eemmppss
5500--224499 eemmppss
UUnnwweeiigghhtteedd bbaassee:: 1188,,000077 33660044 55880022 55880011 22880000
Strongly agree 7% 6% 9% 10% 13%
Agree 31% 29% 36% 40% 39%
Neither/nor 23% 23% 22% 25% 29%
Disagree 28% 29% 24% 20% 15%
Strongly disagree 11% 12% 9% 6% 3%
TToottaall ‘‘AAggrreeee’’ 3388%% 3355%% 4466%% 4499%% 5522%%
Q238a5 All SMEs from Q3 2014
Amongst those with employees, 46% agreed with this statement.
Analysis by other demographics showed that:
• There was little difference in levels of agreement by external risk rating (36-41%)
• Younger SMEs were more likely to agree (42% of Starts and 45% of those trading for 2-5 years) than older ones (34% of those trading for 10-15 or 15+ years)
• By sector, those in the Health (32%) and Other Community (33%) sectors were less likely to agree, but otherwise there was relatively little difference (37-43%).
• Previous analysis revealed that a key predictor of being prepared to use finance to grow was to be already using external finance. Amongst those using finance, 49% agreed with this statement, compared to 31% of those not currently using external finance.

94
www.bdrc-continental.com
Those planning to grow were more likely to agree with this statement (45%) than those not planning to grow (32%).
To understand this willingness to use external finance in more detail, additional analysis has been undertaken on this question.
The table below allocates all SMEs to one of four categories, depending on whether they are currently using external finance and whether they agreed that they would be willing to use external finance in the future to help the business develop and grow:
Combined analysis: Use of external finance and willingness to use in future
YYEEQQ22 1177 –– aallll SSMMEEss TToottaall 00
eemmpp 11--99
eemmppss 1100--4499 eemmppss
5500--224499 eemmppss
UUnnwweeiigghhtteedd bbaassee:: 1188,,000077 33660044 55880022 55880011 22880000
Use external finance and willing to use in future 19% 16% 27% 35% 39%
Use external finance but not willing to use in future 20% 19% 21% 26% 28%
Do not use it but willing to 19% 19% 19% 15% 13%
Do not use it and not willing to 42% 45% 34% 26% 21%
Q15/Q238a5 All SMEs
The analysis shows that:
• 1 in 5 SMEs (19%) were using external finance and agreed that they would be willing to use it in future, increasing by size of SME to 39% of those with 50-249 employees.
• The remaining users of finance (20% of all SMEs) would not be willing to use finance in future (the equivalent of 51% of all users of finance).
• A further fifth of all SMEs (19%) were not using external finance but agreed that they would be willing to use it to help the business develop and grow. This proportion declined slightly by size of SME to 13% of those with 50-249 employees.
• The remainder, 4 in 10 SMEs (42%), were non-users of finance who would not be willing to use it in future and this was more common amongst 0 employee SMEs (45% compared to 21% of those with 50-249 employees). 8 in 10 of this group (79%) met the definition of a PNB.
The other attitudinal statement introduced in Q3 2014 sought to understand the extent to which SMEs agreed that “their aim was to pay down debt and then remain debt free if possible”. In 2016, 7 in 10 SMEs (68%) agreed with this statement, with little variation by size, and this question has been rested in 2017.
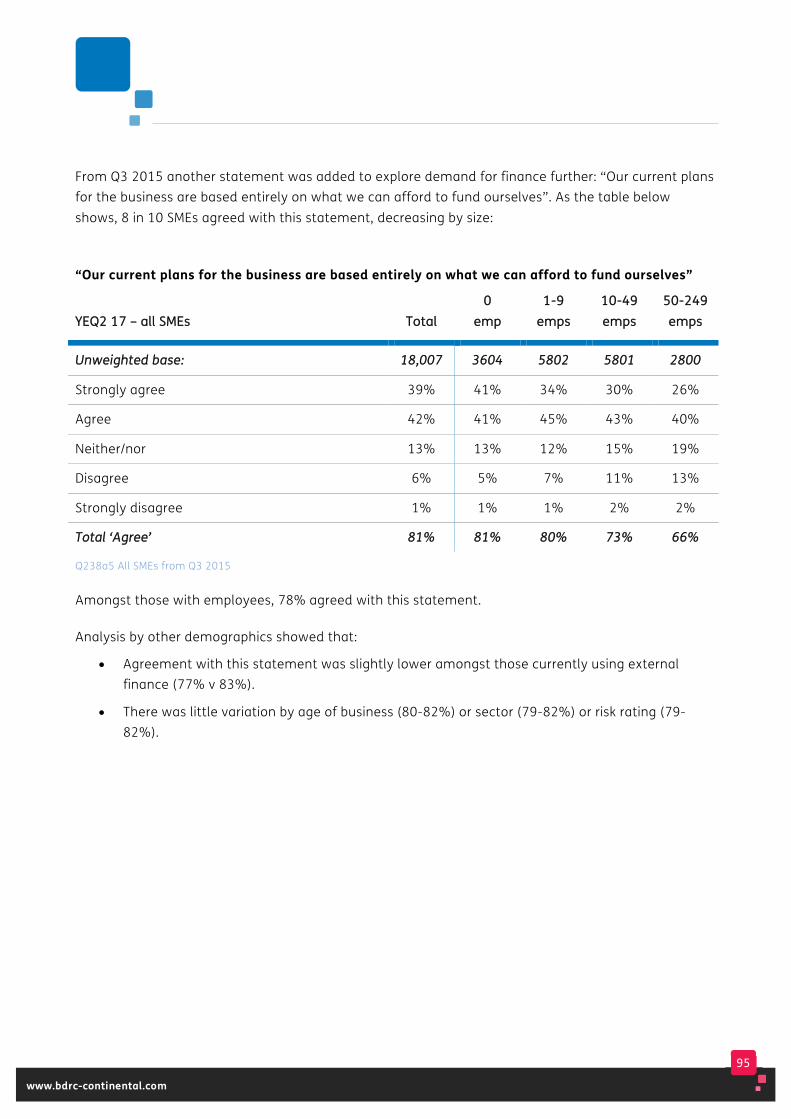
95
www.bdrc-continental.com
From Q3 2015 another statement was added to explore demand for finance further: “Our current plans for the business are based entirely on what we can afford to fund ourselves”. As the table below shows, 8 in 10 SMEs agreed with this statement, decreasing by size:
“Our current plans for the business are based entirely on what we can afford to fund ourselves”
YYEEQQ22 1177 –– aallll SSMMEEss TToottaall 00
eemmpp 11--99
eemmppss 1100--4499 eemmppss
5500--224499 eemmppss
UUnnwweeiigghhtteedd bbaassee:: 1188,,000077 33660044 55880022 55880011 22880000
Strongly agree 39% 41% 34% 30% 26%
Agree 42% 41% 45% 43% 40%
Neither/nor 13% 13% 12% 15% 19%
Disagree 6% 5% 7% 11% 13%
Strongly disagree 1% 1% 1% 2% 2%
TToottaall ‘‘AAggrreeee’’ 8811%% 8811%% 8800%% 7733%% 6666%%
Q238a5 All SMEs from Q3 2015
Amongst those with employees, 78% agreed with this statement.
Analysis by other demographics showed that:
• Agreement with this statement was slightly lower amongst those currently using external finance (77% v 83%).
• There was little variation by age of business (80-82%) or sector (79-82%) or risk rating (79-82%).
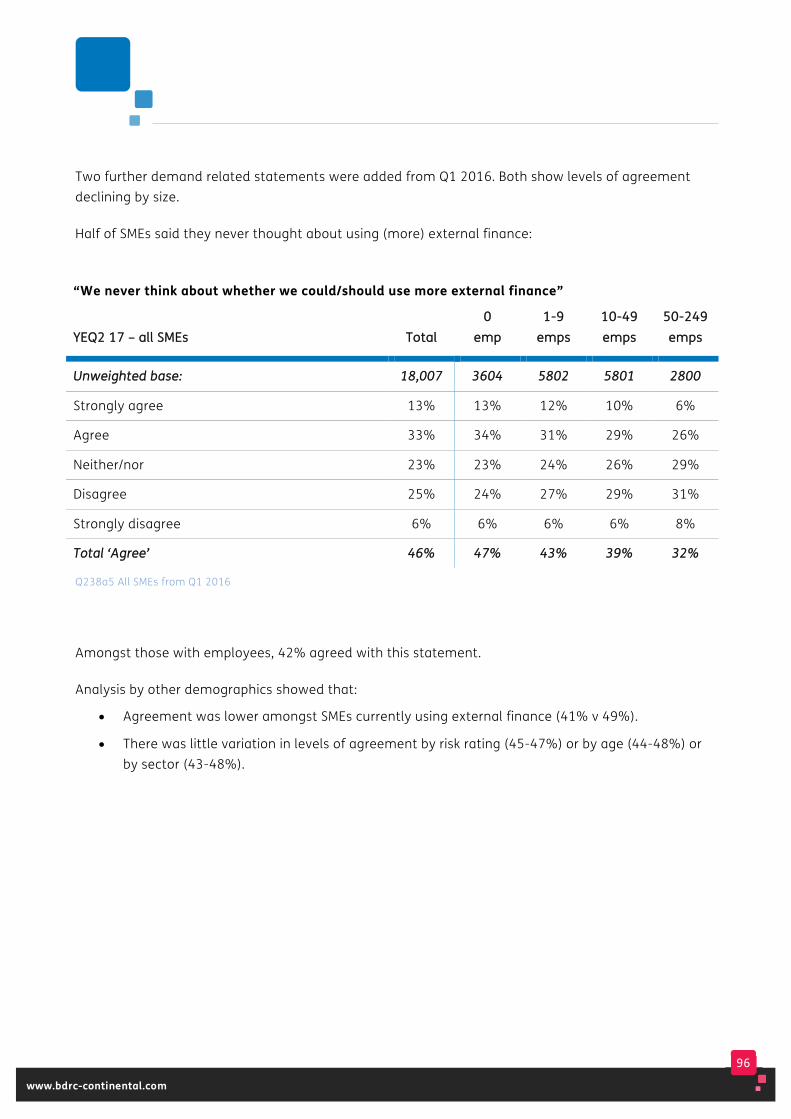
96
www.bdrc-continental.com
Two further demand related statements were added from Q1 2016. Both show levels of agreement declining by size.
Half of SMEs said they never thought about using (more) external finance:
“We never think about whether we could/should use more external finance”
YYEEQQ22 1177 –– aallll SSMMEEss TToottaall 00
eemmpp 11--99
eemmppss 1100--4499 eemmppss
5500--224499 eemmppss
UUnnwweeiigghhtteedd bbaassee:: 1188,,000077 33660044 55880022 55880011 22880000
Strongly agree 13% 13% 12% 10% 6%
Agree 33% 34% 31% 29% 26%
Neither/nor 23% 23% 24% 26% 29%
Disagree 25% 24% 27% 29% 31%
Strongly disagree 6% 6% 6% 6% 8%
TToottaall ‘‘AAggrreeee’’ 4466%% 4477%% 4433%% 3399%% 3322%%
Q238a5 All SMEs from Q1 2016
Amongst those with employees, 42% agreed with this statement.
Analysis by other demographics showed that:
• Agreement was lower amongst SMEs currently using external finance (41% v 49%).
• There was little variation in levels of agreement by risk rating (45-47%) or by age (44-48%) or by sector (43-48%).
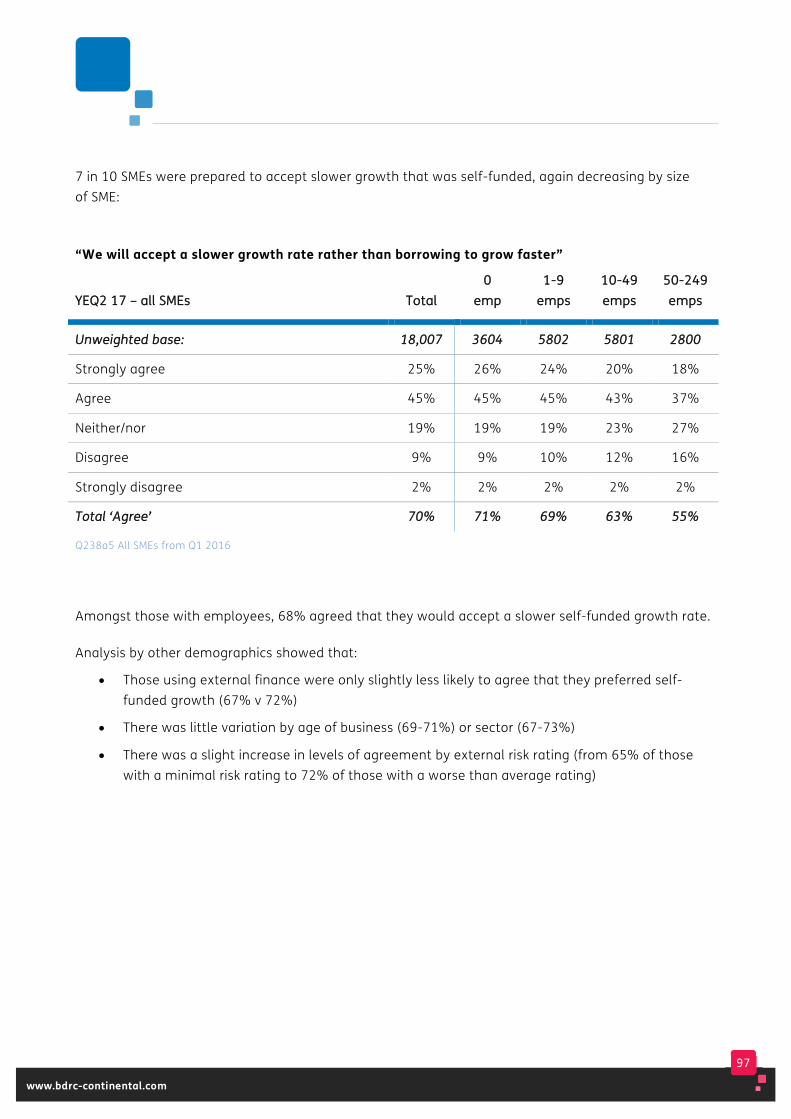
97
www.bdrc-continental.com
7 in 10 SMEs were prepared to accept slower growth that was self-funded, again decreasing by size of SME:
“We will accept a slower growth rate rather than borrowing to grow faster”
YYEEQQ22 1177 –– aallll SSMMEEss TToottaall 00
eemmpp 11--99
eemmppss 1100--4499 eemmppss
5500--224499 eemmppss
UUnnwweeiigghhtteedd bbaassee:: 1188,,000077 33660044 55880022 55880011 22880000
Strongly agree 25% 26% 24% 20% 18%
Agree 45% 45% 45% 43% 37%
Neither/nor 19% 19% 19% 23% 27%
Disagree 9% 9% 10% 12% 16%
Strongly disagree 2% 2% 2% 2% 2%
TToottaall ‘‘AAggrreeee’’ 7700%% 7711%% 6699%% 6633%% 5555%%
Q238a5 All SMEs from Q1 2016
Amongst those with employees, 68% agreed that they would accept a slower self-funded growth rate.
Analysis by other demographics showed that:
• Those using external finance were only slightly less likely to agree that they preferred self-funded growth (67% v 72%)
• There was little variation by age of business (69-71%) or sector (67-73%)
• There was a slight increase in levels of agreement by external risk rating (from 65% of those with a minimal risk rating to 72% of those with a worse than average rating)
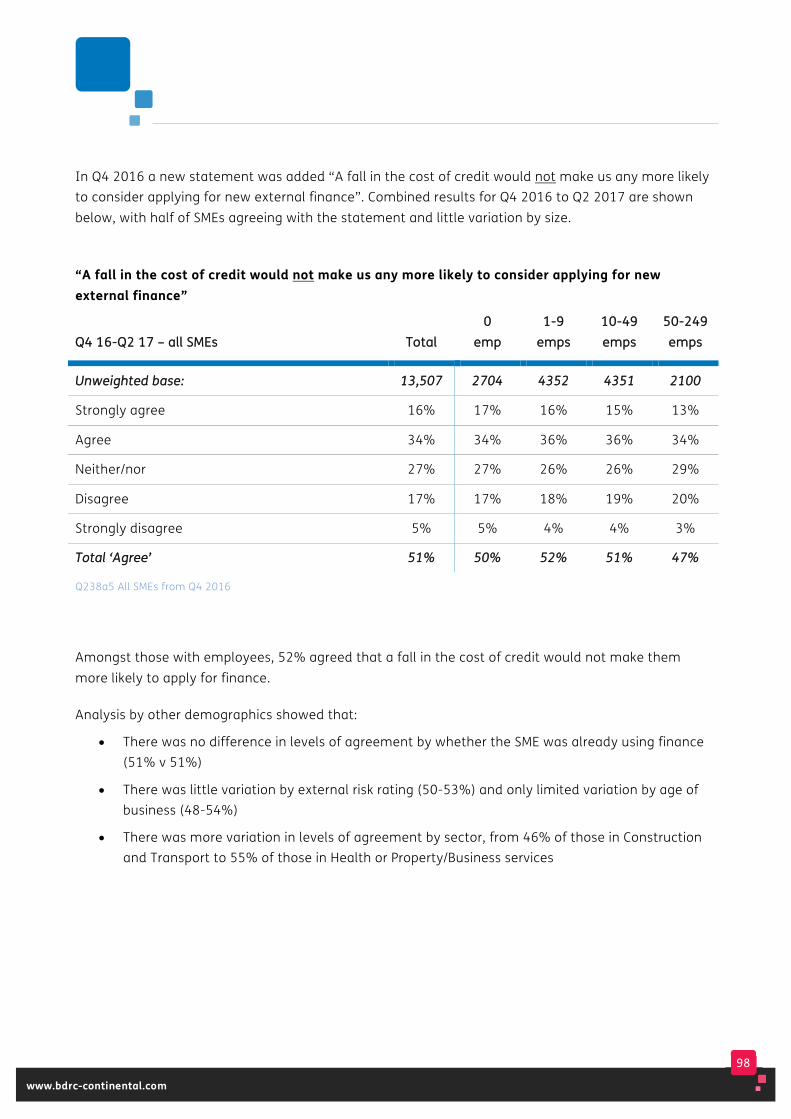
98
www.bdrc-continental.com
In Q4 2016 a new statement was added “A fall in the cost of credit would not make us any more likely to consider applying for new external finance”. Combined results for Q4 2016 to Q2 2017 are shown below, with half of SMEs agreeing with the statement and little variation by size.
“A fall in the cost of credit would not make us any more likely to consider applying for new external finance”
QQ44 1166--QQ22 1177 –– aallll SSMMEEss TToottaall 00
eemmpp 11--99
eemmppss 1100--4499 eemmppss
5500--224499 eemmppss
UUnnwweeiigghhtteedd bbaassee:: 1133,,550077 22770044 44335522 44335511 22110000
Strongly agree 16% 17% 16% 15% 13%
Agree 34% 34% 36% 36% 34%
Neither/nor 27% 27% 26% 26% 29%
Disagree 17% 17% 18% 19% 20%
Strongly disagree 5% 5% 4% 4% 3%
TToottaall ‘‘AAggrreeee’’ 5511%% 5500%% 5522%% 5511%% 4477%%
Q238a5 All SMEs from Q4 2016
Amongst those with employees, 52% agreed that a fall in the cost of credit would not make them more likely to apply for finance.
Analysis by other demographics showed that:
• There was no difference in levels of agreement by whether the SME was already using finance (51% v 51%)
• There was little variation by external risk rating (50-53%) and only limited variation by age of business (48-54%)
• There was more variation in levels of agreement by sector, from 46% of those in Construction and Transport to 55% of those in Health or Property/Business services
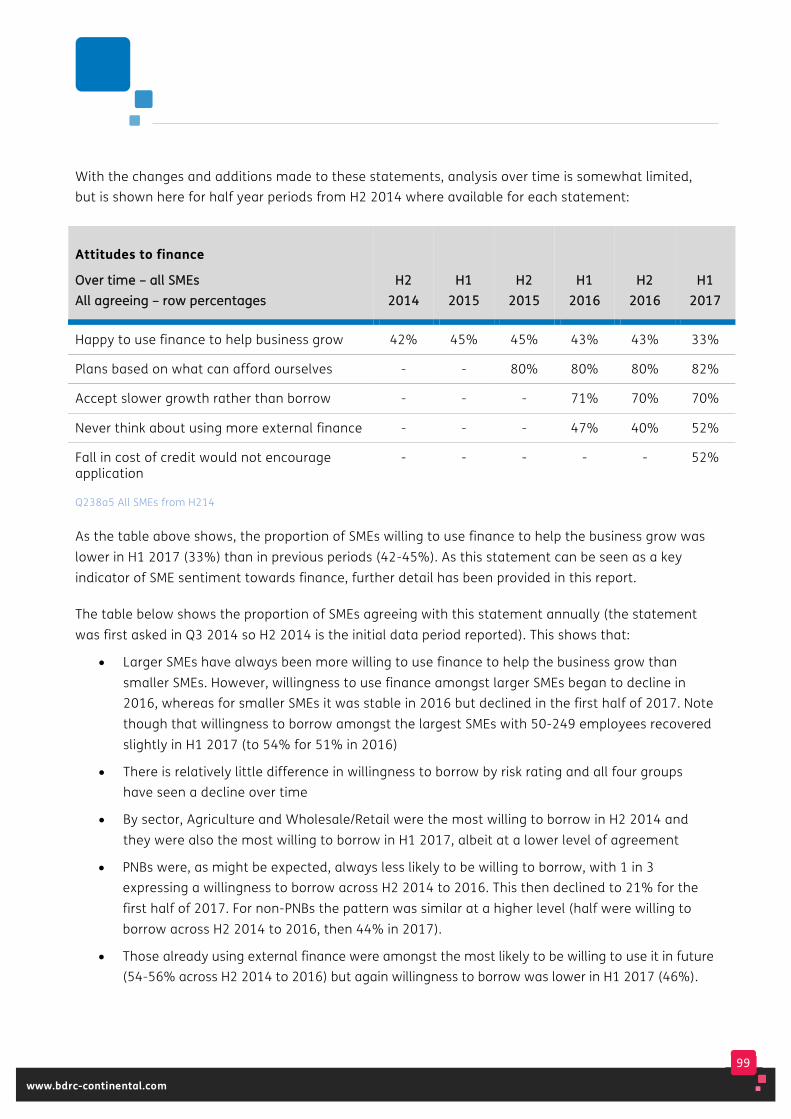
99
www.bdrc-continental.com
With the changes and additions made to these statements, analysis over time is somewhat limited, but is shown here for half year periods from H2 2014 where available for each statement:
Attitudes to finance
OOvveerr ttiimmee –– aallll SSMMEEss AAllll aaggrreeeeiinngg –– rrooww ppeerrcceennttaaggeess
HH22 22001144
HH11 22001155
HH22 22001155
HH11 22001166
HH22 22001166
HH11 22001177
Happy to use finance to help business grow 42% 45% 45% 43% 43% 33%
Plans based on what can afford ourselves - - 80% 80% 80% 82%
Accept slower growth rather than borrow - - - 71% 70% 70%
Never think about using more external finance - - - 47% 40% 52%
Fall in cost of credit would not encourage application
- - - - - 52%
Q238a5 All SMEs from H214
As the table above shows, the proportion of SMEs willing to use finance to help the business grow was lower in H1 2017 (33%) than in previous periods (42-45%). As this statement can be seen as a key indicator of SME sentiment towards finance, further detail has been provided in this report.
The table below shows the proportion of SMEs agreeing with this statement annually (the statement was first asked in Q3 2014 so H2 2014 is the initial data period reported). This shows that:
• Larger SMEs have always been more willing to use finance to help the business grow than smaller SMEs. However, willingness to use finance amongst larger SMEs began to decline in 2016, whereas for smaller SMEs it was stable in 2016 but declined in the first half of 2017. Note though that willingness to borrow amongst the largest SMEs with 50-249 employees recovered slightly in H1 2017 (to 54% for 51% in 2016)
• There is relatively little difference in willingness to borrow by risk rating and all four groups have seen a decline over time
• By sector, Agriculture and Wholesale/Retail were the most willing to borrow in H2 2014 and they were also the most willing to borrow in H1 2017, albeit at a lower level of agreement
• PNBs were, as might be expected, always less likely to be willing to borrow, with 1 in 3 expressing a willingness to borrow across H2 2014 to 2016. This then declined to 21% for the first half of 2017. For non-PNBs the pattern was similar at a higher level (half were willing to borrow across H2 2014 to 2016, then 44% in 2017).
• Those already using external finance were amongst the most likely to be willing to use it in future (54-56% across H2 2014 to 2016) but again willingness to borrow was lower in H1 2017 (46%).
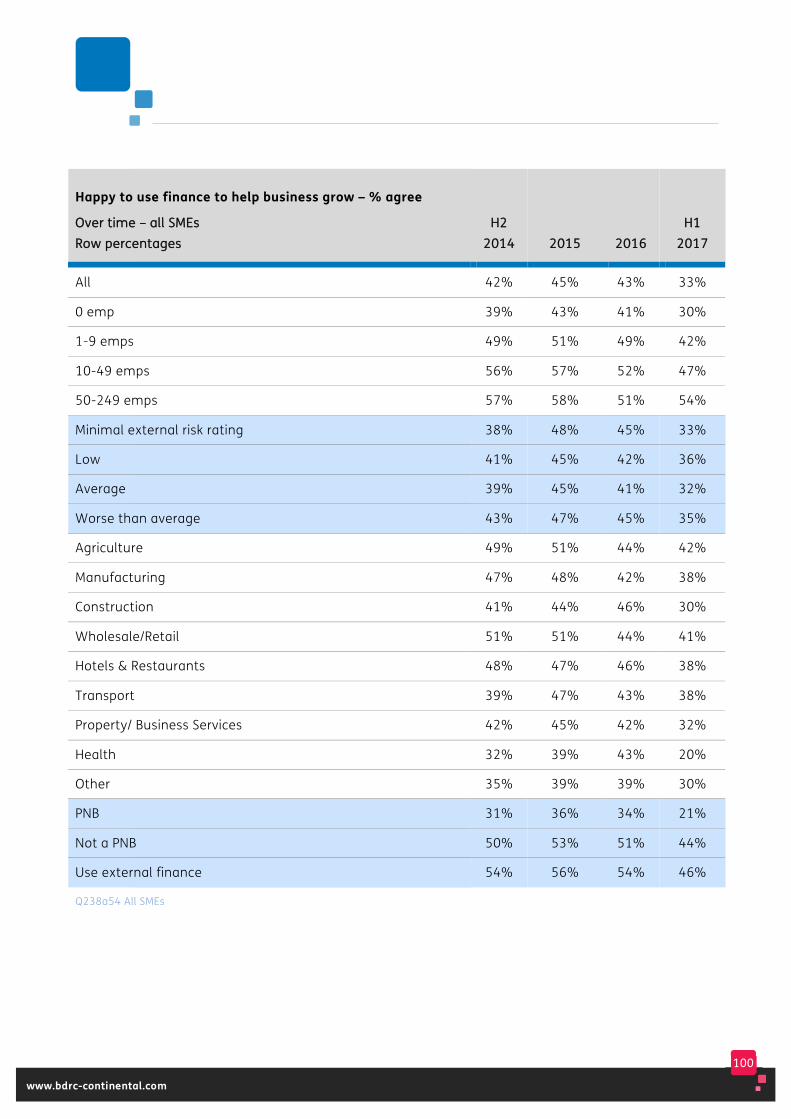
100
www.bdrc-continental.com
Happy to use finance to help business grow – % agree
OOvveerr ttiimmee –– aallll SSMMEEss RRooww ppeerrcceennttaaggeess
HH22 22001144 22001155
22001166
HH11 22001177
All 42% 45% 43% 33%
0 emp 39% 43% 41% 30%
1-9 emps 49% 51% 49% 42%
10-49 emps 56% 57% 52% 47%
50-249 emps 57% 58% 51% 54%
Minimal external risk rating 38% 48% 45% 33%
Low 41% 45% 42% 36%
Average 39% 45% 41% 32%
Worse than average 43% 47% 45% 35%
Agriculture 49% 51% 44% 42%
Manufacturing 47% 48% 42% 38%
Construction 41% 44% 46% 30%
Wholesale/Retail 51% 51% 44% 41%
Hotels & Restaurants 48% 47% 46% 38%
Transport 39% 47% 43% 38%
Property/ Business Services 42% 45% 42% 32%
Health 32% 39% 43% 20%
Other 35% 39% 39% 30%
PNB 31% 36% 34% 21%
Not a PNB 50% 53% 51% 44%
Use external finance 54% 56% 54% 46%
Q238a54 All SMEs
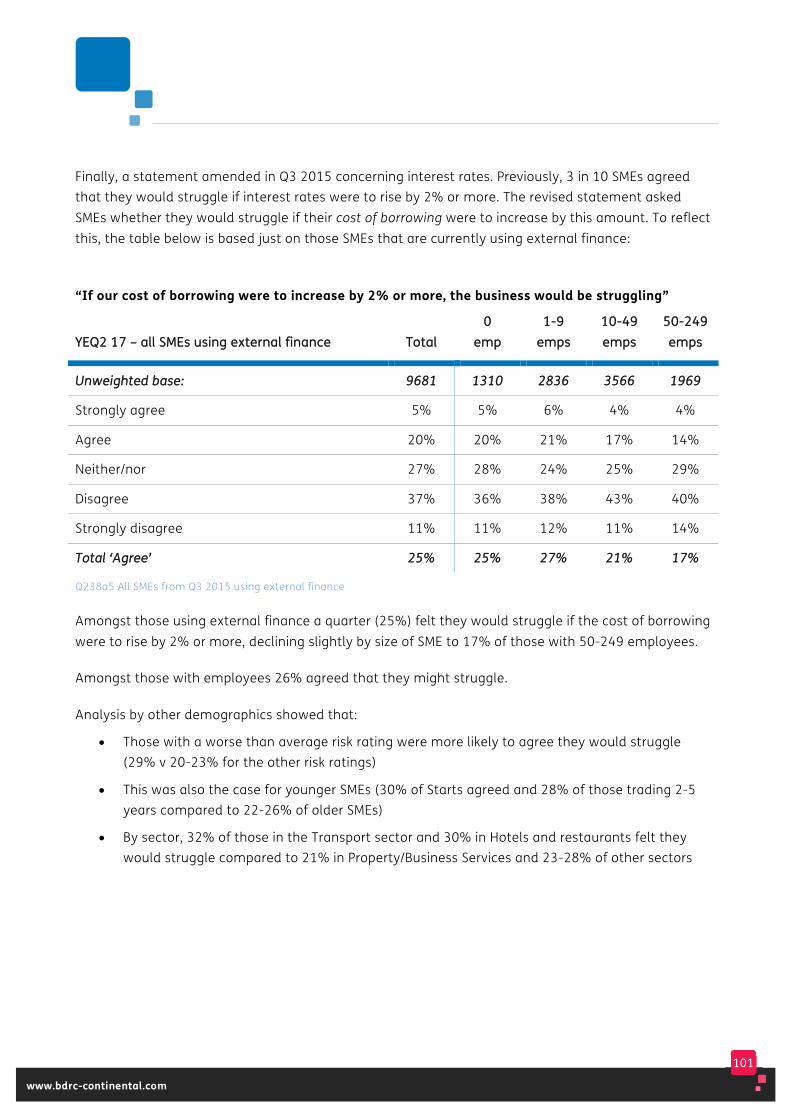
101
www.bdrc-continental.com
Finally, a statement amended in Q3 2015 concerning interest rates. Previously, 3 in 10 SMEs agreed that they would struggle if interest rates were to rise by 2% or more. The revised statement asked SMEs whether they would struggle if their cost of borrowing were to increase by this amount. To reflect this, the table below is based just on those SMEs that are currently using external finance:
“If our cost of borrowing were to increase by 2% or more, the business would be struggling”
YYEEQQ22 1177 –– aallll SSMMEEss uussiinngg eexxtteerrnnaall ffiinnaannccee TToottaall 00
eemmpp 11--99
eemmppss 1100--4499 eemmppss
5500--224499 eemmppss
UUnnwweeiigghhtteedd bbaassee:: 99668811 11331100 22883366 33556666 11996699
Strongly agree 5% 5% 6% 4% 4%
Agree 20% 20% 21% 17% 14%
Neither/nor 27% 28% 24% 25% 29%
Disagree 37% 36% 38% 43% 40%
Strongly disagree 11% 11% 12% 11% 14%
TToottaall ‘‘AAggrreeee’’ 2255%% 2255%% 2277%% 2211%% 1177%%
Q238a5 All SMEs from Q3 2015 using external finance
Amongst those using external finance a quarter (25%) felt they would struggle if the cost of borrowing were to rise by 2% or more, declining slightly by size of SME to 17% of those with 50-249 employees.
Amongst those with employees 26% agreed that they might struggle.
Analysis by other demographics showed that:
• Those with a worse than average risk rating were more likely to agree they would struggle (29% v 20-23% for the other risk ratings)
• This was also the case for younger SMEs (30% of Starts agreed and 28% of those trading 2-5 years compared to 22-26% of older SMEs)
• By sector, 32% of those in the Transport sector and 30% in Hotels and restaurants felt they would struggle compared to 21% in Property/Business Services and 23-28% of other sectors
102
www.bdrc-continental.com
A further statement looked at willingness to be referred to an alternative lender. When the question was last reported for YEQ4 2016, 4 in 10 SMEs (38%) agreed that “If our bank were unable to help us with the finance we needed, we would be happy for them to pass on our request to an alternative lender”, with
relatively little variation by size. This question was added ahead of the launch of the referral system and the new lending platforms. From Q1 2017 awareness and use of these new platforms has been monitored and so this question is no longer asked.
103
www.bdrc-continental.com
7. An initial summary of alloverdraft and loan events
This chapter provides the full definition of each borrowing event together with summary tables of their occurrence. Subsequent chapters then investigate these events in more detail, and over time. The chapter covers the individual waves of interviews conducted to date. In each wave, SMEs have been asked about borrowing events in the previous 1122 months, so overall, borrowing events may have occurred from Q2 2010 to Q2 2017. Where year-ending data is provided this is YEQ2 2017.
104
www.bdrc-continental.com
Key findings Demand for finance remained limited. In the first half of 2017, 4% of SMEs reported applying for a new or renewed loan or overdraft, increasing by size of business from 3% of those with 0 employees to 8% of those with 10-49 or 50-249 employees.
This maintained the steady decline seen over time. In 2012, 11% of SMEs had reported applying, while since Q3 2016 (immediately after the Brexit vote) a steady 4% of SMEs each quarter reported applying.
In the first half of 2017:
• 3% reported an overdraft event, down from 8% in 2012
• 1% reported a loan event, down from 4% in 2012
• Excluding the PNBs with no apparent appetite for finance increases the proportion of overdraft events to 6% in H1 2017 (down from 12% in 2012) and the proportion of loan events to 2% in H1 2017 (down from 6% in 2012).
1 in 10 SMEs (11%) reported applying for another form of finance, such as invoice finance or leasing, with larger SMEs more likely to do so (21% of those with 10-49 or 50-249 employees).
For YEQ2 2017, 8 in 10 SMEs (79%) reported neither a loan or overdraft event nor an application for any of the other forms of funding, up from 68% in 2012.
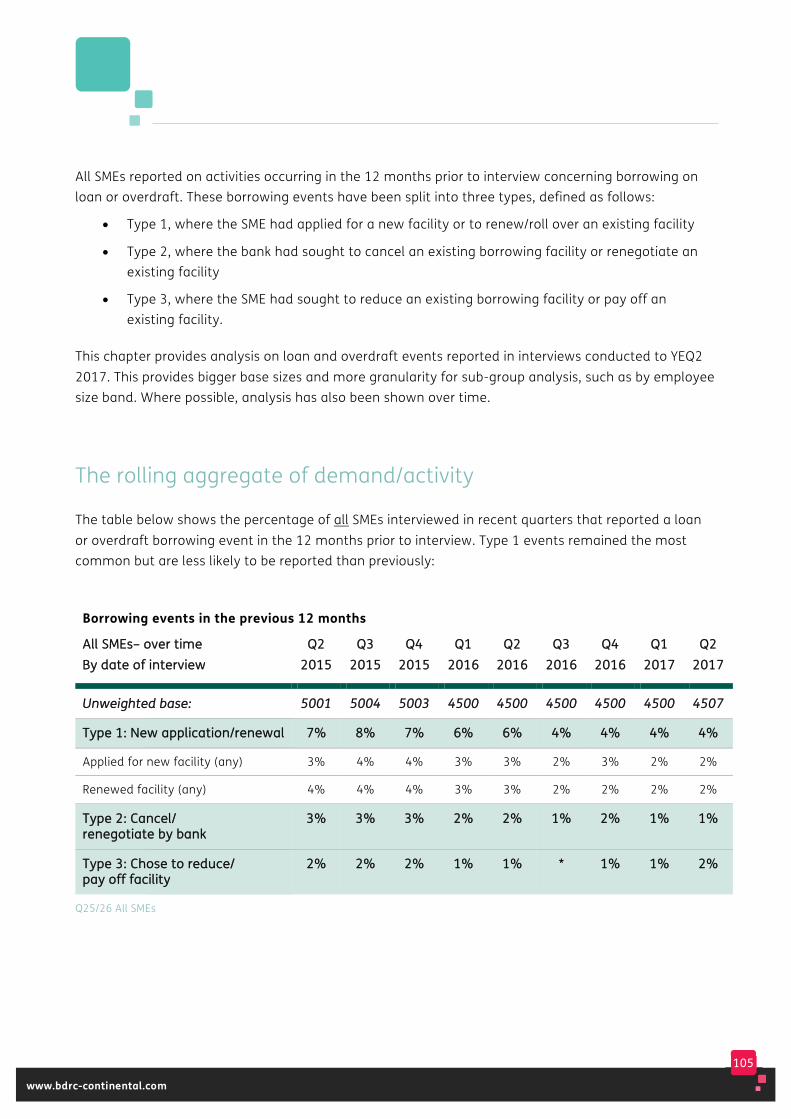
105
www.bdrc-continental.com
All SMEs reported on activities occurring in the 12 months prior to interview concerning borrowing on loan or overdraft. These borrowing events have been split into three types, defined as follows:
• Type 1, where the SME had applied for a new facility or to renew/roll over an existing facility
• Type 2, where the bank had sought to cancel an existing borrowing facility or renegotiate an existing facility
• Type 3, where the SME had sought to reduce an existing borrowing facility or pay off an existing facility.
This chapter provides analysis on loan and overdraft events reported in interviews conducted to YEQ2 2017. This provides bigger base sizes and more granularity for sub-group analysis, such as by employee size band. Where possible, analysis has also been shown over time.
The rolling aggregate of demand/activity
The table below shows the percentage of all SMEs interviewed in recent quarters that reported a loan or overdraft borrowing event in the 12 months prior to interview. Type 1 events remained the most common but are less likely to be reported than previously:
Borrowing events in the previous 12 months
AAllll SSMMEEss–– oovveerr ttiimmee BByy ddaattee ooff iinntteerrvviieeww
QQ22 22001155
QQ33 22001155
QQ44 22001155
QQ11 22001166
QQ22 22001166
QQ33 22001166
QQ44 22001166
QQ11 22001177
QQ22 22001177
UUnnwweeiigghhtteedd bbaassee:: 55000011 55000044 55000033 44550000 44550000 44550000 44550000 44550000 44550077
TTyyppee 11:: NNeeww aapppplliiccaattiioonn//rreenneewwaall 77%% 88%% 77%% 66%% 66%% 44%% 44%% 44%% 44%%
Applied for new facility (any) 3% 4% 4% 3% 3% 2% 3% 2% 2%
Renewed facility (any) 4% 4% 4% 3% 3% 2% 2% 2% 2%
TTyyppee 22:: CCaanncceell// rreenneeggoottiiaattee bbyy bbaannkk
33%% 33%% 33%% 22%% 22%% 11%% 22%% 11%% 11%%
TTyyppee 33:: CChhoossee ttoo rreedduuccee// ppaayy ooffff ffaacciilliittyy
22%% 22%% 22%% 11%% 11%% ** 11%% 11%% 22%%
Q25/26 All SMEs
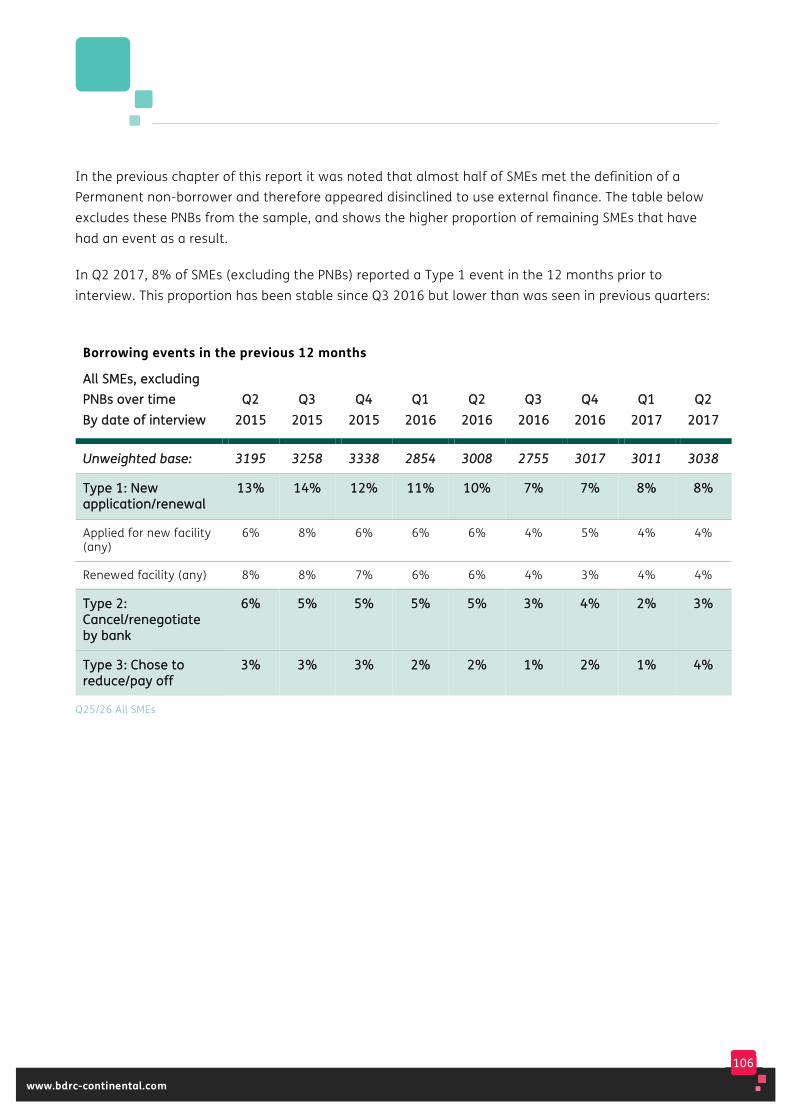
106
www.bdrc-continental.com
In the previous chapter of this report it was noted that almost half of SMEs met the definition of a Permanent non-borrower and therefore appeared disinclined to use external finance. The table below excludes these PNBs from the sample, and shows the higher proportion of remaining SMEs that have had an event as a result.
In Q2 2017, 8% of SMEs (excluding the PNBs) reported a Type 1 event in the 12 months prior to interview. This proportion has been stable since Q3 2016 but lower than was seen in previous quarters:
Borrowing events in the previous 12 months
AAllll SSMMEEss,, eexxcclluuddiinngg PPNNBBss oovveerr ttiimmee BByy ddaattee ooff iinntteerrvviieeww
QQ22 22001155
QQ33 22001155
QQ44 22001155
QQ11 22001166
QQ22 22001166
QQ33 22001166
QQ44 22001166
QQ11 22001177
QQ22 22001177
UUnnwweeiigghhtteedd bbaassee:: 33119955 33225588 33333388 22885544 33000088 22775555 33001177 33001111 33003388
TTyyppee 11:: NNeeww aapppplliiccaattiioonn//rreenneewwaall
1133%% 1144%% 1122%% 1111%% 1100%% 77%% 77%% 88%% 88%%
Applied for new facility (any)
6% 8% 6% 6% 6% 4% 5% 4% 4%
Renewed facility (any) 8% 8% 7% 6% 6% 4% 3% 4% 4%
TTyyppee 22:: CCaanncceell//rreenneeggoottiiaattee bbyy bbaannkk
66%% 55%% 55%% 55%% 55%% 33%% 44%% 22%% 33%%
TTyyppee 33:: CChhoossee ttoo rreedduuccee//ppaayy ooffff
33%% 33%% 33%% 22%% 22%% 11%% 22%% 11%% 44%%
Q25/26 All SMEs

107
www.bdrc-continental.com
Events in the 12 months prior to interview, by key demographics The remainder of this chapter looks in more detail at the types of SME that were more or less likely to report any of the loan or overdraft events specified. In order to provide robust sub-sample groups, these are reported below for YEQ2 2017, and, unless otherwise stated, are based on all SMEs.
The table below shows how SMEs with employees remained more likely to have experienced a Type 1 event:
Borrowing events in the previous 12 months
YYEEQQ22 1177 aallll SSMMEEss TToottaall 00
eemmpp 11--99
eemmppss 1100--4499 eemmppss
5500--224499 eemmppss
UUnnwweeiigghhtteedd bbaassee:: 1188,,000077 33660044 55880022 55880011 22880000
TTyyppee 11:: NNeeww aapppplliiccaattiioonn//rreenneewwaall 44%% 33%% 66%% 88%% 88%%
Applied for new facility (any) 2% 2% 3% 4% 3%
- applied for new loan 1% 1% 2% 2% 2%
- applied for new overdraft 2% 2% 2% 2% 1%
Renewed facility (any) 2% 1% 4% 5% 6%
- renewed existing loan 1% * 1% 2% 2%
- renewed existing overdraft 2% 1% 3% 4% 5%
TTyyppee 22:: CCaanncceell//rreenneeggoottiiaattee bbyy bbaannkk 22%% 11%% 22%% 33%% 44%%
Bank sought to renegotiate facility (any) 1% 1% 2% 2% 4%
- sought to renegotiate loan 1% * 1% 1% 2%
- sought to renegotiate overdraft 1% * 1% 1% 2%
Bank sought to cancel facility (any) 1% 1% 1% 1% 1%
- sought to cancel loan * * 1% 1% *
- sought to cancel overdraft * * 1% 1% *
TTyyppee 33:: CChhoossee ttoo rreedduuccee//ppaayy ooffff ffaacciilliittyy 11%% 11%% 22%% 22%% 22%%
- reduce/pay off loan 1% 1% 1% 1% 2%
- reduce/pay off overdraft * * 1% 1% 1%
Q25/26 All SMEs – does not include automatic renewal of overdraft facilities
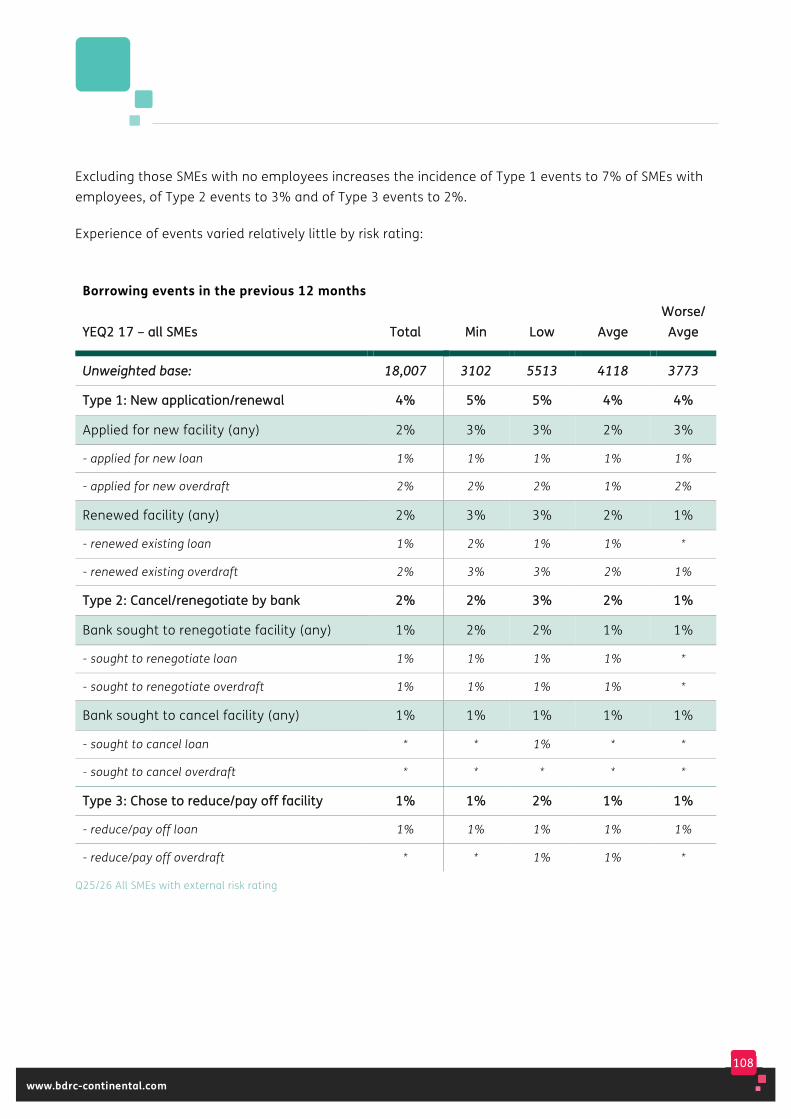
108
www.bdrc-continental.com
Excluding those SMEs with no employees increases the incidence of Type 1 events to 7% of SMEs with employees, of Type 2 events to 3% and of Type 3 events to 2%.
Experience of events varied relatively little by risk rating:
Borrowing events in the previous 12 months
YYEEQQ22 1177 –– aallll SSMMEEss TToottaall MMiinn LLooww AAvvggee WWoorrssee//
AAvvggee
UUnnwweeiigghhtteedd bbaassee:: 1188,,000077 33110022 55551133 44111188 33777733
TTyyppee 11:: NNeeww aapppplliiccaattiioonn//rreenneewwaall 44%% 55%% 55%% 44%% 44%%
Applied for new facility (any) 2% 3% 3% 2% 3%
- applied for new loan 1% 1% 1% 1% 1%
- applied for new overdraft 2% 2% 2% 1% 2%
Renewed facility (any) 2% 3% 3% 2% 1%
- renewed existing loan 1% 2% 1% 1% *
- renewed existing overdraft 2% 3% 3% 2% 1%
TTyyppee 22:: CCaanncceell//rreenneeggoottiiaattee bbyy bbaannkk 22%% 22%% 33%% 22%% 11%%
Bank sought to renegotiate facility (any) 1% 2% 2% 1% 1%
- sought to renegotiate loan 1% 1% 1% 1% *
- sought to renegotiate overdraft 1% 1% 1% 1% *
Bank sought to cancel facility (any) 1% 1% 1% 1% 1%
- sought to cancel loan * * 1% * *
- sought to cancel overdraft * * * * *
TTyyppee 33:: CChhoossee ttoo rreedduuccee//ppaayy ooffff ffaacciilliittyy 11%% 11%% 22%% 11%% 11%%
- reduce/pay off loan 1% 1% 1% 1% 1%
- reduce/pay off overdraft * * 1% 1% *
Q25/26 All SMEs with external risk rating

109
www.bdrc-continental.com
Those in Agriculture remained somewhat more likely to report a Type 1 event:
Borrowing events in last 12 months
YYEEQQ22 1177 –– aallll SSMMEESS AAggrriicc MMffgg CCoonnssttrr WWhhllee RReettaaiill
HHootteell RReesstt TTrraannss
PPrroopp// BBuuss
HHlltthh SSWWrrkk
OOtthheerr CCoommmm
UUnnwweeiigghhtteedd bbaassee:: 11220022 11550022 33220000 11880033 11220033 22000011 33559999 11449977 22000000
TTyyppee 11:: NNeeww aapppplliiccaattiioonn// rreenneewwaall
99%% 55%% 33%% 66%% 55%% 44%% 44%% 22%% 33%%
Applied for new facility (any)
5% 3% 2% 3% 3% 2% 3% 1% 2%
- applied for new loan 2% 1% 1% 2% 2% 1% 1% * 1%
- applied for new overdraft
3% 2% 1% 2% 1% 1% 2% 1% 1%
Renewed facility (any) 6% 2% 1% 3% 3% 2% 2% 2% 1%
- renewed existing loan 2% 1% * 1% 1% 1% * 1% *
- renewed existing overdraft
4% 2% 1% 3% 2% 1% 1% 1% 1%
TTyyppee 22:: CCaanncceell// rreenneeggoottiiaattee bbyy bbaannkk
44%% 22%% 11%% 11%% 33%% 11%% 11%% 22%% 22%%
Bank sought to renegotiate facility (any)
2% 2% 1% 1% 2% 1% * 1% 2%
- sought to renegotiate loan
1% 1% * * 1% 1% * 1% 1%
- sought to renegotiate overdraft
2% 1% * 1% 1% * * 1% 1%
Bank sought to cancel facility (any)
2% 1% 1% 1% 2% 1% * 1% 1%
- sought to cancel loan 1% * * * 1% 1% * * 1%
- sought to cancel overdraft
1% 1% * * 1% * * * *
TTyyppee 33:: CChhoossee ttoo rreedduuccee// ppaayy ooffff ffaacciilliittyy
11%% 11%% 11%% 11%% 11%% 22%% 11%% 11%% **
- reduce/pay off loan 1% 1% 1% 1% 1% 1% 1% * *
- reduce/pay off overdraft * * * 1% 1% 1% * 1% *
Q25/26 All SMEs
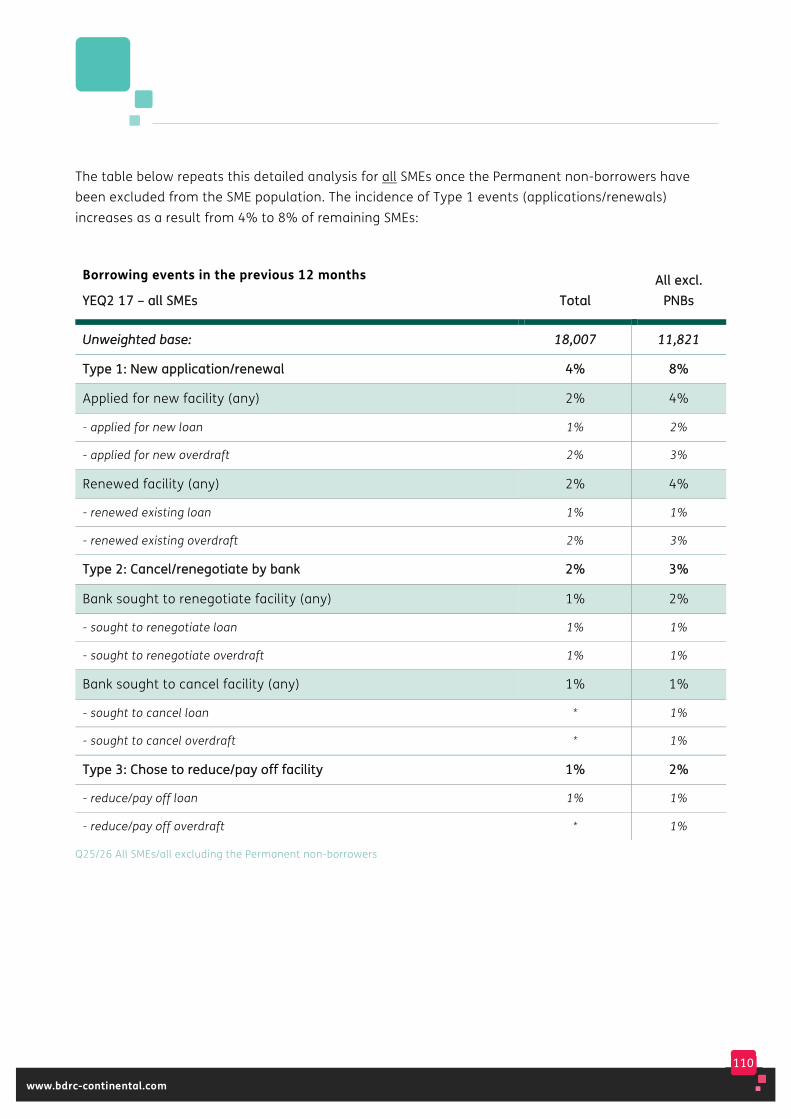
110
www.bdrc-continental.com
The table below repeats this detailed analysis for all SMEs once the Permanent non-borrowers have been excluded from the SME population. The incidence of Type 1 events (applications/renewals) increases as a result from 4% to 8% of remaining SMEs:
Borrowing events in the previous 12 months
YYEEQQ22 1177 –– aallll SSMMEEss TToottaall AAllll eexxccll..
PPNNBBss
UUnnwweeiigghhtteedd bbaassee:: 1188,,000077 1111,,882211
TTyyppee 11:: NNeeww aapppplliiccaattiioonn//rreenneewwaall 44%% 88%%
Applied for new facility (any) 2% 4%
- applied for new loan 1% 2%
- applied for new overdraft 2% 3%
Renewed facility (any) 2% 4%
- renewed existing loan 1% 1%
- renewed existing overdraft 2% 3%
TTyyppee 22:: CCaanncceell//rreenneeggoottiiaattee bbyy bbaannkk 22%% 33%%
Bank sought to renegotiate facility (any) 1% 2%
- sought to renegotiate loan 1% 1%
- sought to renegotiate overdraft 1% 1%
Bank sought to cancel facility (any) 1% 1%
- sought to cancel loan * 1%
- sought to cancel overdraft * 1%
TTyyppee 33:: CChhoossee ttoo rreedduuccee//ppaayy ooffff ffaacciilliittyy 11%% 22%%
- reduce/pay off loan 1% 1%
- reduce/pay off overdraft * 1%
Q25/26 All SMEs/all excluding the Permanent non-borrowers
111
www.bdrc-continental.com
Other business demographics showed limited variation in incidence of a Type 1 event YEQ2 2017:
Demographic IInncciiddeennccee ooff TTyyppee 11 eevveennttss rreeppoorrtteedd YYEEQQ22 22001177
Age of business The incidence of Type 1 events continued to vary only slightly by age of business (3-5%).
Profitable SMEs Those who had made a loss remained somewhat more likely to report a borrowing event (7%), compared to those who had made a profit (4%) or broken even (3%).
Growth Those who had either grown by 20% or more, or declined in size, in the past year were slightly more likely to have had a Type 1 event:
Grown 20%+ 7%
Grown by less than this 5%
Stayed the same size 3%
Declined 6%.
Importers/exporters Those engaged in international trade were only slightly more likely to have had an event (6%) than those who were not (4%).
The next analysis focuses specifically on Type 1 events and on the SMEs more or less likely to report such an event over time.
The first table below shows the proportion reporting a Type 1 event over recent quarters, overall and by key demographics. This shows a gradual decline in application levels overall across 2016, stabilising in 2017 to date. Amongst larger SMEs, the proportion applying in 2017 showed an increase back to levels seen at the start of 2016.
The subsequent table takes the longer term annual view from 2012. This shows that Type 1 borrowing events (a new or renewed loan or overdraft facility) have halved from 11% of all SMEs in 2012 to 4% in H1 2017, across all size and risk rating bands and once the PNBs are excluded. Most recently, this has been due to the steady decline in applications from 0 employee SMEs (9% to 3%). Amongst those with employees the proportion applying in H1 2017 is no lower than in 2016.
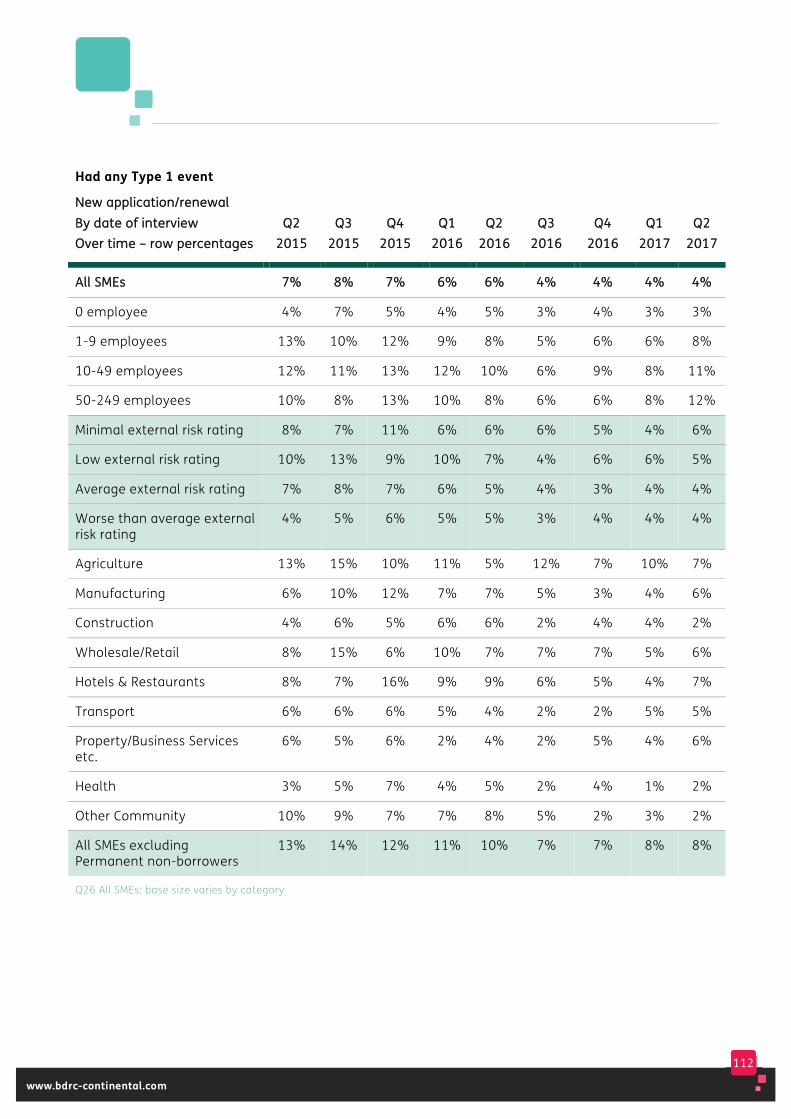
112
www.bdrc-continental.com
Q26 All SMEs: base size varies by category
Had any Type 1 event
NNeeww aapppplliiccaattiioonn//rreenneewwaall BByy ddaattee ooff iinntteerrvviieeww OOvveerr ttiimmee –– rrooww ppeerrcceennttaaggeess
QQ22 22001155
QQ33 22001155
QQ44 22001155
QQ11 22001166
QQ22 22001166
QQ33 22001166
QQ44 22001166
QQ11 22001177
QQ22 22001177
AAllll SSMMEEss 77%% 88%% 77%% 66%% 66%% 44%% 44%% 44%% 44%%
0 employee 4% 7% 5% 4% 5% 3% 4% 3% 3%
1-9 employees 13% 10% 12% 9% 8% 5% 6% 6% 8%
10-49 employees 12% 11% 13% 12% 10% 6% 9% 8% 11%
50-249 employees 10% 8% 13% 10% 8% 6% 6% 8% 12%
Minimal external risk rating 8% 7% 11% 6% 6% 6% 5% 4% 6%
Low external risk rating 10% 13% 9% 10% 7% 4% 6% 6% 5%
Average external risk rating 7% 8% 7% 6% 5% 4% 3% 4% 4%
Worse than average external risk rating
4% 5% 6% 5% 5% 3% 4% 4% 4%
Agriculture 13% 15% 10% 11% 5% 12% 7% 10% 7%
Manufacturing 6% 10% 12% 7% 7% 5% 3% 4% 6%
Construction 4% 6% 5% 6% 6% 2% 4% 4% 2%
Wholesale/Retail 8% 15% 6% 10% 7% 7% 7% 5% 6%
Hotels & Restaurants 8% 7% 16% 9% 9% 6% 5% 4% 7%
Transport 6% 6% 6% 5% 4% 2% 2% 5% 5%
Property/Business Services etc.
6% 5% 6% 2% 4% 2% 5% 4% 6%
Health 3% 5% 7% 4% 5% 2% 4% 1% 2%
Other Community 10% 9% 7% 7% 8% 5% 2% 3% 2%
All SMEs excluding Permanent non-borrowers
13% 14% 12% 11% 10% 7% 7% 8% 8%
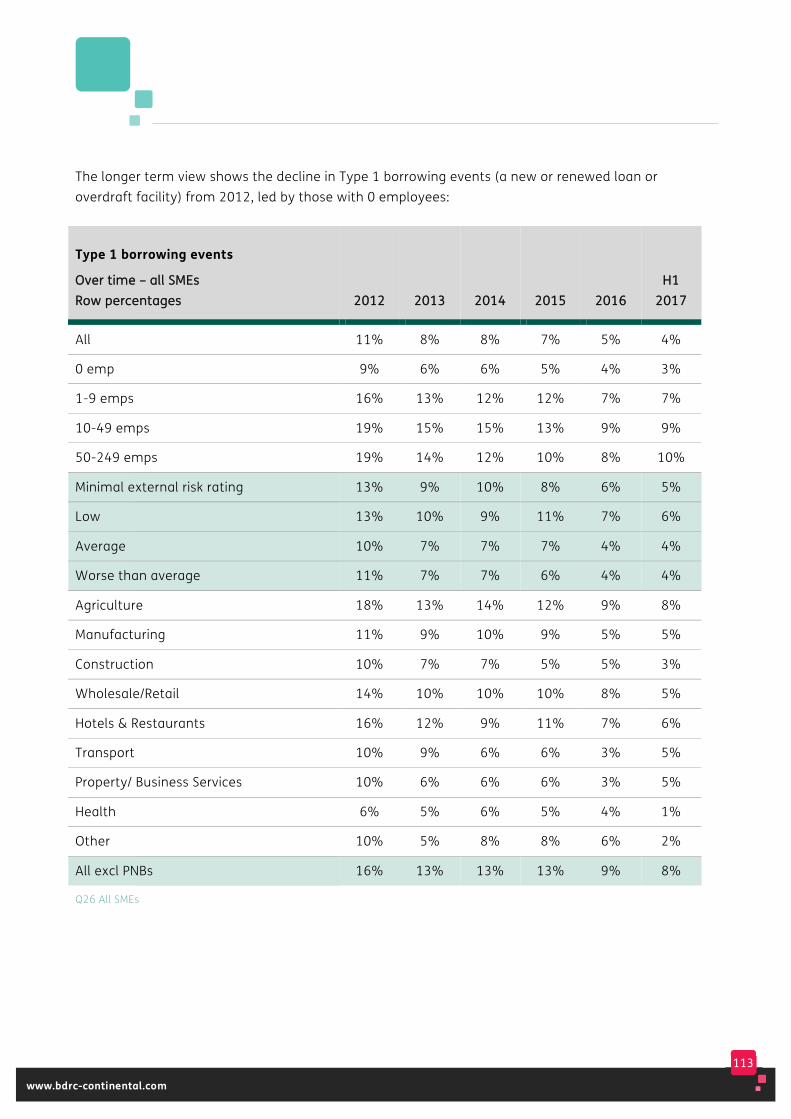
113
www.bdrc-continental.com
The longer term view shows the decline in Type 1 borrowing events (a new or renewed loan or overdraft facility) from 2012, led by those with 0 employees:
Type 1 borrowing events
OOvveerr ttiimmee –– aallll SSMMEEss RRooww ppeerrcceennttaaggeess 22001122 22001133 22001144 22001155
22001166
HH11 22001177
All 11% 8% 8% 7% 5% 4%
0 emp 9% 6% 6% 5% 4% 3%
1-9 emps 16% 13% 12% 12% 7% 7%
10-49 emps 19% 15% 15% 13% 9% 9%
50-249 emps 19% 14% 12% 10% 8% 10%
Minimal external risk rating 13% 9% 10% 8% 6% 5%
Low 13% 10% 9% 11% 7% 6%
Average 10% 7% 7% 7% 4% 4%
Worse than average 11% 7% 7% 6% 4% 4%
Agriculture 18% 13% 14% 12% 9% 8%
Manufacturing 11% 9% 10% 9% 5% 5%
Construction 10% 7% 7% 5% 5% 3%
Wholesale/Retail 14% 10% 10% 10% 8% 5%
Hotels & Restaurants 16% 12% 9% 11% 7% 6%
Transport 10% 9% 6% 6% 3% 5%
Property/ Business Services 10% 6% 6% 6% 3% 5%
Health 6% 5% 6% 5% 4% 1%
Other 10% 5% 8% 8% 6% 2%
All excl PNBs 16% 13% 13% 13% 9% 8%
Q26 All SMEs
114
www.bdrc-continental.com
The remainder of this chapter provides some further information on the proportion of SMEs that reported a Type 1 new or renewed loan or overdraft event in the 12 months prior to interview, both over time and by key demographics. It also includes data on the proportion of overdrafts that have been ‘automatically renewed’ by the bank, rather than a formal review being conducted (something which has not been included in the data reported in the first part of this chapter).
Type 2 (bank cancellation or renegotiation) and Type 3 (SME reducing/repaying facility) events remained rare and at stable levels. No further detail is therefore provided on these events in this report, and from Q3 2014 no further questions were asked about the detail of these events. This will be reviewed should the proportion of SMEs reporting such events start to increase.
Subsequent chapters of this report investigate those SMEs that have applied for a new overdraft or loan facility or to renew an existing one (a Type 1 event), and the outcome of that application by application date.
• SMEs were only asked these follow up questions for a maximum of one loan and one overdraft event. Those that had experienced more than one event in a category were asked which had occurred most recently and were then questioned on this most recent event. Base sizes may therefore differ from the overall figures reported above.
While reflecting on these events, it is important to bear in mind that 39% of SMEs currently use external finance while less than 1 in 10 reported one of the Type 1 borrowing ‘events’ in the previous 12 months. Indeed, around half of SMEs might be considered to be outside the borrowing process – the Permanent non-borrowers described earlier.
A later chapter reports on those SMEs that had not had a borrowing event in the 12 months prior to interview, and explores why this was the case.
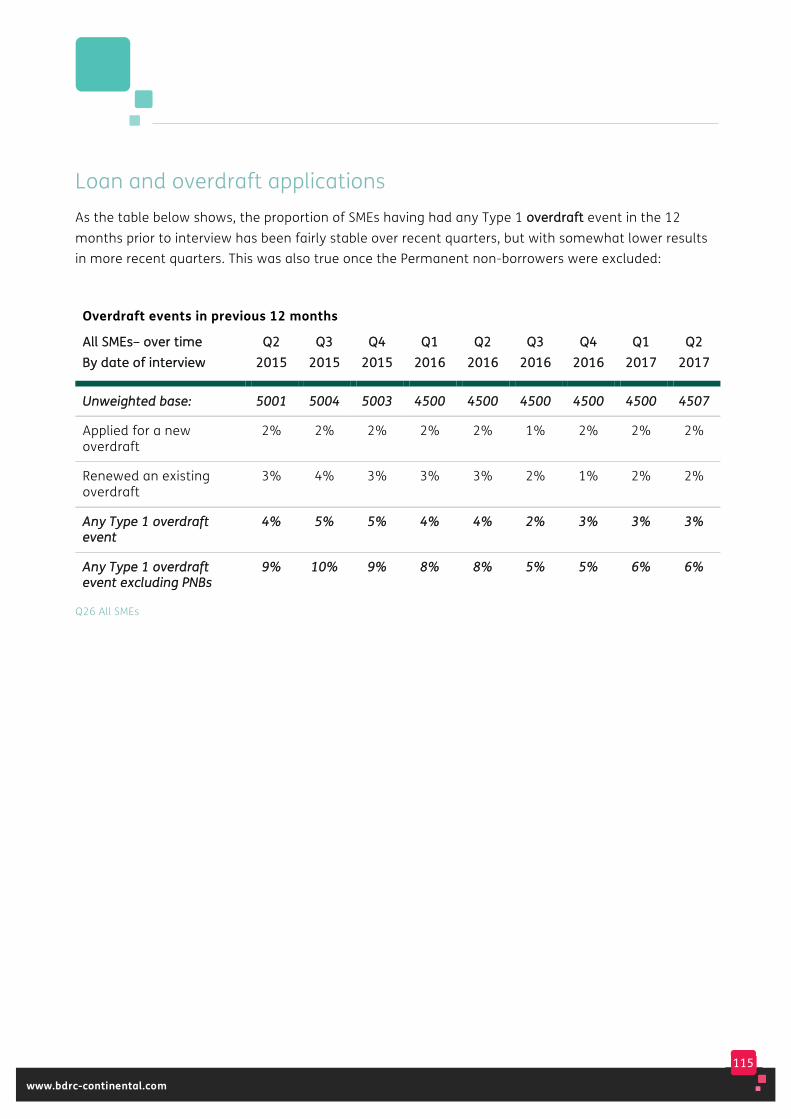
115
www.bdrc-continental.com
Loan and overdraft applications As the table below shows, the proportion of SMEs having had any Type 1 oovveerrddrraafftt event in the 12 months prior to interview has been fairly stable over recent quarters, but with somewhat lower results in more recent quarters. This was also true once the Permanent non-borrowers were excluded:
Overdraft events in previous 12 months
AAllll SSMMEEss–– oovveerr ttiimmee BByy ddaattee ooff iinntteerrvviieeww
QQ22 22001155
QQ33 22001155
QQ44 22001155
QQ11 22001166
QQ22 22001166
QQ33 22001166
QQ44 22001166
QQ11 22001177
QQ22 22001177
UUnnwweeiigghhtteedd bbaassee:: 55000011 55000044 55000033 44550000 44550000 44550000 44550000 44550000 44550077
Applied for a new overdraft
2% 2% 2% 2% 2% 1% 2% 2% 2%
Renewed an existing overdraft
3% 4% 3% 3% 3% 2% 1% 2% 2%
AAnnyy TTyyppee 11 oovveerrddrraafftt eevveenntt
44%% 55%% 55%% 44%% 44%% 22%% 33%% 33%% 33%%
AAnnyy TTyyppee 11 oovveerrddrraafftt eevveenntt eexxcclluuddiinngg PPNNBBss
99%% 1100%% 99%% 88%% 88%% 55%% 55%% 66%% 66%%
Q26 All SMEs
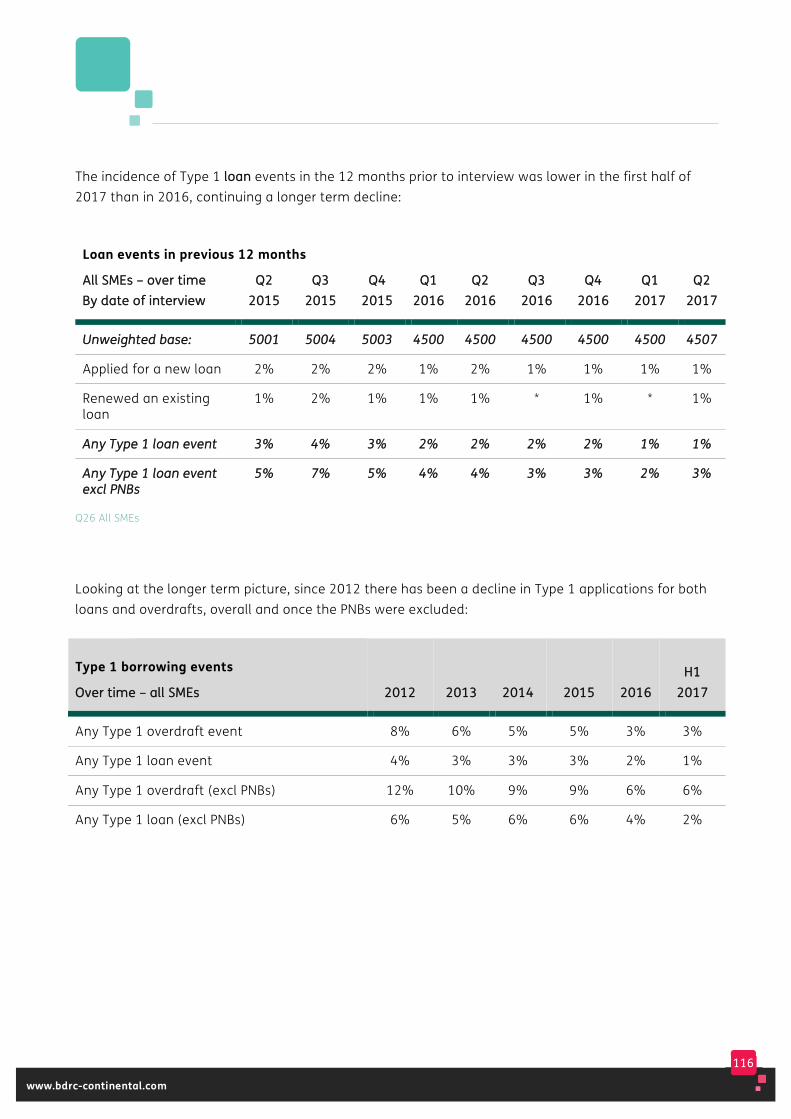
116
www.bdrc-continental.com
The incidence of Type 1 llooaann events in the 12 months prior to interview was lower in the first half of 2017 than in 2016, continuing a longer term decline:
Loan events in previous 12 months
AAllll SSMMEEss –– oovveerr ttiimmee BByy ddaattee ooff iinntteerrvviieeww
QQ22 22001155
QQ33 22001155
QQ44 22001155
QQ11 22001166
QQ22 22001166
QQ33 22001166
QQ44 22001166
QQ11 22001177
QQ22 22001177
UUnnwweeiigghhtteedd bbaassee:: 55000011 55000044 55000033 44550000 44550000 44550000 44550000 44550000 44550077
Applied for a new loan 2% 2% 2% 1% 2% 1% 1% 1% 1%
Renewed an existing loan
1% 2% 1% 1% 1% * 1% * 1%
AAnnyy TTyyppee 11 llooaann eevveenntt 33%% 44%% 33%% 22%% 22%% 22%% 22%% 11%% 11%%
AAnnyy TTyyppee 11 llooaann eevveenntt eexxccll PPNNBBss
55%% 77%% 55%% 44%% 44%% 33%% 33%% 22%% 33%%
Q26 All SMEs
Looking at the longer term picture, since 2012 there has been a decline in Type 1 applications for both loans and overdrafts, overall and once the PNBs were excluded:
Type 1 borrowing events
OOvveerr ttiimmee –– aallll SSMMEEss 22001122 22001133 22001144 22001155 22001166 HH11
22001177
Any Type 1 overdraft event 8% 6% 5% 5% 3% 3%
Any Type 1 loan event 4% 3% 3% 3% 2% 1%
Any Type 1 overdraft (excl PNBs) 12% 10% 9% 9% 6% 6%
Any Type 1 loan (excl PNBs) 6% 5% 6% 6% 4% 2%
117
www.bdrc-continental.com
Further analysis was undertaken to explore the proportion of applications being made in each quarter, in order to establish whether any change in demand for Type 1 loan/overdraft finance can be identified. Respondents have had fewer opportunities to nominate a Type 1 borrowing event that occurred in Q2 2017 (which has only appeared as an option in one quarter of the SME Finance Monitor), compared to other quarters like Q2 2016 which has appeared as an option in 5 quarters (the maximum number possible).
If all applications made and reported to date from Q1 2014 to Q2 2017 had been distributed evenly over that period then the following distribution would have been seen:
• 33% of applications would have been made in 2014 – but the proportion was higher for both overdrafts (36%) and loans (41%)
• 33% of applications would have been made in 2015 – but the proportion was again higher for overdrafts (37%) and slightly higher for loans (35%)
• 29% of applications should have been made in 2016 – but the proportion was somewhat lower (22% for overdrafts and 21% for loans)
• 5% of applications should have been made in 2017 – overdrafts were in line (5%) but loans were somewhat lower (3%)
The analysis supports the declining appetite for finance. Across the period from 2014, if the applications were spread evenly, 34% of applications should have been made 2016-H1 2017, but in fact 27% of overdrafts and 24% of loans were made in this period.
Those that reported a Type 1 event were asked whether the application was made in the name of the business or a personal name. For YEQ2 2017:
• 14% of overdraft applications reported were made in a personal name, while for loans the figure was 17% (excluding DK answers).
• In both instances applicants with 0 employees were much more likely to have applied in a personal name (20% for overdrafts and 26% for loans) and more than 8 in 10 of all applications in a personal name were from 0 employee SMEs.
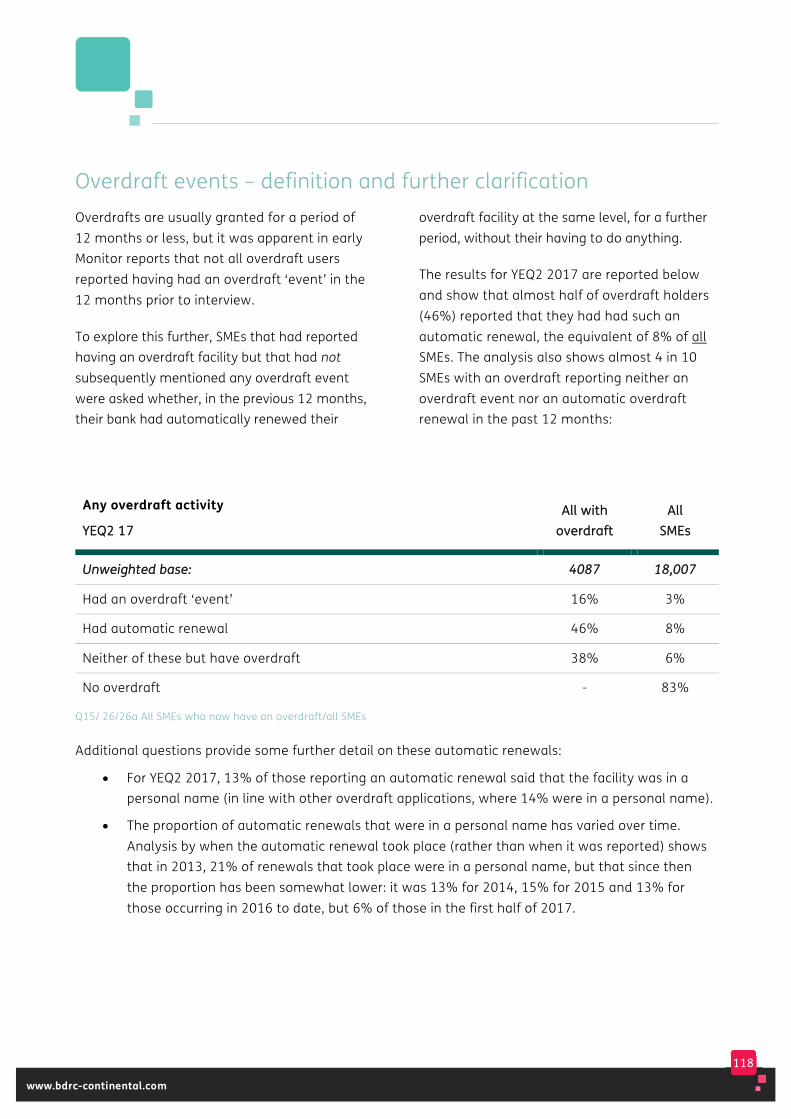
118
www.bdrc-continental.com
Overdraft events – definition and further clarification Overdrafts are usually granted for a period of 12 months or less, but it was apparent in early Monitor reports that not all overdraft users reported having had an overdraft ‘event’ in the 12 months prior to interview.
To explore this further, SMEs that had reported having an overdraft facility but that had not subsequently mentioned any overdraft event were asked whether, in the previous 12 months, their bank had automatically renewed their
overdraft facility at the same level, for a further period, without their having to do anything.
The results for YEQ2 2017 are reported below and show that almost half of overdraft holders (46%) reported that they had had such an automatic renewal, the equivalent of 8% of all SMEs. The analysis also shows almost 4 in 10 SMEs with an overdraft reporting neither an overdraft event nor an automatic overdraft renewal in the past 12 months:
Any overdraft activity
YYEEQQ22 1177 AAllll wwiitthh
oovveerrddrraafftt AAllll
SSMMEEss
UUnnwweeiigghhtteedd bbaassee:: 44008877 1188,,000077
Had an overdraft ‘event’ 16% 3%
Had automatic renewal 46% 8%
Neither of these but have overdraft 38% 6%
No overdraft - 83%
Q15/ 26/26a All SMEs who now have an overdraft/all SMEs
Additional questions provide some further detail on these automatic renewals:
• For YEQ2 2017, 13% of those reporting an automatic renewal said that the facility was in a personal name (in line with other overdraft applications, where 14% were in a personal name).
• The proportion of automatic renewals that were in a personal name has varied over time. Analysis by when the automatic renewal took place (rather than when it was reported) shows that in 2013, 21% of renewals that took place were in a personal name, but that since then the proportion has been somewhat lower: it was 13% for 2014, 15% for 2015 and 13% for those occurring in 2016 to date, but 6% of those in the first half of 2017.
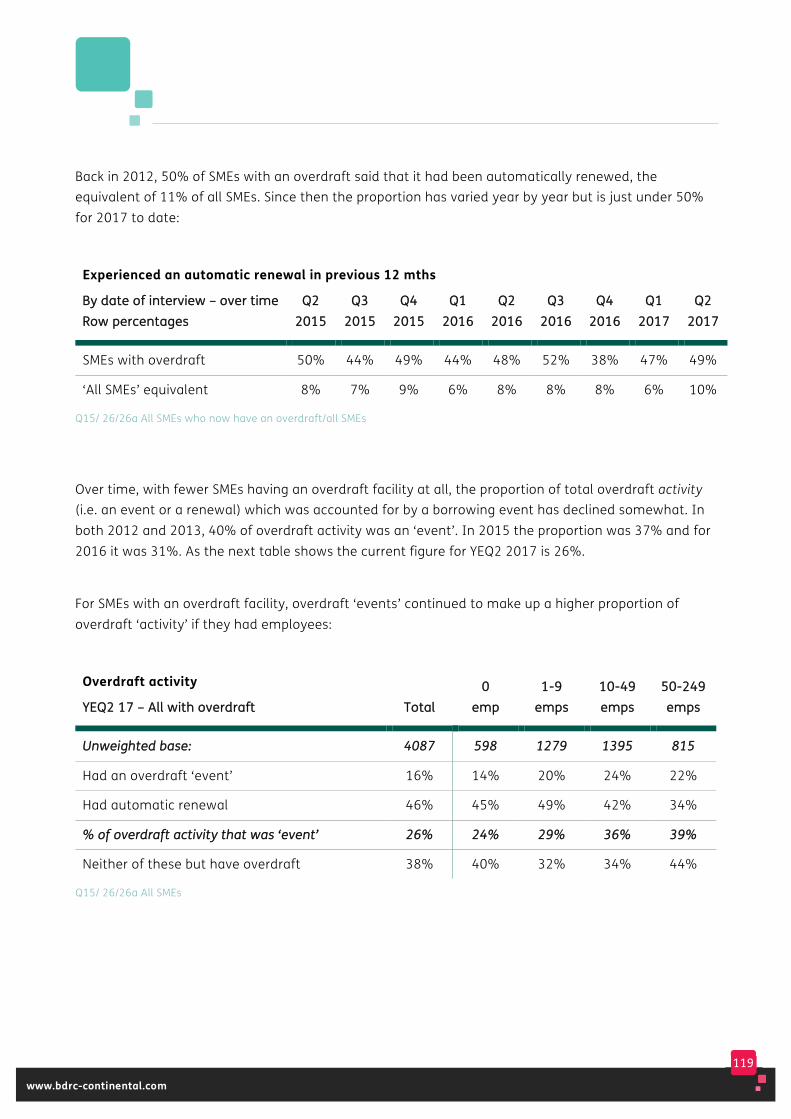
119
www.bdrc-continental.com
Back in 2012, 50% of SMEs with an overdraft said that it had been automatically renewed, the equivalent of 11% of all SMEs. Since then the proportion has varied year by year but is just under 50% for 2017 to date:
Experienced an automatic renewal in previous 12 mths
BByy ddaattee ooff iinntteerrvviieeww –– oovveerr ttiimmee RRooww ppeerrcceennttaaggeess
QQ22 22001155
QQ33 22001155
QQ44 22001155
QQ11 22001166
QQ22 22001166
QQ33 22001166
QQ44 22001166
QQ11 22001177
QQ22 22001177
SMEs with overdraft 50% 44% 49% 44% 48% 52% 38% 47% 49%
‘All SMEs’ equivalent 8% 7% 9% 6% 8% 8% 8% 6% 10%
Q15/ 26/26a All SMEs who now have an overdraft/all SMEs
Over time, with fewer SMEs having an overdraft facility at all, the proportion of total overdraft activity (i.e. an event or a renewal) which was accounted for by a borrowing event has declined somewhat. In both 2012 and 2013, 40% of overdraft activity was an ‘event’. In 2015 the proportion was 37% and for 2016 it was 31%. As the next table shows the current figure for YEQ2 2017 is 26%.
For SMEs with an overdraft facility, overdraft ‘events’ continued to make up a higher proportion of overdraft ‘activity’ if they had employees:
Overdraft activity
YYEEQQ22 1177 –– AAllll wwiitthh oovveerrddrraafftt TToottaall 00
eemmpp 11--99
eemmppss 1100--4499 eemmppss
5500--224499 eemmppss
UUnnwweeiigghhtteedd bbaassee:: 44008877 559988 11227799 11339955 881155
Had an overdraft ‘event’ 16% 14% 20% 24% 22%
Had automatic renewal 46% 45% 49% 42% 34%
%% ooff oovveerrddrraafftt aaccttiivviittyy tthhaatt wwaass ‘‘eevveenntt’’ 2266%% 2244%% 2299%% 3366%% 3399%%
Neither of these but have overdraft 38% 40% 32% 34% 44%
Q15/ 26/26a All SMEs
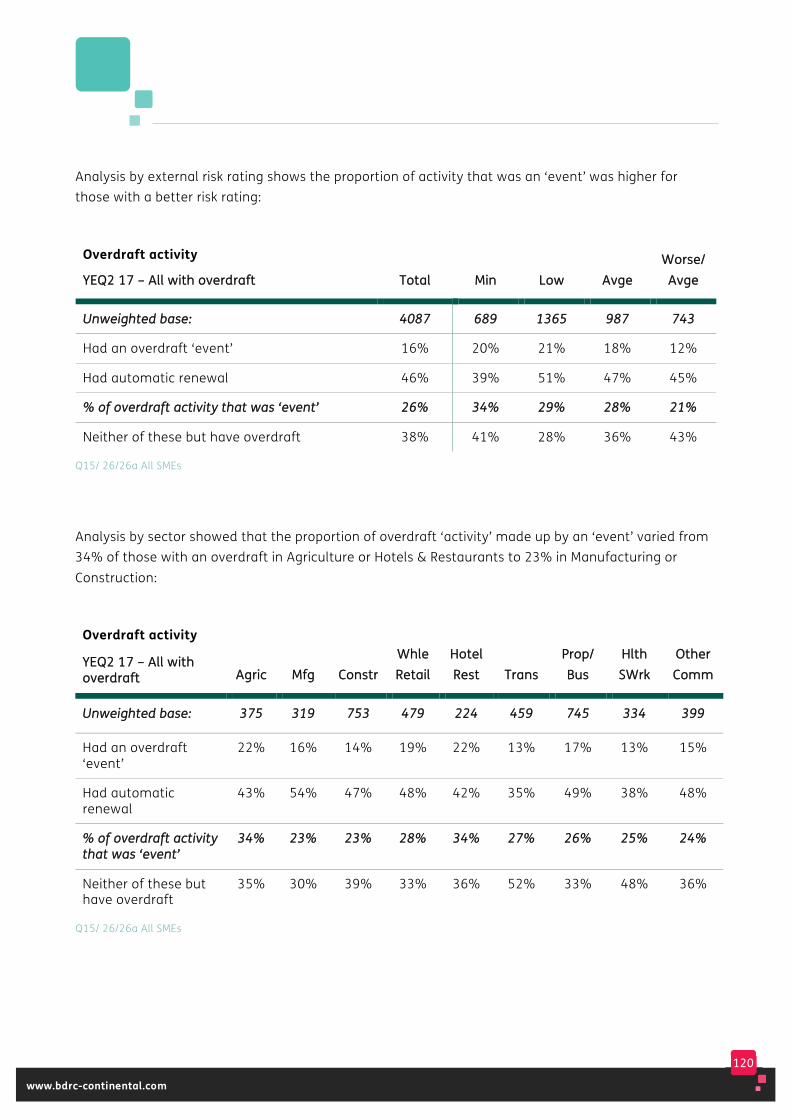
120
www.bdrc-continental.com
Analysis by external risk rating shows the proportion of activity that was an ‘event’ was higher for those with a better risk rating:
Overdraft activity
YYEEQQ22 1177 –– AAllll wwiitthh oovveerrddrraafftt TToottaall MMiinn LLooww AAvvggee WWoorrssee//
AAvvggee
UUnnwweeiigghhtteedd bbaassee:: 44008877 668899 11336655 998877 774433
Had an overdraft ‘event’ 16% 20% 21% 18% 12%
Had automatic renewal 46% 39% 51% 47% 45%
%% ooff oovveerrddrraafftt aaccttiivviittyy tthhaatt wwaass ‘‘eevveenntt’’ 2266%% 3344%% 2299%% 2288%% 2211%%
Neither of these but have overdraft 38% 41% 28% 36% 43%
Q15/ 26/26a All SMEs
Analysis by sector showed that the proportion of overdraft ‘activity’ made up by an ‘event’ varied from 34% of those with an overdraft in Agriculture or Hotels & Restaurants to 23% in Manufacturing or Construction:
Overdraft activity
YYEEQQ22 1177 –– AAllll wwiitthh oovveerrddrraafftt AAggrriicc MMffgg CCoonnssttrr
WWhhllee RReettaaiill
HHootteell RReesstt TTrraannss
PPrroopp// BBuuss
HHlltthh SSWWrrkk
OOtthheerr CCoommmm
UUnnwweeiigghhtteedd bbaassee:: 337755 331199 775533 447799 222244 445599 774455 333344 339999
Had an overdraft ‘event’
22% 16% 14% 19% 22% 13% 17% 13% 15%
Had automatic renewal
43% 54% 47% 48% 42% 35% 49% 38% 48%
%% ooff oovveerrddrraafftt aaccttiivviittyy tthhaatt wwaass ‘‘eevveenntt’’
3344%% 2233%% 2233%% 2288%% 3344%% 2277%% 2266%% 2255%% 2244%%
Neither of these but have overdraft
35% 30% 39% 33% 36% 52% 33% 48% 36%
Q15/ 26/26a All SMEs
121
www.bdrc-continental.com
The answers to these questions reflect the SME’s perception of how their business overdraft facility had been managed by their bank. Given the low level of ‘events’ reported generally, these SMEs with an automatic renewal form a substantial group and, from Q2 2012, they have answered further questions about this automatic renewal.
The definition of ‘having a borrowing event’ has been adjusted to include these automatic renewals and data is available on the security and fees relating to these automatically renewed overdraft facilities.
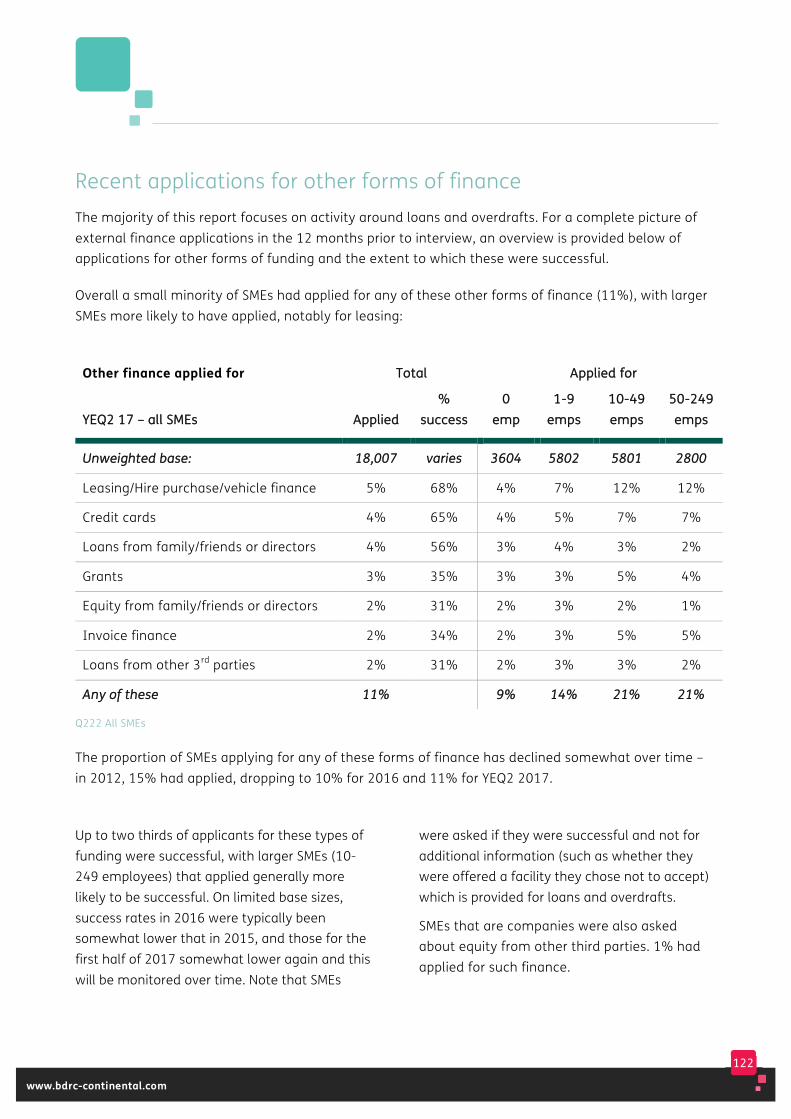
122
www.bdrc-continental.com
Recent applications for other forms of finance The majority of this report focuses on activity around loans and overdrafts. For a complete picture of external finance applications in the 12 months prior to interview, an overview is provided below of applications for other forms of funding and the extent to which these were successful.
Overall a small minority of SMEs had applied for any of these other forms of finance (11%), with larger SMEs more likely to have applied, notably for leasing:
Other finance applied for TToottaall AApppplliieedd ffoorr
YYEEQQ22 1177 –– aallll SSMMEEss AApppplliieedd %%
ssuucccceessss 00
eemmpp 11--99
eemmppss 1100--4499 eemmppss
5500--224499 eemmppss
UUnnwweeiigghhtteedd bbaassee:: 1188,,000077 vvaarriieess 33660044 55880022 55880011 22880000
Leasing/Hire purchase/vehicle finance 5% 68% 4% 7% 12% 12%
Credit cards 4% 65% 4% 5% 7% 7%
Loans from family/friends or directors 4% 56% 3% 4% 3% 2%
Grants 3% 35% 3% 3% 5% 4%
Equity from family/friends or directors 2% 31% 2% 3% 2% 1%
Invoice finance 2% 34% 2% 3% 5% 5%
Loans from other 3rd parties 2% 31% 2% 3% 3% 2%
AAnnyy ooff tthheessee 1111%% 99%% 1144%% 2211%% 2211%%
Q222 All SMEs
The proportion of SMEs applying for any of these forms of finance has declined somewhat over time – in 2012, 15% had applied, dropping to 10% for 2016 and 11% for YEQ2 2017.
Up to two thirds of applicants for these types of funding were successful, with larger SMEs (10-249 employees) that applied generally more likely to be successful. On limited base sizes, success rates in 2016 were typically been somewhat lower that in 2015, and those for the first half of 2017 somewhat lower again and this will be monitored over time. Note that SMEs
were asked if they were successful and not for additional information (such as whether they were offered a facility they chose not to accept) which is provided for loans and overdrafts.
SMEs that are companies were also asked about equity from other third parties. 1% had applied for such finance.
123
www.bdrc-continental.com
In a series of questions asked for the first time in 2015, respondents were asked in more detail about these other forms of finance:
AApppplliiccaattiioonnss ffoorr ootthheerr ffoorrmmss ooff ffiinnaannccee YYEEQQ22 22001177
Net applications for facilities
11% reported an application for one or more of these other forms of finance. As reported above, 4% of SMEs interviewed YEQ2 2017 reported that they had made an application for a new or renewed loan or overdraft facility (not including any automatically renewed facility).
Putting the two together increases the proportion making any application to 14% (25% when the PNBs are excluded).
This has declined from 21% in 2012 due primarily to fewer loan and overdraft applications. Applications for these other forms of finance have as declined somewhat (15% in 2012, 13% in both 2014 and 2015, but 10% in 2016).
Other applications For YEQ2 2017, 1% of SMEs said that they had applied for some other form of finance not listed, half successfully and half unsuccessfully. The type of finance applied for is not recorded.
Identifying additional Would-be seekers of other forms of finance
SMEs who had not sought any of these forms of finance (whether from the list specified or any other source as above) were asked whether they had wanted to apply for any of them but had felt that something had stopped them.
89% of SMEs qualified for this question for YEQ2 2017 because they had not applied for any additional form of external finance.
Would-be seekers of other forms of finance
2% of these SMEs went on to say that something had stopped them applying for an additional form of finance, with no difference by size of SME.
This is the equivalent of 2% of all SMEs – the potential impact on the proportion of Would-be seekers overall is explored later in this report.
Net users of finance Taking all loan/overdraft events (including automatic renewal of overdrafts) and the applications for these other types of finance together for YEQ2 2017 showed that:
- Most SMEs (79%), reported neither a loan/overdraft ‘event’ nor an application for any of the types of finance listed above
- 10% reported a loan/overdraft event, but had not applied for other forms of finance
- 8% had applied for other forms of finance but did not report a loan/overdraft event
- 3% reported both a loan/overdraft event and applying for one of these forms of finance.
By comparison, in 2012, 6% of SMEs had applied for both types of finance, 26% had applied for one form or the other and 68% had not applied for either.

124
www.bdrc-continental.com
8. The build-up to applications for overdrafts and loans
This chapter is the first of four covering Type 1 borrowing events in more detail and looks at the ‘build-up’ to the loan or overdraft application, why funds were required and whether advice was sought.

125
www.bdrc-continental.com
Key findings 3 in 10 applications made Q1 2016 to Q2 2017 were from first time applicants (26% for overdrafts, 32% for loans).
• Most other overdraft applications were to renew an existing facility (51% of all applications) with 16% looking for a new/increased overdraft but not their first
• Other loan applications were less likely to be for a renewal (16% of all applications) and more likely to be for a new loan but not their first (52%).
Overdrafts were typically sought for smaller amounts. 44% of applications were for less than £5,000, compared to 18% of loans.
• In both instances, larger SMEs were more likely to be seeking larger amounts. 53% of overdrafts applicants with 50-249 employees and 59% of loan applicants of that size were seeking a facility of £100,000 or more.
Most overdrafts were to fund working capital while loans were more likely to be funding expansion in the UK or the purchase of assets. There was limited evidence of shopping around:
• 82% of overdrafts were for working capital and this has changed very little over time. Almost all, 99%, applied to only one bank and that was their main bank
• Loan applications were typically to fund UK expansion (36%) and/or to buy fixed assets (32%) or motor vehicles (26%). 87% only applied to one bank (almost always their main bank).
Few applicants sought advice before applying.
• 7% of overdraft applicants sought advice before applying, increasing somewhat for larger applicants
• Loan applicants were more likely to have sought advice but still only a minority did so (18%).

126
www.bdrc-continental.com
The data presented thus far in this report has reflected events that had happened to the SME in the 12 months before they were interviewed, analysed by the date of interview. This chapter is the first of four covering Type 1 borrowing events in more detail. Type 1 events are those where the SME approached the bank looking for new or renewed overdraft or loan facilities. The first of these chapters looks at the build-up to the application, why funds were required and whether advice was sought. Subsequent chapters then detail the bank’s response, the resultant loan/overdraft granted, the effect of the process on the SME and the security and fees relating to these facilities.
As these chapters examine overdraft and loan events specifically, it makes sense for the analysis to be based on when the event occurred, rather than when it was reported, and this approach has been adopted for these chapters since the Q2 2013 report.
Each chapter includes analysis, as far as is possible, on the extent to which loan and overdraft applications are changing over time. For the most recent quarters (especially those in 2017) this is only iinntteerriimm data, which is liable to change and which will be updated in subsequent reports.
However, for sub-group analysis, such as by size or risk rating, sample sizes preclude analysis at the individual quarter level and the data needs to be grouped over time to provide a more robust sample size. In order to ensure a suitable sample size, a period of 18 months has been selected. This means that rather than reporting on applications for YEQ2 2017 (i.e. all interviews conducted in the 4 quarters to Q2 2017, irrespective of when the borrowing event occurred), data is now reported on the basis of ‘Applications occurring in the 18 months to Q2 2017’ (i.e. applications known to have been made between Q1 2016 and Q2 2017 and reported to date, irrespective of when the SME was actually interviewed).
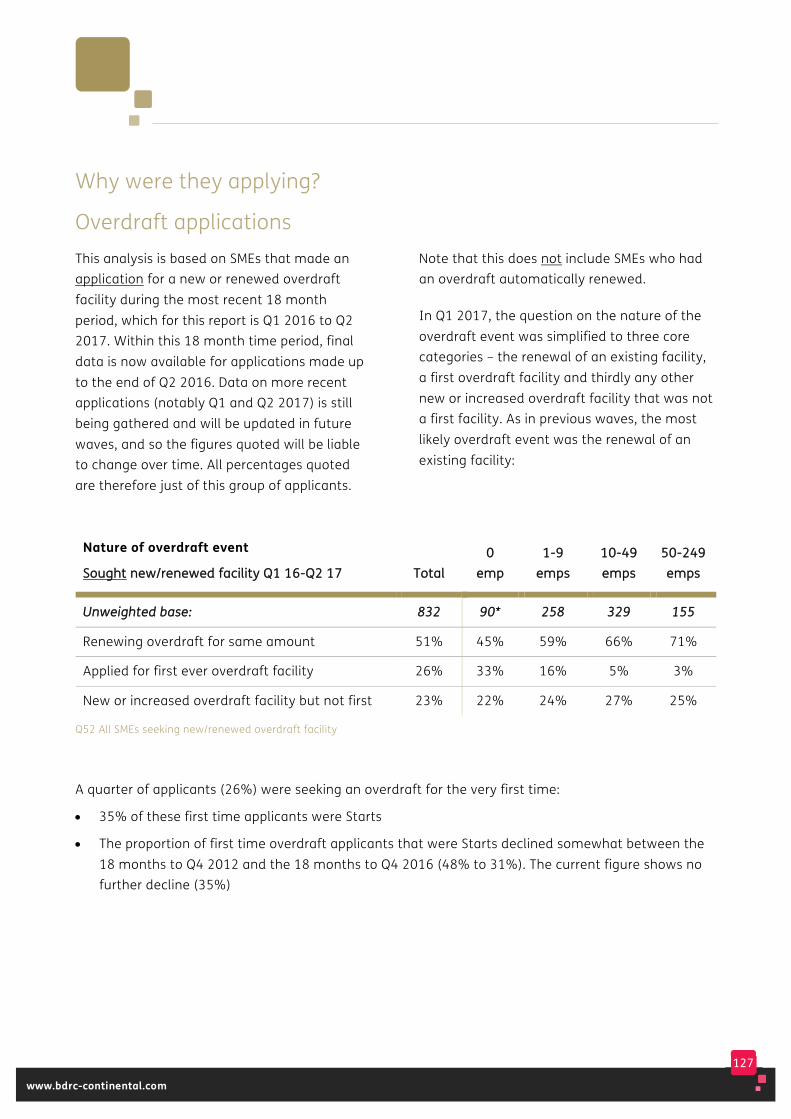
127
www.bdrc-continental.com
Why were they applying?
Overdraft applications This analysis is based on SMEs that made an application for a new or renewed overdraft facility during the most recent 18 month period, which for this report is Q1 2016 to Q2 2017. Within this 18 month time period, final data is now available for applications made up to the end of Q2 2016. Data on more recent applications (notably Q1 and Q2 2017) is still being gathered and will be updated in future waves, and so the figures quoted will be liable to change over time. All percentages quoted are therefore just of this group of applicants.
Note that this does not include SMEs who had an overdraft automatically renewed.
In Q1 2017, the question on the nature of the overdraft event was simplified to three core categories – the renewal of an existing facility, a first overdraft facility and thirdly any other new or increased overdraft facility that was not a first facility. As in previous waves, the most likely overdraft event was the renewal of an existing facility:
Nature of overdraft event
SSoouugghhtt nneeww//rreenneewweedd ffaacciilliittyy QQ11 1166--QQ22 1177 TToottaall 00
eemmpp 11--99
eemmppss 1100--4499 eemmppss
5500--224499 eemmppss
UUnnwweeiigghhtteedd bbaassee:: 883322 9900** 225588 332299 115555
Renewing overdraft for same amount 51% 45% 59% 66% 71%
Applied for first ever overdraft facility 26% 33% 16% 5% 3%
New or increased overdraft facility but not first 23% 22% 24% 27% 25%
Q52 All SMEs seeking new/renewed overdraft facility
A quarter of applicants (26%) were seeking an overdraft for the very first time:
• 35% of these first time applicants were Starts
• The proportion of first time overdraft applicants that were Starts declined somewhat between the 18 months to Q4 2012 and the 18 months to Q4 2016 (48% to 31%). The current figure shows no further decline (35%)
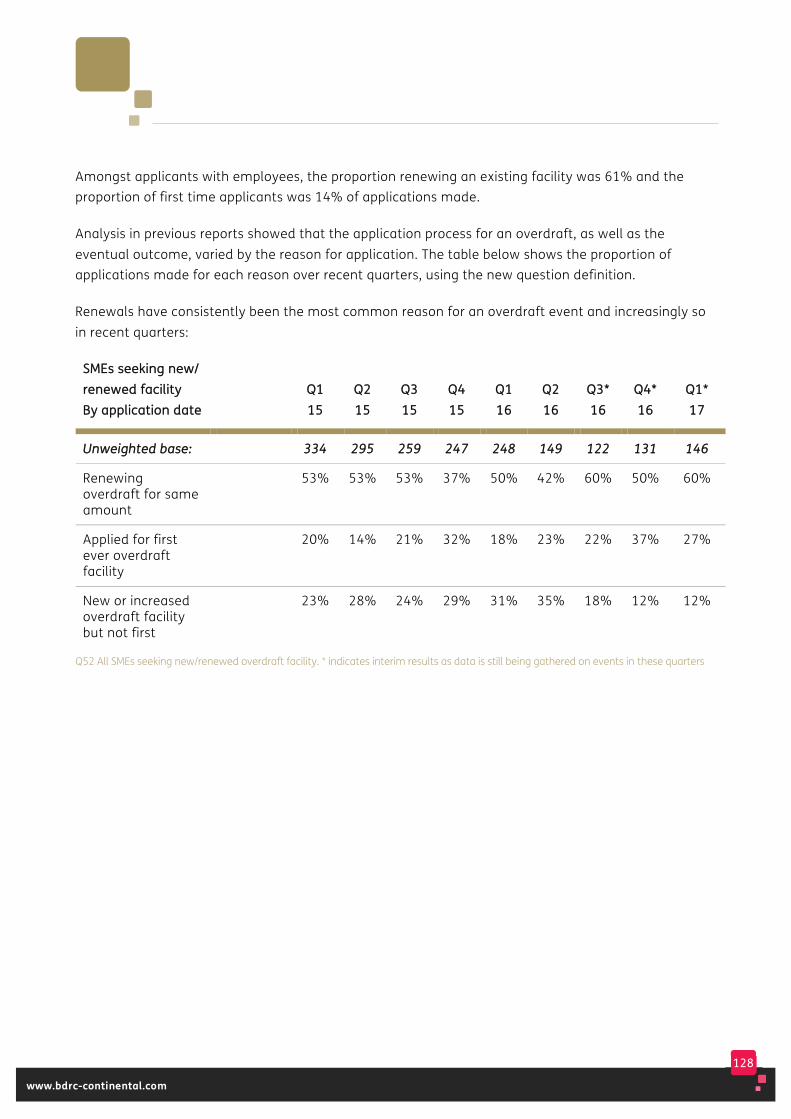
128
www.bdrc-continental.com
Amongst applicants with employees, the proportion renewing an existing facility was 61% and the proportion of first time applicants was 14% of applications made.
Analysis in previous reports showed that the application process for an overdraft, as well as the eventual outcome, varied by the reason for application. The table below shows the proportion of applications made for each reason over recent quarters, using the new question definition.
Renewals have consistently been the most common reason for an overdraft event and increasingly so in recent quarters:
SSMMEEss sseeeekkiinngg nneeww// rreenneewweedd ffaacciilliittyy BByy aapppplliiccaattiioonn ddaattee
QQ11 1155
QQ22 1155
QQ33 1155
QQ44 1155
QQ11 1166
QQ22 1166
QQ33** 1166
QQ44** 1166
QQ11** 1177
UUnnwweeiigghhtteedd bbaassee:: 333344 229955 225599 224477 224488 114499 112222 113311 114466
Renewing overdraft for same amount
53% 53% 53% 37% 50% 42% 60% 50% 60%
Applied for first ever overdraft facility
20% 14% 21% 32% 18% 23% 22% 37% 27%
New or increased overdraft facility but not first
23% 28% 24% 29% 31% 35% 18% 12% 12%
Q52 All SMEs seeking new/renewed overdraft facility. * indicates interim results as data is still being gathered on events in these quarters

129
www.bdrc-continental.com
4 in 10 of overdrafts sought were for £5,000 or less, with considerable variation by size of applicant. The median amount sought as an overdraft facility has changed relatively little over time and is currently £5,000, ranging from £3,000 amongst 0 employee SMEs seeking a facility to £88,000 for those with 50-249 employees:
Amount initially sought, where stated
SSoouugghhtt nneeww//rreenneewweedd ffaacciilliittyy QQ11 1166--QQ22 1177 TToottaall 00
eemmpp 11--99
eemmppss 1100--4499 eemmppss
5500--224499 eemmppss
UUnnwweeiigghhtteedd bbaassee:: 773388 8855** 223377 228822 113344
Less than £5,000 44% 56% 28% 4% 5%
£5,000 – £9,999 22% 25% 19% 8% 9%
£10,000 – £24,999 17% 11% 30% 24% 15%
£25,000 – £99,999 13% 8% 21% 36% 17%
£100,000+ 4% 1% 3% 28% 53%
MMeeddiiaann aammoouunntt ssoouugghhtt ££55kk ££33kk ££99kk ££3366kk ££8888kk
Q58/59 All SMEs seeking new/renewed overdraft facility, excluding DK/refused
As the table below shows, 8 out of 10 overdraft applicants said that the overdraft was needed for day-to-day cash flow, with little variation by size. Just over a third (38%) mentioned having a safety net, also with little difference by size. As in previous quarters, overdrafts were much more likely to have been sought to support UK expansion (17%) than expansion overseas (1%):
Purpose of overdraft sought
SSoouugghhtt nneeww//rreenneewweedd ffaacciilliittyy QQ11 1166--QQ22 1177 TToottaall 00
eemmpp 11--99
eemmppss 1100--4499 eemmppss
5500--224499 eemmppss
UUnnwweeiigghhtteedd bbaassee:: 883322 9900 225588 332299 115555
Working capital for day to day cash flow 82% 84% 76% 83% 80%
Safety net – just in case 38% 36% 40% 40% 38%
Short term funding gap 27% 26% 28% 27% 33%
Fund expansion in UK 17% 19% 15% 13% 15%
Buy fixed assets 9% 6% 13% 9% 8%
Fund expansion overseas 1% 1% 2% 1% 1%
Q55 All SMEs seeking new/renewed overdraft facility
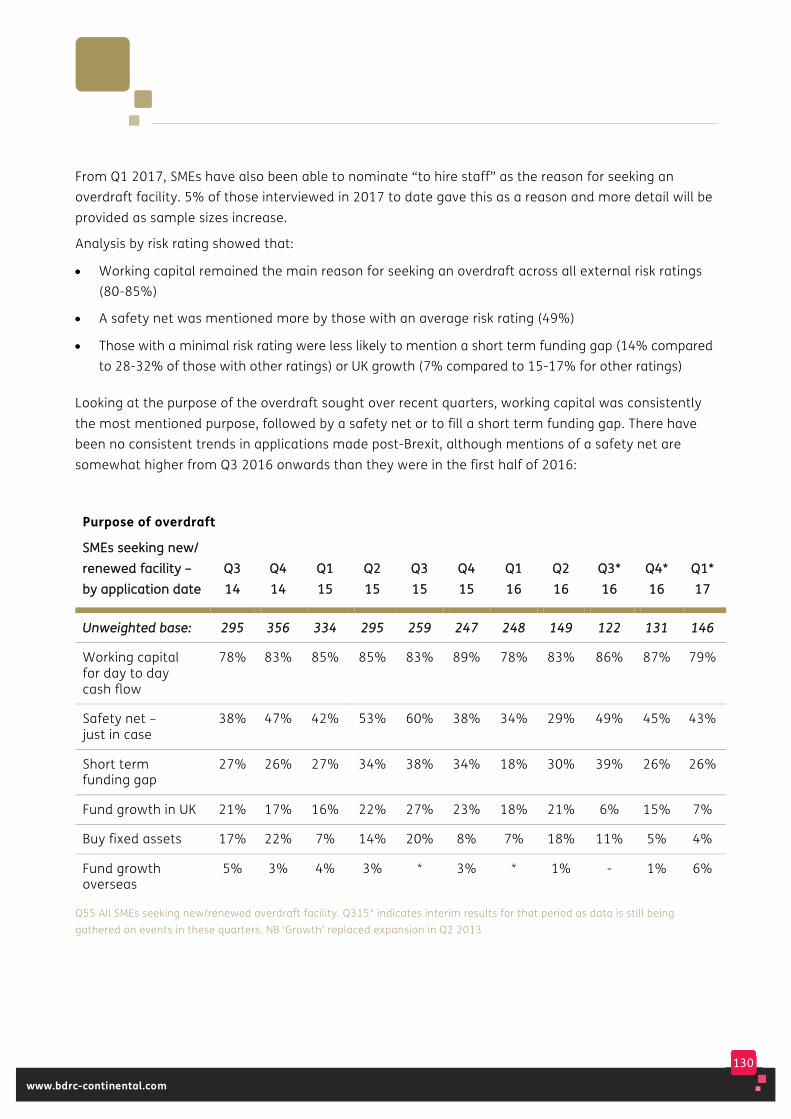
130
www.bdrc-continental.com
From Q1 2017, SMEs have also been able to nominate “to hire staff” as the reason for seeking an overdraft facility. 5% of those interviewed in 2017 to date gave this as a reason and more detail will be provided as sample sizes increase.
Analysis by risk rating showed that:
• Working capital remained the main reason for seeking an overdraft across all external risk ratings (80-85%)
• A safety net was mentioned more by those with an average risk rating (49%)
• Those with a minimal risk rating were less likely to mention a short term funding gap (14% compared to 28-32% of those with other ratings) or UK growth (7% compared to 15-17% for other ratings)
Looking at the purpose of the overdraft sought over recent quarters, working capital was consistently the most mentioned purpose, followed by a safety net or to fill a short term funding gap. There have been no consistent trends in applications made post-Brexit, although mentions of a safety net are somewhat higher from Q3 2016 onwards than they were in the first half of 2016:
Purpose of overdraft
SSMMEEss sseeeekkiinngg nneeww// rreenneewweedd ffaacciilliittyy –– bbyy aapppplliiccaattiioonn ddaattee
QQ33 1144
QQ44 1144
QQ11 1155
QQ22 1155
QQ33 1155
QQ44 1155
QQ11 1166
QQ22 1166
QQ33** 1166
QQ44** 1166
QQ11** 1177
UUnnwweeiigghhtteedd bbaassee:: 229955 335566 333344 229955 225599 224477 224488 114499 112222 113311 114466
Working capital for day to day cash flow
78% 83% 85% 85% 83% 89% 78% 83% 86% 87% 79%
Safety net – just in case
38% 47% 42% 53% 60% 38% 34% 29% 49% 45% 43%
Short term funding gap
27% 26% 27% 34% 38% 34% 18% 30% 39% 26% 26%
Fund growth in UK 21% 17% 16% 22% 27% 23% 18% 21% 6% 15% 7%
Buy fixed assets 17% 22% 7% 14% 20% 8% 7% 18% 11% 5% 4%
Fund growth overseas
5% 3% 4% 3% * 3% * 1% - 1% 6%
Q55 All SMEs seeking new/renewed overdraft facility. Q315* indicates interim results for that period as data is still being gathered on events in these quarters. NB ‘Growth’ replaced expansion in Q2 2013
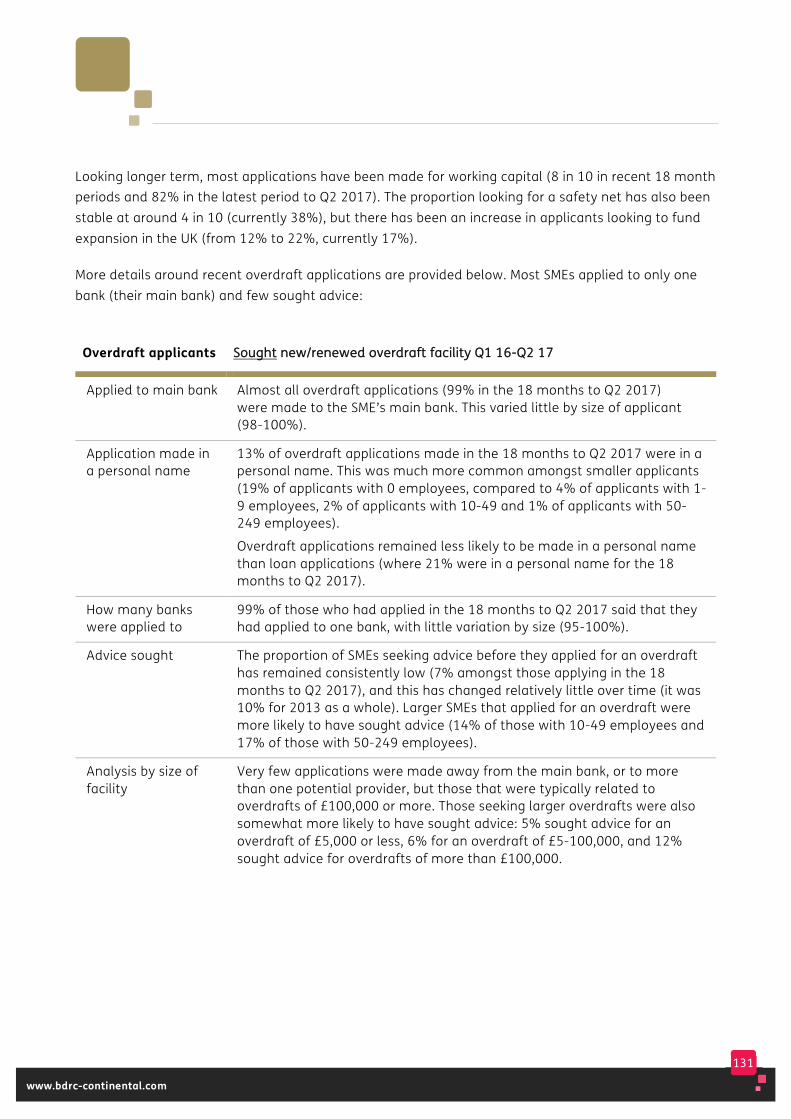
131
www.bdrc-continental.com
Looking longer term, most applications have been made for working capital (8 in 10 in recent 18 month periods and 82% in the latest period to Q2 2017). The proportion looking for a safety net has also been stable at around 4 in 10 (currently 38%), but there has been an increase in applicants looking to fund expansion in the UK (from 12% to 22%, currently 17%).
More details around recent overdraft applications are provided below. Most SMEs applied to only one bank (their main bank) and few sought advice:
Overdraft applicants SSoouugghhtt nneeww//rreenneewweedd oovveerrddrraafftt ffaacciilliittyy QQ11 1166--QQ22 1177
Applied to main bank Almost all overdraft applications (99% in the 18 months to Q2 2017) were made to the SME’s main bank. This varied little by size of applicant (98-100%).
Application made in a personal name
13% of overdraft applications made in the 18 months to Q2 2017 were in a personal name. This was much more common amongst smaller applicants (19% of applicants with 0 employees, compared to 4% of applicants with 1-9 employees, 2% of applicants with 10-49 and 1% of applicants with 50-249 employees).
Overdraft applications remained less likely to be made in a personal name than loan applications (where 21% were in a personal name for the 18 months to Q2 2017).
How many banks were applied to
99% of those who had applied in the 18 months to Q2 2017 said that they had applied to one bank, with little variation by size (95-100%).
Advice sought The proportion of SMEs seeking advice before they applied for an overdraft has remained consistently low (7% amongst those applying in the 18 months to Q2 2017), and this has changed relatively little over time (it was 10% for 2013 as a whole). Larger SMEs that applied for an overdraft were more likely to have sought advice (14% of those with 10-49 employees and 17% of those with 50-249 employees).
Analysis by size of facility
Very few applications were made away from the main bank, or to more than one potential provider, but those that were typically related to overdrafts of £100,000 or more. Those seeking larger overdrafts were also somewhat more likely to have sought advice: 5% sought advice for an overdraft of £5,000 or less, 6% for an overdraft of £5-100,000, and 12% sought advice for overdrafts of more than £100,000.
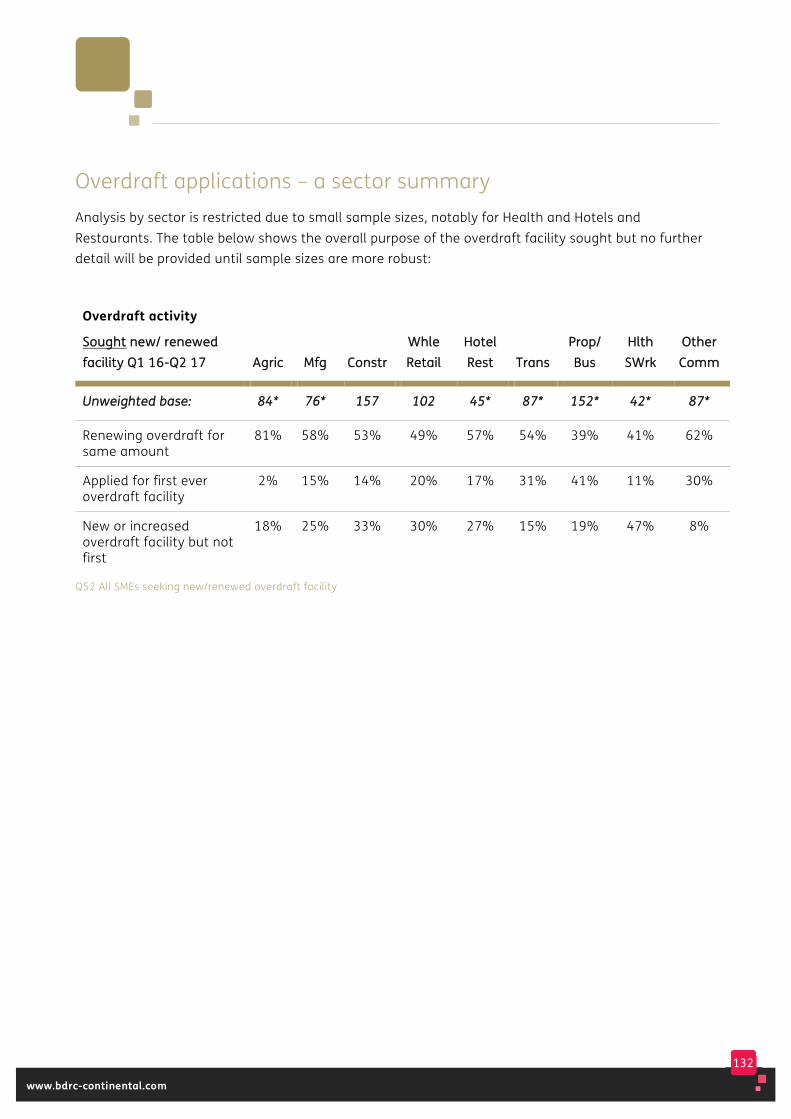
132
www.bdrc-continental.com
Overdraft applications – a sector summary Analysis by sector is restricted due to small sample sizes, notably for Health and Hotels and Restaurants. The table below shows the overall purpose of the overdraft facility sought but no further detail will be provided until sample sizes are more robust:
Overdraft activity
SSoouugghhtt nneeww// rreenneewweedd ffaacciilliittyy QQ11 1166--QQ22 1177 AAggrriicc MMffgg CCoonnssttrr
WWhhllee RReettaaiill
HHootteell RReesstt TTrraannss
PPrroopp// BBuuss
HHlltthh SSWWrrkk
OOtthheerr CCoommmm
UUnnwweeiigghhtteedd bbaassee:: 8844** 7766** 115577 110022 4455** 8877** 115522** 4422** 8877**
Renewing overdraft for same amount
81% 58% 53% 49% 57% 54% 39% 41% 62%
Applied for first ever overdraft facility
2% 15% 14% 20% 17% 31% 41% 11% 30%
New or increased overdraft facility but not first
18% 25% 33% 30% 27% 15% 19% 47% 8%
Q52 All SMEs seeking new/renewed overdraft facility
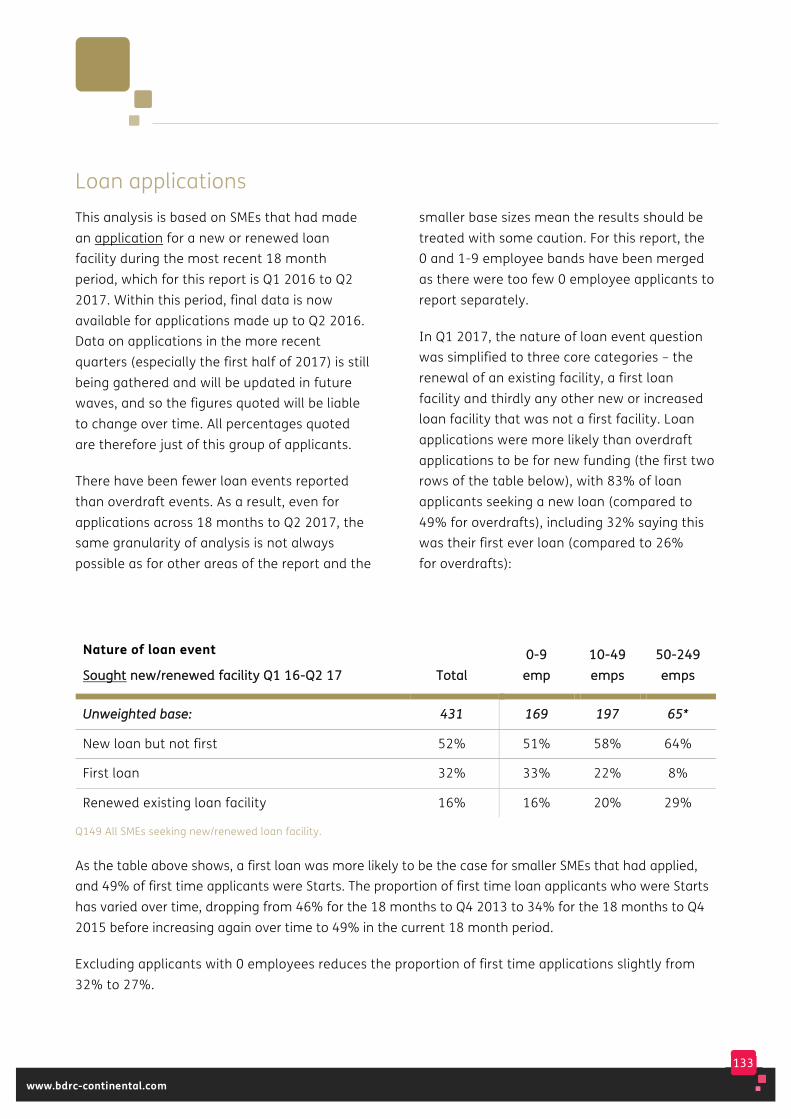
133
www.bdrc-continental.com
Loan applications This analysis is based on SMEs that had made an application for a new or renewed loan facility during the most recent 18 month period, which for this report is Q1 2016 to Q22017. Within this period, final data is now available for applications made up to Q2 2016. Data on applications in the more recent quarters (especially the first half of 2017) is still being gathered and will be updated in future waves, and so the figures quoted will be liable to change over time. All percentages quoted are therefore just of this group of applicants.
There have been fewer loan events reported than overdraft events. As a result, even for applications across 18 months to Q2 2017, the same granularity of analysis is not always possible as for other areas of the report and the
smaller base sizes mean the results should be treated with some caution. For this report, the 0 and 1-9 employee bands have been merged as there were too few 0 employee applicants to report separately.
In Q1 2017, the nature of loan event question was simplified to three core categories – the renewal of an existing facility, a first loan facility and thirdly any other new or increased loan facility that was not a first facility. Loan applications were more likely than overdraft applications to be for new funding (the first two rows of the table below), with 83% of loan applicants seeking a new loan (compared to 49% for overdrafts), including 32% saying this was their first ever loan (compared to 26% for overdrafts):
Nature of loan event
SSoouugghhtt nneeww//rreenneewweedd ffaacciilliittyy QQ11 1166--QQ22 1177 TToottaall 00--99
eemmpp 1100--4499 eemmppss
5500--224499 eemmppss
UUnnwweeiigghhtteedd bbaassee:: 443311 116699 119977 6655**
New loan but not first 52% 51% 58% 64%
First loan 32% 33% 22% 8%
Renewed existing loan facility 16% 16% 20% 29%
Q149 All SMEs seeking new/renewed loan facility.
As the table above shows, a first loan was more likely to be the case for smaller SMEs that had applied, and 49% of first time applicants were Starts. The proportion of first time loan applicants who were Starts has varied over time, dropping from 46% for the 18 months to Q4 2013 to 34% for the 18 months to Q4 2015 before increasing again over time to 49% in the current 18 month period.
Excluding applicants with 0 employees reduces the proportion of first time applications slightly from 32% to 27%.
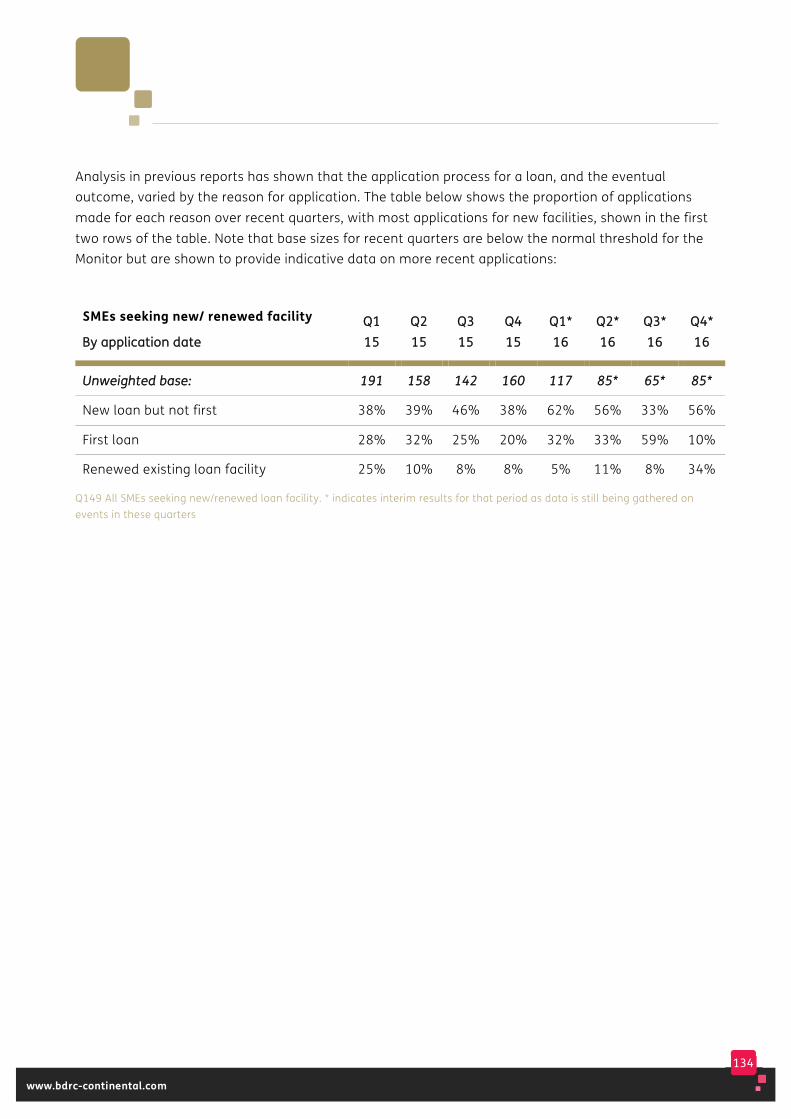
134
www.bdrc-continental.com
Analysis in previous reports has shown that the application process for a loan, and the eventual outcome, varied by the reason for application. The table below shows the proportion of applications made for each reason over recent quarters, with most applications for new facilities, shown in the first two rows of the table. Note that base sizes for recent quarters are below the normal threshold for the Monitor but are shown to provide indicative data on more recent applications:
SMEs seeking new/ renewed facility
BByy aapppplliiccaattiioonn ddaattee QQ11 1155
QQ22 1155
QQ33 1155
QQ44 1155
QQ11** 1166
QQ22** 1166
QQ33** 1166
QQ44** 1166
UUnnwweeiigghhtteedd bbaassee:: 119911 115588 114422 116600 111177 8855** 6655** 8855**
New loan but not first 38% 39% 46% 38% 62% 56% 33% 56%
First loan 28% 32% 25% 20% 32% 33% 59% 10%
Renewed existing loan facility 25% 10% 8% 8% 5% 11% 8% 34%
Q149 All SMEs seeking new/renewed loan facility. * indicates interim results for that period as data is still being gathered on events in these quarters
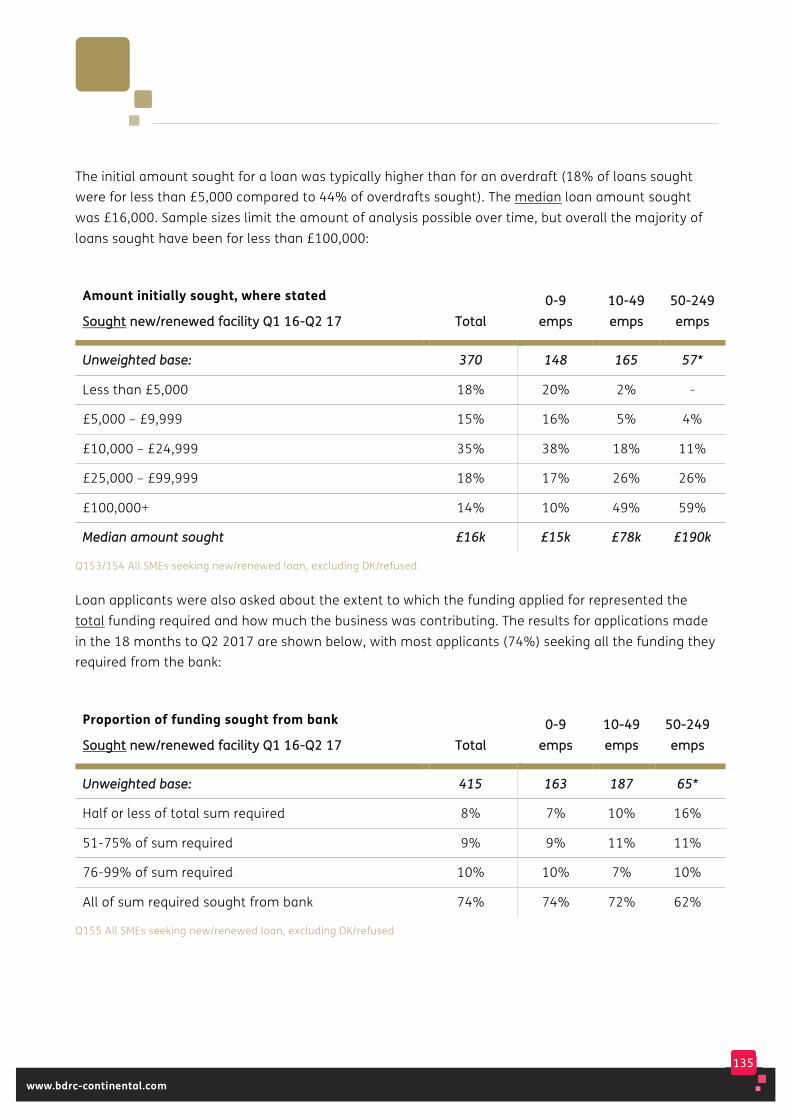
135
www.bdrc-continental.com
The initial amount sought for a loan was typically higher than for an overdraft (18% of loans sought were for less than £5,000 compared to 44% of overdrafts sought). The median loan amount sought was £16,000. Sample sizes limit the amount of analysis possible over time, but overall the majority of loans sought have been for less than £100,000:
Amount initially sought, where stated
SSoouugghhtt nneeww//rreenneewweedd ffaacciilliittyy QQ11 1166--QQ22 1177 TToottaall 00--99
eemmppss 1100--4499 eemmppss
5500--224499 eemmppss
UUnnwweeiigghhtteedd bbaassee:: 337700 114488 116655 5577**
Less than £5,000 18% 20% 2% -
£5,000 – £9,999 15% 16% 5% 4%
£10,000 – £24,999 35% 38% 18% 11%
£25,000 – £99,999 18% 17% 26% 26%
£100,000+ 14% 10% 49% 59%
MMeeddiiaann aammoouunntt ssoouugghhtt ££1166kk ££1155kk ££7788kk ££119900kk
Q153/154 All SMEs seeking new/renewed loan, excluding DK/refused
Loan applicants were also asked about the extent to which the funding applied for represented the total funding required and how much the business was contributing. The results for applications made in the 18 months to Q2 2017 are shown below, with most applicants (74%) seeking all the funding they required from the bank:
Proportion of funding sought from bank
SSoouugghhtt nneeww//rreenneewweedd ffaacciilliittyy QQ11 1166--QQ22 1177 TToottaall 00--99
eemmppss 1100--4499 eemmppss
5500--224499 eemmppss
UUnnwweeiigghhtteedd bbaassee:: 441155 116633 118877 6655**
Half or less of total sum required 8% 7% 10% 16%
51-75% of sum required 9% 9% 11% 11%
76-99% of sum required 10% 10% 7% 10%
All of sum required sought from bank 74% 74% 72% 62%
Q155 All SMEs seeking new/renewed loan, excluding DK/refused
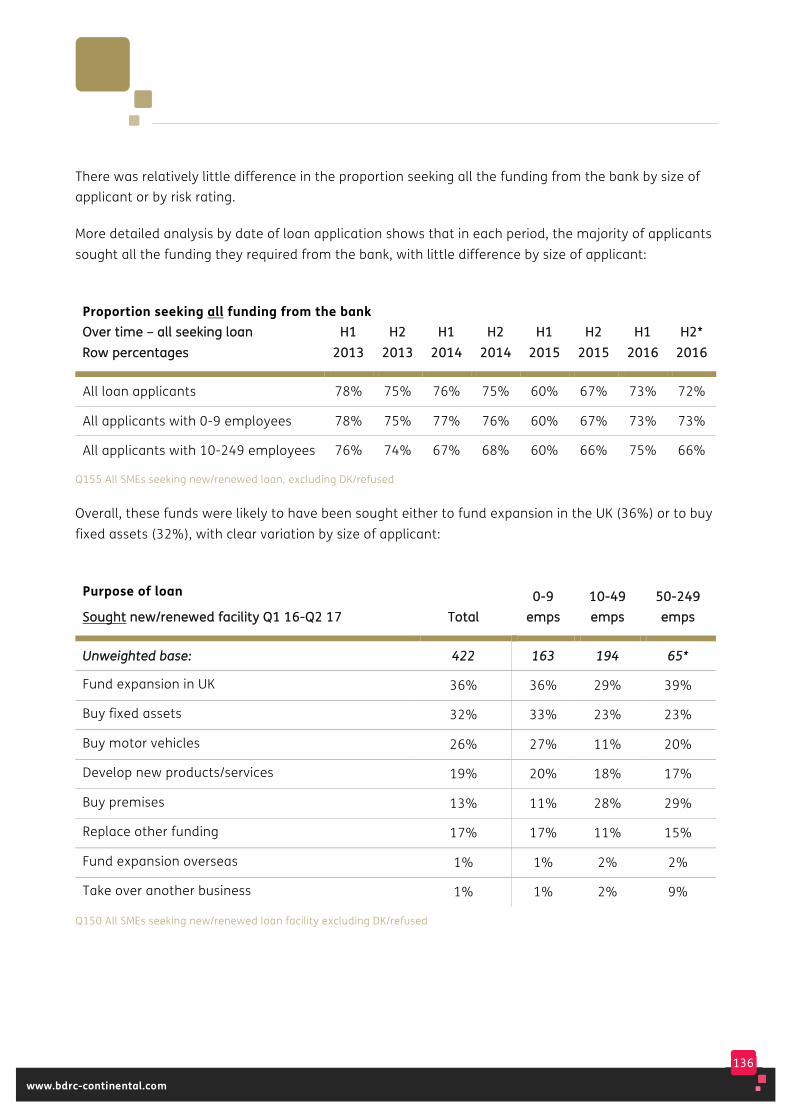
136
www.bdrc-continental.com
There was relatively little difference in the proportion seeking all the funding from the bank by size of applicant or by risk rating.
More detailed analysis by date of loan application shows that in each period, the majority of applicants sought all the funding they required from the bank, with little difference by size of applicant:
Proportion seeking all funding from the bank OOvveerr ttiimmee –– aallll sseeeekkiinngg llooaann RRooww ppeerrcceennttaaggeess
HH11 22001133
HH22 22001133
HH11 22001144
HH22 22001144
HH11 22001155
HH22 22001155
HH11 22001166
HH22** 22001166
All loan applicants 78% 75% 76% 75% 60% 67% 73% 72%
All applicants with 0-9 employees 78% 75% 77% 76% 60% 67% 73% 73%
All applicants with 10-249 employees 76% 74% 67% 68% 60% 66% 75% 66%
Q155 All SMEs seeking new/renewed loan, excluding DK/refused
Overall, these funds were likely to have been sought either to fund expansion in the UK (36%) or to buy fixed assets (32%), with clear variation by size of applicant:
Purpose of loan
SSoouugghhtt nneeww//rreenneewweedd ffaacciilliittyy QQ11 1166--QQ22 1177 TToottaall 00--99
eemmppss 1100--4499 eemmppss
5500--224499 eemmppss
UUnnwweeiigghhtteedd bbaassee:: 442222 116633 119944 6655**
Fund expansion in UK 36% 36% 29% 39%
Buy fixed assets 32% 33% 23% 23%
Buy motor vehicles 26% 27% 11% 20%
Develop new products/services 19% 20% 18% 17%
Buy premises 13% 11% 28% 29%
Replace other funding 17% 17% 11% 15%
Fund expansion overseas 1% 1% 2% 2%
Take over another business 1% 1% 2% 9%
Q150 All SMEs seeking new/renewed loan facility excluding DK/refused
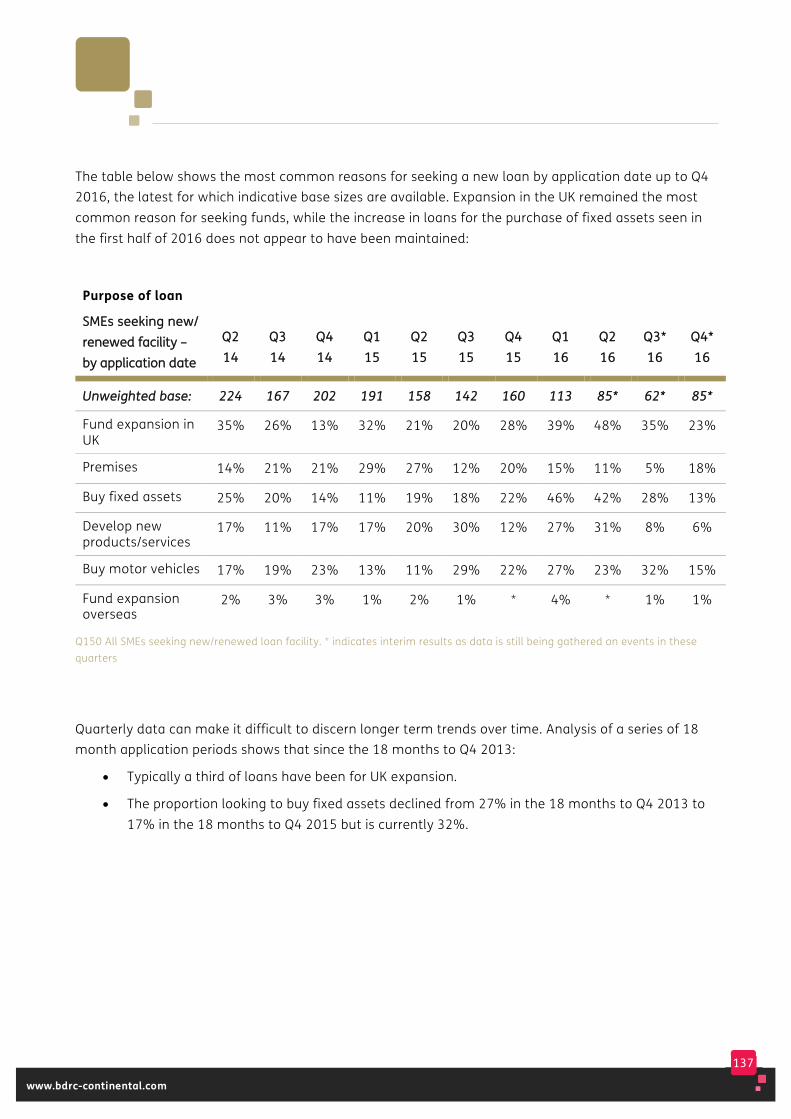
137
www.bdrc-continental.com
The table below shows the most common reasons for seeking a new loan by application date up to Q4 2016, the latest for which indicative base sizes are available. Expansion in the UK remained the most common reason for seeking funds, while the increase in loans for the purchase of fixed assets seen in the first half of 2016 does not appear to have been maintained:
Purpose of loan
SSMMEEss sseeeekkiinngg nneeww// rreenneewweedd ffaacciilliittyy –– bbyy aapppplliiccaattiioonn ddaattee
QQ22 1144
QQ33 1144
QQ44 1144
QQ11 1155
QQ22 1155
QQ33 1155
QQ44 1155
QQ11 1166
QQ22 1166
QQ33** 1166
QQ44** 1166
UUnnwweeiigghhtteedd bbaassee:: 222244 116677 220022 119911 115588 114422 116600 111133 8855** 6622** 8855**
Fund expansion in UK
35% 26% 13% 32% 21% 20% 28% 39% 48% 35% 23%
Premises 14% 21% 21% 29% 27% 12% 20% 15% 11% 5% 18%
Buy fixed assets 25% 20% 14% 11% 19% 18% 22% 46% 42% 28% 13%
Develop new products/services
17% 11% 17% 17% 20% 30% 12% 27% 31% 8% 6%
Buy motor vehicles 17% 19% 23% 13% 11% 29% 22% 27% 23% 32% 15%
Fund expansion overseas
2% 3% 3% 1% 2% 1% * 4% * 1% 1%
Q150 All SMEs seeking new/renewed loan facility. * indicates interim results as data is still being gathered on events in these quarters
Quarterly data can make it difficult to discern longer term trends over time. Analysis of a series of 18 month application periods shows that since the 18 months to Q4 2013:
• Typically a third of loans have been for UK expansion.
• The proportion looking to buy fixed assets declined from 27% in the 18 months to Q4 2013 to 17% in the 18 months to Q4 2015 but is currently 32%.
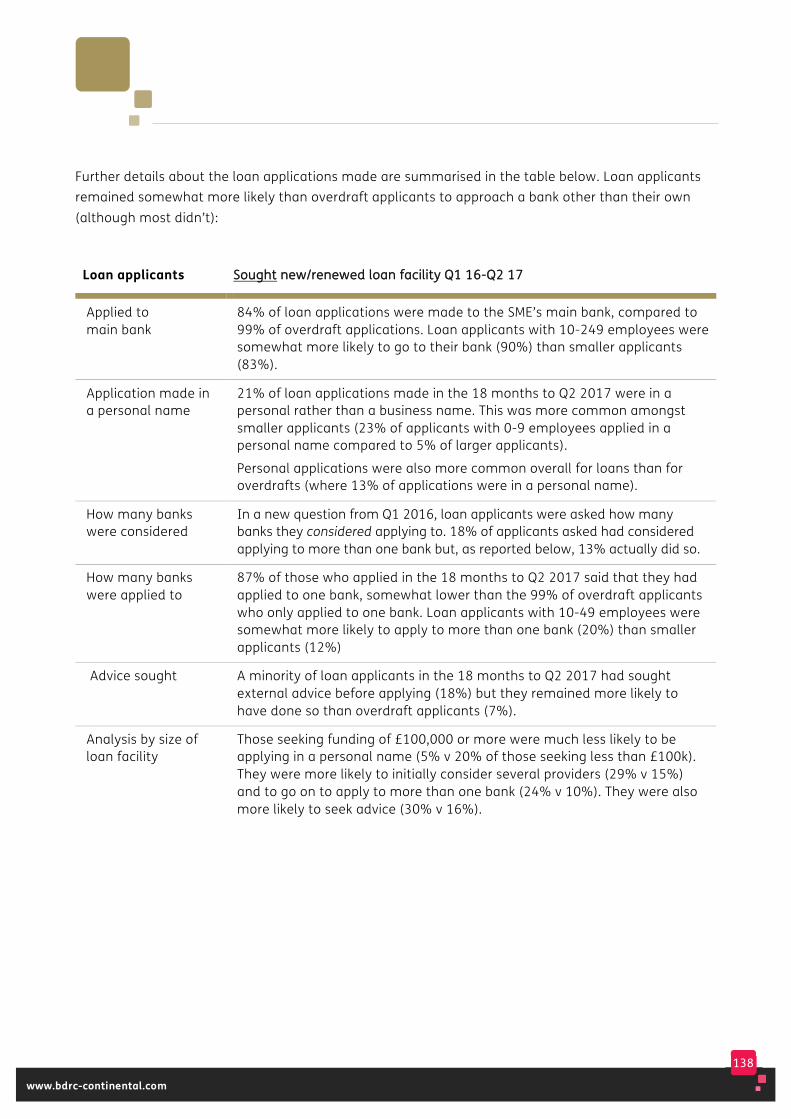
138
www.bdrc-continental.com
Further details about the loan applications made are summarised in the table below. Loan applicants remained somewhat more likely than overdraft applicants to approach a bank other than their own (although most didn’t):
Loan applicants SSoouugghhtt nneeww//rreenneewweedd llooaann ffaacciilliittyy QQ11 1166--QQ22 1177
Applied to main bank
84% of loan applications were made to the SME’s main bank, compared to 99% of overdraft applications. Loan applicants with 10-249 employees were somewhat more likely to go to their bank (90%) than smaller applicants (83%).
Application made in a personal name
21% of loan applications made in the 18 months to Q2 2017 were in a personal rather than a business name. This was more common amongst smaller applicants (23% of applicants with 0-9 employees applied in a personal name compared to 5% of larger applicants).
Personal applications were also more common overall for loans than for overdrafts (where 13% of applications were in a personal name).
How many banks were considered
In a new question from Q1 2016, loan applicants were asked how many banks they considered applying to. 18% of applicants asked had considered applying to more than one bank but, as reported below, 13% actually did so.
How many banks were applied to
87% of those who applied in the 18 months to Q2 2017 said that they had applied to one bank, somewhat lower than the 99% of overdraft applicants who only applied to one bank. Loan applicants with 10-49 employees were somewhat more likely to apply to more than one bank (20%) than smaller applicants (12%)
Advice sought A minority of loan applicants in the 18 months to Q2 2017 had sought external advice before applying (18%) but they remained more likely to have done so than overdraft applicants (7%).
Analysis by size of loan facility
Those seeking funding of £100,000 or more were much less likely to be applying in a personal name (5% v 20% of those seeking less than £100k). They were more likely to initially consider several providers (29% v 15%)and to go on to apply to more than one bank (24% v 10%). They were also more likely to seek advice (30% v 16%).
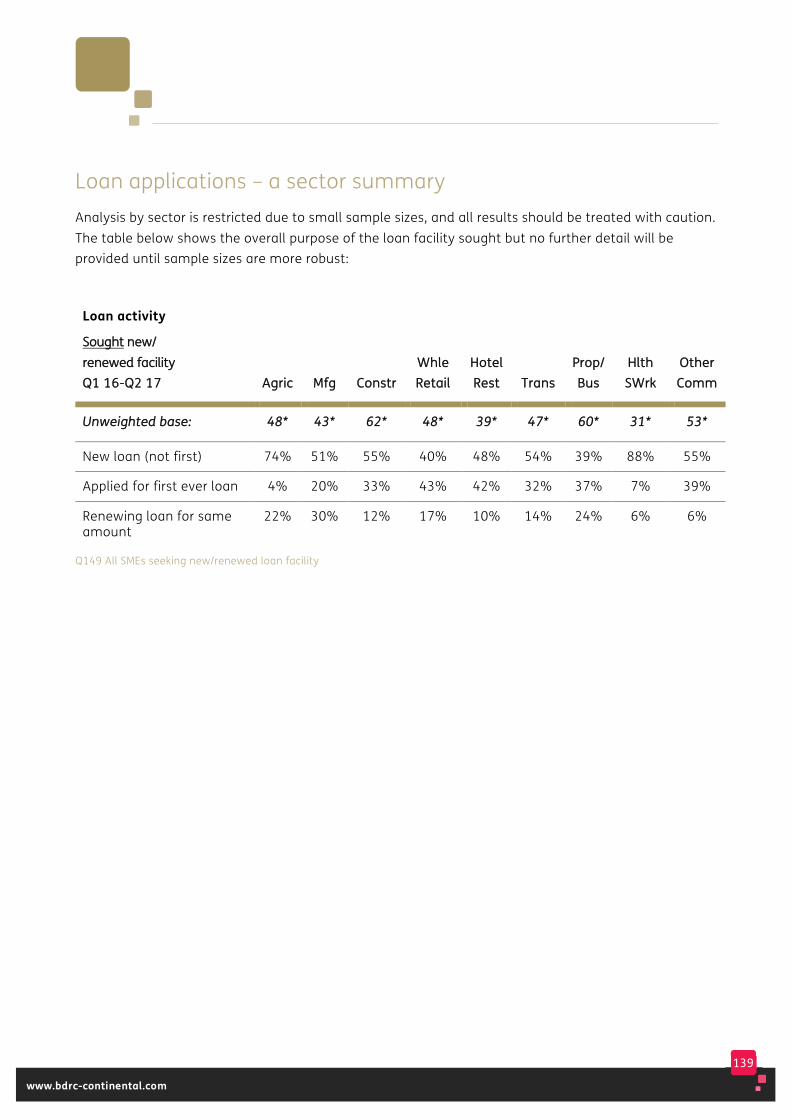
139
www.bdrc-continental.com
Loan applications – a sector summary Analysis by sector is restricted due to small sample sizes, and all results should be treated with caution. The table below shows the overall purpose of the loan facility sought but no further detail will be provided until sample sizes are more robust:
Loan activity
SSoouugghhtt nneeww// rreenneewweedd ffaacciilliittyy QQ11 1166--QQ22 1177 AAggrriicc MMffgg CCoonnssttrr
WWhhllee RReettaaiill
HHootteell RReesstt TTrraannss
PPrroopp// BBuuss
HHlltthh SSWWrrkk
OOtthheerr CCoommmm
UUnnwweeiigghhtteedd bbaassee:: 4488** 4433** 6622** 4488** 3399** 4477** 6600** 3311** 5533**
New loan (not first) 74% 51% 55% 40% 48% 54% 39% 88% 55%
Applied for first ever loan 4% 20% 33% 43% 42% 32% 37% 7% 39%
Renewing loan for same amount
22% 30% 12% 17% 10% 14% 24% 6% 6%
Q149 All SMEs seeking new/renewed loan facility
140
www.bdrc-continental.com
9. The outcome of the application/ renewal
This chapter details what happened when the application for the new/renewed facility was
made. It covers the bank’s initial response through to the final outcome.

141
www.bdrc-continental.com
Key findings In the 18 months to Q2 2017, 78% of all loan and overdraft applications resulted in a facility. This was somewhat lower than the 82% success rate recorded for the 18 months to Q4 2015, but still higher than the 68% recorded for the 18 months to Q4 2013.
• Loan and overdraft renewals remained the most likely to be successful (96% v 100% for the 18 months to Q4 2015)
• The success rate for applications for new loan or overdraft funding was somewhat lower, at 63%. It was also somewhat lower than the 70% seen for the 18 months to Q4 2015, a decline seen amongst both first time applicants (53% from 60%) and those applying for a new facility (73% from 77%)
• 16% of all loan and overdraft applicants ended the process without a facility. This is little changed over recent periods as slightly more applicants took other funding, but remains lower than the 26% of applicants ending the process without a facility in the 18 months to both Q4 2012 and Q4 2013.
82% of overdraft applicants ended the process with a facility.
• Larger SMEs, those renewing an existing facility and those trading for more than 6 years remained more likely to end the process with a facility
• Current success rates are somewhat lower than the 86% recorded for the 18 months to Q4 2015. This is due to lower success rates for 0 employee applicants, those with a worse than average risk rating and those applying for new money, especially first time applicants
• 12% of applicants ended the process with no facility.
142
www.bdrc-continental.com
68% of loan applicants ended the process with a facility
• Larger SMEs, those renewing an existing facility and those trading for more than 10 years remained more likely to end the process with a facility
• Current success rates are somewhat lower than the 76% recorded for the 18 months to Q2 2016. This is due to lower success rates for 0 employee applicants and those with an average risk rating
• 25% of 25% of applicants ended the process with no facility. There is little sign yet of the referrals process, introduced in Autumn 2016, having an impact on this initially declined.
Analysis of predicted and actual success rates suggests recent overdraft applicants have been somewhat more successful than their profile would suggest, while loan applicants have typically been in line.
143
www.bdrc-continental.com
This chapter follows the application journey from the initial response from the bank to the final decision. More detailed analysis is provided of the final outcome over time, and also the experiences of those applying for new funding compared to those seeking a renewal of existing facilities. Note that, unless specifically stated, this data does not include the automatic renewal of overdrafts, and that, as already explained, data for applications reported as having taken place from Q3 2016 onwards remains interim.
7% of loan and 5% of overdraft applicants in the 18 months to Q2 2017 had not received an initial
response to their application by the time of our survey. Details of these applications were included in the data in the preceding chapter but are excluded from the remainder of this analysis.
Analysis in previous reports has shown that the outcome of applications reported initially for a given quarter can be quite different from those reported subsequently as more data is gathered, and so results for the most recent quarters should always be viewed in this context. Full quarterly data on all applications since the SME Finance Monitor started can be found in the charts at the end of this report.
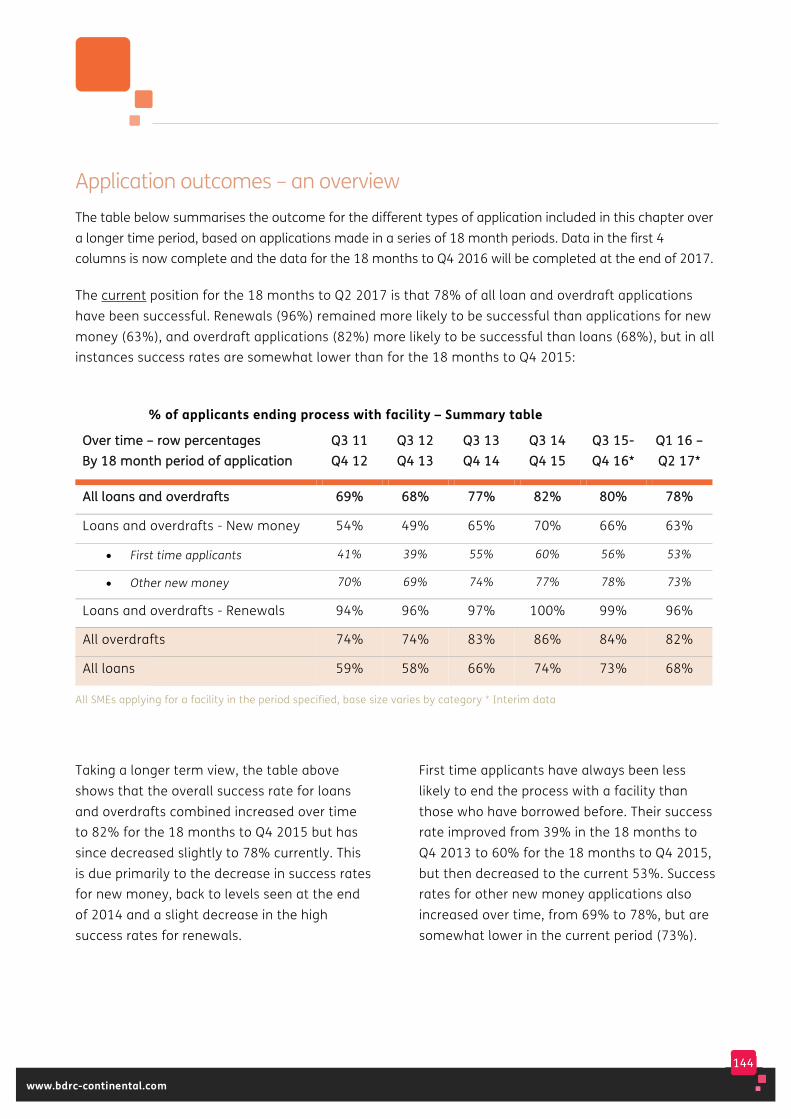
144
www.bdrc-continental.com
Application outcomes – an overview The table below summarises the outcome for the different types of application included in this chapter over a longer time period, based on applications made in a series of 18 month periods. Data in the first 4 columns is now complete and the data for the 18 months to Q4 2016 will be completed at the end of 2017.
The current position for the 18 months to Q2 2017 is that 78% of all loan and overdraft applications have been successful. Renewals (96%) remained more likely to be successful than applications for new money (63%), and overdraft applications (82%) more likely to be successful than loans (68%), but in all instances success rates are somewhat lower than for the 18 months to Q4 2015:
% of applicants ending process with facility – Summary table
OOvveerr ttiimmee –– rrooww ppeerrcceennttaaggeess BByy 1188 mmoonntthh ppeerriioodd ooff aapppplliiccaattiioonn
QQ33 1111 QQ44 1122
QQ33 1122 QQ44 1133
QQ33 1133 QQ44 1144
QQ33 1144 QQ44 1155
QQ33 1155-- QQ44 1166**
QQ11 1166 –– QQ22 1177**
AAllll llooaannss aanndd oovveerrddrraaffttss 6699%% 6688%% 7777%% 8822%% 8800%% 7788%%
Loans and overdrafts - New money 54% 49% 65% 70% 66% 63%
• First time applicants 41% 39% 55% 60% 56% 53%
• Other new money 70% 69% 74% 77% 78% 73%
Loans and overdrafts - Renewals 94% 96% 97% 100% 99% 96%
All overdrafts 74% 74% 83% 86% 84% 82%
All loans 59% 58% 66% 74% 73% 68%
All SMEs applying for a facility in the period specified, base size varies by category * Interim data
Taking a longer term view, the table above shows that the overall success rate for loans and overdrafts combined increased over time to 82% for the 18 months to Q4 2015 but has since decreased slightly to 78% currently. This is due primarily to the decrease in success rates for new money, back to levels seen at the end of 2014 and a slight decrease in the high success rates for renewals.
First time applicants have always been less likely to end the process with a facility than those who have borrowed before. Their success rate improved from 39% in the 18 months to Q4 2013 to 60% for the 18 months to Q4 2015, but then decreased to the current 53%. Success rates for other new money applications also increased over time, from 69% to 78%, but are somewhat lower in the current period (73%).
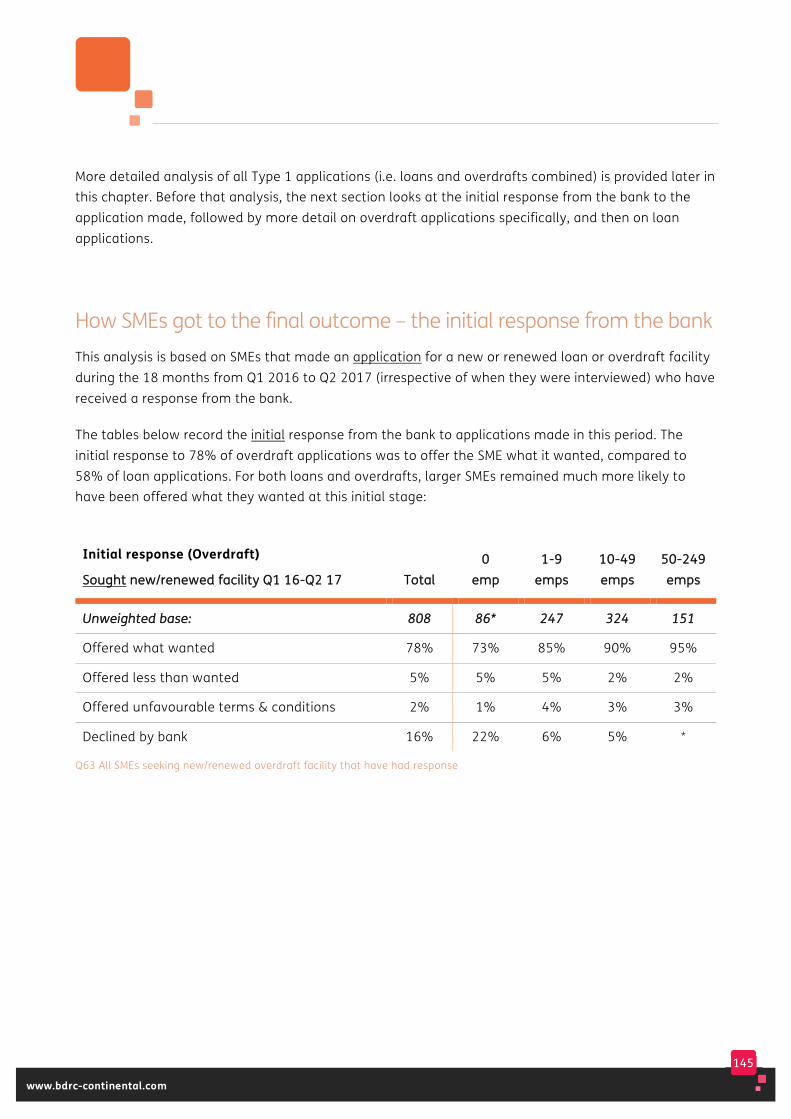
145
www.bdrc-continental.com
More detailed analysis of all Type 1 applications (i.e. loans and overdrafts combined) is provided later in this chapter. Before that analysis, the next section looks at the initial response from the bank to the application made, followed by more detail on overdraft applications specifically, and then on loan applications.
How SMEs got to the final outcome – the initial response from the bank This analysis is based on SMEs that made an application for a new or renewed loan or overdraft facility during the 18 months from Q1 2016 to Q2 2017 (irrespective of when they were interviewed) who have received a response from the bank.
The tables below record the initial response from the bank to applications made in this period. The initial response to 78% of overdraft applications was to offer the SME what it wanted, compared to 58% of loan applications. For both loans and overdrafts, larger SMEs remained much more likely to have been offered what they wanted at this initial stage:
Initial response (Overdraft)
SSoouugghhtt nneeww//rreenneewweedd ffaacciilliittyy QQ11 1166--QQ22 1177 TToottaall 00
eemmpp 11--99
eemmppss 1100--4499 eemmppss
5500--224499 eemmppss
UUnnwweeiigghhtteedd bbaassee:: 880088 8866** 224477 332244 115511
Offered what wanted 78% 73% 85% 90% 95%
Offered less than wanted 5% 5% 5% 2% 2%
Offered unfavourable terms & conditions 2% 1% 4% 3% 3%
Declined by bank 16% 22% 6% 5% *
Q63 All SMEs seeking new/renewed overdraft facility that have had response
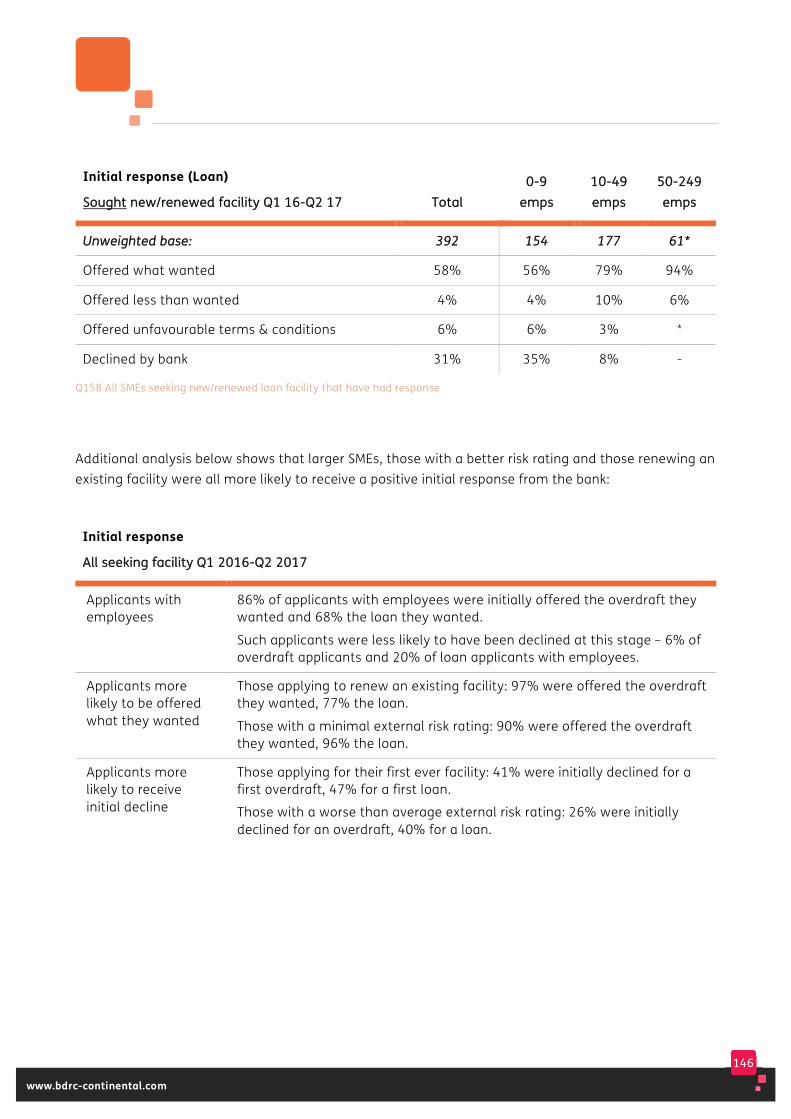
146
www.bdrc-continental.com
Initial response (Loan)
SSoouugghhtt nneeww//rreenneewweedd ffaacciilliittyy QQ11 1166--QQ22 1177 TToottaall 00--99
eemmppss 1100--4499 eemmppss
5500--224499 eemmppss
UUnnwweeiigghhtteedd bbaassee:: 339922 115544 117777 6611**
Offered what wanted 58% 56% 79% 94%
Offered less than wanted 4% 4% 10% 6%
Offered unfavourable terms & conditions 6% 6% 3% *
Declined by bank 31% 35% 8% -
Q158 All SMEs seeking new/renewed loan facility that have had response
Additional analysis below shows that larger SMEs, those with a better risk rating and those renewing an existing facility were all more likely to receive a positive initial response from the bank:
Initial response
AAllll sseeeekkiinngg ffaacciilliittyy QQ11 22001166--QQ22 22001177
Applicants with employees
86% of applicants with employees were initially offered the overdraft they wanted and 68% the loan they wanted.
Such applicants were less likely to have been declined at this stage – 6% of overdraft applicants and 20% of loan applicants with employees.
Applicants more likely to be offered what they wanted
Those applying to renew an existing facility: 97% were offered the overdraft they wanted, 77% the loan.
Those with a minimal external risk rating: 90% were offered the overdraft they wanted, 96% the loan.
Applicants more likely to receive initial decline
Those applying for their first ever facility: 41% were initially declined for a first overdraft, 47% for a first loan.
Those with a worse than average external risk rating: 26% were initially declined for an overdraft, 40% for a loan.
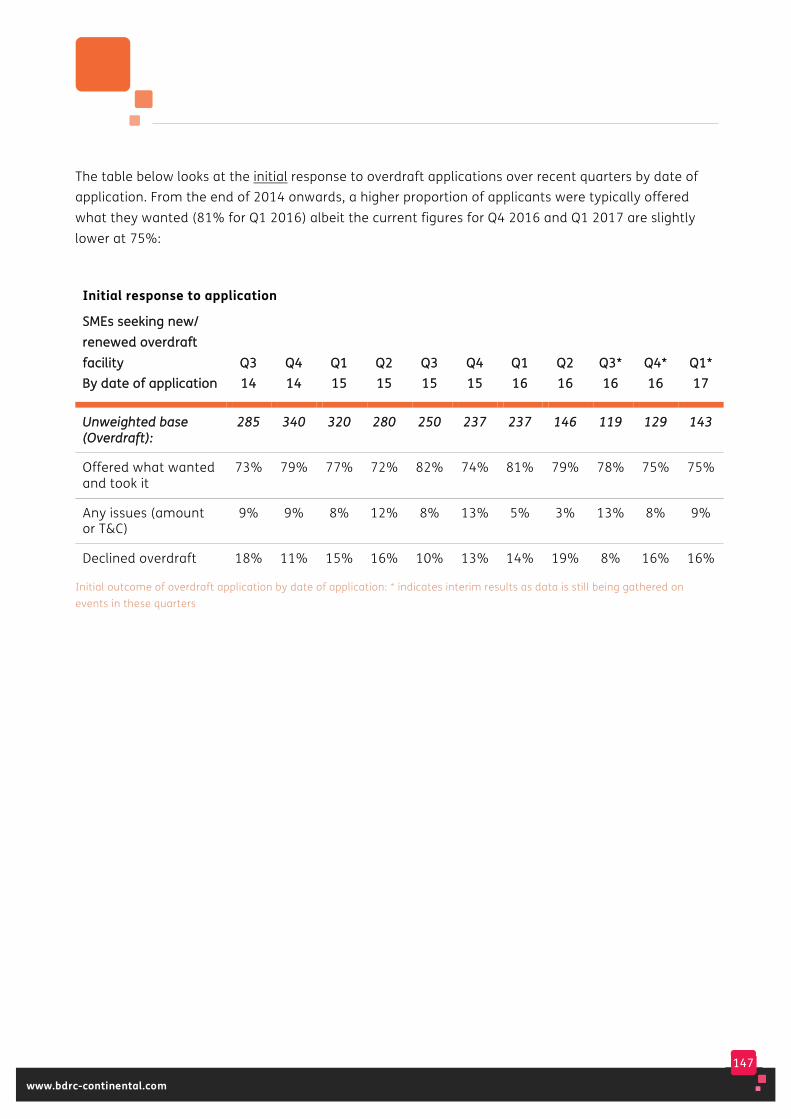
147
www.bdrc-continental.com
The table below looks at the initial response to overdraft applications over recent quarters by date of application. From the end of 2014 onwards, a higher proportion of applicants were typically offered what they wanted (81% for Q1 2016) albeit the current figures for Q4 2016 and Q1 2017 are slightly lower at 75%:
Initial response to application
SSMMEEss sseeeekkiinngg nneeww// rreenneewweedd oovveerrddrraafftt ffaacciilliittyy BByy ddaattee ooff aapppplliiccaattiioonn
QQ33 1144
QQ44 1144
QQ11 1155
QQ22 1155
QQ33 1155
QQ44 1155
QQ11 1166
QQ22 1166
QQ33** 1166
QQ44** 1166
QQ11** 1177
UUnnwweeiigghhtteedd bbaassee ((OOvveerrddrraafftt))::
228855 334400 332200 228800 225500 223377 223377 114466 111199 112299 114433
Offered what wanted and took it
73% 79% 77% 72% 82% 74% 81% 79% 78% 75% 75%
Any issues (amount or T&C)
9% 9% 8% 12% 8% 13% 5% 3% 13% 8% 9%
Declined overdraft 18% 11% 15% 16% 10% 13% 14% 19% 8% 16% 16%
Initial outcome of overdraft application by date of application: * indicates interim results as data is still being gathered on events in these quarters
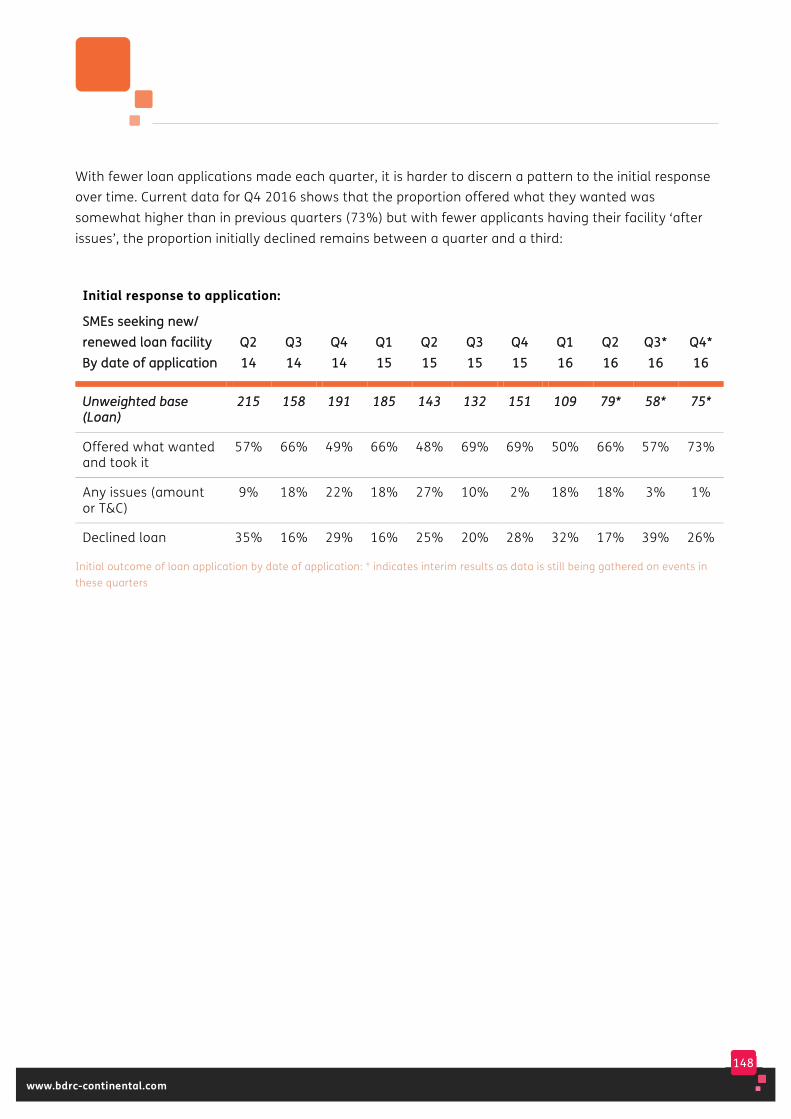
148
www.bdrc-continental.com
With fewer loan applications made each quarter, it is harder to discern a pattern to the initial response over time. Current data for Q4 2016 shows that the proportion offered what they wanted was somewhat higher than in previous quarters (73%) but with fewer applicants having their facility ‘after issues’, the proportion initially declined remains between a quarter and a third:
Initial response to application:
SSMMEEss sseeeekkiinngg nneeww// rreenneewweedd llooaann ffaacciilliittyy BByy ddaattee ooff aapppplliiccaattiioonn
QQ22 1144
QQ33 1144
QQ44 1144
QQ11 1155
QQ22 1155
QQ33 1155
QQ44 1155
QQ11 1166
QQ22 1166
QQ33** 1166
QQ44** 1166
UUnnwweeiigghhtteedd bbaassee ((LLooaann))
221155 115588 119911 118855 114433 113322 115511 110099 7799** 5588** 7755**
Offered what wanted and took it
57% 66% 49% 66% 48% 69% 69% 50% 66% 57% 73%
Any issues (amount or T&C)
9% 18% 22% 18% 27% 10% 2% 18% 18% 3% 1%
Declined loan 35% 16% 29% 16% 25% 20% 28% 32% 17% 39% 26%
Initial outcome of loan application by date of application: * indicates interim results as data is still being gathered on events in these quarters
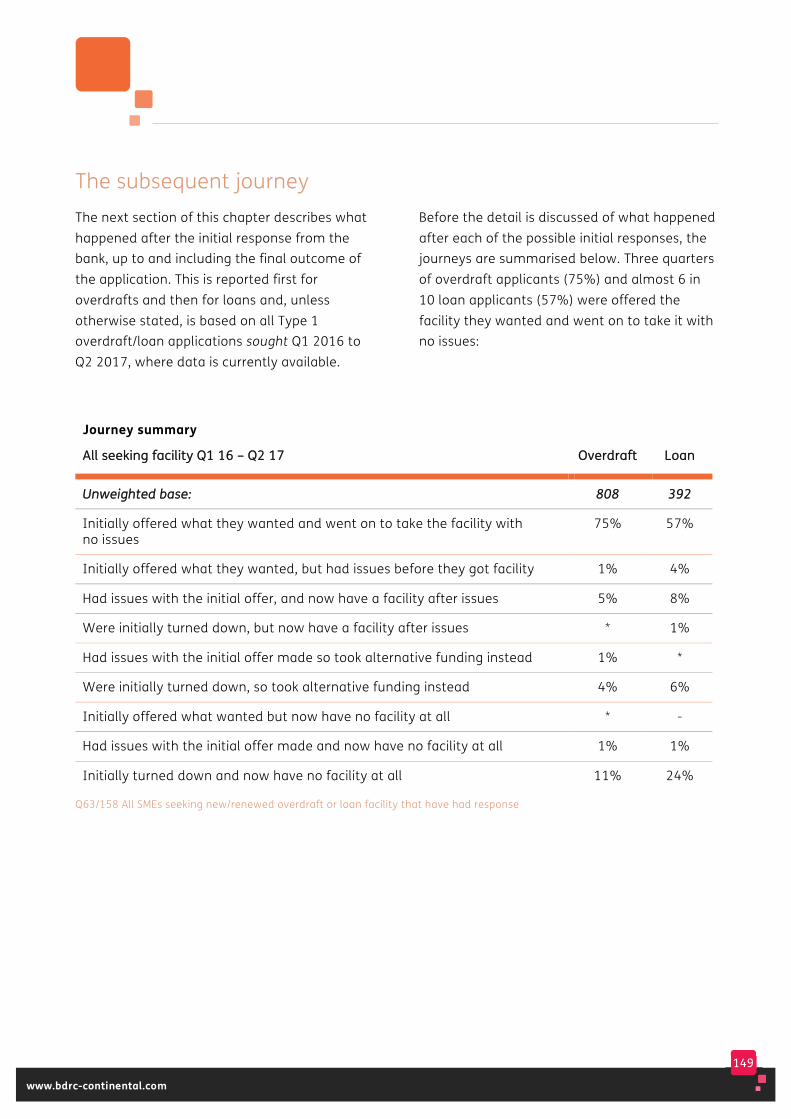
149
www.bdrc-continental.com
The subsequent journey The next section of this chapter describes what happened after the initial response from the bank, up to and including the final outcome of the application. This is reported first for overdrafts and then for loans and, unless otherwise stated, is based on all Type 1 overdraft/loan applications sought Q1 2016 to Q2 2017, where data is currently available.
Before the detail is discussed of what happened after each of the possible initial responses, the journeys are summarised below. Three quarters of overdraft applicants (75%) and almost 6 in10 loan applicants (57%) were offered the facility they wanted and went on to take it with no issues:
Journey summary
AAllll sseeeekkiinngg ffaacciilliittyy QQ11 1166 –– QQ22 1177 OOvveerrddrraafftt LLooaann
UUnnwweeiigghhtteedd bbaassee:: 880088 339922
Initially offered what they wanted and went on to take the facility with no issues
75% 57%
Initially offered what they wanted, but had issues before they got facility 1% 4%
Had issues with the initial offer, and now have a facility after issues 5% 8%
Were initially turned down, but now have a facility after issues * 1%
Had issues with the initial offer made so took alternative funding instead 1% *
Were initially turned down, so took alternative funding instead 4% 6%
Initially offered what wanted but now have no facility at all * -
Had issues with the initial offer made and now have no facility at all 1% 1%
Initially turned down and now have no facility at all 11% 24%
Q63/158 All SMEs seeking new/renewed overdraft or loan facility that have had response
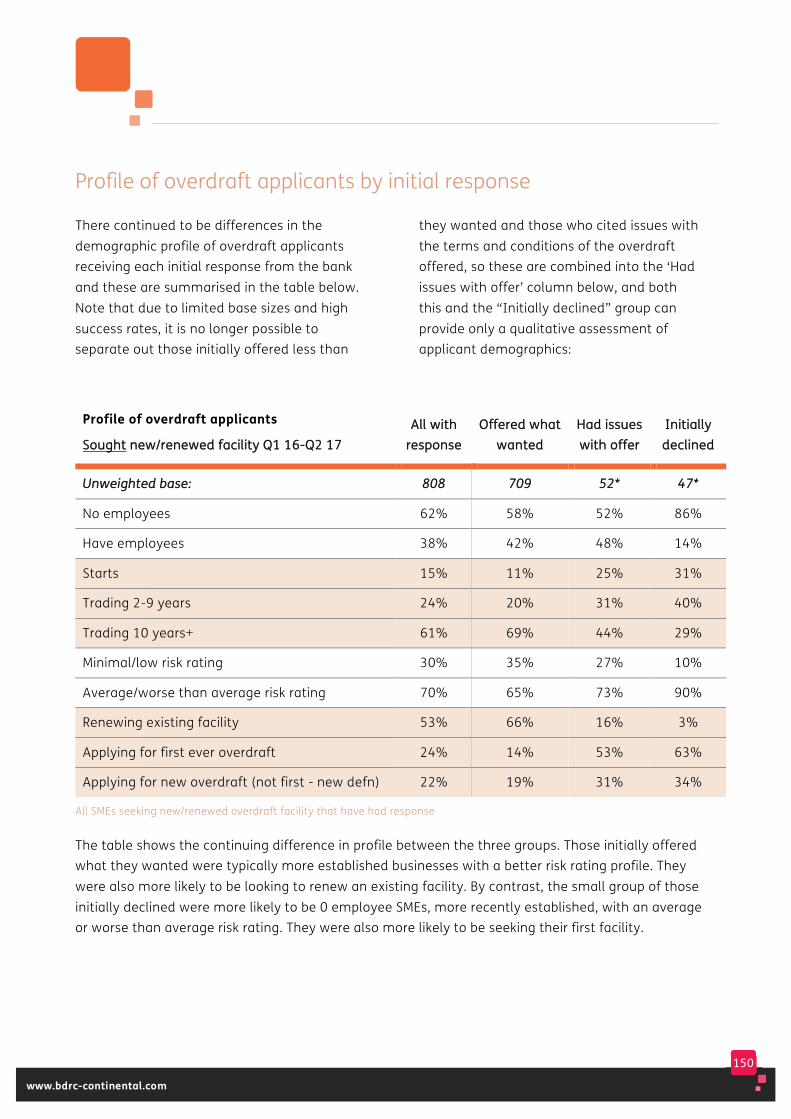
150
www.bdrc-continental.com
Profile of overdraft applicants by initial response
There continued to be differences in the demographic profile of overdraft applicants receiving each initial response from the bank and these are summarised in the table below. Note that due to limited base sizes and high success rates, it is no longer possible to separate out those initially offered less than
they wanted and those who cited issues with the terms and conditions of the overdraft offered, so these are combined into the ‘Had issues with offer’ column below, and both this and the “Initially declined” group can provide only a qualitative assessment of applicant demographics:
Profile of overdraft applicants
SSoouugghhtt nneeww//rreenneewweedd ffaacciilliittyy QQ11 1166--QQ22 1177 AAllll wwiitthh
rreessppoonnssee OOffffeerreedd wwhhaatt
wwaanntteedd HHaadd iissssuueess wwiitthh ooffffeerr
IInniittiiaallllyy ddeecclliinneedd
UUnnwweeiigghhtteedd bbaassee:: 880088 770099 5522** 4477**
No employees 62% 58% 52% 86%
Have employees 38% 42% 48% 14%
Starts 15% 11% 25% 31%
Trading 2-9 years 24% 20% 31% 40%
Trading 10 years+ 61% 69% 44% 29%
Minimal/low risk rating 30% 35% 27% 10%
Average/worse than average risk rating 70% 65% 73% 90%
Renewing existing facility 53% 66% 16% 3%
Applying for first ever overdraft 24% 14% 53% 63%
Applying for new overdraft (not first - new defn) 22% 19% 31% 34%
All SMEs seeking new/renewed overdraft facility that have had response
The table shows the continuing difference in profile between the three groups. Those initially offered what they wanted were typically more established businesses with a better risk rating profile. They were also more likely to be looking to renew an existing facility. By contrast, the small group of those initially declined were more likely to be 0 employee SMEs, more recently established, with an average or worse than average risk rating. They were also more likely to be seeking their first facility.
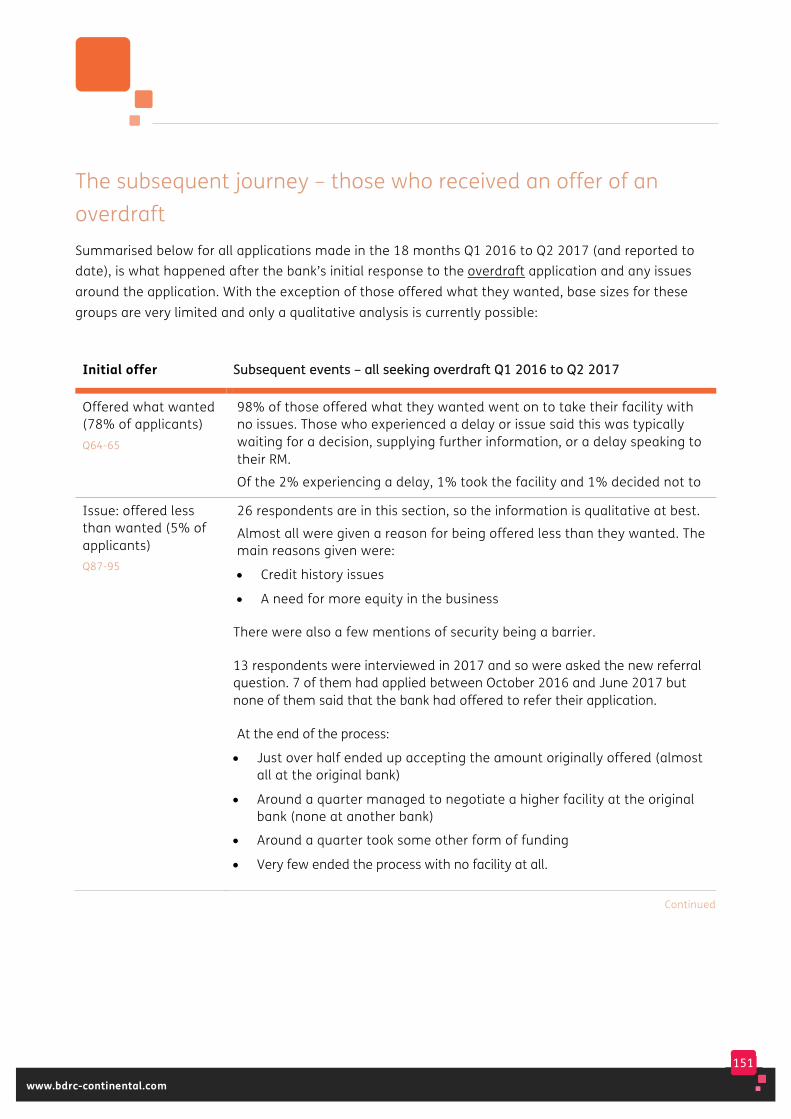
151
www.bdrc-continental.com
The subsequent journey – those who received an offer of an overdraft Summarised below for all applications made in the 18 months Q1 2016 to Q2 2017 (and reported to date), is what happened after the bank’s initial response to the overdraft application and any issues around the application. With the exception of those offered what they wanted, base sizes for these groups are very limited and only a qualitative analysis is currently possible:
Initial offer SSuubbsseeqquueenntt eevveennttss –– aallll sseeeekkiinngg oovveerrddrraafftt QQ11 22001166 ttoo QQ22 22001177
Offered what wanted (78% of applicants) Q64-65
98% of those offered what they wanted went on to take their facility with no issues. Those who experienced a delay or issue said this was typically waiting for a decision, supplying further information, or a delay speaking to their RM.
Of the 2% experiencing a delay, 1% took the facility and 1% decided not to
Issue: offered less than wanted (5% of applicants) Q87-95
26 respondents are in this section, so the information is qualitative at best.
Almost all were given a reason for being offered less than they wanted. The main reasons given were:
• Credit history issues
• A need for more equity in the business
There were also a few mentions of security being a barrier.
13 respondents were interviewed in 2017 and so were asked the new referral question. 7 of them had applied between October 2016 and June 2017 but none of them said that the bank had offered to refer their application.
At the end of the process:
• Just over half ended up accepting the amount originally offered (almost all at the original bank)
• Around a quarter managed to negotiate a higher facility at the original bank (none at another bank)
• Around a quarter took some other form of funding
• Very few ended the process with no facility at all.
Continued

152
www.bdrc-continental.com
Continued
Issue: offered unfavourable T&C (2% of applicants) Q96-97
26 respondents are in this section, so the information is qualitative at best.
The unfavourable terms and conditions were most likely to relate to:
• the proposed fee – 4 in 10 of these applicants
• security (the amount, type sought or cost of putting it in place) –4 in 10
• the proposed interest rate – 2 in 10
13 respondents were interviewed in 2017 and so were asked the new referral question. 9 of them had applied between October 2016 and June 2017 and 2 of them said that the bank had offered to refer their application. Neither of these applicants agreed to be referred – 1 said that they didn’t think it would change anything and 1 that they found the funding elsewhere.
At the end of the process:
• 4 in 10 applicants offered what they saw as unfavourable terms and conditions said they accepted the deal they were offered (almost all at the original bank)
• 3 in 10 managed to negotiate a better deal than the one originally offered – almost all at the bank they had originally applied to
• Less than 5% took other funding (typically funding in a personal name)
• Around a quarter decided not to proceed with an overdraft.
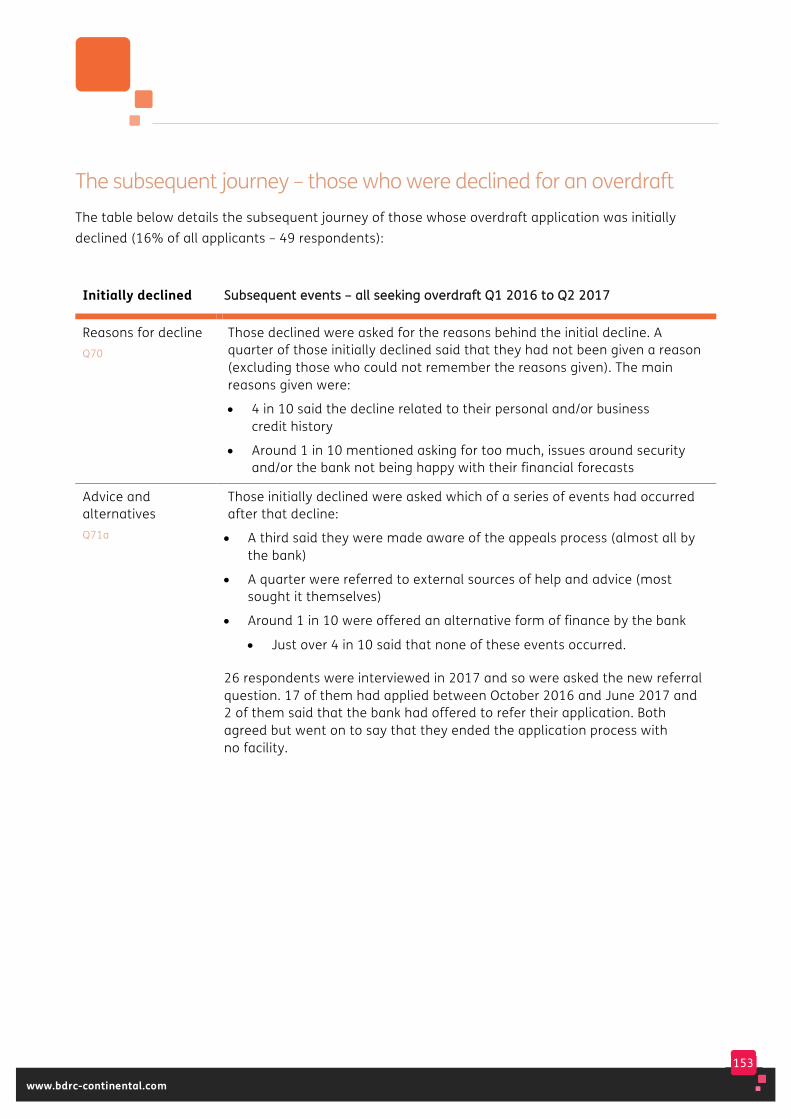
153
www.bdrc-continental.com
The subsequent journey – those who were declined for an overdraft The table below details the subsequent journey of those whose overdraft application was initially declined (16% of all applicants – 49 respondents):
Initially declined SSuubbsseeqquueenntt eevveennttss –– aallll sseeeekkiinngg oovveerrddrraafftt QQ11 22001166 ttoo QQ22 22001177
Reasons for decline Q70
Those declined were asked for the reasons behind the initial decline. A quarter of those initially declined said that they had not been given a reason (excluding those who could not remember the reasons given). The main reasons given were:
• 4 in 10 said the decline related to their personal and/or business credit history
• Around 1 in 10 mentioned asking for too much, issues around security and/or the bank not being happy with their financial forecasts
Advice and alternatives Q71a
Those initially declined were asked which of a series of events had occurred after that decline:
• A third said they were made aware of the appeals process (almost all by the bank)
• A quarter were referred to external sources of help and advice (most sought it themselves)
• Around 1 in 10 were offered an alternative form of finance by the bank
• Just over 4 in 10 said that none of these events occurred.
26 respondents were interviewed in 2017 and so were asked the new referral question. 17 of them had applied between October 2016 and June 2017 and 2 of them said that the bank had offered to refer their application. Both agreed but went on to say that they ended the application process with no facility.
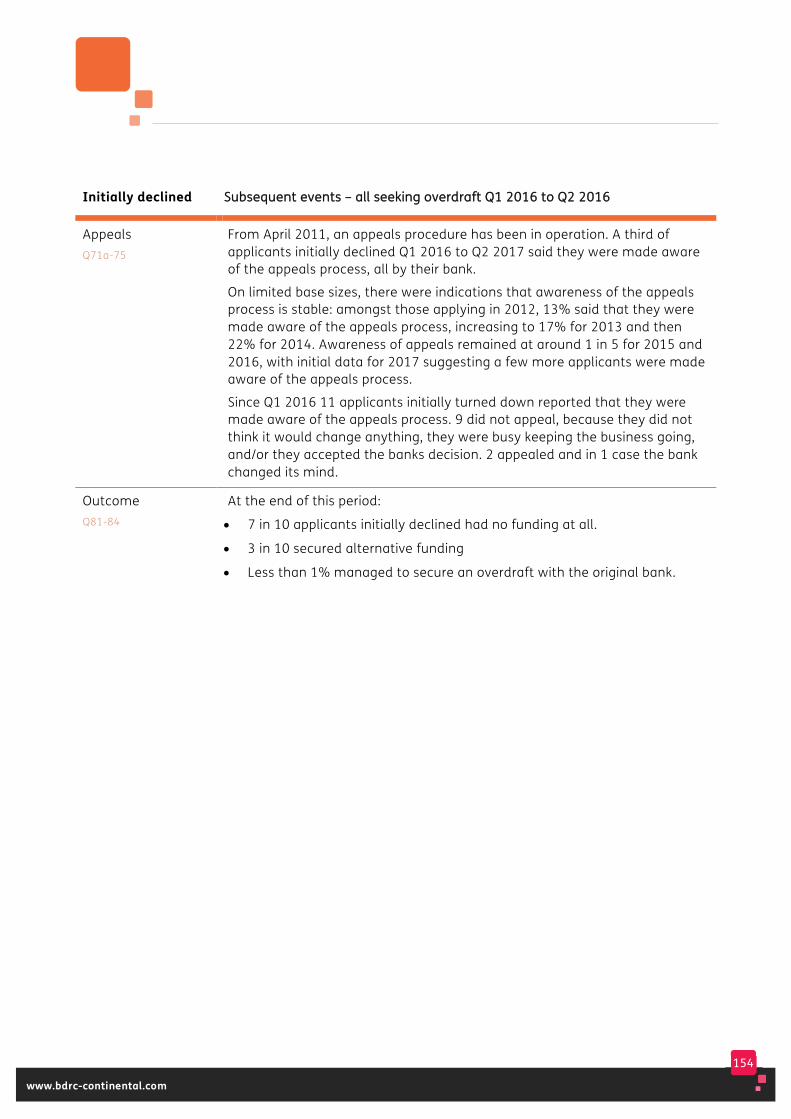
154
www.bdrc-continental.com
Initially declined SSuubbsseeqquueenntt eevveennttss –– aallll sseeeekkiinngg oovveerrddrraafftt QQ11 22001166 ttoo QQ22 22001166
Appeals Q71a-75
From April 2011, an appeals procedure has been in operation. A third of applicants initially declined Q1 2016 to Q2 2017 said they were made aware of the appeals process, all by their bank.
On limited base sizes, there were indications that awareness of the appeals process is stable: amongst those applying in 2012, 13% said that they were made aware of the appeals process, increasing to 17% for 2013 and then 22% for 2014. Awareness of appeals remained at around 1 in 5 for 2015 and 2016, with initial data for 2017 suggesting a few more applicants were made aware of the appeals process.
Since Q1 2016 11 applicants initially turned down reported that they were made aware of the appeals process. 9 did not appeal, because they did not think it would change anything, they were busy keeping the business going, and/or they accepted the banks decision. 2 appealed and in 1 case the bank changed its mind.
Outcome Q81-84
At the end of this period:
• 7 in 10 applicants initially declined had no funding at all.
• 3 in 10 secured alternative funding
• Less than 1% managed to secure an overdraft with the original bank.
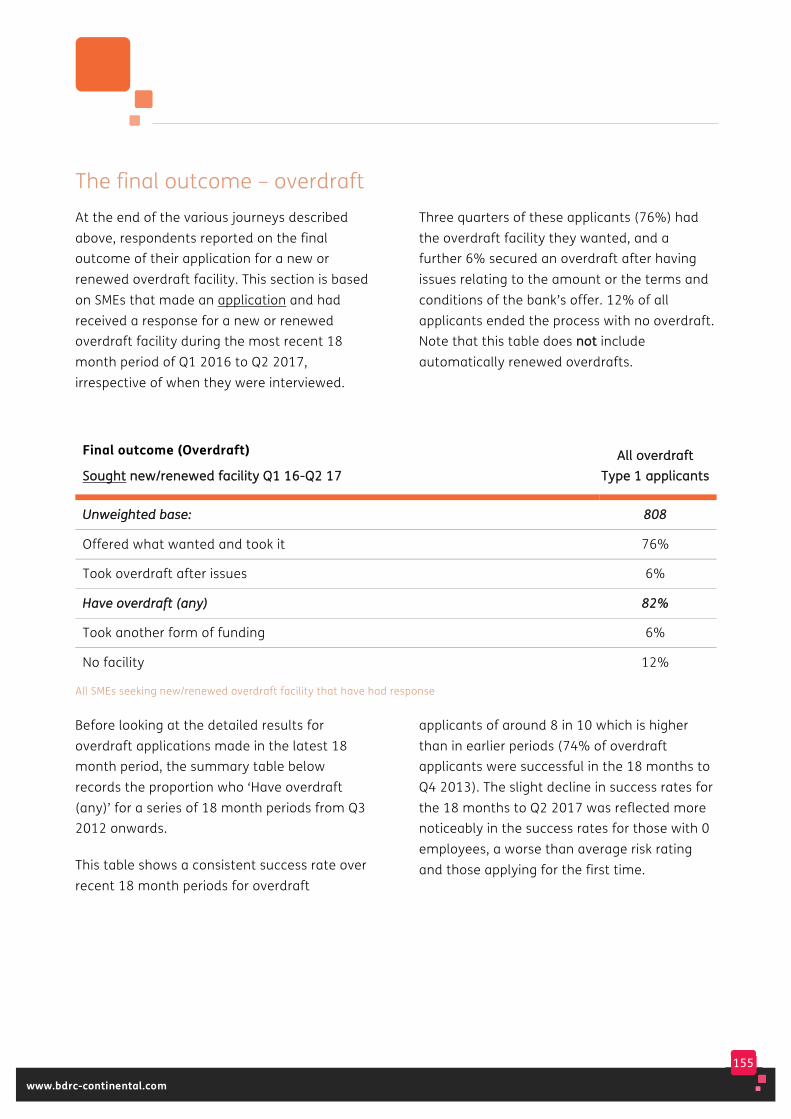
155
www.bdrc-continental.com
The final outcome – overdraft At the end of the various journeys described above, respondents reported on the final outcome of their application for a new or renewed overdraft facility. This section is based on SMEs that made an application and had received a response for a new or renewed overdraft facility during the most recent 18 month period of Q1 2016 to Q2 2017, irrespective of when they were interviewed.
Three quarters of these applicants (76%) had the overdraft facility they wanted, and a further 6% secured an overdraft after having issues relating to the amount or the terms and conditions of the bank’s offer. 12% of all applicants ended the process with no overdraft. Note that this table does nnoott include automatically renewed overdrafts.
Final outcome (Overdraft)
SSoouugghhtt nneeww//rreenneewweedd ffaacciilliittyy QQ11 1166--QQ22 1177 AAllll oovveerrddrraafftt
TTyyppee 11 aapppplliiccaannttss
UUnnwweeiigghhtteedd bbaassee:: 880088
Offered what wanted and took it 76%
Took overdraft after issues 6%
HHaavvee oovveerrddrraafftt ((aannyy)) 8822%%
Took another form of funding 6%
No facility 12%
All SMEs seeking new/renewed overdraft facility that have had response
Before looking at the detailed results for overdraft applications made in the latest 18 month period, the summary table below records the proportion who ‘Have overdraft (any)’ for a series of 18 month periods from Q3 2012 onwards.
This table shows a consistent success rate over recent 18 month periods for overdraft
applicants of around 8 in 10 which is higher than in earlier periods (74% of overdraft applicants were successful in the 18 months to Q4 2013). The slight decline in success rates for the 18 months to Q2 2017 was reflected more noticeably in the success rates for those with 0 employees, a worse than average risk rating and those applying for the first time.
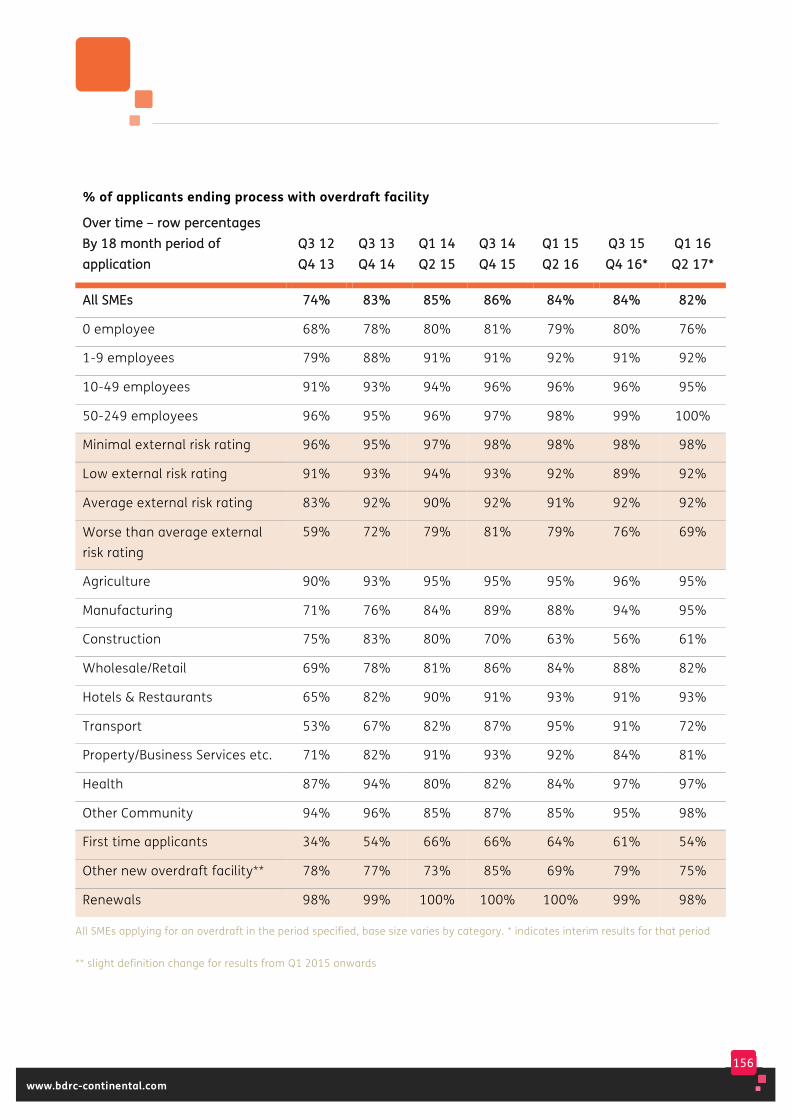
156
www.bdrc-continental.com
% of applicants ending process with overdraft facility
OOvveerr ttiimmee –– rrooww ppeerrcceennttaaggeess BByy 1188 mmoonntthh ppeerriioodd ooff aapppplliiccaattiioonn
QQ33 1122 QQ44 1133
QQ33 1133 QQ44 1144
QQ11 1144 QQ22 1155
QQ33 1144 QQ44 1155
QQ11 1155 QQ22 1166
QQ33 1155 QQ44 1166**
QQ11 1166 QQ22 1177**
AAllll SSMMEEss 7744%% 8833%% 8855%% 8866%% 8844%% 8844%% 8822%%
0 employee 68% 78% 80% 81% 79% 80% 76%
1-9 employees 79% 88% 91% 91% 92% 91% 92%
10-49 employees 91% 93% 94% 96% 96% 96% 95%
50-249 employees 96% 95% 96% 97% 98% 99% 100%
Minimal external risk rating 96% 95% 97% 98% 98% 98% 98%
Low external risk rating 91% 93% 94% 93% 92% 89% 92%
Average external risk rating 83% 92% 90% 92% 91% 92% 92%
Worse than average external risk rating
59% 72% 79% 81% 79% 76% 69%
Agriculture 90% 93% 95% 95% 95% 96% 95%
Manufacturing 71% 76% 84% 89% 88% 94% 95%
Construction 75% 83% 80% 70% 63% 56% 61%
Wholesale/Retail 69% 78% 81% 86% 84% 88% 82%
Hotels & Restaurants 65% 82% 90% 91% 93% 91% 93%
Transport 53% 67% 82% 87% 95% 91% 72%
Property/Business Services etc. 71% 82% 91% 93% 92% 84% 81%
Health 87% 94% 80% 82% 84% 97% 97%
Other Community 94% 96% 85% 87% 85% 95% 98%
First time applicants 34% 54% 66% 66% 64% 61% 54%
Other new overdraft facility** 78% 77% 73% 85% 69% 79% 75%
Renewals 98% 99% 100% 100% 100% 99% 98%
All SMEs applying for an overdraft in the period specified, base size varies by category. * indicates interim results for that period
** slight definition change for results from Q1 2015 onwards
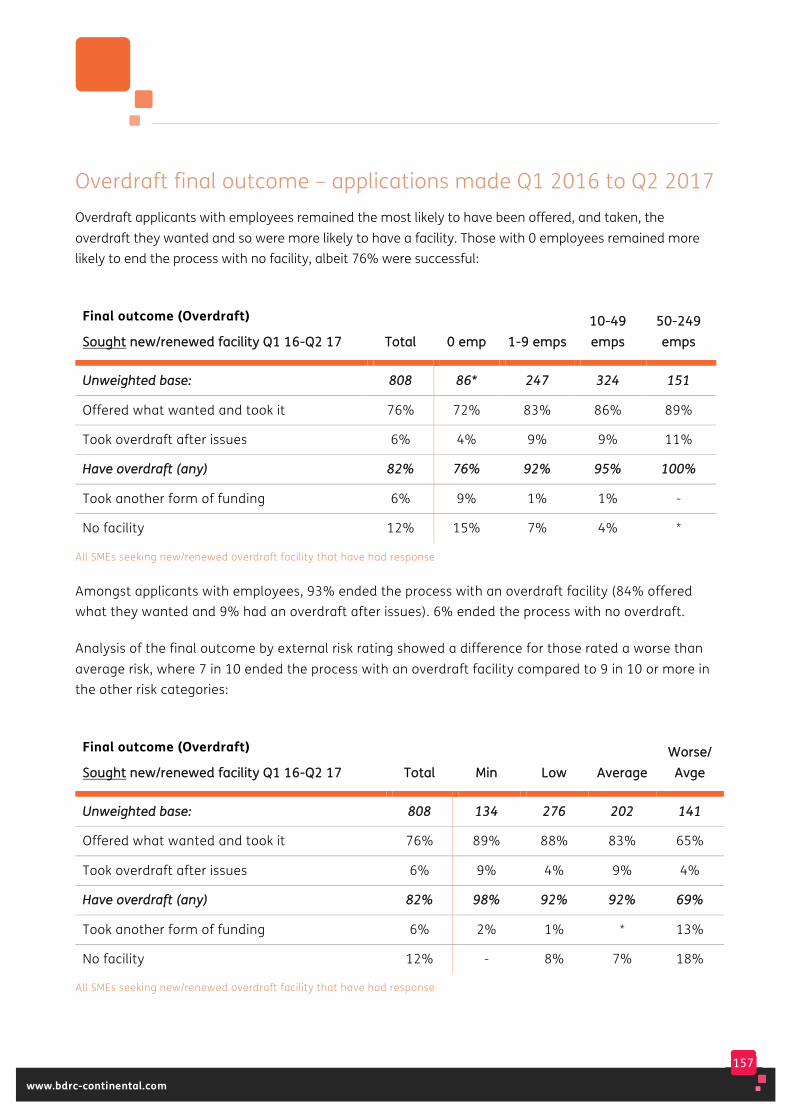
157
www.bdrc-continental.com
Overdraft final outcome – applications made Q1 2016 to Q2 2017 Overdraft applicants with employees remained the most likely to have been offered, and taken, the overdraft they wanted and so were more likely to have a facility. Those with 0 employees remained more likely to end the process with no facility, albeit 76% were successful:
Final outcome (Overdraft)
SSoouugghhtt nneeww//rreenneewweedd ffaacciilliittyy QQ11 1166--QQ22 1177 TToottaall 00 eemmpp 11--99 eemmppss 1100--4499 eemmppss
5500--224499 eemmppss
UUnnwweeiigghhtteedd bbaassee:: 880088 8866** 224477 332244 115511
Offered what wanted and took it 76% 72% 83% 86% 89%
Took overdraft after issues 6% 4% 9% 9% 11%
HHaavvee oovveerrddrraafftt ((aannyy)) 8822%% 7766%% 9922%% 9955%% 110000%%
Took another form of funding 6% 9% 1% 1% -
No facility 12% 15% 7% 4% *
All SMEs seeking new/renewed overdraft facility that have had response
Amongst applicants with employees, 93% ended the process with an overdraft facility (84% offered what they wanted and 9% had an overdraft after issues). 6% ended the process with no overdraft.
Analysis of the final outcome by external risk rating showed a difference for those rated a worse than average risk, where 7 in 10 ended the process with an overdraft facility compared to 9 in 10 or more in the other risk categories:
Final outcome (Overdraft)
SSoouugghhtt nneeww//rreenneewweedd ffaacciilliittyy QQ11 1166--QQ22 1177 TToottaall MMiinn LLooww AAvveerraaggee WWoorrssee//
AAvvggee
UUnnwweeiigghhtteedd bbaassee:: 880088 113344 227766 220022 114411
Offered what wanted and took it 76% 89% 88% 83% 65%
Took overdraft after issues 6% 9% 4% 9% 4%
HHaavvee oovveerrddrraafftt ((aannyy)) 8822%% 9988%% 9922%% 9922%% 6699%%
Took another form of funding 6% 2% 1% * 13%
No facility 12% - 8% 7% 18%
All SMEs seeking new/renewed overdraft facility that have had response
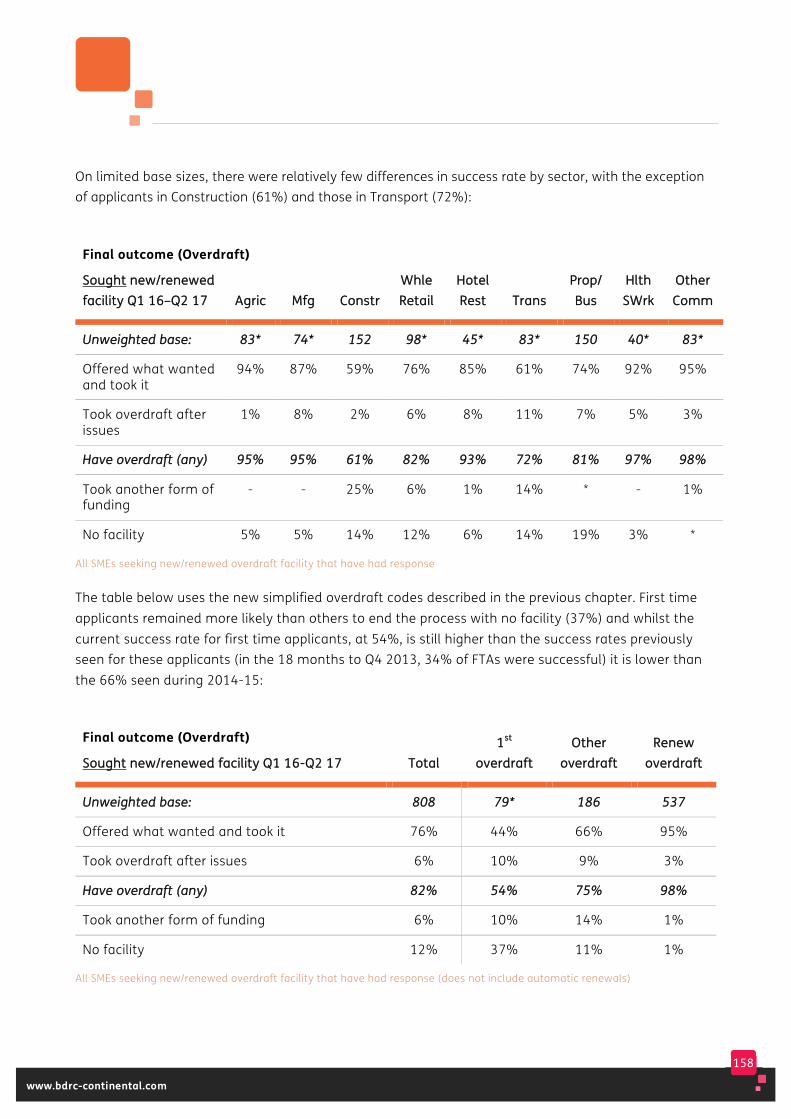
158
www.bdrc-continental.com
On limited base sizes, there were relatively few differences in success rate by sector, with the exception of applicants in Construction (61%) and those in Transport (72%):
Final outcome (Overdraft)
SSoouugghhtt nneeww//rreenneewweedd ffaacciilliittyy QQ11 1166––QQ22 1177 AAggrriicc MMffgg CCoonnssttrr
WWhhllee RReettaaiill
HHootteell RReesstt TTrraannss
PPrroopp// BBuuss
HHlltthh SSWWrrkk
OOtthheerr CCoommmm
UUnnwweeiigghhtteedd bbaassee:: 8833** 7744** 115522 9988** 4455** 8833** 115500 4400** 8833**
Offered what wanted and took it
94% 87% 59% 76% 85% 61% 74% 92% 95%
Took overdraft after issues
1% 8% 2% 6% 8% 11% 7% 5% 3%
HHaavvee oovveerrddrraafftt ((aannyy)) 9955%% 9955%% 6611%% 8822%% 9933%% 7722%% 8811%% 9977%% 9988%%
Took another form of funding
- - 25% 6% 1% 14% * - 1%
No facility 5% 5% 14% 12% 6% 14% 19% 3% *
All SMEs seeking new/renewed overdraft facility that have had response
The table below uses the new simplified overdraft codes described in the previous chapter. First time applicants remained more likely than others to end the process with no facility (37%) and whilst the current success rate for first time applicants, at 54%, is still higher than the success rates previously seen for these applicants (in the 18 months to Q4 2013, 34% of FTAs were successful) it is lower than the 66% seen during 2014-15:
Final outcome (Overdraft)
SSoouugghhtt nneeww//rreenneewweedd ffaacciilliittyy QQ11 1166--QQ22 1177 TToottaall 11sstt
oovveerrddrraafftt OOtthheerr
oovveerrddrraafftt RReenneeww
oovveerrddrraafftt
UUnnwweeiigghhtteedd bbaassee:: 880088 7799** 118866 553377
Offered what wanted and took it 76% 44% 66% 95%
Took overdraft after issues 6% 10% 9% 3%
HHaavvee oovveerrddrraafftt ((aannyy)) 8822%% 5544%% 7755%% 9988%%
Took another form of funding 6% 10% 14% 1%
No facility 12% 37% 11% 1%
All SMEs seeking new/renewed overdraft facility that have had response (does not include automatic renewals)
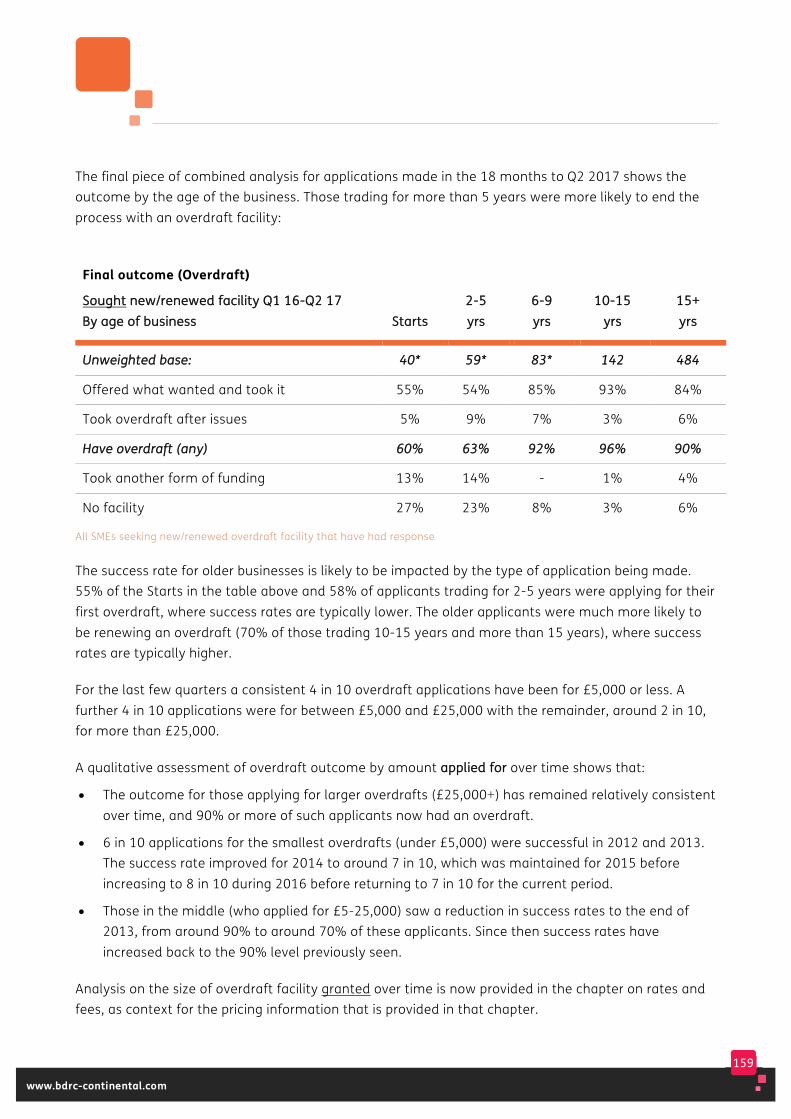
159
www.bdrc-continental.com
The final piece of combined analysis for applications made in the 18 months to Q2 2017 shows the outcome by the age of the business. Those trading for more than 5 years were more likely to end the process with an overdraft facility:
Final outcome (Overdraft)
SSoouugghhtt nneeww//rreenneewweedd ffaacciilliittyy QQ11 1166--QQ22 1177 BByy aaggee ooff bbuussiinneessss SSttaarrttss
22--55 yyrrss
66--99 yyrrss
1100--1155 yyrrss
1155++ yyrrss
UUnnwweeiigghhtteedd bbaassee:: 4400** 5599** 8833** 114422 448844
Offered what wanted and took it 55% 54% 85% 93% 84%
Took overdraft after issues 5% 9% 7% 3% 6%
HHaavvee oovveerrddrraafftt ((aannyy)) 6600%% 6633%% 9922%% 9966%% 9900%%
Took another form of funding 13% 14% - 1% 4%
No facility 27% 23% 8% 3% 6%
All SMEs seeking new/renewed overdraft facility that have had response
The success rate for older businesses is likely to be impacted by the type of application being made. 55% of the Starts in the table above and 58% of applicants trading for 2-5 years were applying for their first overdraft, where success rates are typically lower. The older applicants were much more likely to be renewing an overdraft (70% of those trading 10-15 years and more than 15 years), where success rates are typically higher.
For the last few quarters a consistent 4 in 10 overdraft applications have been for £5,000 or less. A further 4 in 10 applications were for between £5,000 and £25,000 with the remainder, around 2 in 10, for more than £25,000.
A qualitative assessment of overdraft outcome by amount aapppplliieedd ffoorr over time shows that:
• The outcome for those applying for larger overdrafts (£25,000+) has remained relatively consistent over time, and 90% or more of such applicants now had an overdraft.
• 6 in 10 applications for the smallest overdrafts (under £5,000) were successful in 2012 and 2013. The success rate improved for 2014 to around 7 in 10, which was maintained for 2015 before increasing to 8 in 10 during 2016 before returning to 7 in 10 for the current period.
• Those in the middle (who applied for £5-25,000) saw a reduction in success rates to the end of 2013, from around 90% to around 70% of these applicants. Since then success rates have increased back to the 90% level previously seen.
Analysis on the size of overdraft facility granted over time is now provided in the chapter on rates and fees, as context for the pricing information that is provided in that chapter.
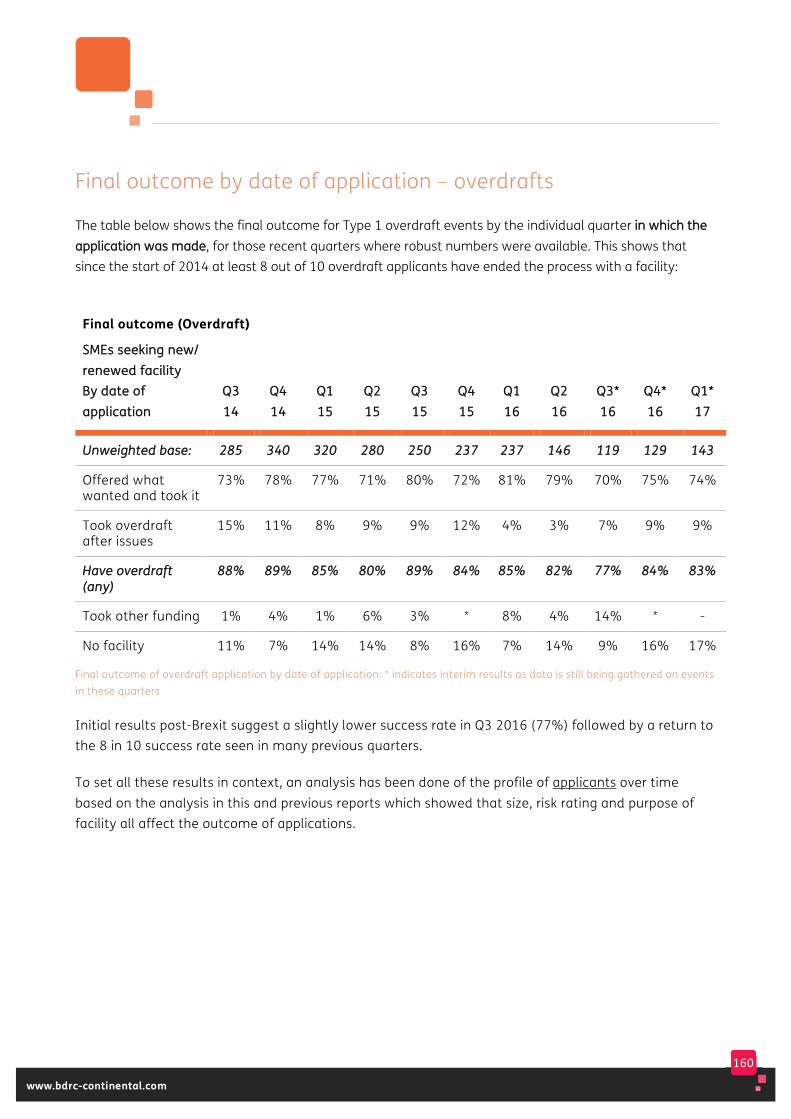
160
www.bdrc-continental.com
Final outcome by date of application – overdrafts
The table below shows the final outcome for Type 1 overdraft events by the individual quarter iinn wwhhiicchh tthhee aapppplliiccaattiioonn wwaass mmaaddee, for those recent quarters where robust numbers were available. This shows that since the start of 2014 at least 8 out of 10 overdraft applicants have ended the process with a facility:
Final outcome (Overdraft)
SSMMEEss sseeeekkiinngg nneeww// rreenneewweedd ffaacciilliittyy BByy ddaattee ooff aapppplliiccaattiioonn
QQ33 1144
QQ44 1144
QQ11 1155
QQ22 1155
QQ33 1155
QQ44 1155
QQ11 1166
QQ22 1166
QQ33** 1166
QQ44** 1166
QQ11** 1177
UUnnwweeiigghhtteedd bbaassee:: 228855 334400 332200 228800 225500 223377 223377 114466 111199 112299 114433
Offered what wanted and took it
73% 78% 77% 71% 80% 72% 81% 79% 70% 75% 74%
Took overdraft after issues
15% 11% 8% 9% 9% 12% 4% 3% 7% 9% 9%
HHaavvee oovveerrddrraafftt ((aannyy))
8888%% 8899%% 8855%% 8800%% 8899%% 8844%% 8855%% 8822%% 7777%% 8844%% 8833%%
Took other funding 1% 4% 1% 6% 3% * 8% 4% 14% * -
No facility 11% 7% 14% 14% 8% 16% 7% 14% 9% 16% 17%
Final outcome of overdraft application by date of application: * indicates interim results as data is still being gathered on events in these quarters
Initial results post-Brexit suggest a slightly lower success rate in Q3 2016 (77%) followed by a return to the 8 in 10 success rate seen in many previous quarters.
To set all these results in context, an analysis has been done of the profile of applicants over time based on the analysis in this and previous reports which showed that size, risk rating and purpose of facility all affect the outcome of applications.
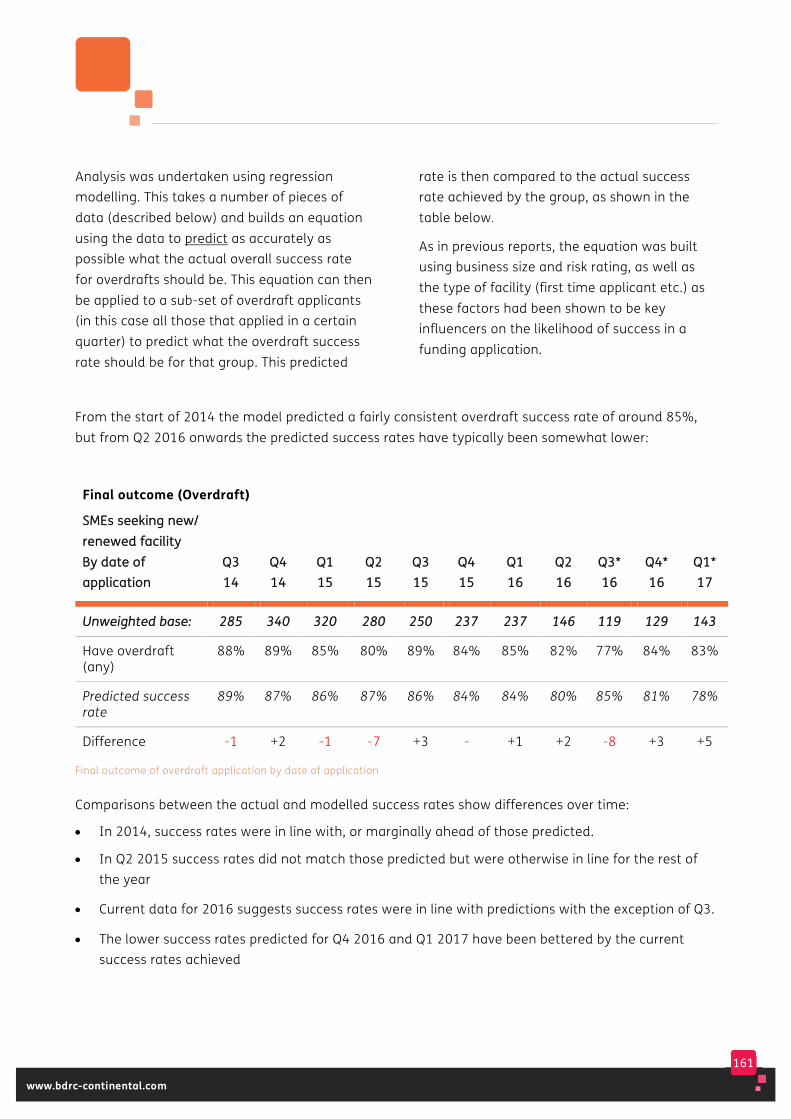
161
www.bdrc-continental.com
Analysis was undertaken using regression modelling. This takes a number of pieces of data (described below) and builds an equation using the data to predict as accurately as possible what the actual overall success rate for overdrafts should be. This equation can then be applied to a sub-set of overdraft applicants (in this case all those that applied in a certain quarter) to predict what the overdraft success rate should be for that group. This predicted
rate is then compared to the actual success rate achieved by the group, as shown in the table below.
As in previous reports, the equation was built using business size and risk rating, as well as the type of facility (first time applicant etc.) as these factors had been shown to be key influencers on the likelihood of success in a funding application.
From the start of 2014 the model predicted a fairly consistent overdraft success rate of around 85%, but from Q2 2016 onwards the predicted success rates have typically been somewhat lower:
Final outcome (Overdraft)
SSMMEEss sseeeekkiinngg nneeww// rreenneewweedd ffaacciilliittyy BByy ddaattee ooff aapppplliiccaattiioonn
QQ33 1144
QQ44 1144
QQ11 1155
QQ22 1155
QQ33 1155
QQ44 1155
QQ11 1166
QQ22 1166
QQ33** 1166
QQ44** 1166
QQ11** 1177
UUnnwweeiigghhtteedd bbaassee:: 228855 334400 332200 228800 225500 223377 223377 114466 111199 112299 114433
Have overdraft (any)
88% 89% 85% 80% 89% 84% 85% 82% 77% 84% 83%
Predicted success rate
89% 87% 86% 87% 86% 84% 84% 80% 85% 81% 78%
Difference -1 +2 -1 -7 +3 - +1 +2 -8 +3 +5
Final outcome of overdraft application by date of application
Comparisons between the actual and modelled success rates show differences over time:
• In 2014, success rates were in line with, or marginally ahead of those predicted.
• In Q2 2015 success rates did not match those predicted but were otherwise in line for the rest of the year
• Current data for 2016 suggests success rates were in line with predictions with the exception of Q3.
• The lower success rates predicted for Q4 2016 and Q1 2017 have been bettered by the current success rates achieved
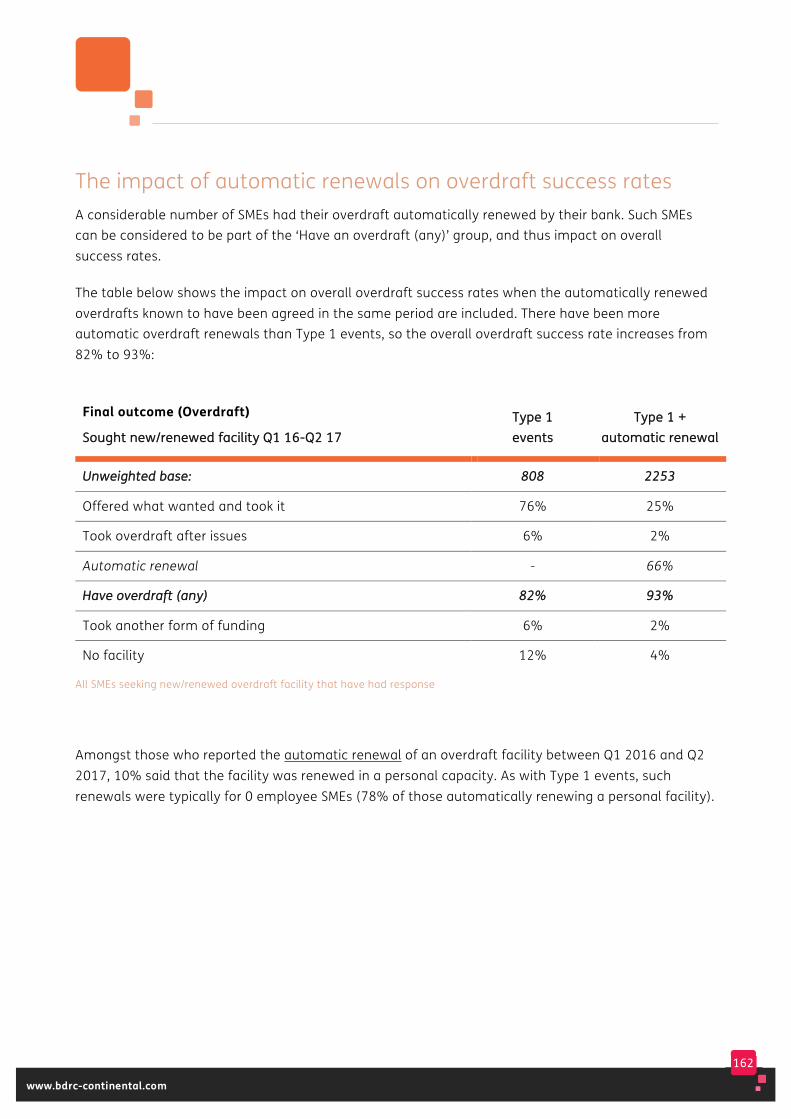
162
www.bdrc-continental.com
The impact of automatic renewals on overdraft success rates A considerable number of SMEs had their overdraft automatically renewed by their bank. Such SMEs can be considered to be part of the ‘Have an overdraft (any)’ group, and thus impact on overall success rates.
The table below shows the impact on overall overdraft success rates when the automatically renewed overdrafts known to have been agreed in the same period are included. There have been more automatic overdraft renewals than Type 1 events, so the overall overdraft success rate increases from 82% to 93%:
Final outcome (Overdraft)
SSoouugghhtt nneeww//rreenneewweedd ffaacciilliittyy QQ11 1166--QQ22 1177 TTyyppee 11 eevveennttss
TTyyppee 11 ++ aauuttoommaattiicc rreenneewwaall
UUnnwweeiigghhtteedd bbaassee:: 880088 22225533
Offered what wanted and took it 76% 25%
Took overdraft after issues 6% 2%
Automatic renewal - 66%
HHaavvee oovveerrddrraafftt ((aannyy)) 8822%% 9933%%
Took another form of funding 6% 2%
No facility 12% 4%
All SMEs seeking new/renewed overdraft facility that have had response
Amongst those who reported the automatic renewal of an overdraft facility between Q1 2016 and Q2 2017, 10% said that the facility was renewed in a personal capacity. As with Type 1 events, such renewals were typically for 0 employee SMEs (78% of those automatically renewing a personal facility).
163
www.bdrc-continental.com
The impact of personal borrowing on overdraft applications
13% of those making an overdraft application in the past 18 months (Q1 2016 to Q2 2017) said that the facility they had sought was in a personal capacity and these were typically smaller SMEs looking to borrow a smaller amount:
• 91% of personal overdraft applicants had 0 employees (v 58% of business applicants)
• 71% were applying for £5,000 or less (v 40% of business applicants)
• 75% had a worse than average risk rating v 41% of business applicants).
In terms of the outcome of the overdraft application by whether it was a personal or business application, base sizes remain limited. Those applying in a personal capacity in the 18 months to Q2 2017 were no more or less likely to be declined (11% v 12% of business applicants) but slightly more likely to take another form of funding (13% v 4%) and therefore slightly less likely to now have an overdraft facility (76% v 84%).
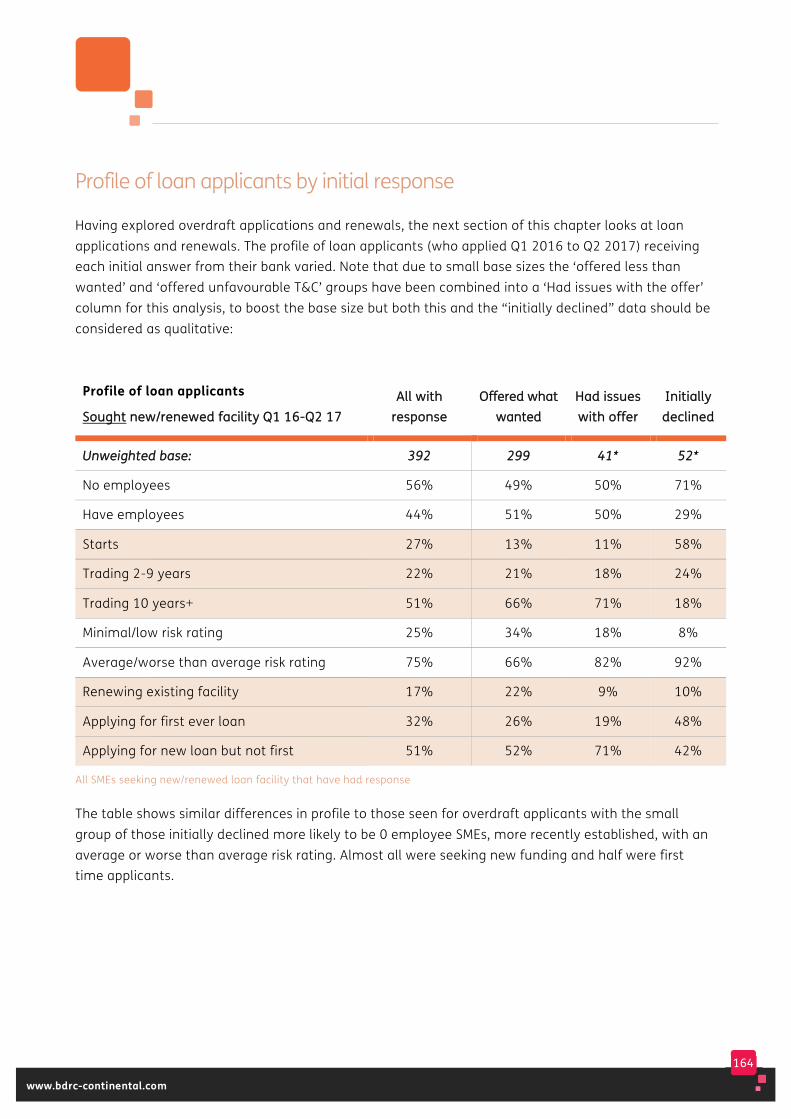
164
www.bdrc-continental.com
Profile of loan applicants by initial response
Having explored overdraft applications and renewals, the next section of this chapter looks at loan applications and renewals. The profile of loan applicants (who applied Q1 2016 to Q2 2017) receiving each initial answer from their bank varied. Note that due to small base sizes the ‘offered less than wanted’ and ‘offered unfavourable T&C’ groups have been combined into a ‘Had issues with the offer’column for this analysis, to boost the base size but both this and the “initially declined” data should be considered as qualitative:
Profile of loan applicants
SSoouugghhtt nneeww//rreenneewweedd ffaacciilliittyy QQ11 1166--QQ22 1177 AAllll wwiitthh
rreessppoonnssee OOffffeerreedd wwhhaatt
wwaanntteedd HHaadd iissssuueess wwiitthh ooffffeerr
IInniittiiaallllyy ddeecclliinneedd
UUnnwweeiigghhtteedd bbaassee:: 339922 229999 4411** 5522**
No employees 56% 49% 50% 71%
Have employees 44% 51% 50% 29%
Starts 27% 13% 11% 58%
Trading 2-9 years 22% 21% 18% 24%
Trading 10 years+ 51% 66% 71% 18%
Minimal/low risk rating 25% 34% 18% 8%
Average/worse than average risk rating 75% 66% 82% 92%
Renewing existing facility 17% 22% 9% 10%
Applying for first ever loan 32% 26% 19% 48%
Applying for new loan but not first 51% 52% 71% 42%
All SMEs seeking new/renewed loan facility that have had response
The table shows similar differences in profile to those seen for overdraft applicants with the small group of those initially declined more likely to be 0 employee SMEs, more recently established, with an average or worse than average risk rating. Almost all were seeking new funding and half were first time applicants.
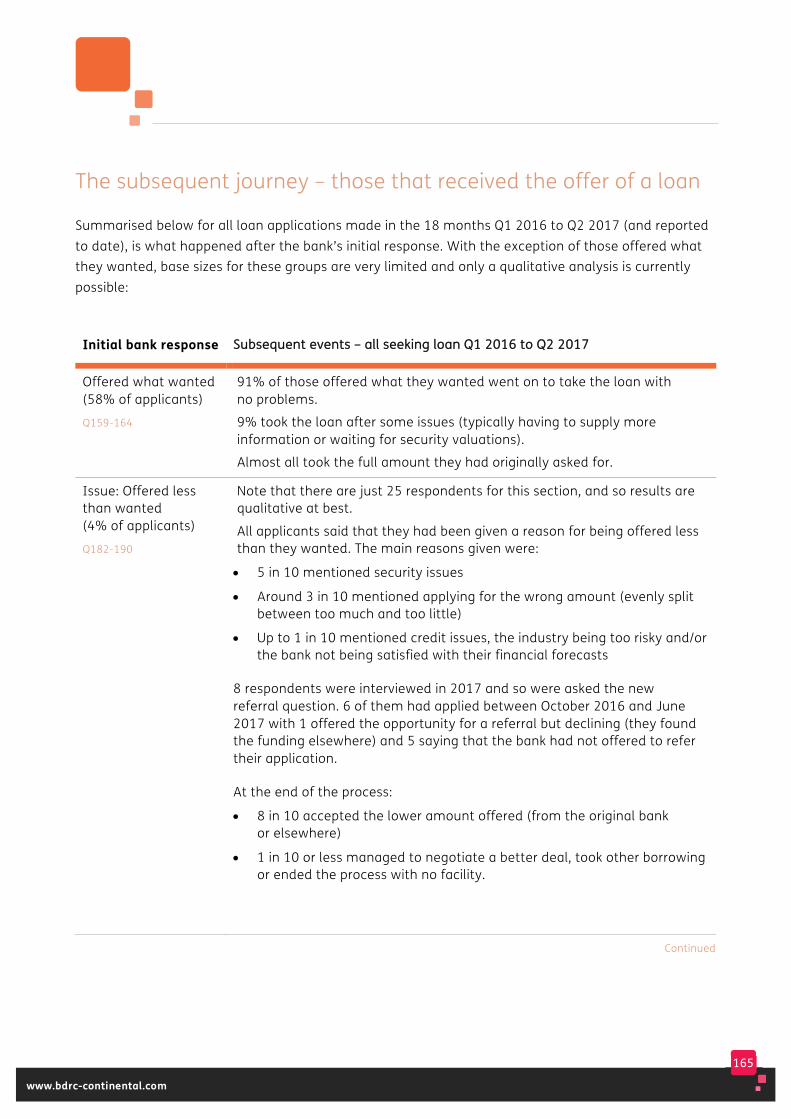
165
www.bdrc-continental.com
The subsequent journey – those that received the offer of a loan
Summarised below for all loan applications made in the 18 months Q1 2016 to Q2 2017 (and reported to date), is what happened after the bank’s initial response. With the exception of those offered what they wanted, base sizes for these groups are very limited and only a qualitative analysis is currently possible:
Initial bank response SSuubbsseeqquueenntt eevveennttss –– aallll sseeeekkiinngg llooaann QQ11 22001166 ttoo QQ22 22001177
Offered what wanted (58% of applicants)
Q159-164
91% of those offered what they wanted went on to take the loan with no problems.
9% took the loan after some issues (typically having to supply more information or waiting for security valuations).
Almost all took the full amount they had originally asked for.
Issue: Offered less than wanted (4% of applicants)
Q182-190
Note that there are just 25 respondents for this section, and so results are qualitative at best.
All applicants said that they had been given a reason for being offered less than they wanted. The main reasons given were:
• 5 in 10 mentioned security issues
• Around 3 in 10 mentioned applying for the wrong amount (evenly split between too much and too little)
• Up to 1 in 10 mentioned credit issues, the industry being too risky and/or the bank not being satisfied with their financial forecasts
8 respondents were interviewed in 2017 and so were asked the new referral question. 6 of them had applied between October 2016 and June 2017 with 1 offered the opportunity for a referral but declining (they found the funding elsewhere) and 5 saying that the bank had not offered to refer their application.
At the end of the process:
• 8 in 10 accepted the lower amount offered (from the original bank or elsewhere)
• 1 in 10 or less managed to negotiate a better deal, took other borrowing or ended the process with no facility.
Continued
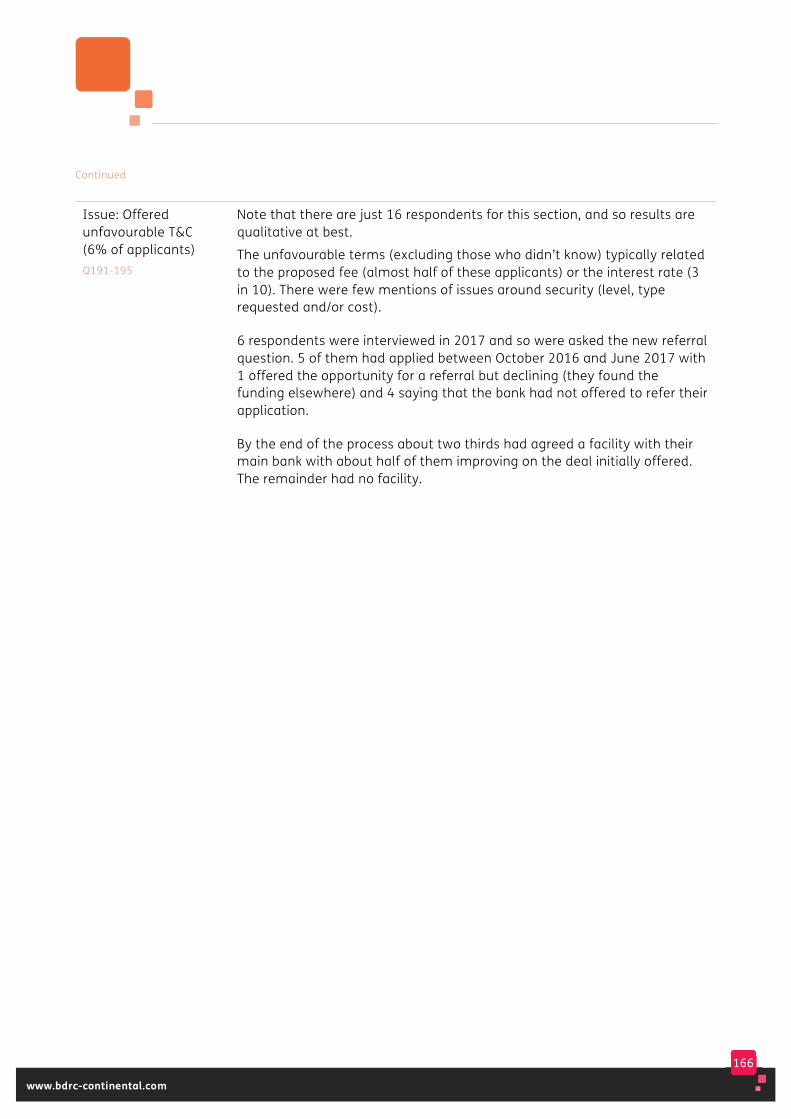
166
www.bdrc-continental.com
Continued
Issue: Offered unfavourable T&C (6% of applicants) Q191-195
Note that there are just 16 respondents for this section, and so results are qualitative at best.
The unfavourable terms (excluding those who didn’t know) typically related to the proposed fee (almost half of these applicants) or the interest rate (3 in 10). There were few mentions of issues around security (level, type requested and/or cost).
6 respondents were interviewed in 2017 and so were asked the new referral question. 5 of them had applied between October 2016 and June 2017 with 1 offered the opportunity for a referral but declining (they found the funding elsewhere) and 4 saying that the bank had not offered to refer their application.
By the end of the process about two thirds had agreed a facility with their main bank with about half of them improving on the deal initially offered. The remainder had no facility.
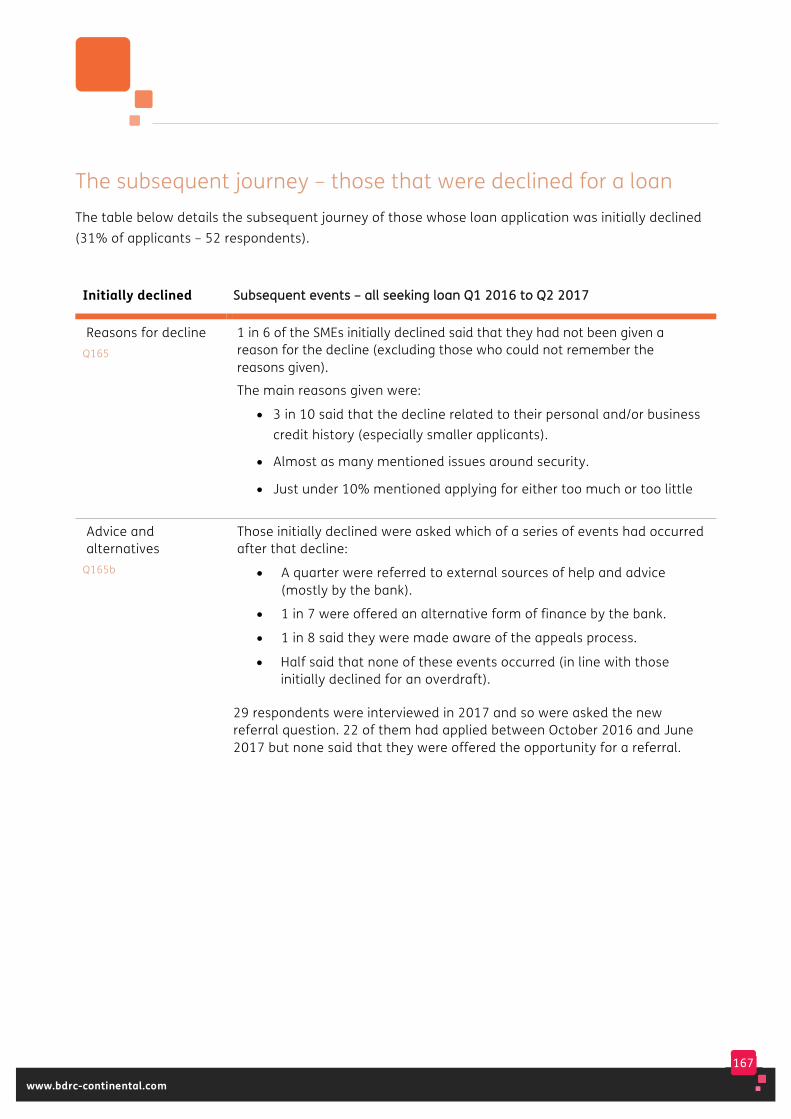
167
www.bdrc-continental.com
The subsequent journey – those that were declined for a loan The table below details the subsequent journey of those whose loan application was initially declined (31% of applicants – 52 respondents).
Initially declined SSuubbsseeqquueenntt eevveennttss –– aallll sseeeekkiinngg llooaann QQ11 22001166 ttoo QQ22 22001177
Reasons for decline Q165
1 in 6 of the SMEs initially declined said that they had not been given a reason for the decline (excluding those who could not remember the reasons given).
The main reasons given were:
• 3 in 10 said that the decline related to their personal and/or business credit history (especially smaller applicants).
• Almost as many mentioned issues around security.
• Just under 10% mentioned applying for either too much or too little
Advice and alternatives
Q165b
Those initially declined were asked which of a series of events had occurred after that decline:
• A quarter were referred to external sources of help and advice (mostly by the bank).
• 1 in 7 were offered an alternative form of finance by the bank.
• 1 in 8 said they were made aware of the appeals process.
• Half said that none of these events occurred (in line with those initially declined for an overdraft).
29 respondents were interviewed in 2017 and so were asked the new referral question. 22 of them had applied between October 2016 and June 2017 but none said that they were offered the opportunity for a referral.

168
www.bdrc-continental.com
Initially declined SSuubbsseeqquueenntt eevveennttss –– aallll sseeeekkiinngg llooaann QQ11 22001166 ttoo QQ22 22001177
Appeals Q168-170
From April 2011, an appeals procedure was introduced. Amongst this group of applicants who were initially declined, 12% said that they were made aware of the appeals process. Awareness of the appeals system has varied between 6% and 14% since 2012 (but none of the handful of applicants in 2017 to date were aware of it).
Of all loan applications reported on the Monitor in this period 6 SMEs were made aware of the appeals process having initially been declined. 2 went on to appeal: in both cases the original decision was upheld.
Those who didn’t appeal typically didn’t think it would have changed anything or felt it was too much hassle.
Outcome Q176
At the end of this period:
• 7 in 10 of those initially declined did not have a facility at all.
• Half of the rest (1 in 7 of those initially declined for a loan) had managed to secure a loan with either the original bank or a new supplier.
• The other half (1 in 7) had secured alternative funding, with friends/family most likely to be mentioned.

169
www.bdrc-continental.com
The final outcome – loan At the end of the various loan journeys described above, respondents reported on the final outcome of their application for a new or renewed loan facility. This section is based on SMEs that made an application and had received a response for a new or renewed loan facility during the most recent 18 month period of Q1 2016 to Q2 2017, irrespective of when they were interviewed.
Two thirds (68%) of loan applicants now have a loan facility. 25% of applicants ended the process with no facility.
Final outcome (Loan)
SSoouugghhtt nneeww//rreenneewweedd ffaacciilliittyy QQ11 1166--QQ22 1177 AAllll llooaann TTyyppee 11
aapppplliiccaannttss
UUnnwweeiigghhtteedd bbaassee:: 339922
Offered what wanted and took it 53%
Took loan after issues 15%
HHaavvee llooaann ((aannyy)) 6688%%
Took another form of funding 6%
No facility 25%
All SMEs seeking new/renewed loan facility that have had response
Before looking at the results for loan applications made in the latest 18 month period in more detail, the summary table below records the proportion who ‘Have loan (any)’ for a series of 18 month periods, stretching back to Q3 2012, by key demographics. As for overdrafts, this shows a series of 18 month periods.
Over the periods shown in the table loan success rates improved from around 60% to over 70% of applications, albeit the interim
success rate for the current period is slightly lower (68%) and will be monitored in future waves. First time loan applicants have not seen the sort of increase in success rates reported by other loan applicants, or by those seeking a first overdraft. Please note that results for the sectors in particular should be treated as indicative due to small sample sizes (all <60).
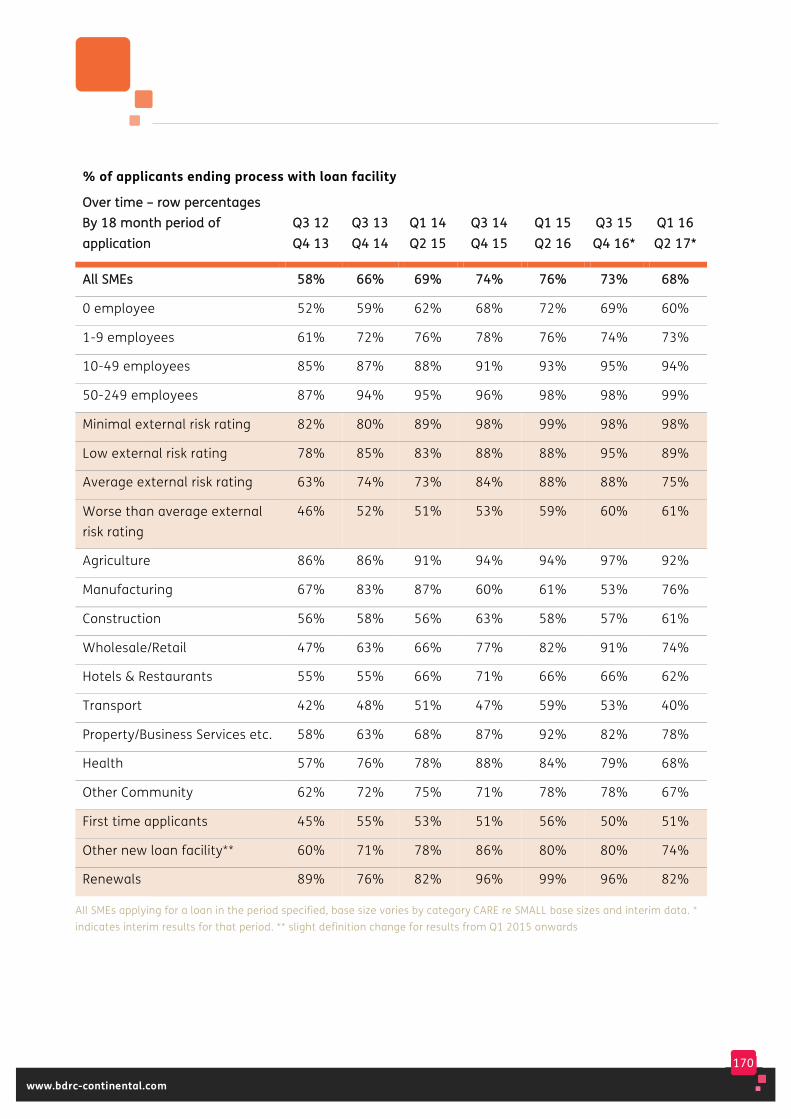
170
www.bdrc-continental.com
% of applicants ending process with loan facility
OOvveerr ttiimmee –– rrooww ppeerrcceennttaaggeess BByy 1188 mmoonntthh ppeerriioodd ooff aapppplliiccaattiioonn
QQ33 1122 QQ44 1133
QQ33 1133 QQ44 1144
QQ11 1144 QQ22 1155
QQ33 1144 QQ44 1155
QQ11 1155 QQ22 1166
QQ33 1155 QQ44 1166**
QQ11 1166 QQ22 1177**
AAllll SSMMEEss 5588%% 6666%% 6699%% 7744%% 7766%% 7733%% 6688%%
0 employee 52% 59% 62% 68% 72% 69% 60%
1-9 employees 61% 72% 76% 78% 76% 74% 73%
10-49 employees 85% 87% 88% 91% 93% 95% 94%
50-249 employees 87% 94% 95% 96% 98% 98% 99%
Minimal external risk rating 82% 80% 89% 98% 99% 98% 98%
Low external risk rating 78% 85% 83% 88% 88% 95% 89%
Average external risk rating 63% 74% 73% 84% 88% 88% 75%
Worse than average external risk rating
46% 52% 51% 53% 59% 60% 61%
Agriculture 86% 86% 91% 94% 94% 97% 92%
Manufacturing 67% 83% 87% 60% 61% 53% 76%
Construction 56% 58% 56% 63% 58% 57% 61%
Wholesale/Retail 47% 63% 66% 77% 82% 91% 74%
Hotels & Restaurants 55% 55% 66% 71% 66% 66% 62%
Transport 42% 48% 51% 47% 59% 53% 40%
Property/Business Services etc. 58% 63% 68% 87% 92% 82% 78%
Health 57% 76% 78% 88% 84% 79% 68%
Other Community 62% 72% 75% 71% 78% 78% 67%
First time applicants 45% 55% 53% 51% 56% 50% 51%
Other new loan facility** 60% 71% 78% 86% 80% 80% 74%
Renewals 89% 76% 82% 96% 99% 96% 82%
All SMEs applying for a loan in the period specified, base size varies by category CARE re SMALL base sizes and interim data. * indicates interim results for that period. ** slight definition change for results from Q1 2015 onwards
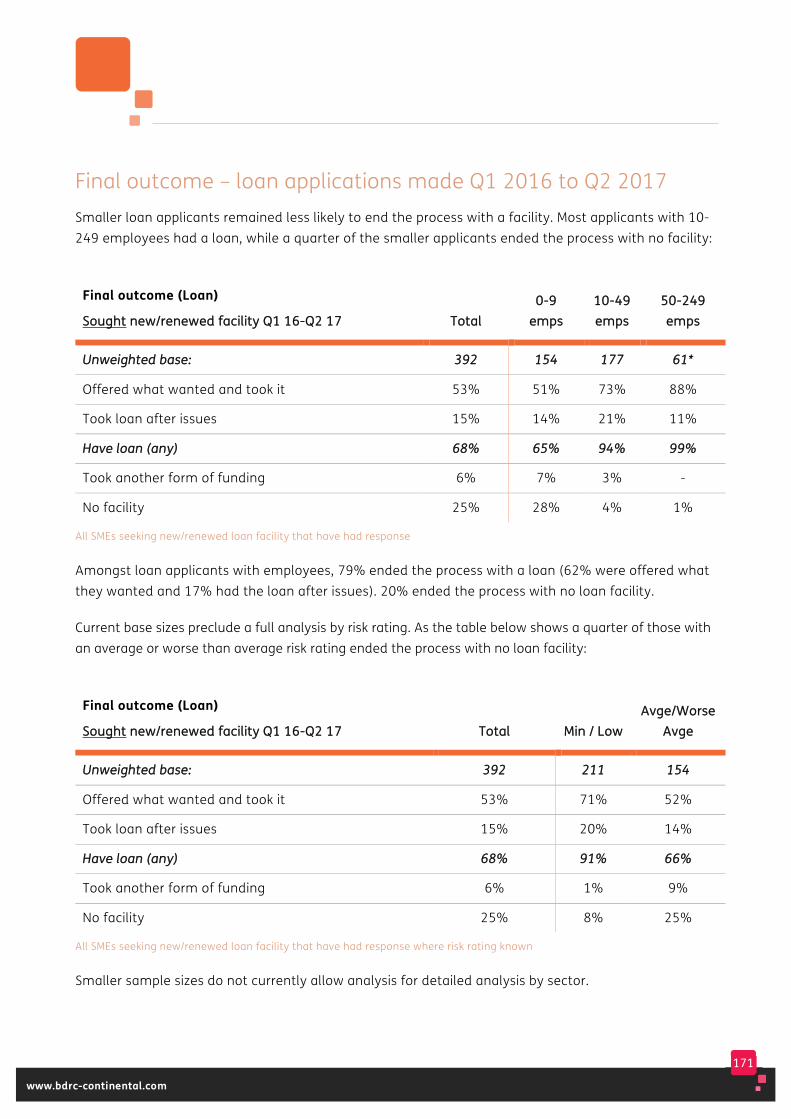
171
www.bdrc-continental.com
Final outcome – loan applications made Q1 2016 to Q2 2017 Smaller loan applicants remained less likely to end the process with a facility. Most applicants with 10-249 employees had a loan, while a quarter of the smaller applicants ended the process with no facility:
Final outcome (Loan)
SSoouugghhtt nneeww//rreenneewweedd ffaacciilliittyy QQ11 1166--QQ22 1177 TToottaall 00--99
eemmppss 1100--4499 eemmppss
5500--224499 eemmppss
UUnnwweeiigghhtteedd bbaassee:: 339922 115544 117777 6611**
Offered what wanted and took it 53% 51% 73% 88%
Took loan after issues 15% 14% 21% 11%
HHaavvee llooaann ((aannyy)) 6688%% 6655%% 9944%% 9999%%
Took another form of funding 6% 7% 3% -
No facility 25% 28% 4% 1%
All SMEs seeking new/renewed loan facility that have had response
Amongst loan applicants with employees, 79% ended the process with a loan (62% were offered what they wanted and 17% had the loan after issues). 20% ended the process with no loan facility.
Current base sizes preclude a full analysis by risk rating. As the table below shows a quarter of those with an average or worse than average risk rating ended the process with no loan facility:
Final outcome (Loan)
SSoouugghhtt nneeww//rreenneewweedd ffaacciilliittyy QQ11 1166--QQ22 1177 TToottaall MMiinn // LLooww AAvvggee//WWoorrssee
AAvvggee
UUnnwweeiigghhtteedd bbaassee:: 339922 221111 115544
Offered what wanted and took it 53% 71% 52%
Took loan after issues 15% 20% 14%
HHaavvee llooaann ((aannyy)) 6688%% 9911%% 6666%%
Took another form of funding 6% 1% 9%
No facility 25% 8% 25%
All SMEs seeking new/renewed loan facility that have had response where risk rating known
Smaller sample sizes do not currently allow analysis for detailed analysis by sector.

172
www.bdrc-continental.com
Analysis earlier in this report showed that the initial response from the bank was typically more positive for the renewal of existing loan facilities and less positive for new facilities. The analysis below shows that this was also the case at the end of the process. Those applying for their first loan remained more likely to end the process with no facility (39%):
Final outcome (Loan)
SSoouugghhtt nneeww//rreenneewweedd ffaacciilliittyy QQ11 1166--QQ22 1177 TToottaall 11sstt llooaann NNeeww llooaann RReenneeww
llooaann
UUnnwweeiigghhtteedd bbaassee:: 339922 8811** 222200 9911**
Offered what wanted and took it 53% 46% 53% 69%
Took loan after issues 15% 5% 21% 13%
HHaavvee llooaann ((aannyy)) 6688%% 5511%% 7744%% 8822%%
Took another form of funding 6% 9% 4% 9%
No facility 25% 39% 22% 9%
All SMEs seeking new/renewed loan facility that have had response

173
www.bdrc-continental.com
As with overdrafts, there were clear differences in outcome for loan applications by age of business. On limited base sizes, Starts were the least likely to have been successful (43%) compared to 90% of those trading for 15 years or more. As well as reflecting their business age, this is likely to also be a reflection of what they were applying for - half of these Starts were applying for their first loan, compared to 8% of those trading for more than 15 years:
Final outcome (Loan)
SSoouugghhtt nneeww//rreenneewweedd ffaacciilliittyy QQ11 1166--QQ22 1177 BByy aaggee ooff bbuussiinneessss
SSttaarrttss –– 55 yyeeaarrss
66--99 yyrrss
1100--1155 yyrrss
1155++ yyrrss
UUnnwweeiigghhtteedd bbaassee:: 6644** 5522** 5566** 222200
Offered what wanted and took it 32% 46% 71% 72%
Took loan after issues 11% 23% 14% 18%
HHaavvee llooaann ((aannyy)) 4433%% 6699%% 8855%% 9900%%
Took another form of funding 14% 1% 1% 1%
No facility 44% 30% 14% 9%
All SMEs seeking new/renewed loan facility that have had response
The majority of loans applied for were for less than £100,000. Success rates for smaller applications (under £100,000) have shown signs of increase over time. In 2013, half of such applications were successful, increasing to 6 in 10 for 2014 and 7 in 10 for applications in 2015 and 2016 to date. Indicative data for
2017 to date suggests a lower success rate currently or around 4 in 10.
Applications for larger amounts (£100,000+) have been more likely to be successful and success rates have maintained the previous improvement seen from around 8 out of 10 to around 9 in 10 of these larger applications.
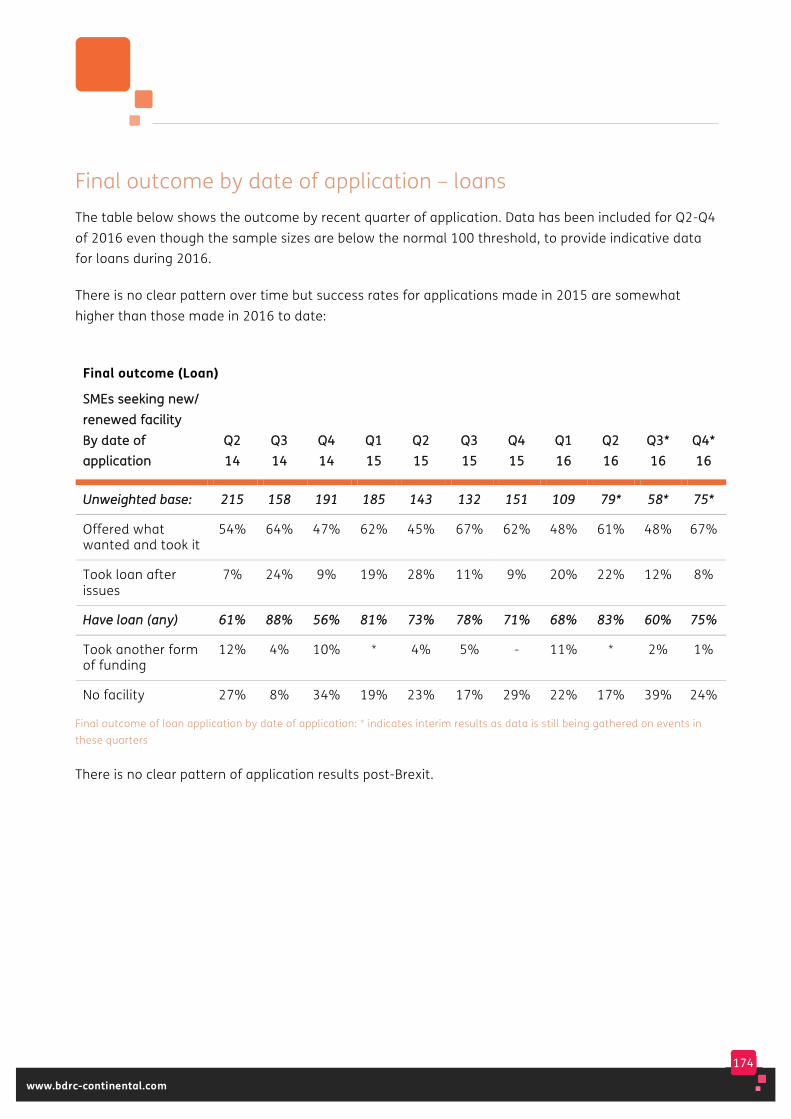
174
www.bdrc-continental.com
Final outcome by date of application – loans The table below shows the outcome by recent quarter of application. Data has been included for Q2-Q4 of 2016 even though the sample sizes are below the normal 100 threshold, to provide indicative data for loans during 2016.
There is no clear pattern over time but success rates for applications made in 2015 are somewhat higher than those made in 2016 to date:
Final outcome (Loan)
SSMMEEss sseeeekkiinngg nneeww// rreenneewweedd ffaacciilliittyy BByy ddaattee ooff aapppplliiccaattiioonn
QQ22 1144
QQ33 1144
QQ44 1144
QQ11 1155
QQ22 1155
QQ33 1155
QQ44 1155
QQ11 1166
QQ22 1166
QQ33** 1166
QQ44** 1166
UUnnwweeiigghhtteedd bbaassee:: 221155 115588 119911 118855 114433 113322 115511 110099 7799** 5588** 7755**
Offered what wanted and took it
54% 64% 47% 62% 45% 67% 62% 48% 61% 48% 67%
Took loan after issues
7% 24% 9% 19% 28% 11% 9% 20% 22% 12% 8%
HHaavvee llooaann ((aannyy)) 6611%% 8888%% 5566%% 8811%% 7733%% 7788%% 7711%% 6688%% 8833%% 6600%% 7755%%
Took another form of funding
12% 4% 10% * 4% 5% - 11% * 2% 1%
No facility 27% 8% 34% 19% 23% 17% 29% 22% 17% 39% 24%
Final outcome of loan application by date of application: * indicates interim results as data is still being gathered on events in these quarters
There is no clear pattern of application results post-Brexit.
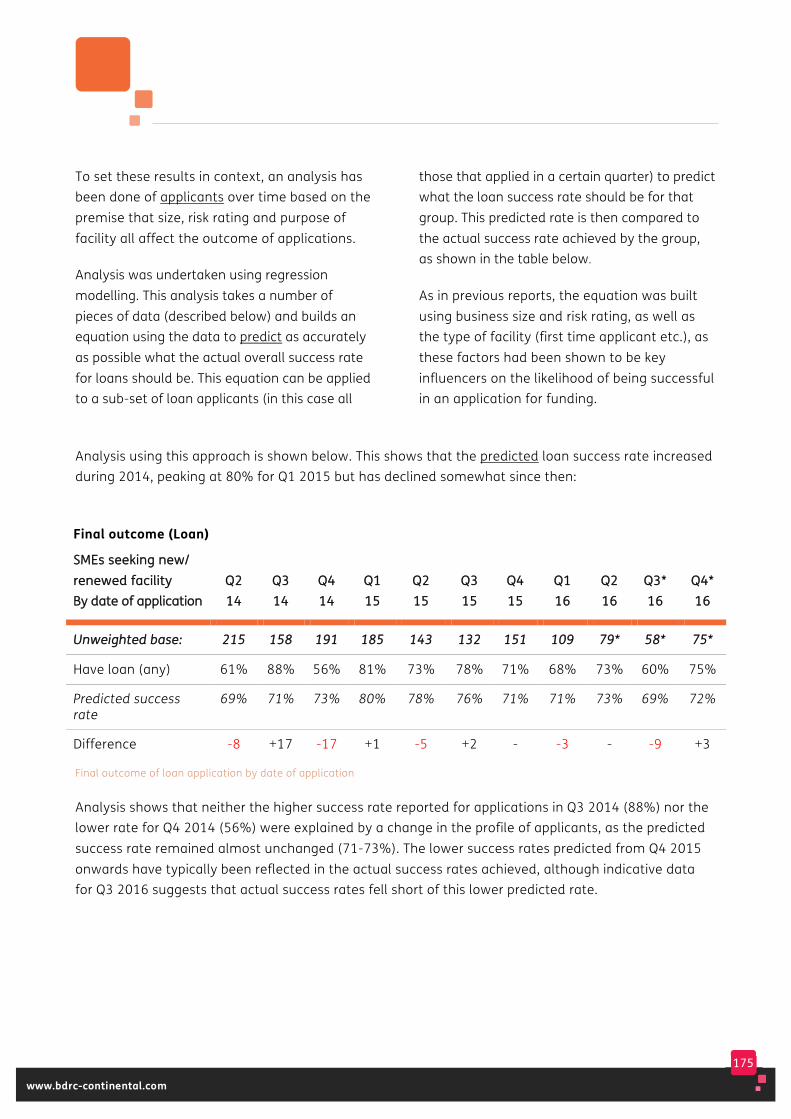
175
www.bdrc-continental.com
To set these results in context, an analysis has been done of applicants over time based on the premise that size, risk rating and purpose of facility all affect the outcome of applications.
Analysis was undertaken using regression modelling. This analysis takes a number of pieces of data (described below) and builds an equation using the data to predict as accurately as possible what the actual overall success rate for loans should be. This equation can be applied to a sub-set of loan applicants (in this case all
those that applied in a certain quarter) to predict what the loan success rate should be for that group. This predicted rate is then compared to the actual success rate achieved by the group, as shown in the table below.
As in previous reports, the equation was built using business size and risk rating, as well as the type of facility (first time applicant etc.), as these factors had been shown to be key influencers on the likelihood of being successful in an application for funding.
Analysis using this approach is shown below. This shows that the predicted loan success rate increased during 2014, peaking at 80% for Q1 2015 but has declined somewhat since then:
Final outcome (Loan)
SSMMEEss sseeeekkiinngg nneeww// rreenneewweedd ffaacciilliittyy BByy ddaattee ooff aapppplliiccaattiioonn
QQ22 1144
QQ33 1144
QQ44 1144
QQ11 1155
QQ22 1155
QQ33 1155
QQ44 1155
QQ11 1166
QQ22 1166
QQ33** 1166
QQ44** 1166
UUnnwweeiigghhtteedd bbaassee:: 221155 115588 119911 118855 114433 113322 115511 110099 7799** 5588** 7755**
Have loan (any) 61% 88% 56% 81% 73% 78% 71% 68% 73% 60% 75%
Predicted success rate
69% 71% 73% 80% 78% 76% 71% 71% 73% 69% 72%
Difference -8 +17 -17 +1 -5 +2 - -3 - -9 +3
Final outcome of loan application by date of application
Analysis shows that neither the higher success rate reported for applications in Q3 2014 (88%) nor the lower rate for Q4 2014 (56%) were explained by a change in the profile of applicants, as the predicted success rate remained almost unchanged (71-73%). The lower success rates predicted from Q4 2015 onwards have typically been reflected in the actual success rates achieved, although indicative data for Q3 2016 suggests that actual success rates fell short of this lower predicted rate.

176
www.bdrc-continental.com
The impact of personal borrowing on loan applications 21% of those making a loan application in the past 18 months (Q1 2016 to Q2 2017) said that the facility they had sought was in a personal capacity, compared to 13% for overdrafts.
On a limited sample, those applying in a personal capacity were:
• Less likely to have employees (22% v 53% of those applying in a business capacity)
• Less likely to be seeking a loan in excess of £25,000 (13% v 37% for those applying in a business capacity)
• More likely to have a worse than average external risk rating for the business (61% v 46% for those applying in a business capacity).
In terms of the outcome of personal loan applications, base sizes remain limited. However, current data suggests that 5 in 10 of those applying in a personal capacity ended the process with a facility (compared to 7 in 10 applying in a business capacity) while 4 in 10 ended the process with no facility (compared to 2 in 10 applying in a business capacity).
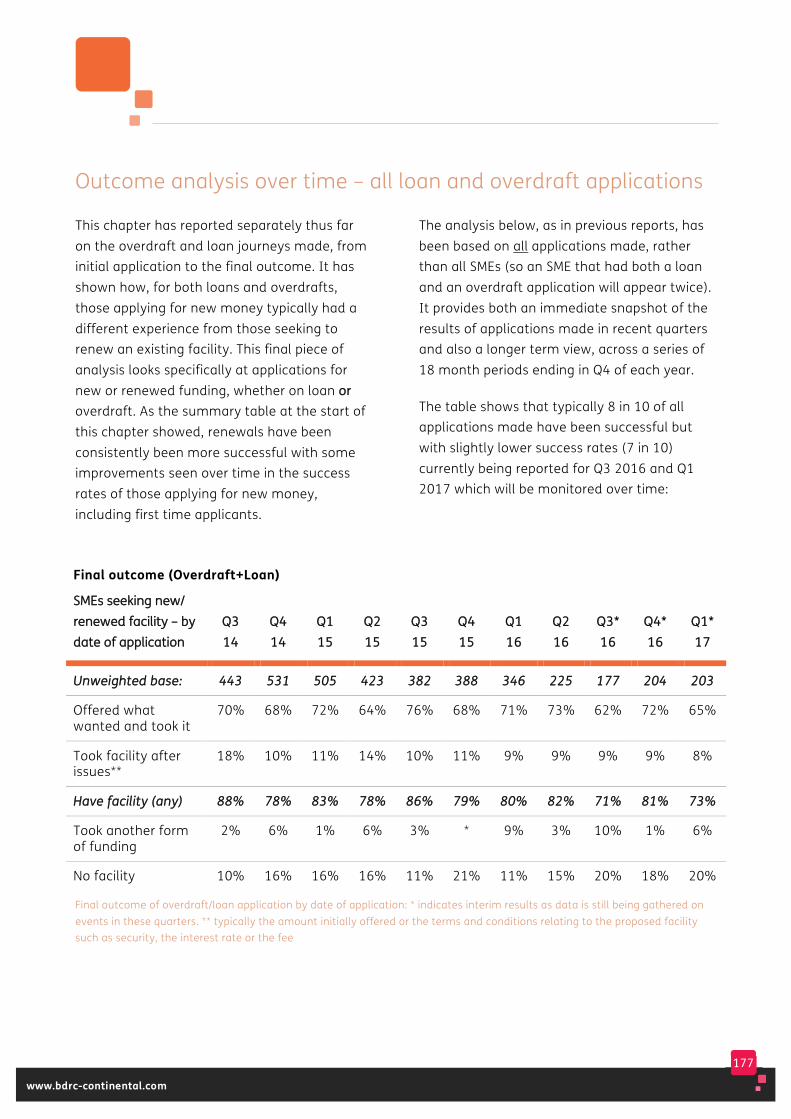
177
www.bdrc-continental.com
Outcome analysis over time – all loan and overdraft applications
This chapter has reported separately thus far on the overdraft and loan journeys made, from initial application to the final outcome. It has shown how, for both loans and overdrafts, those applying for new money typically had a different experience from those seeking to renew an existing facility. This final piece of analysis looks specifically at applications for new or renewed funding, whether on loan oorr overdraft. As the summary table at the start of this chapter showed, renewals have been consistently been more successful with some improvements seen over time in the success rates of those applying for new money, including first time applicants.
The analysis below, as in previous reports, has been based on all applications made, rather than all SMEs (so an SME that had both a loan and an overdraft application will appear twice). It provides both an immediate snapshot of the results of applications made in recent quarters and also a longer term view, across a series of 18 month periods ending in Q4 of each year.
The table shows that typically 8 in 10 of all applications made have been successful but with slightly lower success rates (7 in 10) currently being reported for Q3 2016 and Q1 2017 which will be monitored over time:
Final outcome (Overdraft+Loan)
SSMMEEss sseeeekkiinngg nneeww// rreenneewweedd ffaacciilliittyy –– bbyy ddaattee ooff aapppplliiccaattiioonn
QQ33 1144
QQ44 1144
QQ11 1155
QQ22 1155
QQ33 1155
QQ44 1155
QQ11 1166
QQ22 1166
QQ33** 1166
QQ44** 1166
QQ11** 1177
UUnnwweeiigghhtteedd bbaassee:: 444433 553311 550055 442233 338822 338888 334466 222255 117777 220044 220033
Offered what wanted and took it
70% 68% 72% 64% 76% 68% 71% 73% 62% 72% 65%
Took facility after issues**
18% 10% 11% 14% 10% 11% 9% 9% 9% 9% 8%
HHaavvee ffaacciilliittyy ((aannyy)) 8888%% 7788%% 8833%% 7788%% 8866%% 7799%% 8800%% 8822%% 7711%% 8811%% 7733%%
Took another form of funding
2% 6% 1% 6% 3% * 9% 3% 10% 1% 6%
No facility 10% 16% 16% 16% 11% 21% 11% 15% 20% 18% 20%
Final outcome of overdraft/loan application by date of application: * indicates interim results as data is still being gathered on events in these quarters. ** typically the amount initially offered or the terms and conditions relating to the proposed facility such as security, the interest rate or the fee
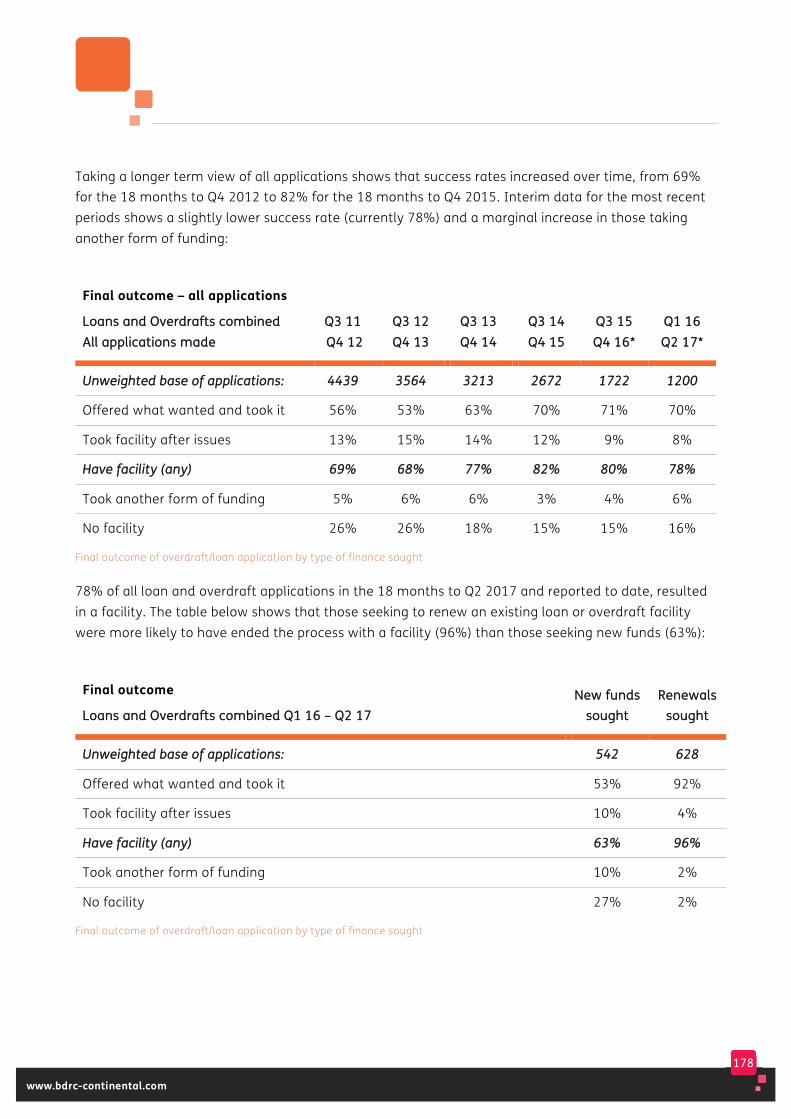
178
www.bdrc-continental.com
Taking a longer term view of all applications shows that success rates increased over time, from 69% for the 18 months to Q4 2012 to 82% for the 18 months to Q4 2015. Interim data for the most recent periods shows a slightly lower success rate (currently 78%) and a marginal increase in those taking another form of funding:
Final outcome – all applications
LLooaannss aanndd OOvveerrddrraaffttss ccoommbbiinneedd AAllll aapppplliiccaattiioonnss mmaaddee
QQ33 1111 QQ44 1122
QQ33 1122 QQ44 1133
QQ33 1133 QQ44 1144
QQ33 1144 QQ44 1155
QQ33 1155 QQ44 1166**
QQ11 1166 QQ22 1177**
UUnnwweeiigghhtteedd bbaassee ooff aapppplliiccaattiioonnss:: 44443399 33556644 33221133 22667722 11772222 11220000
Offered what wanted and took it 56% 53% 63% 70% 71% 70%
Took facility after issues 13% 15% 14% 12% 9% 8%
HHaavvee ffaacciilliittyy ((aannyy)) 6699%% 6688%% 7777%% 8822%% 8800%% 7788%%
Took another form of funding 5% 6% 6% 3% 4% 6%
No facility 26% 26% 18% 15% 15% 16%
Final outcome of overdraft/loan application by type of finance sought
78% of all loan and overdraft applications in the 18 months to Q2 2017 and reported to date, resulted in a facility. The table below shows that those seeking to renew an existing loan or overdraft facility were more likely to have ended the process with a facility (96%) than those seeking new funds (63%):
Final outcome
LLooaannss aanndd OOvveerrddrraaffttss ccoommbbiinneedd QQ11 1166 –– QQ22 1177 NNeeww ffuunnddss
ssoouugghhtt RReenneewwaallss
ssoouugghhtt
UUnnwweeiigghhtteedd bbaassee ooff aapppplliiccaattiioonnss:: 554422 662288
Offered what wanted and took it 53% 92%
Took facility after issues 10% 4%
HHaavvee ffaacciilliittyy ((aannyy)) 6633%% 9966%%
Took another form of funding 10% 2%
No facility 27% 2%
Final outcome of overdraft/loan application by type of finance sought
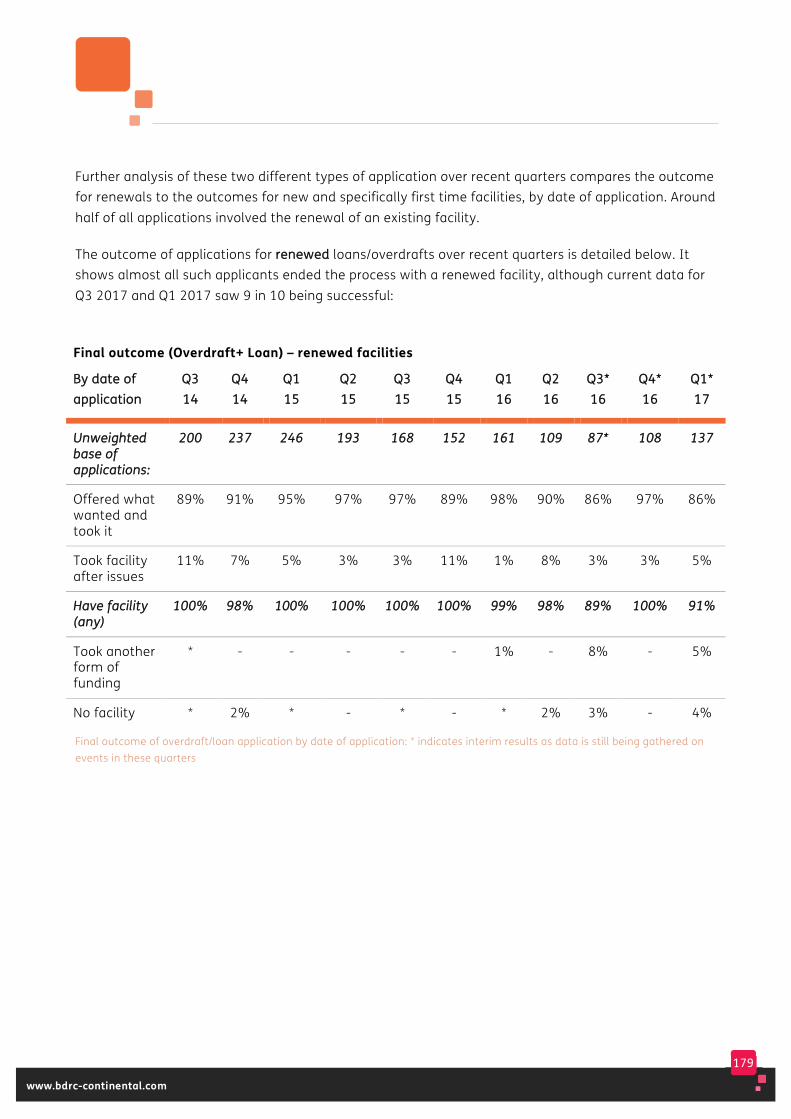
179
www.bdrc-continental.com
Further analysis of these two different types of application over recent quarters compares the outcome for renewals to the outcomes for new and specifically first time facilities, by date of application. Around half of all applications involved the renewal of an existing facility.
The outcome of applications for rreenneewweedd loans/overdrafts over recent quarters is detailed below. It shows almost all such applicants ended the process with a renewed facility, although current data for Q3 2017 and Q1 2017 saw 9 in 10 being successful:
Final outcome (Overdraft+ Loan) – renewed facilities
BByy ddaattee ooff aapppplliiccaattiioonn
QQ33 1144
QQ44 1144
QQ11 1155
QQ22 1155
QQ33 1155
QQ44 1155
QQ11 1166
QQ22 1166
QQ33** 1166
QQ44** 1166
QQ11** 1177
UUnnwweeiigghhtteedd bbaassee ooff aapppplliiccaattiioonnss::
220000 223377 224466 119933 116688 115522 116611 110099 8877** 110088 113377
Offered what wanted and took it
89% 91% 95% 97% 97% 89% 98% 90% 86% 97% 86%
Took facility after issues
11% 7% 5% 3% 3% 11% 1% 8% 3% 3% 5%
HHaavvee ffaacciilliittyy ((aannyy))
110000%% 9988%% 110000%% 110000%% 110000%% 110000%% 9999%% 9988%% 8899%% 110000%% 9911%%
Took another form of funding
* - - - - - 1% - 8% - 5%
No facility * 2% * - * - * 2% 3% - 4%
Final outcome of overdraft/loan application by date of application: * indicates interim results as data is still being gathered on events in these quarters
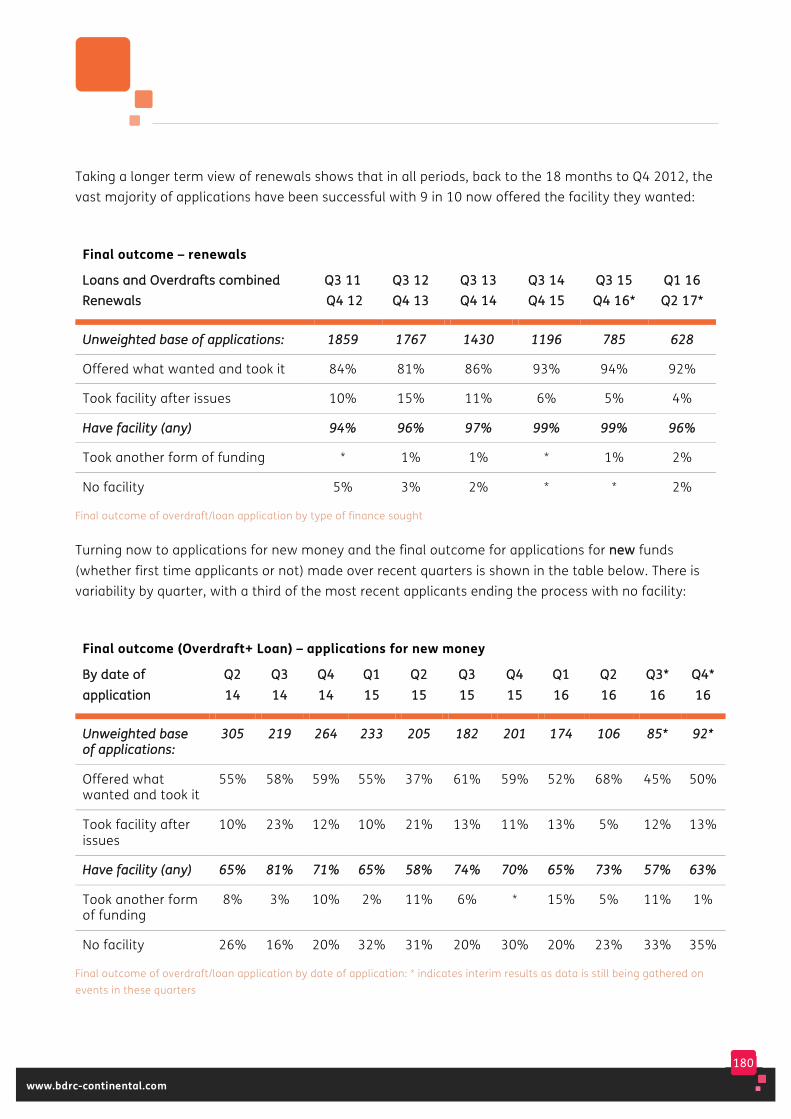
180
www.bdrc-continental.com
Taking a longer term view of renewals shows that in all periods, back to the 18 months to Q4 2012, the vast majority of applications have been successful with 9 in 10 now offered the facility they wanted:
Final outcome – renewals
LLooaannss aanndd OOvveerrddrraaffttss ccoommbbiinneedd RReenneewwaallss
QQ33 1111 QQ44 1122
QQ33 1122 QQ44 1133
QQ33 1133 QQ44 1144
QQ33 1144 QQ44 1155
QQ33 1155 QQ44 1166**
QQ11 1166 QQ22 1177**
UUnnwweeiigghhtteedd bbaassee ooff aapppplliiccaattiioonnss:: 11885599 11776677 11443300 11119966 778855 662288
Offered what wanted and took it 84% 81% 86% 93% 94% 92%
Took facility after issues 10% 15% 11% 6% 5% 4%
HHaavvee ffaacciilliittyy ((aannyy)) 9944%% 9966%% 9977%% 9999%% 9999%% 9966%%
Took another form of funding * 1% 1% * 1% 2%
No facility 5% 3% 2% * * 2%
Final outcome of overdraft/loan application by type of finance sought
Turning now to applications for new money and the final outcome for applications for nneeww funds (whether first time applicants or not) made over recent quarters is shown in the table below. There is variability by quarter, with a third of the most recent applicants ending the process with no facility:
Final outcome (Overdraft+ Loan) – applications for new money
BByy ddaattee ooff aapppplliiccaattiioonn
QQ22 1144
QQ33 1144
QQ44 1144
QQ11 1155
QQ22 1155
QQ33 1155
QQ44 1155
QQ11 1166
QQ22 1166
QQ33** 1166
QQ44** 1166
UUnnwweeiigghhtteedd bbaassee ooff aapppplliiccaattiioonnss::
330055 221199 226644 223333 220055 118822 220011 117744 110066 8855** 9922**
Offered what wanted and took it
55% 58% 59% 55% 37% 61% 59% 52% 68% 45% 50%
Took facility after issues
10% 23% 12% 10% 21% 13% 11% 13% 5% 12% 13%
HHaavvee ffaacciilliittyy ((aannyy)) 6655%% 8811%% 7711%% 6655%% 5588%% 7744%% 7700%% 6655%% 7733%% 5577%% 6633%%
Took another form of funding
8% 3% 10% 2% 11% 6% * 15% 5% 11% 1%
No facility 26% 16% 20% 32% 31% 20% 30% 20% 23% 33% 35%
Final outcome of overdraft/loan application by date of application: * indicates interim results as data is still being gathered on events in these quarters
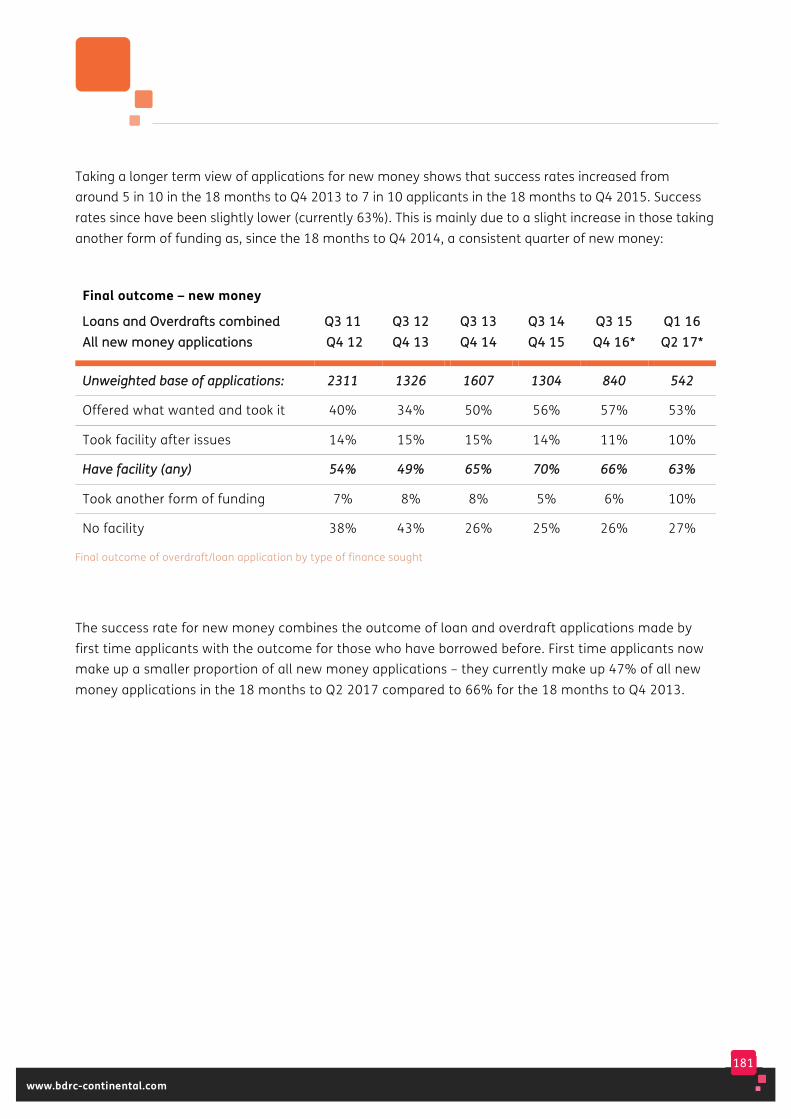
181
www.bdrc-continental.com
Taking a longer term view of applications for new money shows that success rates increased from around 5 in 10 in the 18 months to Q4 2013 to 7 in 10 applicants in the 18 months to Q4 2015. Success rates since have been slightly lower (currently 63%). This is mainly due to a slight increase in those taking another form of funding as, since the 18 months to Q4 2014, a consistent quarter of new money:
Final outcome – new money
LLooaannss aanndd OOvveerrddrraaffttss ccoommbbiinneedd AAllll nneeww mmoonneeyy aapppplliiccaattiioonnss
QQ33 1111 QQ44 1122
QQ33 1122 QQ44 1133
QQ33 1133 QQ44 1144
QQ33 1144 QQ44 1155
QQ33 1155 QQ44 1166**
QQ11 1166 QQ22 1177**
UUnnwweeiigghhtteedd bbaassee ooff aapppplliiccaattiioonnss:: 22331111 11332266 11660077 11330044 884400 554422
Offered what wanted and took it 40% 34% 50% 56% 57% 53%
Took facility after issues 14% 15% 15% 14% 11% 10%
HHaavvee ffaacciilliittyy ((aannyy)) 5544%% 4499%% 6655%% 7700%% 6666%% 6633%%
Took another form of funding 7% 8% 8% 5% 6% 10%
No facility 38% 43% 26% 25% 26% 27%
Final outcome of overdraft/loan application by type of finance sought
The success rate for new money combines the outcome of loan and overdraft applications made by first time applicants with the outcome for those who have borrowed before. First time applicants now make up a smaller proportion of all new money applications – they currently make up 47% of all new money applications in the 18 months to Q2 2017 compared to 66% for the 18 months to Q4 2013.
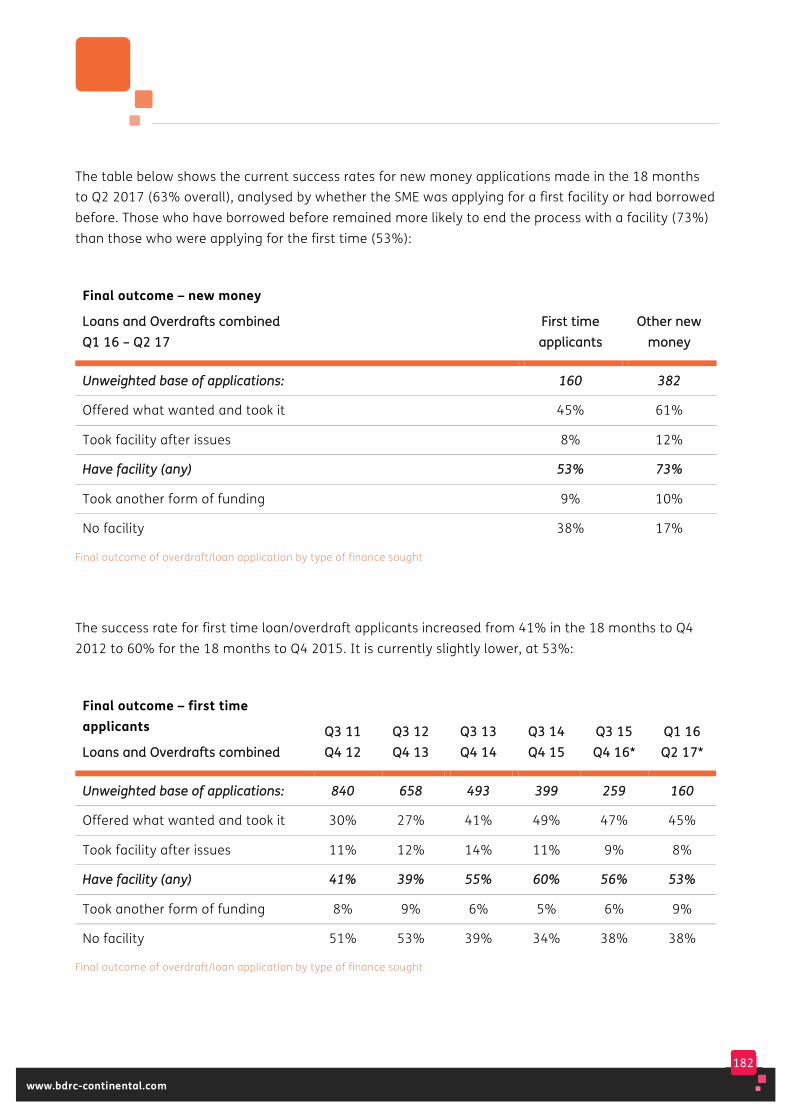
182
www.bdrc-continental.com
The table below shows the current success rates for new money applications made in the 18 months to Q2 2017 (63% overall), analysed by whether the SME was applying for a first facility or had borrowed before. Those who have borrowed before remained more likely to end the process with a facility (73%) than those who were applying for the first time (53%):
Final outcome – new money
LLooaannss aanndd OOvveerrddrraaffttss ccoommbbiinneedd QQ11 1166 –– QQ22 1177
FFiirrsstt ttiimmee aapppplliiccaannttss
OOtthheerr nneeww mmoonneeyy
UUnnwweeiigghhtteedd bbaassee ooff aapppplliiccaattiioonnss:: 116600 338822
Offered what wanted and took it 45% 61%
Took facility after issues 8% 12%
HHaavvee ffaacciilliittyy ((aannyy)) 5533%% 7733%%
Took another form of funding 9% 10%
No facility 38% 17%
Final outcome of overdraft/loan application by type of finance sought
The success rate for first time loan/overdraft applicants increased from 41% in the 18 months to Q4 2012 to 60% for the 18 months to Q4 2015. It is currently slightly lower, at 53%:
Final outcome – first time applicants
LLooaannss aanndd OOvveerrddrraaffttss ccoommbbiinneedd QQ33 1111 QQ44 1122
QQ33 1122 QQ44 1133
QQ33 1133 QQ44 1144
QQ33 1144 QQ44 1155
QQ33 1155 QQ44 1166**
QQ11 1166 QQ22 1177**
UUnnwweeiigghhtteedd bbaassee ooff aapppplliiccaattiioonnss:: 884400 665588 449933 339999 225599 116600
Offered what wanted and took it 30% 27% 41% 49% 47% 45%
Took facility after issues 11% 12% 14% 11% 9% 8%
HHaavvee ffaacciilliittyy ((aannyy)) 4411%% 3399%% 5555%% 6600%% 5566%% 5533%%
Took another form of funding 8% 9% 6% 5% 6% 9%
No facility 51% 53% 39% 34% 38% 38%
Final outcome of overdraft/loan application by type of finance sought
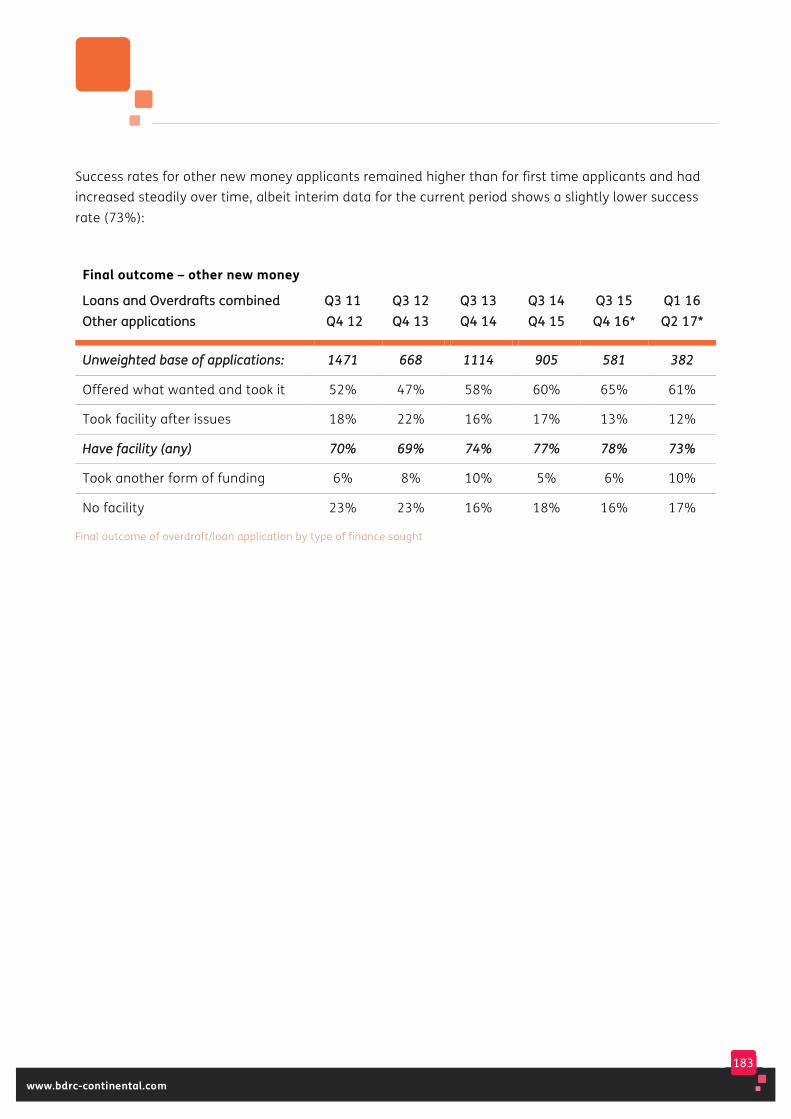
183
www.bdrc-continental.com
Success rates for other new money applicants remained higher than for first time applicants and had increased steadily over time, albeit interim data for the current period shows a slightly lower success rate (73%):
Final outcome – other new money
LLooaannss aanndd OOvveerrddrraaffttss ccoommbbiinneedd OOtthheerr aapppplliiccaattiioonnss
QQ33 1111 QQ44 1122
QQ33 1122 QQ44 1133
QQ33 1133 QQ44 1144
QQ33 1144 QQ44 1155
QQ33 1155 QQ44 1166**
QQ11 1166 QQ22 1177**
UUnnwweeiigghhtteedd bbaassee ooff aapppplliiccaattiioonnss:: 11447711 666688 11111144 990055 558811 338822
Offered what wanted and took it 52% 47% 58% 60% 65% 61%
Took facility after issues 18% 22% 16% 17% 13% 12%
HHaavvee ffaacciilliittyy ((aannyy)) 7700%% 6699%% 7744%% 7777%% 7788%% 7733%%
Took another form of funding 6% 8% 10% 5% 6% 10%
No facility 23% 23% 16% 18% 16% 17%
Final outcome of overdraft/loan application by type of finance sought
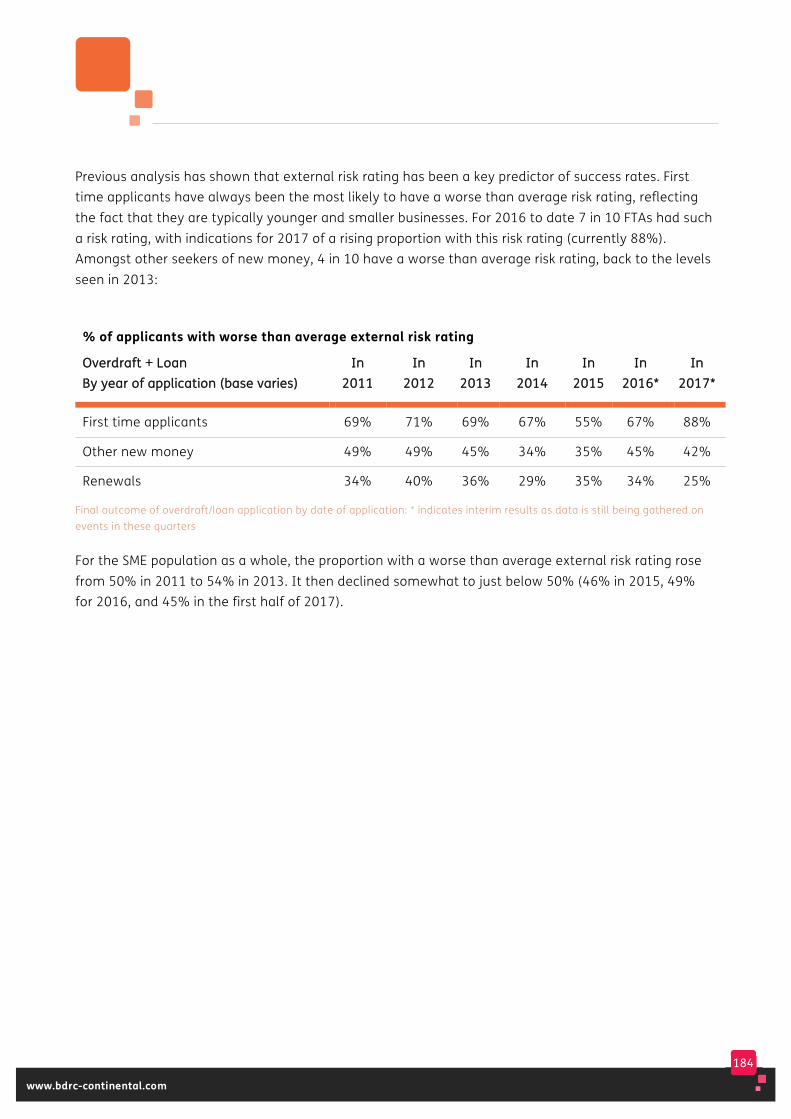
184
www.bdrc-continental.com
Previous analysis has shown that external risk rating has been a key predictor of success rates. First time applicants have always been the most likely to have a worse than average risk rating, reflecting the fact that they are typically younger and smaller businesses. For 2016 to date 7 in 10 FTAs had such a risk rating, with indications for 2017 of a rising proportion with this risk rating (currently 88%). Amongst other seekers of new money, 4 in 10 have a worse than average risk rating, back to the levels seen in 2013:
% of applicants with worse than average external risk rating
OOvveerrddrraafftt ++ LLooaann BByy yyeeaarr ooff aapppplliiccaattiioonn ((bbaassee vvaarriieess))
IInn 22001111
IInn 22001122
IInn 22001133
IInn 22001144
IInn 22001155
IInn 22001166**
IInn 22001177**
First time applicants 69% 71% 69% 67% 55% 67% 88%
Other new money 49% 49% 45% 34% 35% 45% 42%
Renewals 34% 40% 36% 29% 35% 34% 25%
Final outcome of overdraft/loan application by date of application: * indicates interim results as data is still being gathered on events in these quarters
For the SME population as a whole, the proportion with a worse than average external risk rating rose from 50% in 2011 to 54% in 2013. It then declined somewhat to just below 50% (46% in 2015, 49% for 2016, and 45% in the first half of 2017).

185
www.bdrc-continental.com
10. The impact of the application/ renewal process
This chapter reports on the experience of applying for Type 1 loan and overdraft events and the impact on the wider banking relationship.
186
www.bdrc-continental.com
Key findings 86% of overdrafts and 64% of loans were in place within 2 weeks, with almost all (96% of both loan and overdraft applicants) saying the facility was available in good time.
• Over time the proportion of facilities granted in two weeks has been fairly stable, as has the proportion of overdrafts agreed ‘in good time’. The propotion of loans agreed ‘in good time’ has increased from 86% for the 18 months to Q4 2014 to 96% currently
• Applying for an overdraft remained somewhat more likely to be described as a ‘low effort’ experience (77%) than applying for a loan (65%).
96% of those offered the loan they wanted and 91% of those offered the overdraft they wanted were satisfied with the application process. For those who ended the process with other funding, or no funding, satisfaction levels were markedly lower (13% for loans and 20% for overdrafts).
More broadly, almost a quarter of SMEs (22%) described their working relationship with their bank as ‘strong’, increasing by size of SME from 19% of those with 0 employees to 59% of those with 50-249 employees.
• 13% of SMEs said they did not have an active relationship with their bank and wished that they did. Those with 0 employees (14%) or 1-9 employees (12%) were more likely to say this that those with 10-49 or 50-249 employees (7% and 5%)
• The remaining two thirds of SMEs described their working relationship as ‘fine but transactional’
• This has changed very litte over time.
187
www.bdrc-continental.com
In H1 2017, a quarter (27%) of SMEs had had some contact with a bank about finance
• 18% had been contacted by a bank in the previous 3 months expressing a willingness to lend (13% by their own bank and 8% by another bank). This has increased slightly over time – in 2012 and 2013, 13% of SMEs reported such contact
• 15% of all SMEs reported having any conversation, even informal, with their bank in the previous year about external finance
• In both instances, larger SMEs were more likely to have been contacted
• Overall, 27% had had contact from a bank, increasing by size from 26% of those with 0 employees to 43% of those with 50-249 employees.
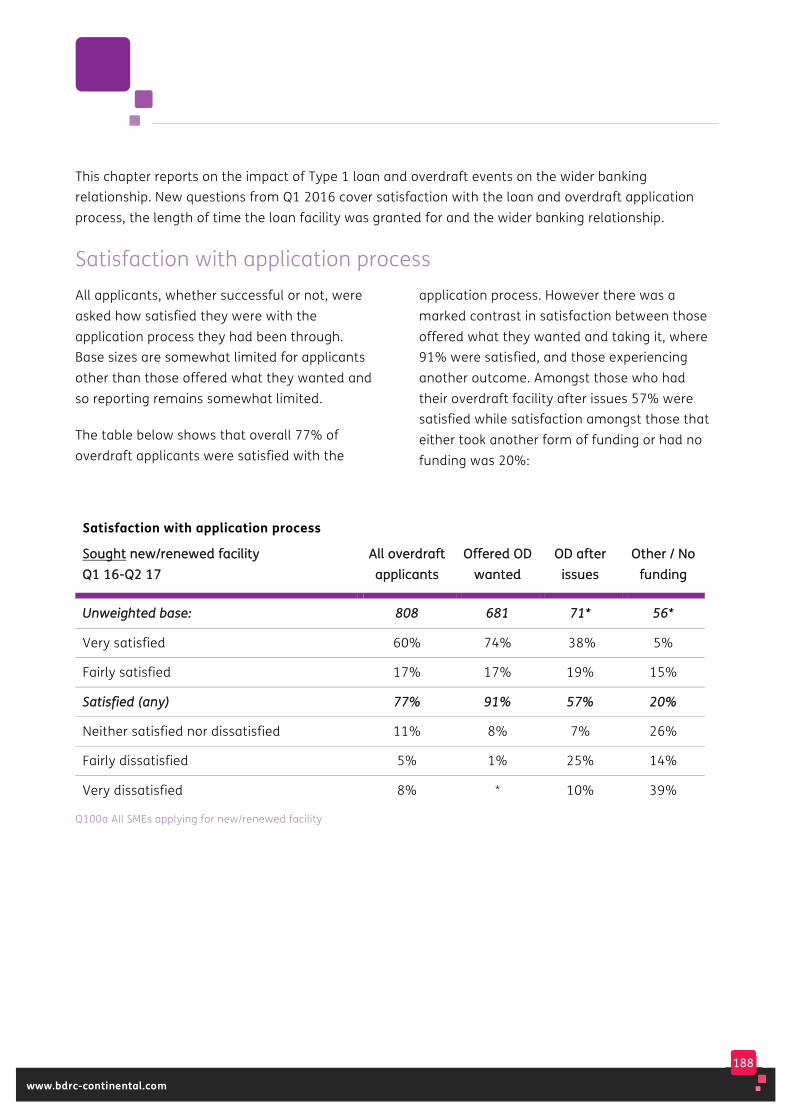
188
www.bdrc-continental.com
This chapter reports on the impact of Type 1 loan and overdraft events on the wider banking relationship. New questions from Q1 2016 cover satisfaction with the loan and overdraft application process, the length of time the loan facility was granted for and the wider banking relationship.
Satisfaction with application process All applicants, whether successful or not, were asked how satisfied they were with the application process they had been through. Base sizes are somewhat limited for applicants other than those offered what they wanted and so reporting remains somewhat limited.
The table below shows that overall 77% of overdraft applicants were satisfied with the
application process. However there was a marked contrast in satisfaction between those offered what they wanted and taking it, where 91% were satisfied, and those experiencing another outcome. Amongst those who had their overdraft facility after issues 57% were satisfied while satisfaction amongst those that either took another form of funding or had no funding was 20%:
Satisfaction with application process
SSoouugghhtt nneeww//rreenneewweedd ffaacciilliittyy QQ11 1166--QQ22 1177
AAllll oovveerrddrraafftt aapppplliiccaannttss
OOffffeerreedd OODD wwaanntteedd
OODD aafftteerr iissssuueess
OOtthheerr // NNoo ffuunnddiinngg
UUnnwweeiigghhtteedd bbaassee:: 880088 668811 7711** 5566**
Very satisfied 60% 74% 38% 5%
Fairly satisfied 17% 17% 19% 15%
SSaattiissffiieedd ((aannyy)) 7777%% 9911%% 5577%% 2200%%
Neither satisfied nor dissatisfied 11% 8% 7% 26%
Fairly dissatisfied 5% 1% 25% 14%
Very dissatisfied 8% * 10% 39%
Q100a All SMEs applying for new/renewed facility
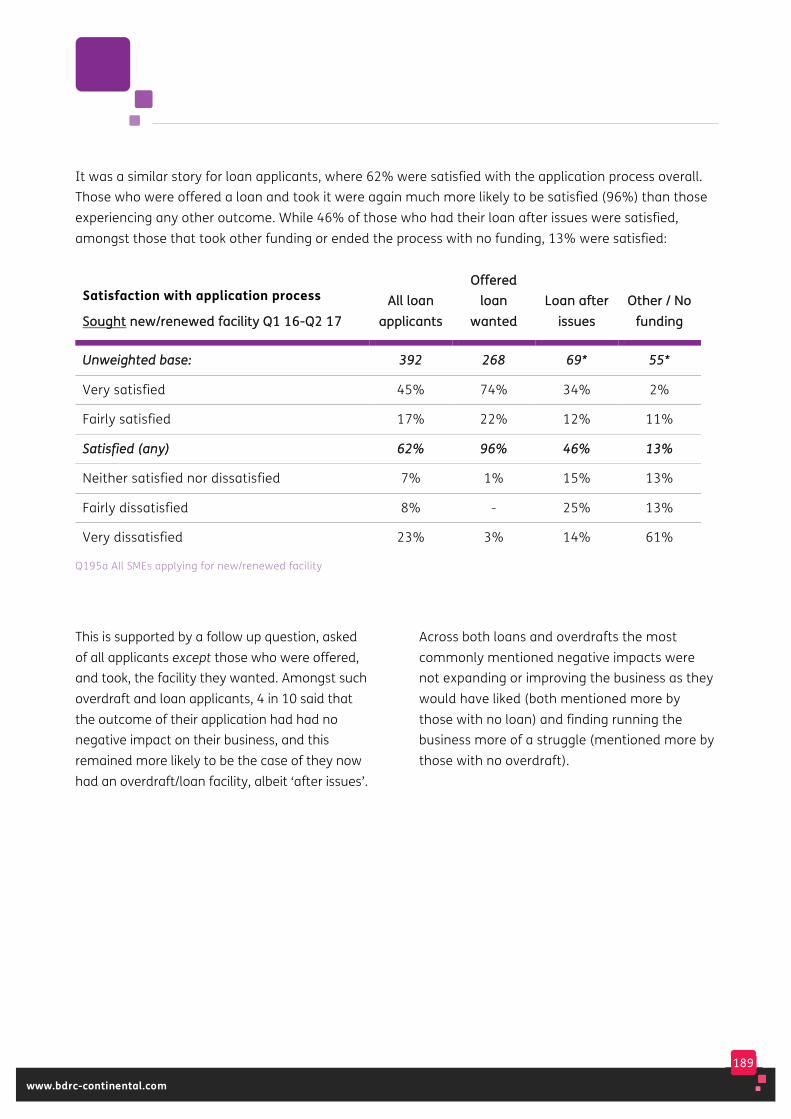
189
www.bdrc-continental.com
It was a similar story for loan applicants, where 62% were satisfied with the application process overall. Those who were offered a loan and took it were again much more likely to be satisfied (96%) than those experiencing any other outcome. While 46% of those who had their loan after issues were satisfied, amongst those that took other funding or ended the process with no funding, 13% were satisfied:
Satisfaction with application process
SSoouugghhtt nneeww//rreenneewweedd ffaacciilliittyy QQ11 1166--QQ22 1177 AAllll llooaann
aapppplliiccaannttss
OOffffeerreedd llooaann
wwaanntteedd LLooaann aafftteerr
iissssuueess OOtthheerr // NNoo
ffuunnddiinngg
UUnnwweeiigghhtteedd bbaassee:: 339922 226688 6699** 5555**
Very satisfied 45% 74% 34% 2%
Fairly satisfied 17% 22% 12% 11%
SSaattiissffiieedd ((aannyy)) 6622%% 9966%% 4466%% 1133%%
Neither satisfied nor dissatisfied 7% 1% 15% 13%
Fairly dissatisfied 8% - 25% 13%
Very dissatisfied 23% 3% 14% 61%
Q195a All SMEs applying for new/renewed facility
This is supported by a follow up question, asked of all applicants except those who were offered, and took, the facility they wanted. Amongst such overdraft and loan applicants, 4 in 10 said that the outcome of their application had had no negative impact on their business, and this remained more likely to be the case of they now had an overdraft/loan facility, albeit ‘after issues’.
Across both loans and overdrafts the most commonly mentioned negative impacts were not expanding or improving the business as they would have liked (both mentioned more by those with no loan) and finding running the business more of a struggle (mentioned more by those with no overdraft).
190
www.bdrc-continental.com
Period for which new loan facility granted From Q1 2016 those with a new loan or commercial mortgage were asked how long the loan was granted for:
• 43% of new loans/commercial mortgages were for less than 5 years (with little difference by size of applicant)
• 45% were for 5-10 years (more common for smaller applicants)
• 9% were for 11-20 years (more common amongst larger applicants)
• 3% were for more than 20 years (with little difference by size).
Most successful applicants (90%) said that they got the time period that they had wanted the loan for:
• 8% would have liked the loan over a longer time period
• 2% would have liked a loan over a shorter time period
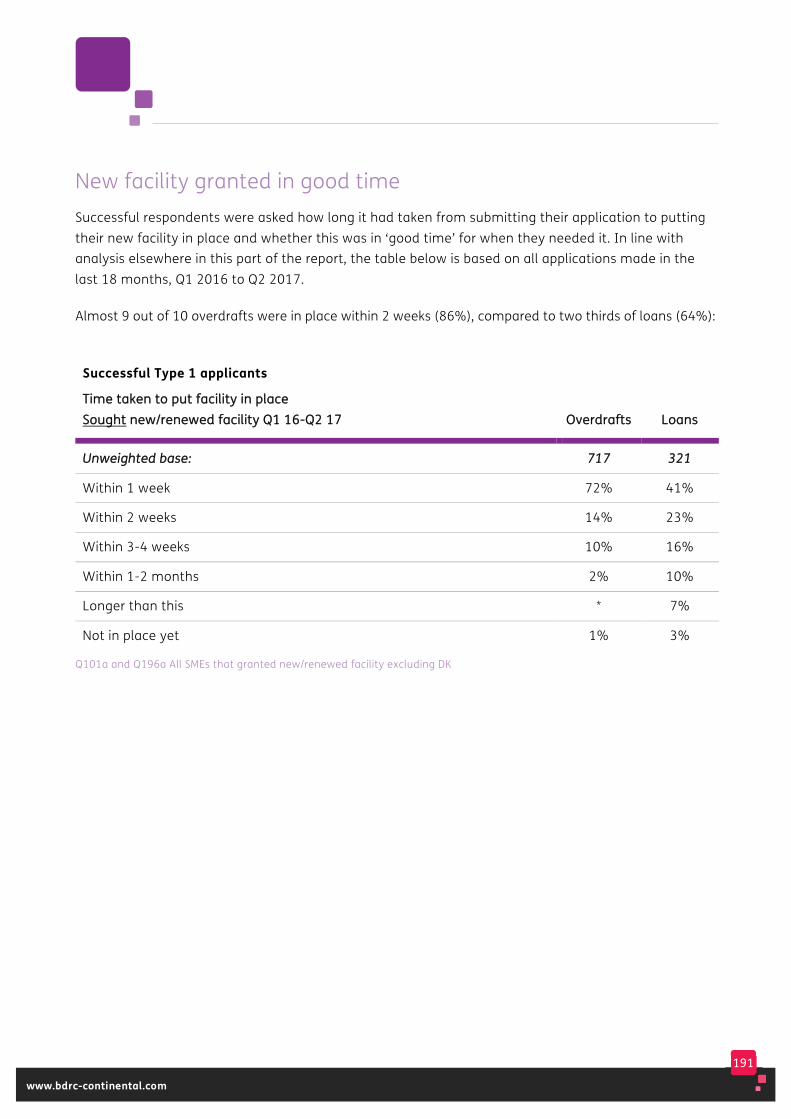
191
www.bdrc-continental.com
New facility granted in good time Successful respondents were asked how long it had taken from submitting their application to putting their new facility in place and whether this was in ‘good time’ for when they needed it. In line with analysis elsewhere in this part of the report, the table below is based on all applications made in the last 18 months, Q1 2016 to Q2 2017.
Almost 9 out of 10 overdrafts were in place within 2 weeks (86%), compared to two thirds of loans (64%):
Successful Type 1 applicants
TTiimmee ttaakkeenn ttoo ppuutt ffaacciilliittyy iinn ppllaaccee SSoouugghhtt nneeww//rreenneewweedd ffaacciilliittyy QQ11 1166--QQ22 1177 OOvveerrddrraaffttss LLooaannss
UUnnwweeiigghhtteedd bbaassee:: 771177 332211
Within 1 week 72% 41%
Within 2 weeks 14% 23%
Within 3-4 weeks 10% 16%
Within 1-2 months 2% 10%
Longer than this * 7%
Not in place yet 1% 3%
Q101a and Q196a All SMEs that granted new/renewed facility excluding DK

192
www.bdrc-continental.com
Further analysis is provided in the table below.
Time taken & impact SSuucccceessssffuull TTyyppee 11 aapppplliiccaannttss QQ11 22001166 ttoo QQ22 22001177
By size of SME Loan facilities for smaller SMEs were more likely to be made available within a week (44% for loans where the SME had 0-9 employees, 28% where they had 10-249 employees) with a similar difference by size for overdrafts (74% v 57% available within a week).
In place in good time?
Most applicants agreed that the facility had been put in place in good time for when it was needed (96% for both overdraft and loan applicants).
In place in good time, by size of SME
Larger loan applicants were slightly less likely to say the loan was available in good time, although most did:
• Amongst applicants with 0-9 employees, 96% said their overdraft was made available in good time, while for loans it was 97%.
• Amongst larger applicants 96% said their overdraft was made available in good time, while for loans it was 89%.
Analysis by the length of time taken for the facility to be put in place showed that overall almost all those waiting up to 3 weeks said that the facility had been put in place in good time.
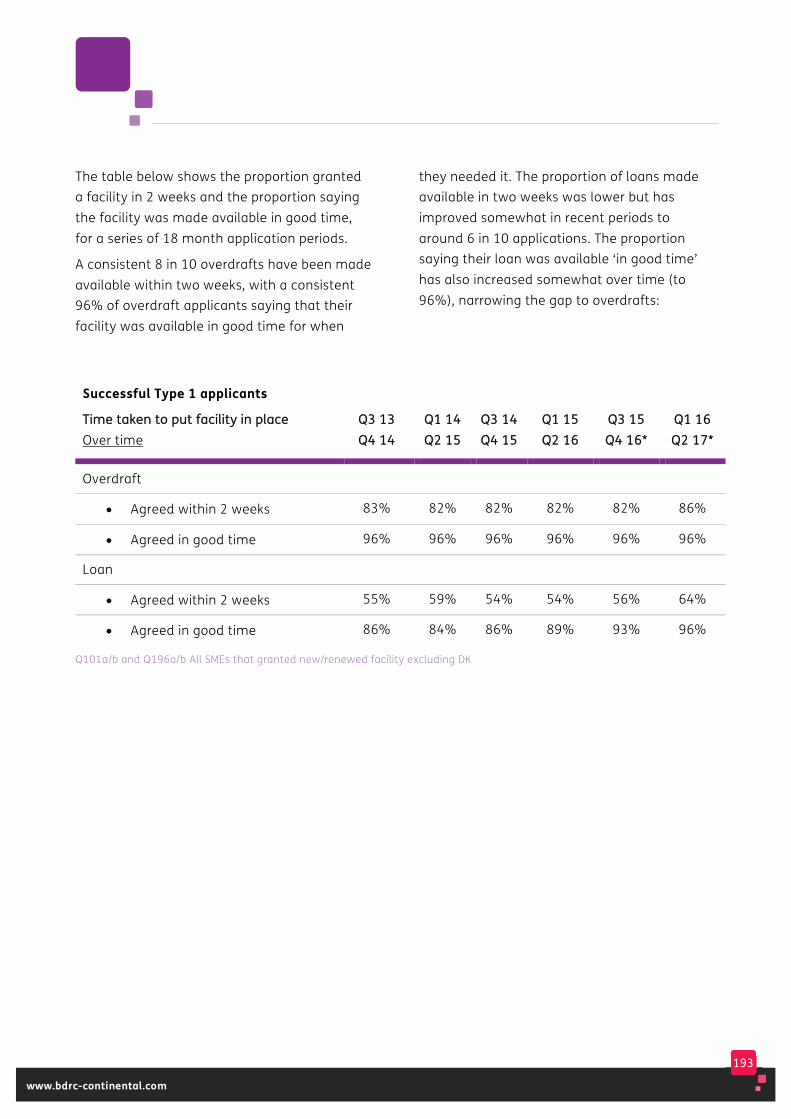
193
www.bdrc-continental.com
The table below shows the proportion granted a facility in 2 weeks and the proportion saying the facility was made available in good time, for a series of 18 month application periods.
A consistent 8 in 10 overdrafts have been made available within two weeks, with a consistent 96% of overdraft applicants saying that their facility was available in good time for when
they needed it. The proportion of loans made available in two weeks was lower but has improved somewhat in recent periods to around 6 in 10 applications. The proportion saying their loan was available ‘in good time’ has also increased somewhat over time (to 96%), narrowing the gap to overdrafts:
Successful Type 1 applicants
TTiimmee ttaakkeenn ttoo ppuutt ffaacciilliittyy iinn ppllaaccee
Over time QQ33 1133 QQ44 1144
QQ11 1144 QQ22 1155
QQ33 1144 QQ44 1155
QQ11 1155 QQ22 1166
QQ33 1155 QQ44 1166**
QQ11 1166 QQ22 1177**
Overdraft
• Agreed within 2 weeks 83% 82% 82% 82% 82% 86%
• Agreed in good time 96% 96% 96% 96% 96% 96%
Loan
• Agreed within 2 weeks 55% 59% 54% 54% 56% 64%
• Agreed in good time 86% 84% 86% 89% 93% 96%
Q101a/b and Q196a/b All SMEs that granted new/renewed facility excluding DK
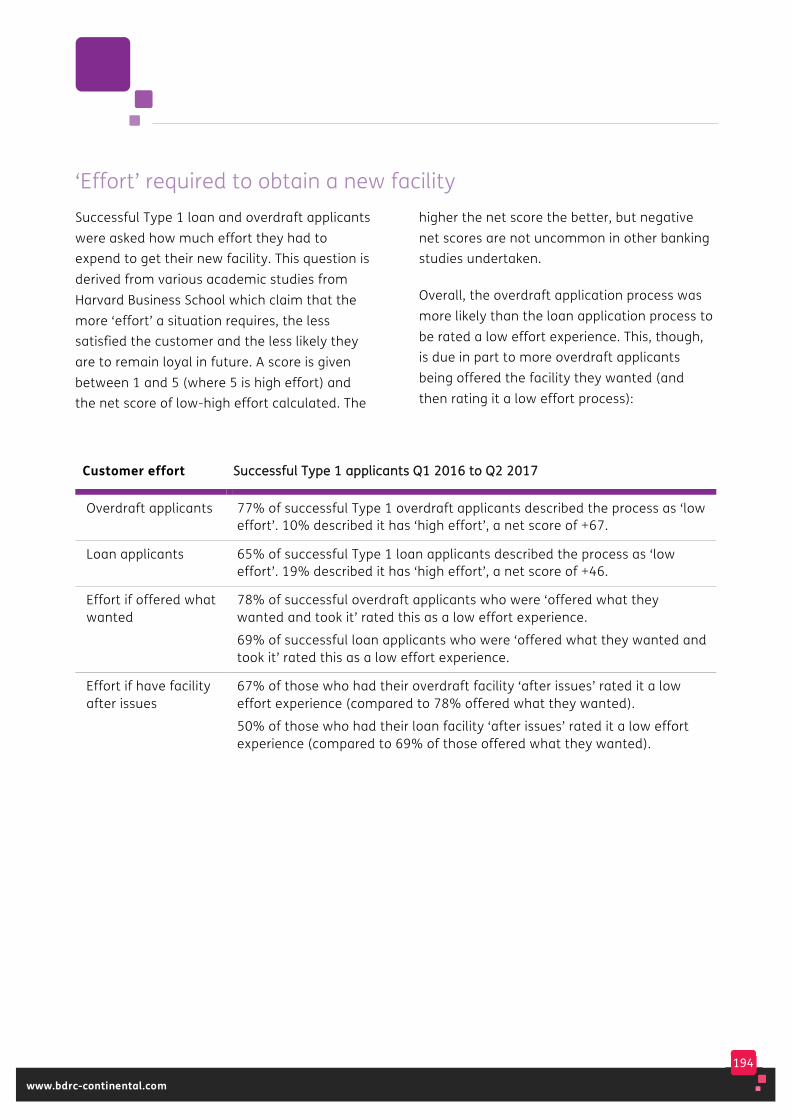
194
www.bdrc-continental.com
‘Effort’ required to obtain a new facility Successful Type 1 loan and overdraft applicants were asked how much effort they had to expend to get their new facility. This question is derived from various academic studies from Harvard Business School which claim that the more ‘effort’ a situation requires, the less satisfied the customer and the less likely they are to remain loyal in future. A score is given between 1 and 5 (where 5 is high effort) and the net score of low-high effort calculated. The
higher the net score the better, but negative net scores are not uncommon in other banking studies undertaken.
Overall, the overdraft application process was more likely than the loan application process to be rated a low effort experience. This, though, is due in part to more overdraft applicants being offered the facility they wanted (and then rating it a low effort process):
Customer effort SSuucccceessssffuull TTyyppee 11 aapppplliiccaannttss QQ11 22001166 ttoo QQ22 22001177
Overdraft applicants 77% of successful Type 1 overdraft applicants described the process as ‘low effort’. 10% described it has ‘high effort’, a net score of +67.
Loan applicants 65% of successful Type 1 loan applicants described the process as ‘low effort’. 19% described it has ‘high effort’, a net score of +46.
Effort if offered what wanted
78% of successful overdraft applicants who were ‘offered what they wanted and took it’ rated this as a low effort experience.
69% of successful loan applicants who were ‘offered what they wanted and took it’ rated this as a low effort experience.
Effort if have facility after issues
67% of those who had their overdraft facility ‘after issues’ rated it a low effort experience (compared to 78% offered what they wanted).
50% of those who had their loan facility ‘after issues’ rated it a low effort experience (compared to 69% of those offered what they wanted).
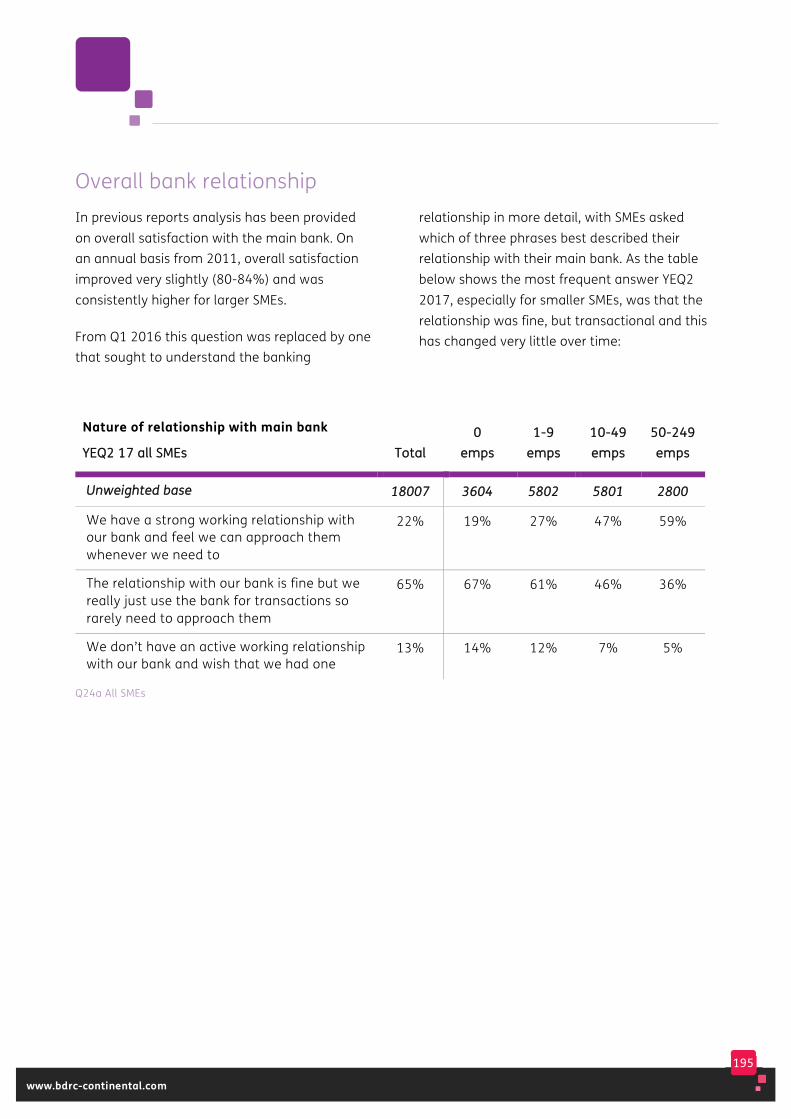
195
www.bdrc-continental.com
Overall bank relationship In previous reports analysis has been provided on overall satisfaction with the main bank. On an annual basis from 2011, overall satisfaction improved very slightly (80-84%) and was consistently higher for larger SMEs.
From Q1 2016 this question was replaced by one that sought to understand the banking
relationship in more detail, with SMEs asked which of three phrases best described their relationship with their main bank. As the table below shows the most frequent answer YEQ2 2017, especially for smaller SMEs, was that the relationship was fine, but transactional and this has changed very little over time:
Nature of relationship with main bank
YYEEQQ22 1177 aallll SSMMEEss TToottaall 00
eemmppss 11--99
eemmppss 1100--4499 eemmppss
5500--224499 eemmppss
UUnnwweeiigghhtteedd bbaassee 1188000077 33660044 55880022 55880011 22880000
We have a strong working relationship with our bank and feel we can approach them whenever we need to
22% 19% 27% 47% 59%
The relationship with our bank is fine but we really just use the bank for transactions so rarely need to approach them
65% 67% 61% 46% 36%
We don’t have an active working relationship with our bank and wish that we had one
13% 14% 12% 7% 5%
Q24a All SMEs
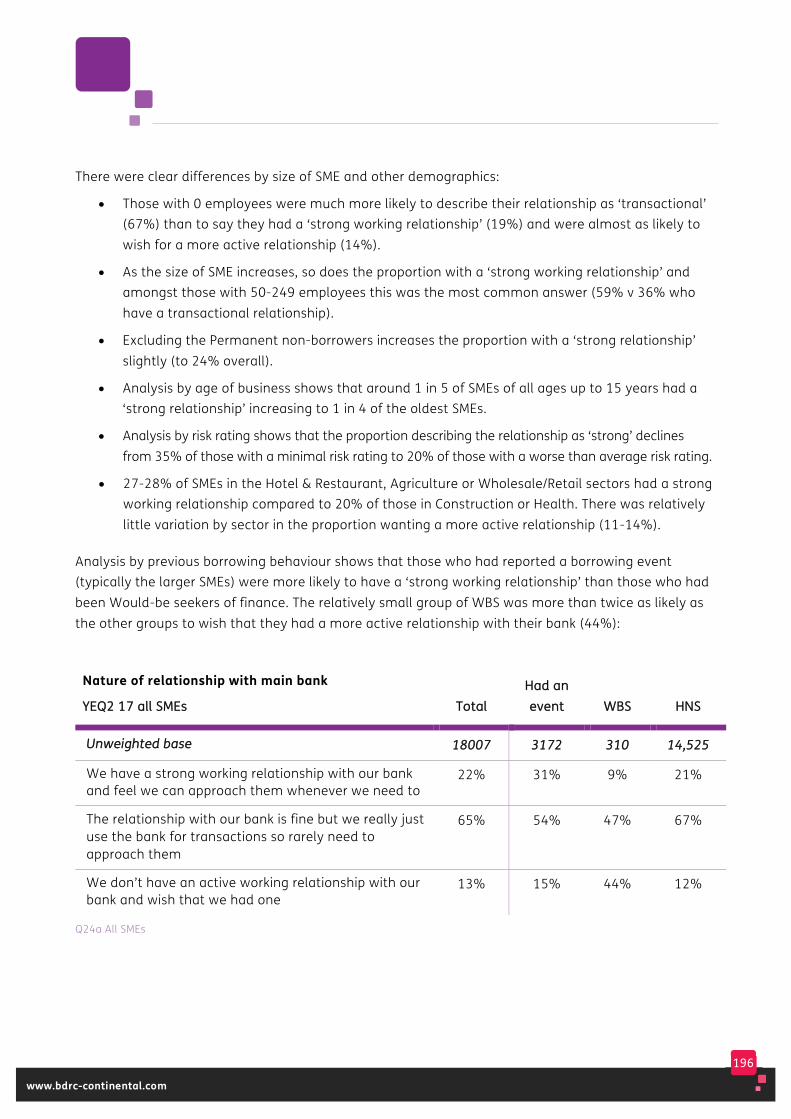
196
www.bdrc-continental.com
There were clear differences by size of SME and other demographics:
• Those with 0 employees were much more likely to describe their relationship as ‘transactional’ (67%) than to say they had a ‘strong working relationship’ (19%) and were almost as likely to wish for a more active relationship (14%).
• As the size of SME increases, so does the proportion with a ‘strong working relationship’ and amongst those with 50-249 employees this was the most common answer (59% v 36% who have a transactional relationship).
• Excluding the Permanent non-borrowers increases the proportion with a ‘strong relationship’ slightly (to 24% overall).
• Analysis by age of business shows that around 1 in 5 of SMEs of all ages up to 15 years had a ‘strong relationship’ increasing to 1 in 4 of the oldest SMEs.
• Analysis by risk rating shows that the proportion describing the relationship as ‘strong’ declines from 35% of those with a minimal risk rating to 20% of those with a worse than average risk rating.
• 27-28% of SMEs in the Hotel & Restaurant, Agriculture or Wholesale/Retail sectors had a strong working relationship compared to 20% of those in Construction or Health. There was relatively little variation by sector in the proportion wanting a more active relationship (11-14%).
Analysis by previous borrowing behaviour shows that those who had reported a borrowing event (typically the larger SMEs) were more likely to have a ‘strong working relationship’ than those who had been Would-be seekers of finance. The relatively small group of WBS was more than twice as likely as the other groups to wish that they had a more active relationship with their bank (44%):
Nature of relationship with main bank
YYEEQQ22 1177 aallll SSMMEEss TToottaall HHaadd aann eevveenntt WWBBSS HHNNSS
UUnnwweeiigghhtteedd bbaassee 1188000077 33117722 331100 1144,,552255
We have a strong working relationship with our bank and feel we can approach them whenever we need to
22% 31% 9% 21%
The relationship with our bank is fine but we really just use the bank for transactions so rarely need to approach them
65% 54% 47% 67%
We don’t have an active working relationship with our bank and wish that we had one
13% 15% 44% 12%
Q24a All SMEs
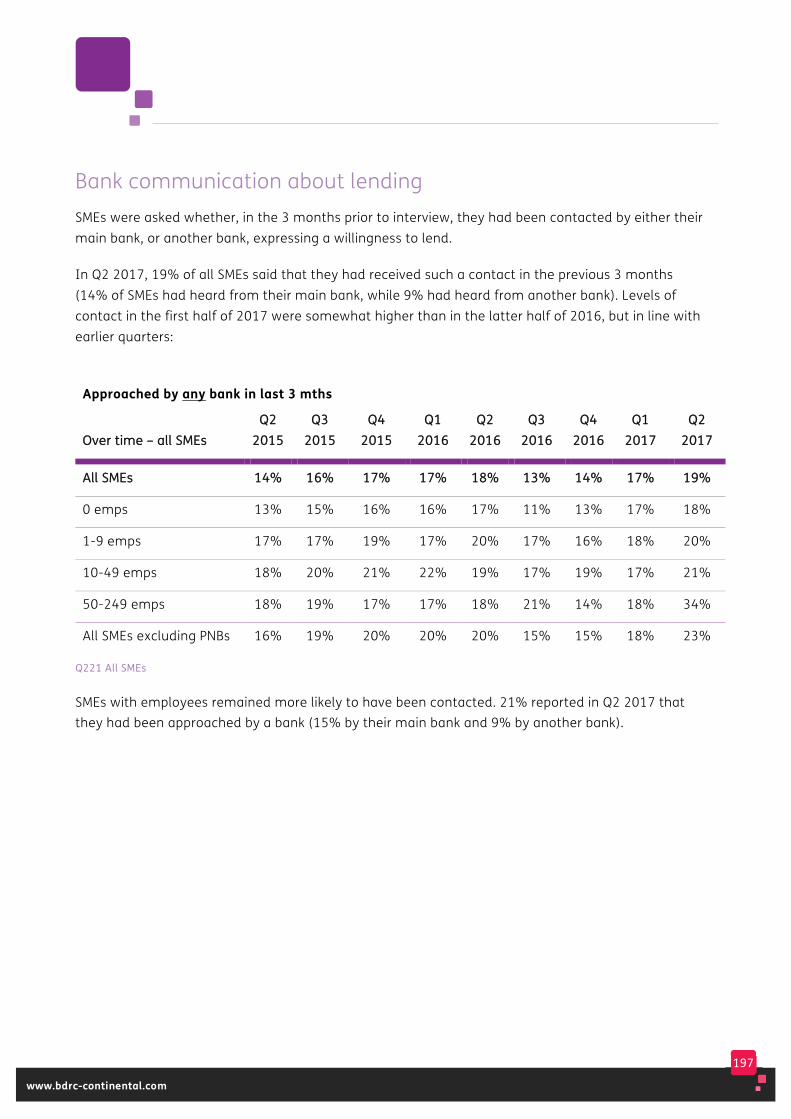
197
www.bdrc-continental.com
Bank communication about lending SMEs were asked whether, in the 3 months prior to interview, they had been contacted by either their main bank, or another bank, expressing a willingness to lend.
In Q2 2017, 19% of all SMEs said that they had received such a contact in the previous 3 months (14% of SMEs had heard from their main bank, while 9% had heard from another bank). Levels of contact in the first half of 2017 were somewhat higher than in the latter half of 2016, but in line with earlier quarters:
Approached by any bank in last 3 mths
OOvveerr ttiimmee –– aallll SSMMEEss QQ22
22001155 QQ33
22001155 QQ44
22001155 QQ11
22001166 QQ22
22001166 QQ33
22001166 QQ44
22001166 QQ11
22001177 QQ22
22001177
AAllll SSMMEEss 1144%% 1166%% 1177%% 1177%% 1188%% 1133%% 1144%% 1177%% 1199%%
0 emps 13% 15% 16% 16% 17% 11% 13% 17% 18%
1-9 emps 17% 17% 19% 17% 20% 17% 16% 18% 20%
10-49 emps 18% 20% 21% 22% 19% 17% 19% 17% 21%
50-249 emps 18% 19% 17% 17% 18% 21% 14% 18% 34%
All SMEs excluding PNBs 16% 19% 20% 20% 20% 15% 15% 18% 23%
Q221 All SMEs
SMEs with employees remained more likely to have been contacted. 21% reported in Q2 2017 that they had been approached by a bank (15% by their main bank and 9% by another bank).

198
www.bdrc-continental.com
Analysis over time shows that level of contacts in H1 2017 where somewhat higher than in previous years:
Approached by banks in last 3 months
AAllll SSMMEEss oovveerr ttiimmee 22001122 22001133 22001144 22001155
22001166 HH11
22001177
UUnnwweeiigghhtteedd bbaassee:: 2200,,005555 2200,,003366 2200,,005555 2200,,004466 1188,,000000 99000077
Approached by main bank 8% 9% 10% 11% 10% 13%
Approached by other bank 6% 5% 5% 6% 7% 8%
AAnnyy aapppprrooaacchh 1133%% 1133%% 1144%% 1155%% 1155%% 1188%%
Q221 All SMEs
A new question from Q1 2017, asked more generally whether the SME had had any conversation or contact, however informal, with their bank about external finance in the previous 12 months. As the table below shows, 15% had, increasing to 31% of the largest SMEs:
Had any contact with bank re finance
HH11 1177 aallll SSMMEEss TToottaall 00
eemmppss 11--99
eemmppss 1100--4499 eemmppss
5500--224499 eemmppss
UUnnwweeiigghhtteedd bbaassee 88667777 11776699 22883300 22776633 11331155
Yes 15% 14% 17% 24% 31%
No 85% 86% 83% 76% 69%
Q24b All SMEs excl DK
Initial analysis of this new question shows that
• Those with a minimal risk rating were more likely to have had contact (21%) compared to 14% of those with a worse than average risk rating.
• Those currently using external finance were twice as likely to have had contact (23%) as those not using external finance (11%).
• There was little difference by age of business (12-18%). By sector, contact ranged from 22% in Agriculture (who were also more likely to have a strong relationship with their bank) to 12% in Construction (14-18% across other sectors).

199
www.bdrc-continental.com
Further analysis of the existing and new questions in combination shows that 27% of all SMEs had had contact with a bank at either of these two questions (ie expressing a willingness to lend and/or a more general or informal contact about finance). Larger SMEs were more likely to have had contact:
• 26% of those with 0 employees had had contact
• 30% of those with 1-9 employees
• 34% of those with 10-49 employees
• 43% of those with 50-249 employees
Levels of contact were higher once the Permanent non-borrowers were excluded (33%) and amongst those already using external finance (35%). They were also higher amongst those planning to apply for finance (44%) and those who had a strong working relationship with their bank (37%).

200
www.bdrc-continental.com
11. Rates and fees – Type 1 events
This chapter covers the security, interest rates and fees pertaining to overdrafts and loans granted after a Type 1 borrowing event (that is an application or a renewal) that occurred in the 18 months Q1 2016 to Q2 2017.
201
www.bdrc-continental.com
Key findings Small base sizes limit the amount of analysis possible in this chapter.
Most overdrafts (83%) were for £25,000 or less. Loans were typically somewhat larger, with 85% granted for £100,000 or less.
37% of overdrafts and 56% of loans (including commercial mortgages) were secured, often on property.
The majority of facilities were on a fixed rate: 6 in 10 overdrafts and 7 in 10 loans were on a fixed rate.
Most overdraft applicants paid a fee for their facility (16% didn’t). 60% paid a fee that was equivalent to 2% or less of the facility granted.
Fewer loan applicants paid a fee for their facility (44% didn’t). 81% paid a fee that was equivalent to 2% or less of the facility granted.
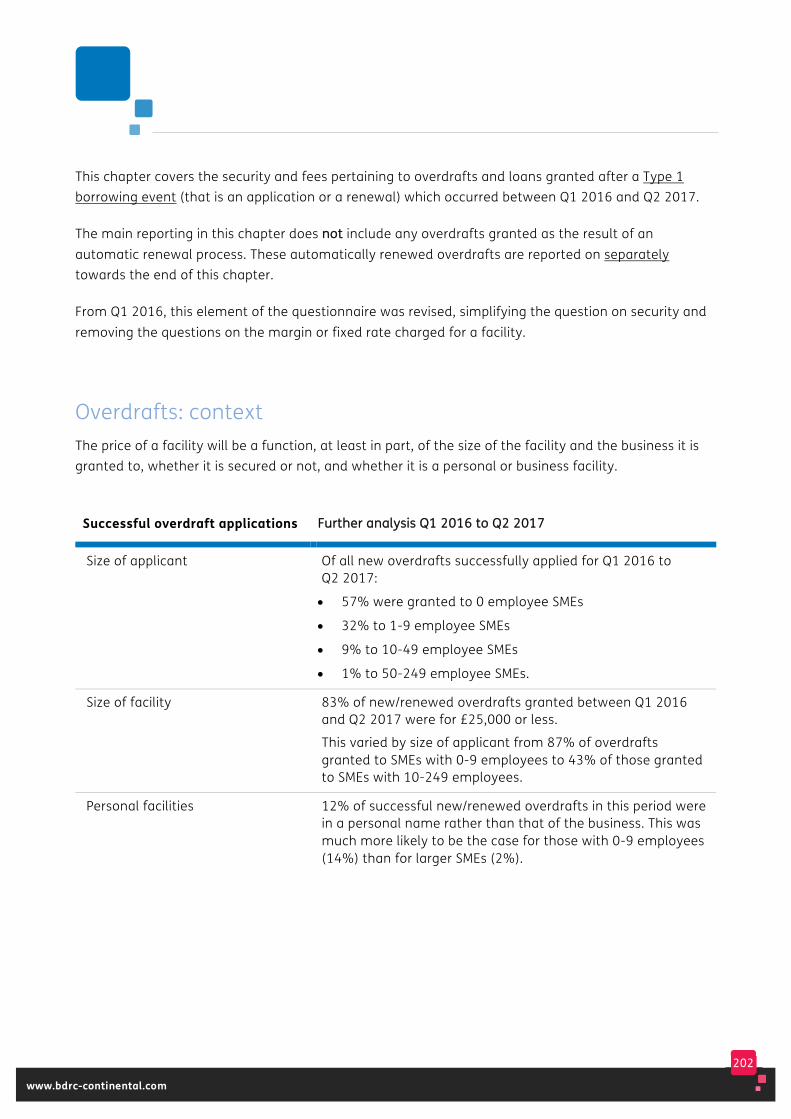
202
www.bdrc-continental.com
This chapter covers the security and fees pertaining to overdrafts and loans granted after a Type 1 borrowing event (that is an application or a renewal) which occurred between Q1 2016 and Q2 2017.
The main reporting in this chapter does nnoott include any overdrafts granted as the result of an automatic renewal process. These automatically renewed overdrafts are reported on separately towards the end of this chapter.
From Q1 2016, this element of the questionnaire was revised, simplifying the question on security and removing the questions on the margin or fixed rate charged for a facility.
Overdrafts: context The price of a facility will be a function, at least in part, of the size of the facility and the business it is granted to, whether it is secured or not, and whether it is a personal or business facility.
Successful overdraft applications FFuurrtthheerr aannaallyyssiiss QQ11 22001166 ttoo QQ22 22001177
Size of applicant Of all new overdrafts successfully applied for Q1 2016 to Q2 2017:
• 57% were granted to 0 employee SMEs
• 32% to 1-9 employee SMEs
• 9% to 10-49 employee SMEs
• 1% to 50-249 employee SMEs.
Size of facility 83% of new/renewed overdrafts granted between Q1 2016and Q2 2017 were for £25,000 or less.
This varied by size of applicant from 87% of overdrafts granted to SMEs with 0-9 employees to 43% of those granted to SMEs with 10-249 employees.
Personal facilities 12% of successful new/renewed overdrafts in this period were in a personal name rather than that of the business. This was much more likely to be the case for those with 0-9 employees (14%) than for larger SMEs (2%).
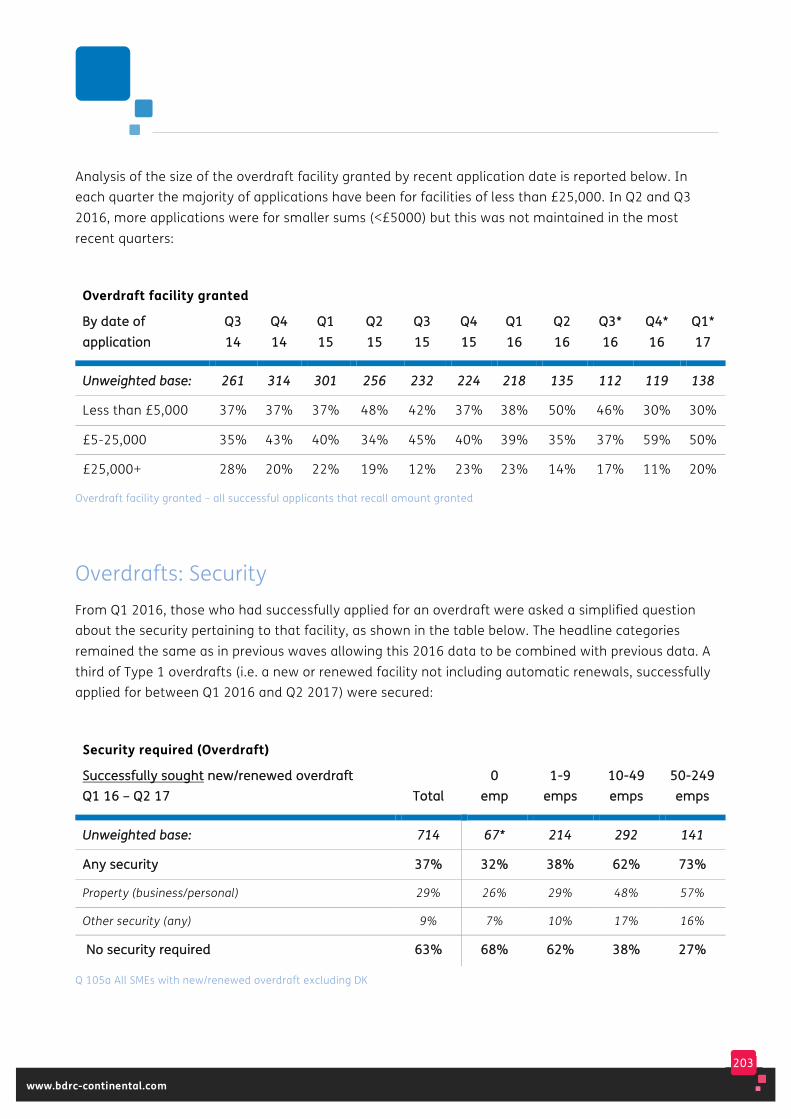
203
www.bdrc-continental.com
Analysis of the size of the overdraft facility granted by recent application date is reported below. In each quarter the majority of applications have been for facilities of less than £25,000. In Q2 and Q3 2016, more applications were for smaller sums (<£5000) but this was not maintained in the most recent quarters:
Overdraft facility granted
BByy ddaattee ooff aapppplliiccaattiioonn
QQ33 1144
QQ44 1144
QQ11 1155
QQ22 1155
QQ33 1155
QQ44 1155
QQ11 1166
QQ22 1166
QQ33** 1166
QQ44** 1166
QQ11**1177
UUnnwweeiigghhtteedd bbaassee:: 226611 331144 330011 225566 223322 222244 221188 113355 111122 111199 113388
Less than £5,000 37% 37% 37% 48% 42% 37% 38% 50% 46% 30% 30%
£5-25,000 35% 43% 40% 34% 45% 40% 39% 35% 37% 59% 50%
£25,000+ 28% 20% 22% 19% 12% 23% 23% 14% 17% 11% 20%
Overdraft facility granted – all successful applicants that recall amount granted
Overdrafts: Security From Q1 2016, those who had successfully applied for an overdraft were asked a simplified question about the security pertaining to that facility, as shown in the table below. The headline categories remained the same as in previous waves allowing this 2016 data to be combined with previous data. A third of Type 1 overdrafts (i.e. a new or renewed facility not including automatic renewals, successfully applied for between Q1 2016 and Q2 2017) were secured:
Security required (Overdraft)
SSuucccceessssffuullllyy ssoouugghhtt nneeww//rreenneewweedd oovveerrddrraafftt QQ11 1166 –– QQ22 1177 TToottaall
00 eemmpp
11--99 eemmppss
1100--4499 eemmppss
5500--224499 eemmppss
UUnnwweeiigghhtteedd bbaassee:: 771144 6677** 221144 229922 114411
AAnnyy sseeccuurriittyy 3377%% 3322%% 3388%% 6622%% 7733%%
Property (business/personal) 29% 26% 29% 48% 57%
Other security (any) 9% 7% 10% 17% 16%
NNoo sseeccuurriittyy rreeqquuiirreedd 6633%% 6688%% 6622%% 3388%% 2277%%
Q 105a All SMEs with new/renewed overdraft excluding DK
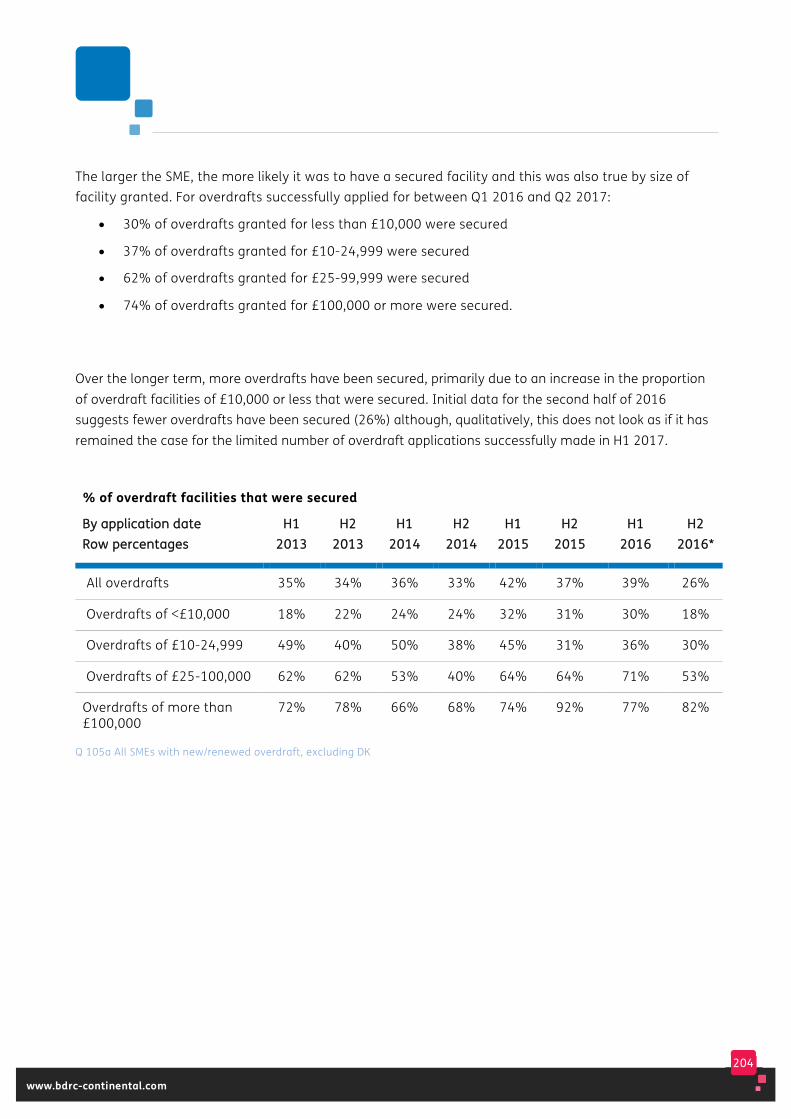
204
www.bdrc-continental.com
The larger the SME, the more likely it was to have a secured facility and this was also true by size of facility granted. For overdrafts successfully applied for between Q1 2016 and Q2 2017:
• 30% of overdrafts granted for less than £10,000 were secured
• 37% of overdrafts granted for £10-24,999 were secured
• 62% of overdrafts granted for £25-99,999 were secured
• 74% of overdrafts granted for £100,000 or more were secured.
Over the longer term, more overdrafts have been secured, primarily due to an increase in the proportion of overdraft facilities of £10,000 or less that were secured. Initial data for the second half of 2016 suggests fewer overdrafts have been secured (26%) although, qualitatively, this does not look as if it has remained the case for the limited number of overdraft applications successfully made in H1 2017.
% of overdraft facilities that were secured
BByy aapppplliiccaattiioonn ddaattee RRooww ppeerrcceennttaaggeess
HH11 22001133
HH22 22001133
HH11 22001144
HH22 22001144
HH11 22001155
HH22 22001155
HH11 22001166
HH22 22001166**
All overdrafts 35% 34% 36% 33% 42% 37% 39% 26%
Overdrafts of <£10,000 18% 22% 24% 24% 32% 31% 30% 18%
Overdrafts of £10-24,999 49% 40% 50% 38% 45% 31% 36% 30%
Overdrafts of £25-100,000 62% 62% 53% 40% 64% 64% 71% 53%
Overdrafts of more than £100,000
72% 78% 66% 68% 74% 92% 77% 82%
Q 105a All SMEs with new/renewed overdraft, excluding DK
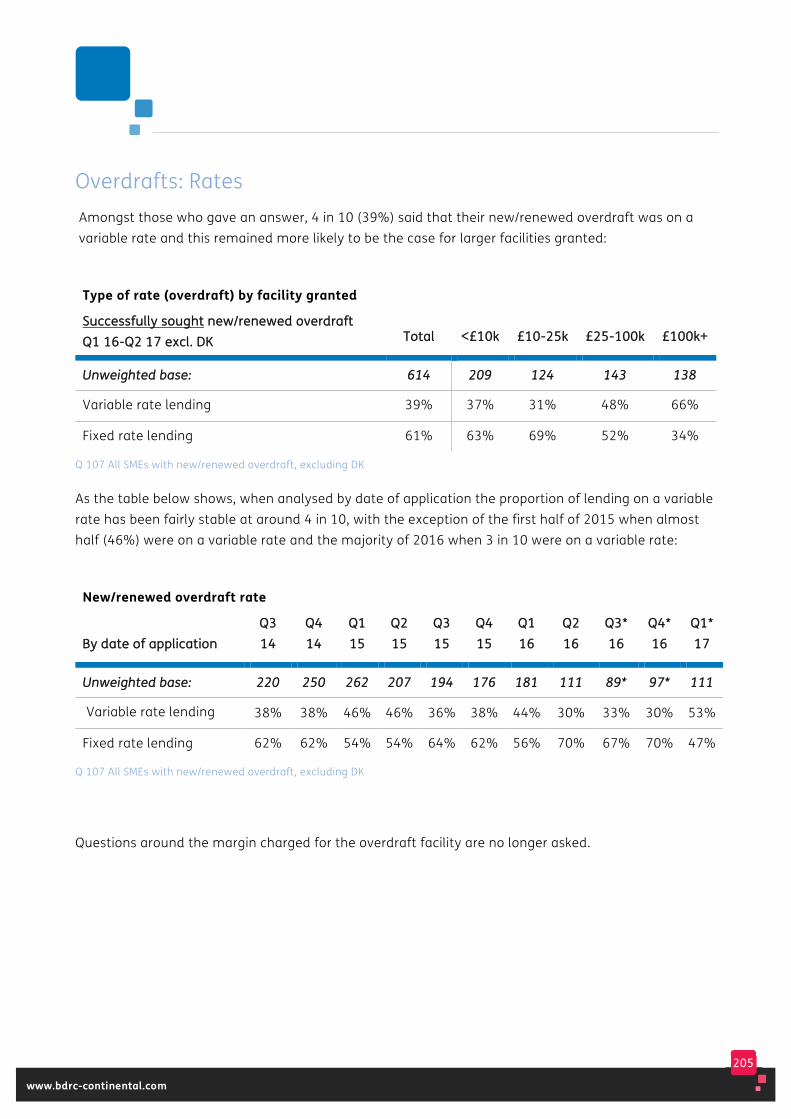
205
www.bdrc-continental.com
Overdrafts: Rates Amongst those who gave an answer, 4 in 10 (39%) said that their new/renewed overdraft was on a variable rate and this remained more likely to be the case for larger facilities granted:
Type of rate (overdraft) by facility granted
SSuucccceessssffuullllyy ssoouugghhtt nneeww//rreenneewweedd oovveerrddrraafftt QQ11 1166--QQ22 1177 eexxccll.. DDKK TToottaall <<££1100kk ££1100--2255kk ££2255--110000kk ££110000kk++
UUnnwweeiigghhtteedd bbaassee:: 661144 220099 112244 114433 113388
Variable rate lending 39% 37% 31% 48% 66%
Fixed rate lending 61% 63% 69% 52% 34%
Q 107 All SMEs with new/renewed overdraft, excluding DK
As the table below shows, when analysed by date of application the proportion of lending on a variable rate has been fairly stable at around 4 in 10, with the exception of the first half of 2015 when almost half (46%) were on a variable rate and the majority of 2016 when 3 in 10 were on a variable rate:
New/renewed overdraft rate
BByy ddaattee ooff aapppplliiccaattiioonn QQ33 1144
QQ44 1144
QQ11 1155
QQ22 1155
QQ33 1155
QQ44 1155
QQ11 1166
QQ22 1166
QQ33** 1166
QQ44** 1166
QQ11** 1177
UUnnwweeiigghhtteedd bbaassee:: 222200 225500 226622 220077 119944 117766 118811 111111 8899** 9977** 111111
Variable rate lending 38% 38% 46% 46% 36% 38% 44% 30% 33% 30% 53%
Fixed rate lending 62% 62% 54% 54% 64% 62% 56% 70% 67% 70% 47%
Q 107 All SMEs with new/renewed overdraft, excluding DK
Questions around the margin charged for the overdraft facility are no longer asked.
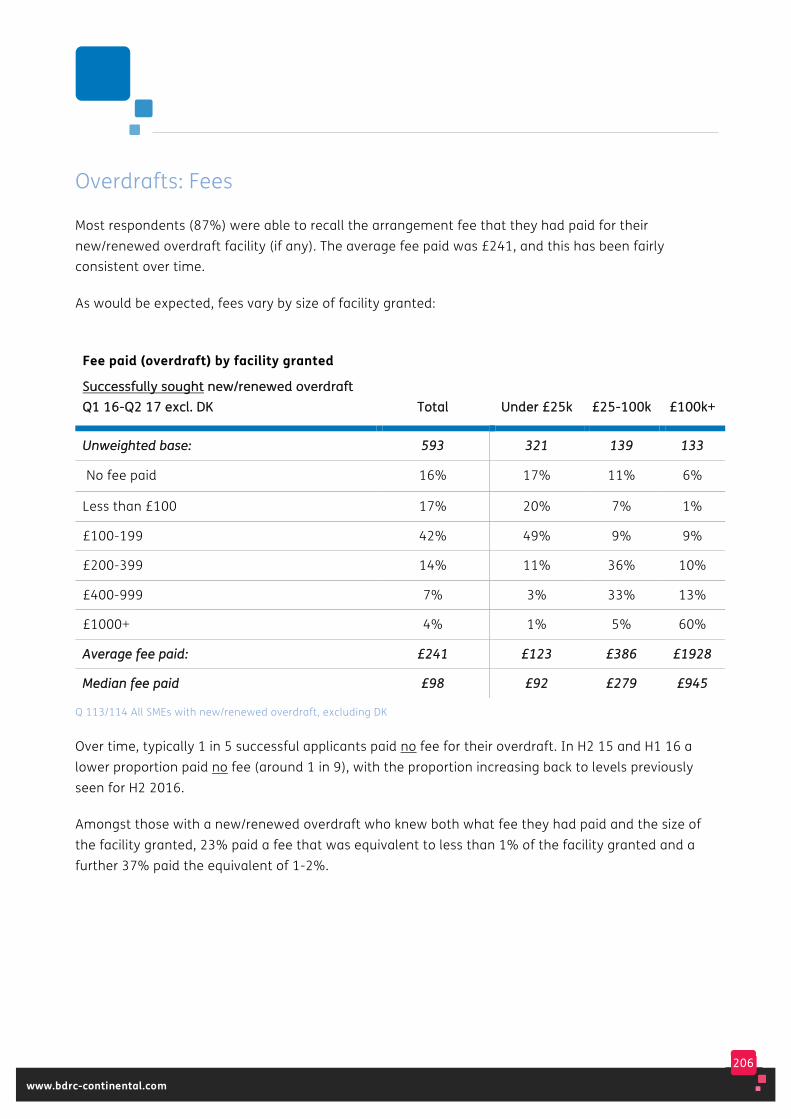
206
www.bdrc-continental.com
Overdrafts: Fees
Most respondents (87%) were able to recall the arrangement fee that they had paid for their new/renewed overdraft facility (if any). The average fee paid was £241, and this has been fairly consistent over time.
As would be expected, fees vary by size of facility granted:
Fee paid (overdraft) by facility granted
SSuucccceessssffuullllyy ssoouugghhtt nneeww//rreenneewweedd oovveerrddrraafftt QQ11 1166--QQ22 1177 eexxccll.. DDKK TToottaall UUnnddeerr ££2255kk ££2255--110000kk ££110000kk++
UUnnwweeiigghhtteedd bbaassee:: 559933 332211 113399 113333
No fee paid 16% 17% 11% 6%
Less than £100 17% 20% 7% 1%
£100-199 42% 49% 9% 9%
£200-399 14% 11% 36% 10%
£400-999 7% 3% 33% 13%
£1000+ 4% 1% 5% 60%
AAvveerraaggee ffeeee ppaaiidd:: ££224411 ££112233 ££338866 ££11992288
MMeeddiiaann ffeeee ppaaiidd ££9988 ££9922 ££227799 ££994455
Q 113/114 All SMEs with new/renewed overdraft, excluding DK
Over time, typically 1 in 5 successful applicants paid no fee for their overdraft. In H2 15 and H1 16 a lower proportion paid no fee (around 1 in 9), with the proportion increasing back to levels previously seen for H2 2016.
Amongst those with a new/renewed overdraft who knew both what fee they had paid and the size of the facility granted, 23% paid a fee that was equivalent to less than 1% of the facility granted and a further 37% paid the equivalent of 1-2%.
207
www.bdrc-continental.com
Almost all of those borrowing £25,000 or more paid a fee which was the equivalent of 2% or less of the facility granted. This compares to around 4 in 10 of those with a facility of £10,000 or less:
• 42% of those granted a new/renewed overdraft facility of less than £10,000 paid the equivalent of 2% or less
• 91% of those granted a new/renewed overdraft facility of £10-25,000 paid the equivalent of 2% or less
• 96% of those granted a new/renewed overdraft facility of £25-100,000 paid the equivalent of 2% or less
• 97% of those granted a new/renewed overdraft facility of more than £100,000 paid the equivalent of 2% or less.
An analysis of secured and unsecured overdrafts is shown below:
Unsecured and secured overdrafts FFuurrtthheerr aannaallyyssiiss QQ11 22001166 ttoo QQ22 22001177
Amount borrowed Most unsecured overdrafts were for less than £25,000 (91%) compared to 70% of secured overdrafts.
Variable rates Secured overdrafts were somewhat more likely to be on a variable rate (48%) than unsecured overdrafts (34%).
Fees Secured overdrafts were somewhat more likely to attract a fee (96%) than unsecured overdrafts (78%), and the average fee charged was higher (£440 secured compared to £130 unsecured).
Whilst secured overdrafts typically attracted a higher fee in absolute terms, these are typically larger facilities and the fee was as likely to be the equivalent of 2% or less of the agreed facility (65%) than was the case for unsecured overdrafts (59%).
208
www.bdrc-continental.com
Overdraft terms: Analysis by risk rating Sample sizes also permit some analysis of size of facility and fees by the external risk rating of the SME granted the facility. Businesses with a minimal/low risk rating typically had a larger, secured, facility:
Further analysis by risk rating Q1 2016 to Q2 2017
Amount borrowed Most overdrafts granted to those with an average or worse than average risk rating were for less than £25,000 (86%) compared to 69% of those granted to SMEs with a minimal or low risk rating.
Security Those with a minimal or low risk rating were more likely to have a secured overdraft (46%) than those with an average or worse than average rating (32%).
For both groups, those borrowing more than £25,000 were more likely to have a secured facility (69% for minimal/low and 63% for average/worse than average).
Variable rates Those with an average or worse than average risk rating were somewhat more likely to be on a variable rate (46% v 36%)
Fees Those with a minimal or low risk rating were more likely to have paid a fee for their overdraft (90% for minimal/low and 78% for average/worse than average).
Those with a minimal/low risk rating paid a higher fee in absolute terms (£446 v £153 for those with an average or worse than average risk rating) but this was as likely to be the equivalent of 2% or less of the agreed facility (68%) as for those with an average or worse than average risk rating (67%).
209
www.bdrc-continental.com
Overdraft terms: Analysis by sector
Overall in the 18 months Q1 2016 to Q2 2017, 83% of overdrafts successfully applied for were facilities of £25,000 or less. On limited base sizes by sector this varied relatively little (between 73% and 96%), with the exception of Agriculture where 51% of overdrafts granted were for less than £25,000.
As the table below shows, these larger overdrafts in the Agricultural sector were also more likely to be secured:
Type 1 overdraft
SSuucccceessssffuullllyy ssoouugghhtt nneeww// rreenneewweedd oovveerrddrraafftt QQ11 1166--QQ22 1177 eexxccll.. DDKK AAggrriicc MMffgg CCoonnssttrr
WWhhllee RReettaaiill
HHootteell RReesstt TTrraannss
PPrroopp// BBuuss
HHlltthh SSWWrrkk
OOtthheerr CCoommmm
UUnnwweeiigghhtteedd bbaassee:: 7766** 6699** 113300 8855** 3388** 7722** 112299 3388** 7777**
Any security 69% 39% 46% 42% 41% 34% 18%
- property 68% 31% 30% 34% 36% 22% 18%
No security 31% 61% 54% 58% 59% 66% 82%
Q 105a All SMEs with new/renewed overdraft excluding DK
Overall, 4 in 10 of successful Type 1 overdrafts were on a variable rate (39%). On limited base sizes, overdrafts granted to SMEs in Construction or the Other Community sector were less likely to be on a variable rate:
Type 1 overdraft rate
SSuucccceessssffuullllyy ssoouugghhtt nneeww// rreenneewweedd oovveerrddrraafftt QQ11 1166--QQ22 1177 eexxccll.. DDKK AAggrriicc MMffgg CCoonnssttrr
WWhhllee RReettaaiill
HHootteell RReesstt TTrraannss
PPrroopp// BBuuss
HHlltthh SSWWrrkk
OOtthheerr CCoommmm
UUnnwweeiigghhtteedd bbaassee:: 7733** 6611** 110055 7777** 3355** 6600** 111100 2288** 6655**
Variable rate lending 47% 48% 17% 27% 62% 48% 9%
Fixed rate lending 53% 52% 83% 73% 38% 52% 91%
Q 107 All SMEs with new/renewed overdraft excluding DK

210
www.bdrc-continental.com
Whilst those in Agriculture paid on average a higher fee, this is a reflection of the larger overdraft facilities successfully applied for in this sector, given that they were more likely than many other sectors to pay a fee equivalent to 2% or less of the sum borrowed:
Type 1 overdraft fees
SSuucccceessssffuullllyy ssoouugghhtt nneeww// rreenneewweedd oovveerrddrraafftt QQ11 1166--QQ22 1177 eexxccll.. DDKK AAggrriicc MMffgg CCoonnssttrr
WWhhllee RReettaaiill
HHootteell RReesstt TTrraannss
PPrroopp// BBuuss
HHlltthh SSWWrrkk
OOtthheerr CCoommmm
UUnnwweeiigghhtteedd bbaassee ((vvaarriieess))::
6677** 5577** 110011 7722** 3366** 5588** 111100 3300** 6622**
No fee paid 11% 36% 10% 8% 11% 17% 8%
Average fee paid £516 £209 £297 £336 £279 £172 £179
Equivalent of 2% or less paid*
89% 77% 60% 55% 67% 49% 69%
Q 113/114 All SMEs with new/renewed overdraft excluding DK

211
www.bdrc-continental.com
Overdrafts: Automatic renewals As mentioned earlier in this chapter, data is available on the fees and security pertaining to overdraft facilities that were automatically renewed. The table below shows this data for all automatic renewals that occurred between Q1 2016 and Q2 2017.
10% of these automatic renewals were in a personal name (v 12% of Type 1 overdrafts granted). They were in many ways quite similar to Type 1 overdraft events in the same period:
Overdraft rates and fees summary
QQ11 1166--QQ22 1177 AAuuttoommaattiiccaallllyy
rreenneewweedd TTyyppee 11
oovveerrddrraafftt eevveenntt
UUnnwweeiigghhtteedd bbaassee ((vvaarriieess bbyy qquueessttiioonn)):: 11336644 775522
Any security required 26% 37%
Facility on a variable rate (excluding DK) 43% 39%
No fee 20% 16%
Average fee paid £293 £241
All SMEs with new/renewed overdraft, excluding DK
212
www.bdrc-continental.com
Loans: Context As with the overdraft section above, this section is based on SMEs that had made an application for a new or renewed loan facility during the latest 18 month period which for this report is between Q1 2016 and Q2 2017.
The price of a facility will be a function, at least in part, of the size of the facility and of the business granted that facility, whether it is secured or not, and whether it is a personal or business facility.
Successful loan applications FFuurrtthheerr aannaallyyssiiss QQ11 22001166 ttoo QQ22 22001177
Size of applicant Of all new loans successfully applied for between Q1 2016 and Q2 2017:
• 51% were granted to 0 employee SMEs
• 34% to 1-9 employee SMEs
• 13% to 10-49 employee SMEs
• 2% to 50-249 employee SMEs.
Size of facility 85% of new/renewed loans granted in the period Q1 2016 to Q2 2017 were for £100,000 or less. By size of applicant this varied from 89% of loans granted to SMEs with 0-9 employees to 59% of loans granted to those with 10-249 employees.
Personal facilities 22% of successful new/renewed loans in this period had been applied for in a personal name rather than that of the business. By size of applicant this varied from 26% of loans granted to SMEs with 0-9 employees to 4% of loans granted to those with 10-249 employees.
Personal facilities will typically be priced differently to business facilities, so as an indication 26% of all loans agreed for less than £100,000 were applied for in a personal name, compared to 2% of loans £100k+.
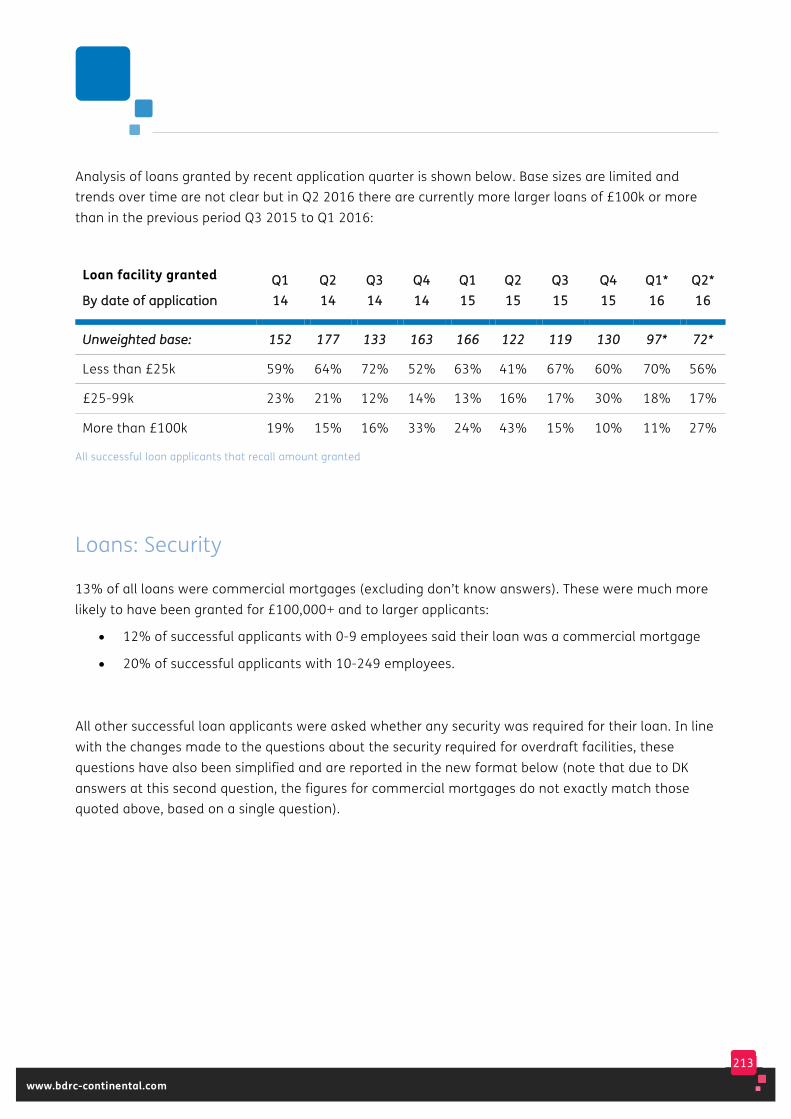
213
www.bdrc-continental.com
Analysis of loans granted by recent application quarter is shown below. Base sizes are limited and trends over time are not clear but in Q2 2016 there are currently more larger loans of £100k or more than in the previous period Q3 2015 to Q1 2016:
Loan facility granted
BByy ddaattee ooff aapppplliiccaattiioonn QQ11 1144
QQ22 1144
QQ33 1144
QQ44 1144
QQ11 1155
QQ22 1155
QQ33 1155
QQ44 1155
QQ11** 1166
QQ22** 1166
UUnnwweeiigghhtteedd bbaassee:: 115522 117777 113333 116633 116666 112222 111199 113300 9977** 7722**
Less than £25k 59% 64% 72% 52% 63% 41% 67% 60% 70% 56%
£25-99k 23% 21% 12% 14% 13% 16% 17% 30% 18% 17%
More than £100k 19% 15% 16% 33% 24% 43% 15% 10% 11% 27%
All successful loan applicants that recall amount granted
Loans: Security
13% of all loans were commercial mortgages (excluding don’t know answers). These were much more likely to have been granted for £100,000+ and to larger applicants:
• 12% of successful applicants with 0-9 employees said their loan was a commercial mortgage
• 20% of successful applicants with 10-249 employees.
All other successful loan applicants were asked whether any security was required for their loan. In line with the changes made to the questions about the security required for overdraft facilities, these questions have also been simplified and are reported in the new format below (note that due to DK answers at this second question, the figures for commercial mortgages do not exactly match those quoted above, based on a single question).
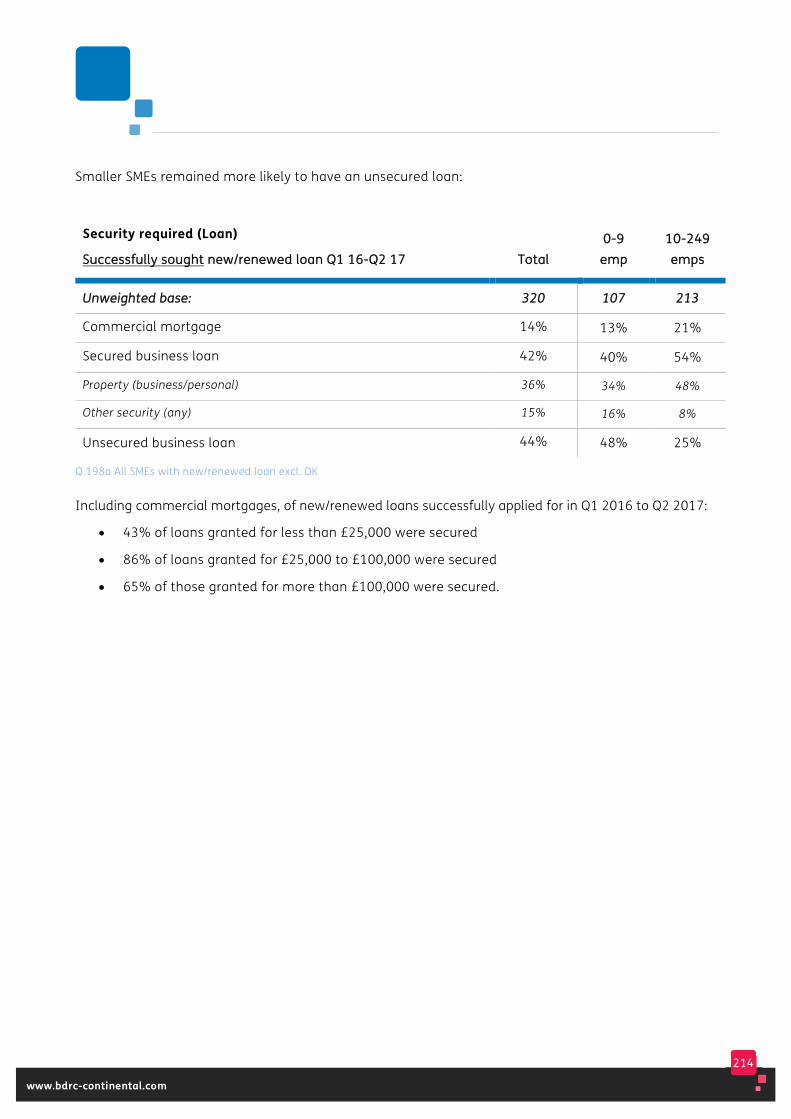
214
www.bdrc-continental.com
Smaller SMEs remained more likely to have an unsecured loan:
Security required (Loan)
SSuucccceessssffuullllyy ssoouugghhtt nneeww//rreenneewweedd llooaann QQ11 1166--QQ22 1177 TToottaall 00--99
eemmpp 1100--224499 eemmppss
UUnnwweeiigghhtteedd bbaassee:: 332200 110077 221133
Commercial mortgage 14% 13% 21%
Secured business loan 42% 40% 54%
Property (business/personal) 36% 34% 48%
Other security (any) 15% 16% 8%
Unsecured business loan 44% 48% 25%
Q 198a All SMEs with new/renewed loan excl. DK
Including commercial mortgages, of new/renewed loans successfully applied for in Q1 2016 to Q2 2017:
• 43% of loans granted for less than £25,000 were secured
• 86% of loans granted for £25,000 to £100,000 were secured
• 65% of those granted for more than £100,000 were secured.
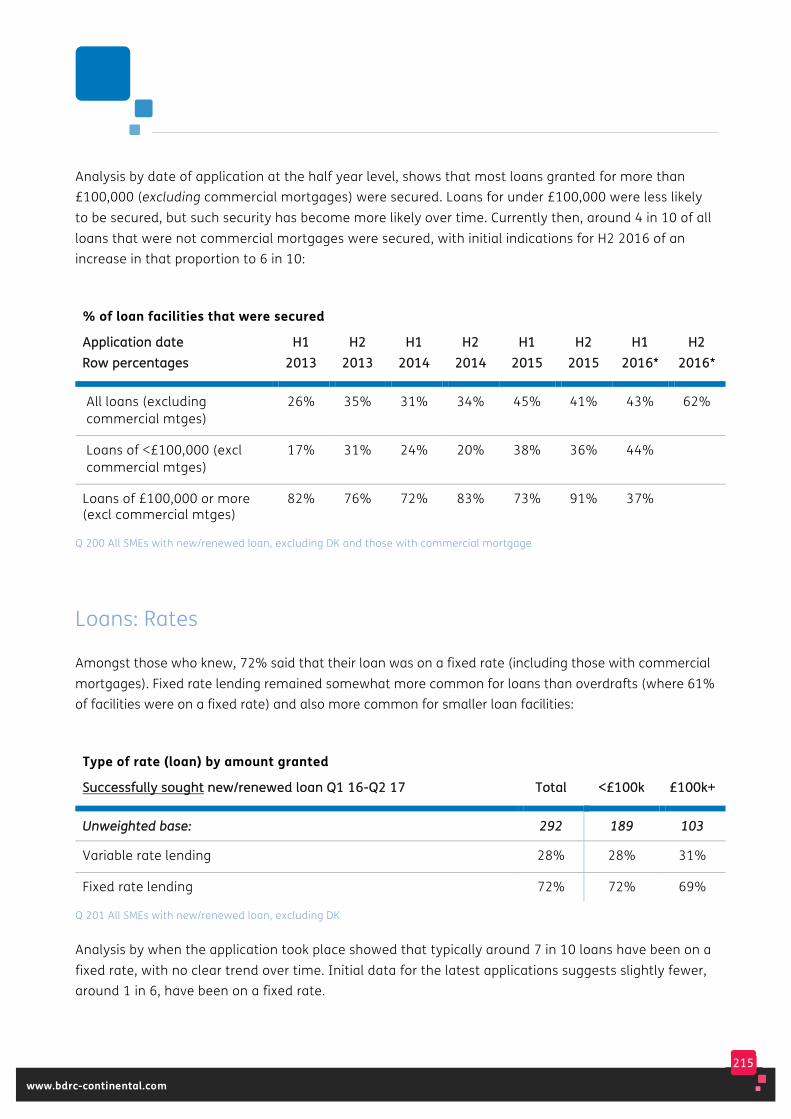
215
www.bdrc-continental.com
Analysis by date of application at the half year level, shows that most loans granted for more than £100,000 (excluding commercial mortgages) were secured. Loans for under £100,000 were less likely to be secured, but such security has become more likely over time. Currently then, around 4 in 10 of all loans that were not commercial mortgages were secured, with initial indications for H2 2016 of an increase in that proportion to 6 in 10:
% of loan facilities that were secured
AApppplliiccaattiioonn ddaattee RRooww ppeerrcceennttaaggeess
HH11 22001133
HH22 22001133
HH11 22001144
HH22 22001144
HH11 22001155
HH22 22001155
HH11 22001166**
HH22 22001166**
All loans (excluding commercial mtges)
26% 35% 31% 34% 45% 41% 43% 62%
Loans of <£100,000 (excl commercial mtges)
17% 31% 24% 20% 38% 36% 44%
Loans of £100,000 or more (excl commercial mtges)
82% 76% 72% 83% 73% 91% 37%
Q 200 All SMEs with new/renewed loan, excluding DK and those with commercial mortgage
Loans: Rates
Amongst those who knew, 72% said that their loan was on a fixed rate (including those with commercial mortgages). Fixed rate lending remained somewhat more common for loans than overdrafts (where 61% of facilities were on a fixed rate) and also more common for smaller loan facilities:
Type of rate (loan) by amount granted
SSuucccceessssffuullllyy ssoouugghhtt nneeww//rreenneewweedd llooaann QQ11 1166--QQ22 1177 TToottaall <<££110000kk ££110000kk++
UUnnwweeiigghhtteedd bbaassee:: 229922 118899 110033
Variable rate lending 28% 28% 31%
Fixed rate lending 72% 72% 69%
Q 201 All SMEs with new/renewed loan, excluding DK
Analysis by when the application took place showed that typically around 7 in 10 loans have been on a fixed rate, with no clear trend over time. Initial data for the latest applications suggests slightly fewer, around 1 in 6, have been on a fixed rate.
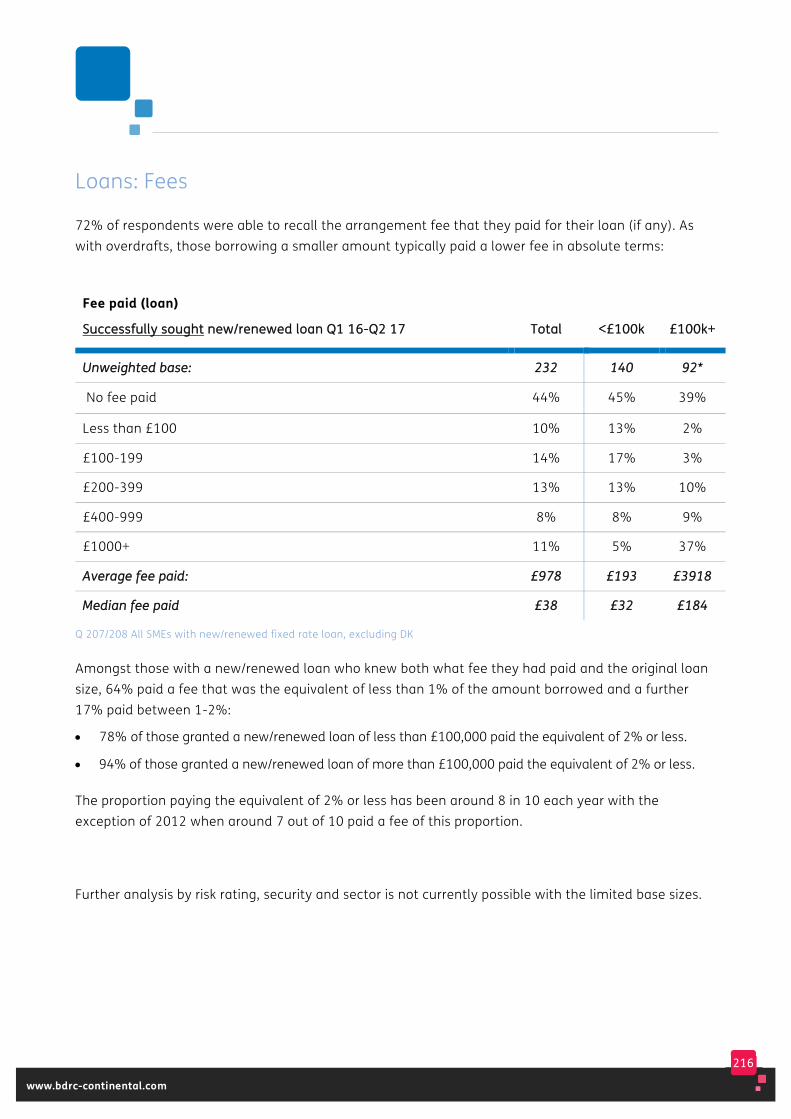
216
www.bdrc-continental.com
Loans: Fees
72% of respondents were able to recall the arrangement fee that they paid for their loan (if any). As with overdrafts, those borrowing a smaller amount typically paid a lower fee in absolute terms:
Fee paid (loan)
SSuucccceessssffuullllyy ssoouugghhtt nneeww//rreenneewweedd llooaann QQ11 1166--QQ22 1177 TToottaall <<££110000kk ££110000kk++
UUnnwweeiigghhtteedd bbaassee:: 223322 114400 9922**
No fee paid 44% 45% 39%
Less than £100 10% 13% 2%
£100-199 14% 17% 3%
£200-399 13% 13% 10%
£400-999 8% 8% 9%
£1000+ 11% 5% 37%
AAvveerraaggee ffeeee ppaaiidd:: ££997788 ££119933 ££33991188
MMeeddiiaann ffeeee ppaaiidd ££3388 ££3322 ££118844
Q 207/208 All SMEs with new/renewed fixed rate loan, excluding DK
Amongst those with a new/renewed loan who knew both what fee they had paid and the original loan size, 64% paid a fee that was the equivalent of less than 1% of the amount borrowed and a further 17% paid between 1-2%:
• 78% of those granted a new/renewed loan of less than £100,000 paid the equivalent of 2% or less.
• 94% of those granted a new/renewed loan of more than £100,000 paid the equivalent of 2% or less.
The proportion paying the equivalent of 2% or less has been around 8 in 10 each year with the exception of 2012 when around 7 out of 10 paid a fee of this proportion.
Further analysis by risk rating, security and sector is not currently possible with the limited base sizes.
217
www.bdrc-continental.com
12. Why were SMEs not looking to borrow in the previous 12 months?
This chapter looks at those that had not had a borrowing event, to explore whether they wanted to apply for loan/overdraft finance in the previous 12 months and any barriers to applying.
218
www.bdrc-continental.com
Key findings Most SMEs (85% YEQ2 2017) met the definition of a Happy non-seeker of finance, having not applied, nor wanted to apply, for finance in the 12 months prior to interview.
• The majority of SMEs in each size band were Happy non-seekers (79-87%) and the proportion has increased over time, from 68% of all SMEs in 2012 to 84% in both 2016 and the first half of 2017.
Very few SMEs (2% YEQ2 2017) met the definition of a ‘Would-be seeker’ of finance, where they had wanted to apply for a loan or an overdraft but something had stopped them.
• This group has declined in size over time. In 2012, 10% of SMEs were Would-be seekers of finance.
The final group, also declining over time, is those reporting a borrowing event, including the automatic renewal of an overdraft (13% of SMEs YEQ2 2017).
• SMEs with employees were more likely to report a borrowing event (18%) than those with no employees (11%)
• Over time, the proportion reporting a borrowing event has declined from 23% in 2012 to 13% in both 2016 and the first half of 2017.
Excluding the Permanent non-borrowers with little apparent appetite for finance increases the proportion with an event to 24%, and Would-be seekers to 4% but the largest group YEQ2 2017 remains the Happy non-seekers (72%).
219
www.bdrc-continental.com
All Would-be seekers of loan and overdraft finance were asked why they had not applied. Previous changes to the questionnaire limit the analysis available.
• Amongst Would-be seekers YEQ2 2017, 47% said that they had been discouraged from applying (most, 33% were indirectly discouraged, having not applied because they thought they would be turned down). This was more likely to be the case for smaller WBS
• 23% cited the process of borrowing (cost, hassle, security etc) and this was more likely to be the case for larger WBS
• Discouragement and the process of borrowing have been the main barriers for WBS over time. Since 2015, there have been slightly more mentions of discouragement and slightly fewer mentions of the process of borrowing.
4% of all SMEs reported that they had ever been declined by the bank.
• Amongst those that had, three quarters said that it had made them more reluctant to apply for finance, the equivalent of 3% of all SMEs
• Those who were made more reluctant by a decline were now much more likely to be a Would-be seeker of finance (20%) than SMEs overall (2%), although 51% were using finance (compared to 39% of SMEs overall).
220
www.bdrc-continental.com
As already detailed in this report, a minority of SMEs reported any borrowing event in the 12 months prior to interview. This chapter looks at those that had not had a borrowing event, to explore whether they had wanted to apply for loan/overdraft finance in the previous 12 months, and any barriers to such an application being made. Because this chapter covers not only those that have had a borrowing event, but also those that have not, analysis continues to be based on the date of iinntteerrvviieeww (unlike chapters 7 to 10 which are entirely based on when the borrowing event in question occurred).
All SMEs have been allocated to one of three groups, encompassing both overdrafts and loans:
HHaadd aann eevveenntt: those SMEs reporting any Type 1, 2 or 3 loan or overdraft borrowing event in the previous 12 months, or an automatic renewal of an overdraft facility.
WWoouulldd--bbee sseeeekkeerrss: those SMEs that had not had a loan or overdraft borrowing event/automatic renewal, and said something had stopped them applying for either loan or overdraft funding in the previous 12 months.
HHaappppyy nnoonn--sseeeekkeerrss: those SMEs that had not had a loan/overdraft borrowing event/automatic renewal, but said that nothing had stopped them applying for either loan or overdraft funding in the previous 12 months.
221
www.bdrc-continental.com
Changes to definitions over time – a summary Up until Q1 2016, respondents who hadn’t reported a relevant loan and/or overdraft borrowing event were asked separately about whether they had wanted to apply for a loan and/or an overdraft. This meant that a respondent might have been allocated to two different categories, for example if they reported a loan ‘event’ and had also been a Would-be seeker of an overdraft. In that instance they would have been classed as having had an event (due to the loan) and their answers in terms of being a Would-be seeker of an overdraft would not have been included at the analysis stage, as each respondent can only appear in one of the three categories above.
This meant that some answers (which took time to gather during the interview) were never reported. So, from Q1 2016 onwards, potential Would-be seekers have been identified within the survey from amongst those who had reported neither a loan nor an overdraft event. Such SMEs were then asked whether anything had stopped them applying for either a loan or overdraft facility and if they identified any barrier, they qualified as a Would-be seeker of finance. Whilst this is a slightly different approach within the survey itself, the basis on which Would-be seekers are defined and reported here has not changed because the Monitor has only ever reported on Would-be seekers who had not had an ‘event’ as well.
Since the start of the Monitor a number of other adjustments have been made to this area of the questionnaire. These are summarised below but were reported in full in the Q4 2015 report:
• From the Q2 2012 report onwards, the definition of ‘had an event’ was amended to include automatic overdraft renewals, and all respondents from Q4 2011 re-classified under the new definition.
• From Q4 2012, the question used to separate the Happy non-seekers from the Would-be seekers was changed from:
§ Would you say that you would like to have an overdraft/loan facility for the business, even though you haven't applied for one?
To
§ Has anything stopped you applying for an overdraft/loan, or was it simply that you felt that the business did not need one?
• In Q4 2012, the list of reasons available to Would-be seekers, explaining why they had not applied for a loan or overdraft facility was amended when the option ‘I prefer not to borrow’ was removed.
• From Q3 2015, a question has been asked that allows identification of Would-be seekers of other forms of finance (such as leasing). An initial assessment of the impact this would have on the overall Would-be seekers position is provided in this chapter but the main definition has not been changed in this report.
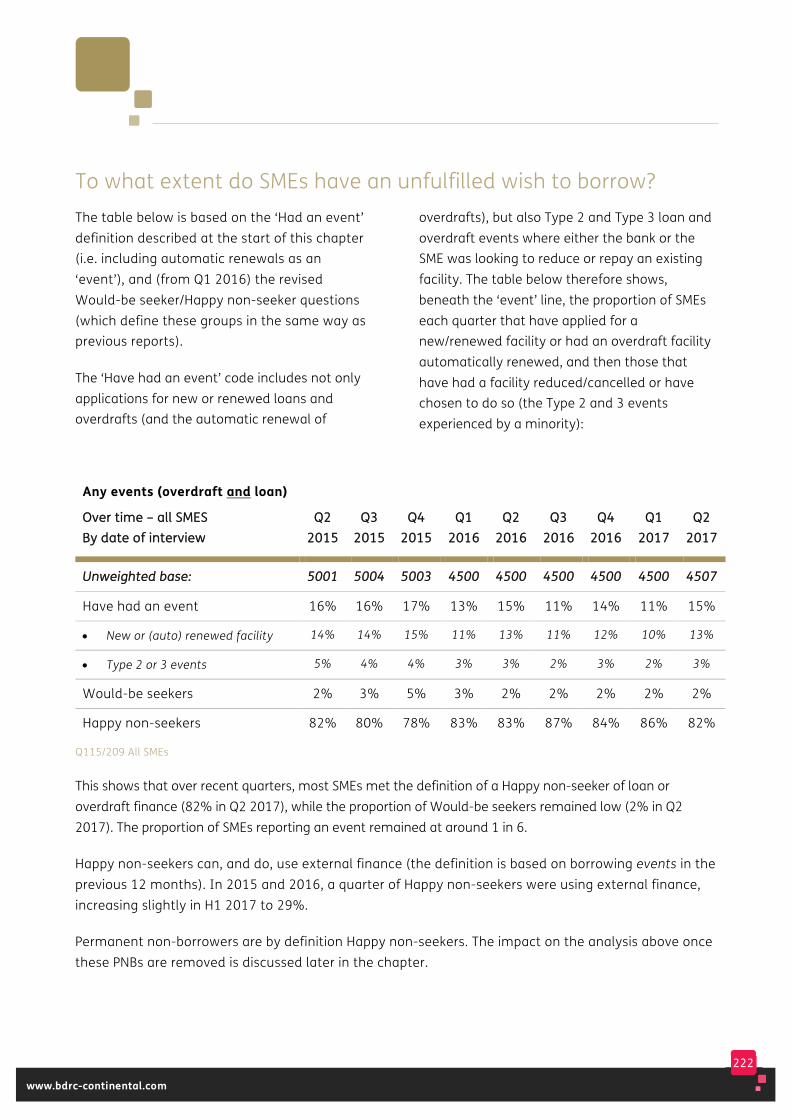
222
www.bdrc-continental.com
To what extent do SMEs have an unfulfilled wish to borrow? The table below is based on the ‘Had an event’ definition described at the start of this chapter (i.e. including automatic renewals as an ‘event’), and (from Q1 2016) the revised Would-be seeker/Happy non-seeker questions (which define these groups in the same way as previous reports).
The ‘Have had an event’ code includes not only applications for new or renewed loans and overdrafts (and the automatic renewal of
overdrafts), but also Type 2 and Type 3 loan and overdraft events where either the bank or the SME was looking to reduce or repay an existing facility. The table below therefore shows, beneath the ‘event’ line, the proportion of SMEs each quarter that have applied for a new/renewed facility or had an overdraft facility automatically renewed, and then those that have had a facility reduced/cancelled or have chosen to do so (the Type 2 and 3 events experienced by a minority):
Any events (overdraft and loan)
OOvveerr ttiimmee –– aallll SSMMEESS BByy ddaattee ooff iinntteerrvviieeww
QQ22 22001155
QQ33 22001155
QQ44 22001155
QQ11 22001166
QQ22 22001166
QQ33 22001166
QQ44 22001166
QQ11 22001177
QQ22 22001177
UUnnwweeiigghhtteedd bbaassee:: 55000011 55000044 55000033 44550000 44550000 44550000 44550000 44550000 44550077
Have had an event 16% 16% 17% 13% 15% 11% 14% 11% 15%
• New or (auto) renewed facility 14% 14% 15% 11% 13% 11% 12% 10% 13%
• Type 2 or 3 events 5% 4% 4% 3% 3% 2% 3% 2% 3%
Would-be seekers 2% 3% 5% 3% 2% 2% 2% 2% 2%
Happy non-seekers 82% 80% 78% 83% 83% 87% 84% 86% 82%
Q115/209 All SMEs
This shows that over recent quarters, most SMEs met the definition of a Happy non-seeker of loan or overdraft finance (82% in Q2 2017), while the proportion of Would-be seekers remained low (2% in Q2 2017). The proportion of SMEs reporting an event remained at around 1 in 6.
Happy non-seekers can, and do, use external finance (the definition is based on borrowing events in the previous 12 months). In 2015 and 2016, a quarter of Happy non-seekers were using external finance, increasing slightly in H1 2017 to 29%.
Permanent non-borrowers are by definition Happy non-seekers. The impact on the analysis above once these PNBs are removed is discussed later in the chapter.
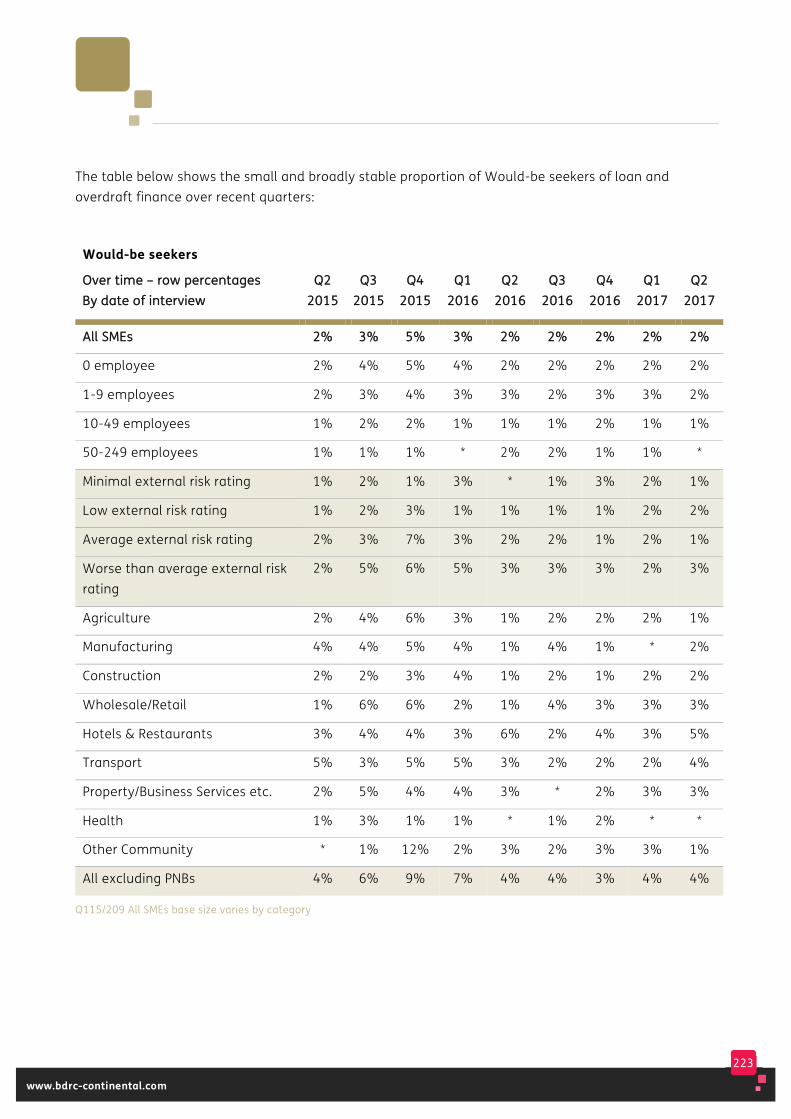
223
www.bdrc-continental.com
The table below shows the small and broadly stable proportion of Would-be seekers of loan and overdraft finance over recent quarters:
Would-be seekers
OOvveerr ttiimmee –– rrooww ppeerrcceennttaaggeess BByy ddaattee ooff iinntteerrvviieeww
QQ22 22001155
QQ33 22001155
QQ44 22001155
QQ11 22001166
QQ22 22001166
QQ33 22001166
QQ44 22001166
QQ11 22001177
QQ22 22001177
AAllll SSMMEEss 22%% 33%% 55%% 33%% 22%% 22%% 22%% 22%% 22%%
0 employee 2% 4% 5% 4% 2% 2% 2% 2% 2%
1-9 employees 2% 3% 4% 3% 3% 2% 3% 3% 2%
10-49 employees 1% 2% 2% 1% 1% 1% 2% 1% 1%
50-249 employees 1% 1% 1% * 2% 2% 1% 1% *
Minimal external risk rating 1% 2% 1% 3% * 1% 3% 2% 1%
Low external risk rating 1% 2% 3% 1% 1% 1% 1% 2% 2%
Average external risk rating 2% 3% 7% 3% 2% 2% 1% 2% 1%
Worse than average external risk rating
2% 5% 6% 5% 3% 3% 3% 2% 3%
Agriculture 2% 4% 6% 3% 1% 2% 2% 2% 1%
Manufacturing 4% 4% 5% 4% 1% 4% 1% * 2%
Construction 2% 2% 3% 4% 1% 2% 1% 2% 2%
Wholesale/Retail 1% 6% 6% 2% 1% 4% 3% 3% 3%
Hotels & Restaurants 3% 4% 4% 3% 6% 2% 4% 3% 5%
Transport 5% 3% 5% 5% 3% 2% 2% 2% 4%
Property/Business Services etc. 2% 5% 4% 4% 3% * 2% 3% 3%
Health 1% 3% 1% 1% * 1% 2% * *
Other Community * 1% 12% 2% 3% 2% 3% 3% 1%
All excluding PNBs 4% 6% 9% 7% 4% 4% 3% 4% 4%
Q115/209 All SMEs base size varies by category
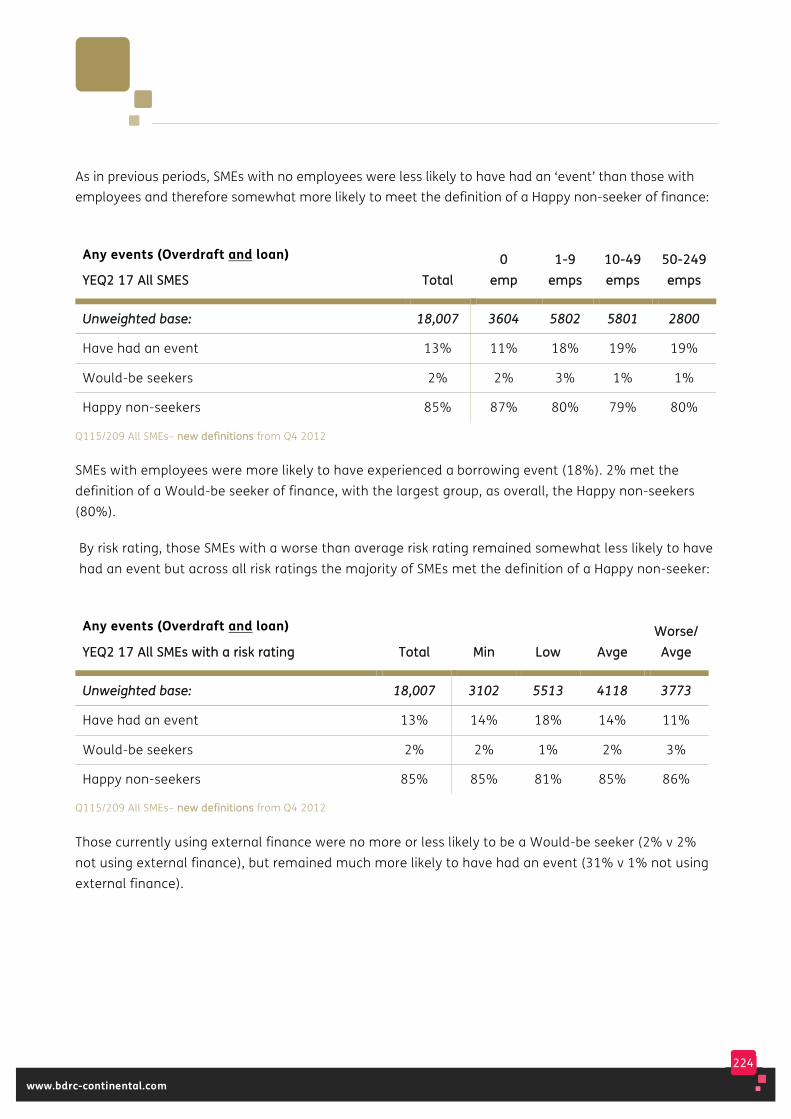
224
www.bdrc-continental.com
As in previous periods, SMEs with no employees were less likely to have had an ‘event’ than those with employees and therefore somewhat more likely to meet the definition of a Happy non-seeker of finance:
Any events (Overdraft and loan)
YYEEQQ22 1177 AAllll SSMMEESS TToottaall 00
eemmpp 11--99
eemmppss 1100--4499 eemmppss
5500--224499 eemmppss
UUnnwweeiigghhtteedd bbaassee:: 1188,,000077 33660044 55880022 55880011 22880000
Have had an event 13% 11% 18% 19% 19%
Would-be seekers 2% 2% 3% 1% 1%
Happy non-seekers 85% 87% 80% 79% 80%
Q115/209 All SMEs– nneeww ddeeffiinniittiioonnss from Q4 2012
SMEs with employees were more likely to have experienced a borrowing event (18%). 2% met the definition of a Would-be seeker of finance, with the largest group, as overall, the Happy non-seekers (80%).
By risk rating, those SMEs with a worse than average risk rating remained somewhat less likely to have had an event but across all risk ratings the majority of SMEs met the definition of a Happy non-seeker:
Any events (Overdraft and loan)
YYEEQQ22 1177 AAllll SSMMEEss wwiitthh aa rriisskk rraattiinngg TToottaall MMiinn LLooww AAvvggee WWoorrssee//
AAvvggee
UUnnwweeiigghhtteedd bbaassee:: 1188,,000077 33110022 55551133 44111188 33777733
Have had an event 13% 14% 18% 14% 11%
Would-be seekers 2% 2% 1% 2% 3%
Happy non-seekers 85% 85% 81% 85% 86%
Q115/209 All SMEs– nneeww ddeeffiinniittiioonnss from Q4 2012
Those currently using external finance were no more or less likely to be a Would-be seeker (2% v 2% not using external finance), but remained much more likely to have had an event (31% v 1% not using external finance).
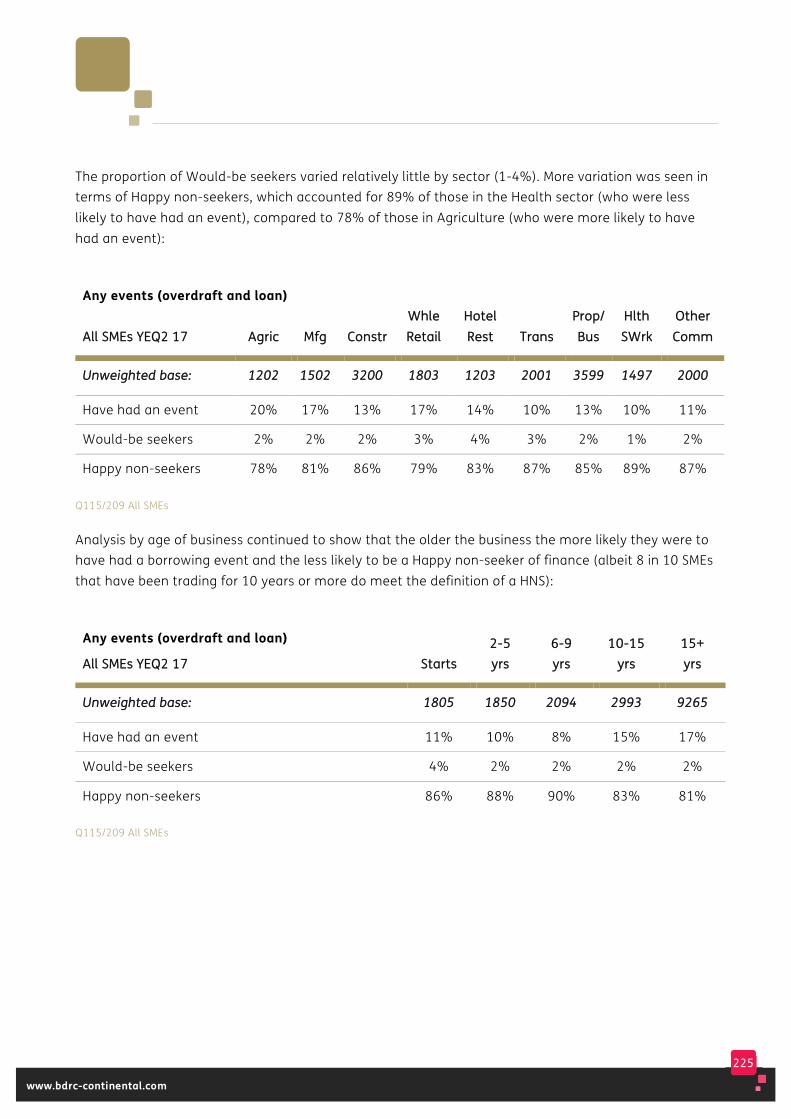
225
www.bdrc-continental.com
The proportion of Would-be seekers varied relatively little by sector (1-4%). More variation was seen in terms of Happy non-seekers, which accounted for 89% of those in the Health sector (who were less likely to have had an event), compared to 78% of those in Agriculture (who were more likely to have had an event):
Any events (overdraft and loan)
AAllll SSMMEEss YYEEQQ22 1177 AAggrriicc MMffgg CCoonnssttrr WWhhllee RReettaaiill
HHootteell RReesstt TTrraannss
PPrroopp// BBuuss
HHlltthh SSWWrrkk
OOtthheerr CCoommmm
UUnnwweeiigghhtteedd bbaassee:: 11220022 11550022 33220000 11880033 11220033 22000011 33559999 11449977 22000000
Have had an event 20% 17% 13% 17% 14% 10% 13% 10% 11%
Would-be seekers 2% 2% 2% 3% 4% 3% 2% 1% 2%
Happy non-seekers 78% 81% 86% 79% 83% 87% 85% 89% 87%
Q115/209 All SMEs
Analysis by age of business continued to show that the older the business the more likely they were to have had a borrowing event and the less likely to be a Happy non-seeker of finance (albeit 8 in 10 SMEs that have been trading for 10 years or more do meet the definition of a HNS):
Any events (overdraft and loan)
AAllll SSMMEEss YYEEQQ22 1177 SSttaarrttss 22--55 yyrrss
66--99 yyrrss
1100--1155 yyrrss
1155++ yyrrss
UUnnwweeiigghhtteedd bbaassee:: 11880055 11885500 22009944 22999933 99226655
Have had an event 11% 10% 8% 15% 17%
Would-be seekers 4% 2% 2% 2% 2%
Happy non-seekers 86% 88% 90% 83% 81%
Q115/209 All SMEs
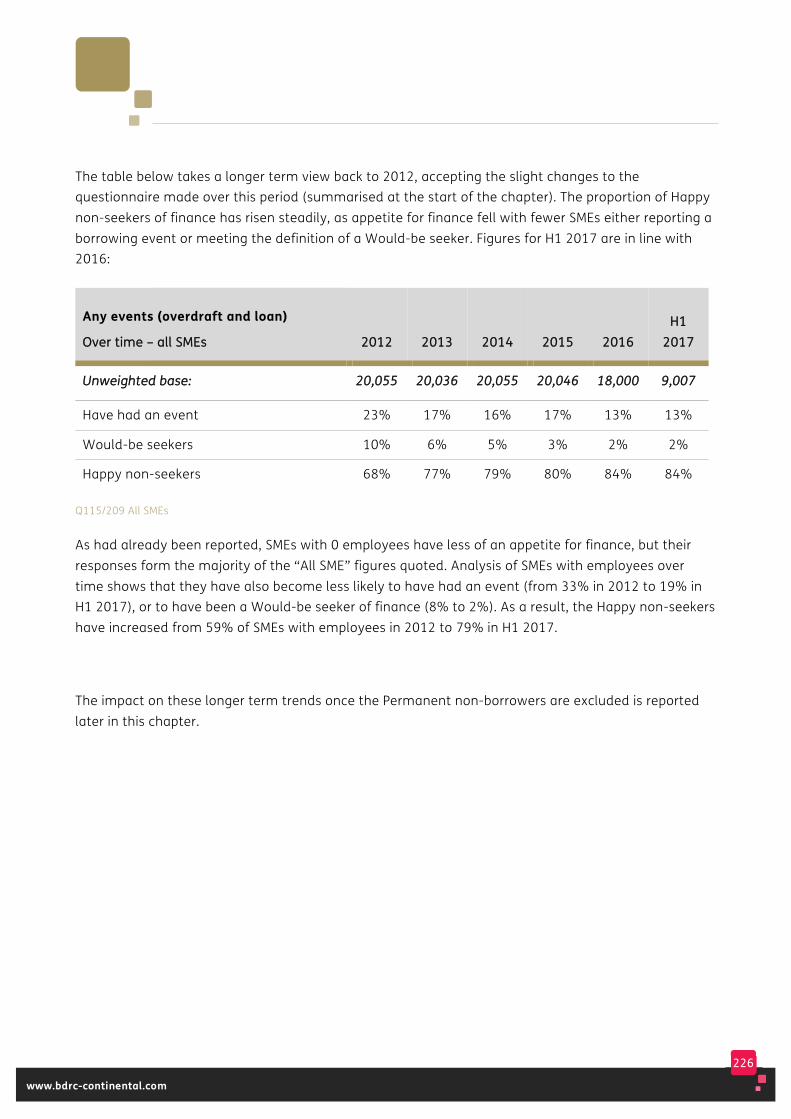
226
www.bdrc-continental.com
The table below takes a longer term view back to 2012, accepting the slight changes to the questionnaire made over this period (summarised at the start of the chapter). The proportion of Happy non-seekers of finance has risen steadily, as appetite for finance fell with fewer SMEs either reporting a borrowing event or meeting the definition of a Would-be seeker. Figures for H1 2017 are in line with 2016:
Any events (overdraft and loan)
OOvveerr ttiimmee –– aallll SSMMEEss 22001122 22001133 22001144 22001155
22001166 HH11
22001177
UUnnwweeiigghhtteedd bbaassee:: 2200,,005555 2200,,003366 2200,,005555 2200,,004466 1188,,000000 99,,000077
Have had an event 23% 17% 16% 17% 13% 13%
Would-be seekers 10% 6% 5% 3% 2% 2%
Happy non-seekers 68% 77% 79% 80% 84% 84%
Q115/209 All SMEs
As had already been reported, SMEs with 0 employees have less of an appetite for finance, but their responses form the majority of the “All SME” figures quoted. Analysis of SMEs with employees over time shows that they have also become less likely to have had an event (from 33% in 2012 to 19% in H1 2017), or to have been a Would-be seeker of finance (8% to 2%). As a result, the Happy non-seekers have increased from 59% of SMEs with employees in 2012 to 79% in H1 2017.
The impact on these longer term trends once the Permanent non-borrowers are excluded is reported later in this chapter.
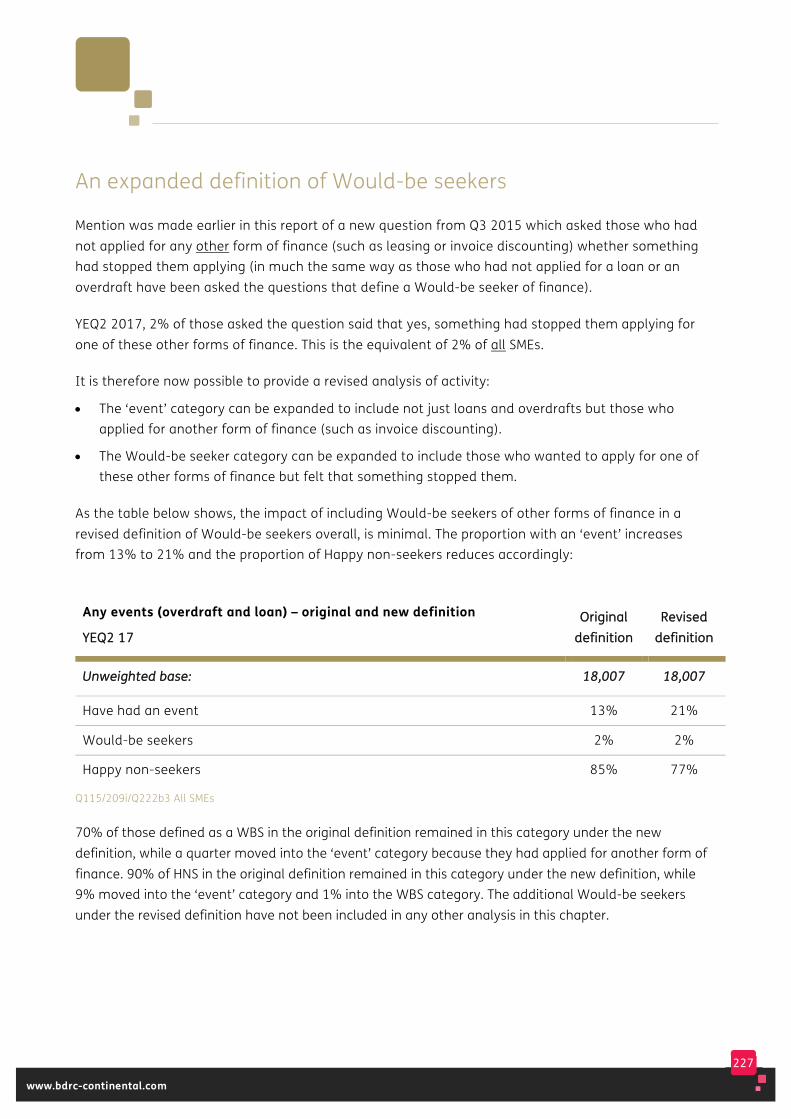
227
www.bdrc-continental.com
An expanded definition of Would-be seekers
Mention was made earlier in this report of a new question from Q3 2015 which asked those who had not applied for any other form of finance (such as leasing or invoice discounting) whether something had stopped them applying (in much the same way as those who had not applied for a loan or an overdraft have been asked the questions that define a Would-be seeker of finance).
YEQ2 2017, 2% of those asked the question said that yes, something had stopped them applying for one of these other forms of finance. This is the equivalent of 2% of all SMEs.
It is therefore now possible to provide a revised analysis of activity:
• The ‘event’ category can be expanded to include not just loans and overdrafts but those who applied for another form of finance (such as invoice discounting).
• The Would-be seeker category can be expanded to include those who wanted to apply for one of these other forms of finance but felt that something stopped them.
As the table below shows, the impact of including Would-be seekers of other forms of finance in a revised definition of Would-be seekers overall, is minimal. The proportion with an ‘event’ increases from 13% to 21% and the proportion of Happy non-seekers reduces accordingly:
Any events (overdraft and loan) – original and new definition
YYEEQQ22 1177 OOrriiggiinnaall
ddeeffiinniittiioonn RReevviisseedd
ddeeffiinniittiioonn
UUnnwweeiigghhtteedd bbaassee:: 1188,,000077 1188,,000077
Have had an event 13% 21%
Would-be seekers 2% 2%
Happy non-seekers 85% 77%
Q115/209i/Q222b3 All SMEs
70% of those defined as a WBS in the original definition remained in this category under the new definition, while a quarter moved into the ‘event’ category because they had applied for another form of finance. 90% of HNS in the original definition remained in this category under the new definition, while 9% moved into the ‘event’ category and 1% into the WBS category. The additional Would-be seekers under the revised definition have not been included in any other analysis in this chapter.
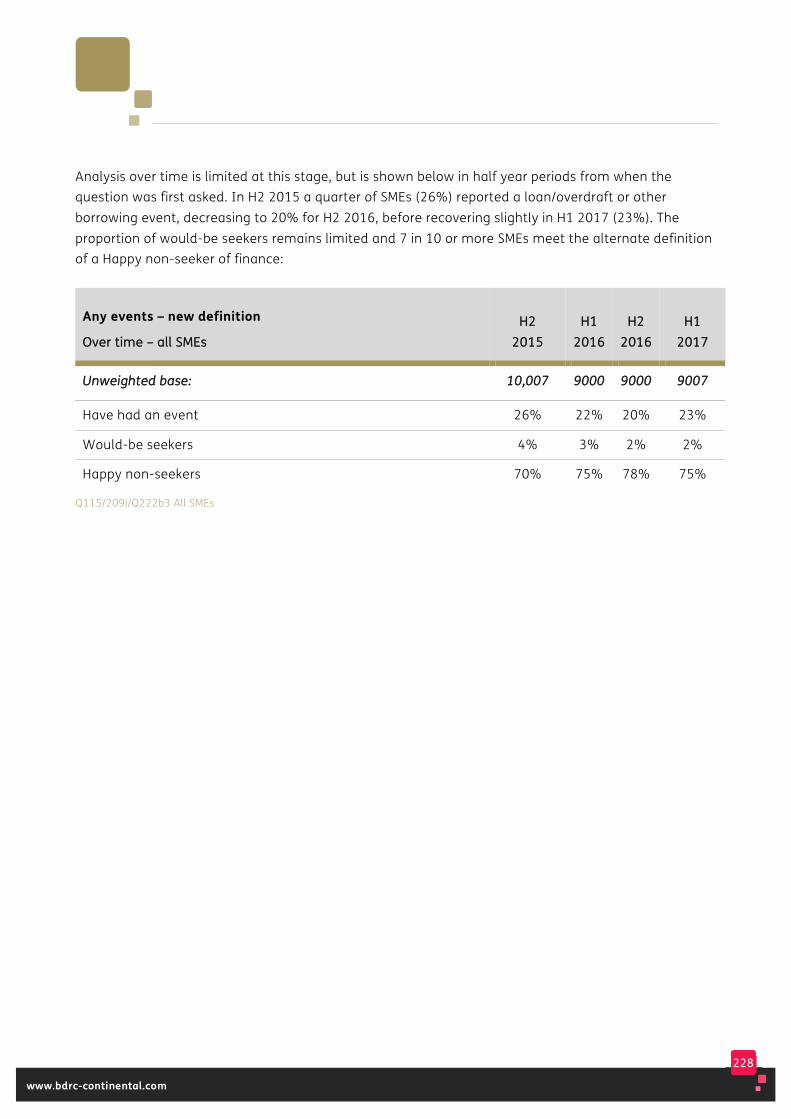
228
www.bdrc-continental.com
Analysis over time is limited at this stage, but is shown below in half year periods from when the question was first asked. In H2 2015 a quarter of SMEs (26%) reported a loan/overdraft or other borrowing event, decreasing to 20% for H2 2016, before recovering slightly in H1 2017 (23%). The proportion of would-be seekers remains limited and 7 in 10 or more SMEs meet the alternate definition of a Happy non-seeker of finance:
Any events – new definition
OOvveerr ttiimmee –– aallll SSMMEEss HH22
22001155 HH11
22001166 HH22
22001166 HH11
22001177
UUnnwweeiigghhtteedd bbaassee:: 1100,,000077 99000000 99000000 99000077
Have had an event 26% 22% 20% 23%
Would-be seekers 4% 3% 2% 2%
Happy non-seekers 70% 75% 78% 75%
Q115/209i/Q222b3 All SMEs
229
www.bdrc-continental.com
Barriers to overdraft or loan application
SMEs that were identified as Would-be seekers (i.e. they had wanted to apply for an overdraft/loan in the 12 months prior to their interview, but felt that something had stopped them) were asked about the barriers to making such an application.
These are reported below, firstly in terms of how frequently they were mentioned at all and secondly how frequently they were nominated as the main barrier.
The reasons have been grouped into the themes shown below, and respondents could initially nominate as many reasons as they wished for not having applied when they wanted to.
As described at the start of this chapter, this is now only asked once, across both loans and overdrafts, instead of separately for each form of finance. This limits the trend data available over the longer term, but some analysis has been provided of the answers given by loan and overdraft Would-be seekers on a combined basis for 2015.
The key reasons given YEQ2 2017 were:
PPrroocceessss ooff bboorrrroowwiinngg – those who did not want to apply because they thought it would be too expensive, too much hassle etc. This was given as a reason by 36% of all Would-be seekers YEQ2 2017 (the equivalent of 1% of all SMEs), down slightly from 48% in 2015
DDiissccoouurraaggeemmeenntt – those that had been put off, either directly (they made informal enquiries of the bank and were put off) or indirectly (they thought they would be turned down by the bank so did not ask). This was given as a reason by 48% of all Would-be seekers YEQ2 2017 (the equivalent of 1% of all SMEs), up slightly from 42% in 2015
PPrriinncciippllee ooff bboorrrroowwiinngg – those that did not apply because they feared they might lose control of their business, or preferred to seek alternative sources of funding. This was given as a reason by 24% of all Would-be seekers YEQ2 2017 (the equivalent of <1% of all SMEs), almost unchanged from 2015 (29%)
CCuurrrreenntt eeccoonnoommiicc cclliimmaattee – those that felt that it had not been the right time to borrow. This was given as a reason by 10% of all Would-be seekers YEQ2 2017 (the equivalent of <1% of all SMEs) and unchanged from 2015 (11%).

230
www.bdrc-continental.com
The table below shows the results for YEQ2 2017, and all the reasons for not applying for a loan or overdraft that are included in the summary categories above.
All reasons for not applying for loan or overdraft when wanted to
AAllll WWoouulldd--bbee sseeeekkeerrss YYEEQQ22 1177 eexxcclluuddiinngg DDKK TToottaall 00--99
eemmppss 1100--224499 eemmppss
UUnnwweeiigghhtteedd bbaassee:: 228888 220077 8811**
Issues with process of borrowing 36% 35% 43%
-Would be too much hassle 10% 10% 16%
-Thought would be too expensive 17% 17% 9%
-Would be asked for too much security 3% 3% 14%
-Too many terms and conditions 6% 6% 11%
-Did not want to go through process 7% 7% 11%
-Forms too hard to understand 5% 5% 3%
Discouraged (any) 48% 49% 27%
-Direct (put off by bank) 18% 18% 11%
-Indirect (thought would be turned down) 38% 39% 17%
Issues with principle of borrowing 24% 24% 22%
-Not lose control of business 10% 10% 7%
-Can raise personal funds if needed 9% 9% 8%
-Prefer other forms of finance 5% 4% 8%
-Go to family and friends 6% 6% 5%
Economic climate 10% 10% 13%
-Not the right time to apply 10% 10% 13%
Q210 All Would-be seekers SMEs that wished they had applied for an overdraft or a loan
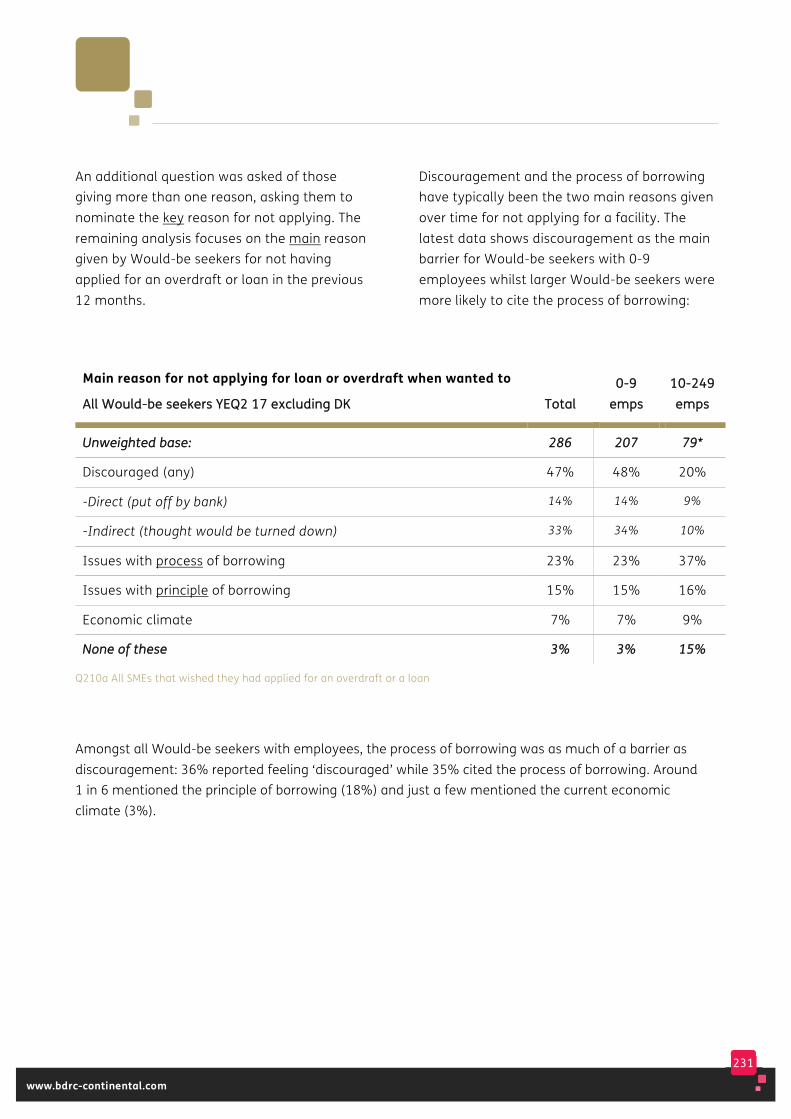
231
www.bdrc-continental.com
An additional question was asked of those giving more than one reason, asking them to nominate the key reason for not applying. The remaining analysis focuses on the main reason given by Would-be seekers for not having applied for an overdraft or loan in the previous 12 months.
Discouragement and the process of borrowing have typically been the two main reasons given over time for not applying for a facility. The latest data shows discouragement as the main barrier for Would-be seekers with 0-9 employees whilst larger Would-be seekers were more likely to cite the process of borrowing:
Main reason for not applying for loan or overdraft when wanted to
AAllll WWoouulldd--bbee sseeeekkeerrss YYEEQQ22 1177 eexxcclluuddiinngg DDKK TToottaall 00--99
eemmppss 1100--224499 eemmppss
UUnnwweeiigghhtteedd bbaassee:: 228866 220077 7799**
Discouraged (any) 47% 48% 20%
-Direct (put off by bank) 14% 14% 9%
-Indirect (thought would be turned down) 33% 34% 10%
Issues with process of borrowing 23% 23% 37%
Issues with principle of borrowing 15% 15% 16%
Economic climate 7% 7% 9%
NNoonnee ooff tthheessee 33%% 33%% 1155%%
Q210a All SMEs that wished they had applied for an overdraft or a loan
Amongst all Would-be seekers with employees, the process of borrowing was as much of a barrier as discouragement: 36% reported feeling ‘discouraged’ while 35% cited the process of borrowing. Around 1 in 6 mentioned the principle of borrowing (18%) and just a few mentioned the current economic climate (3%).
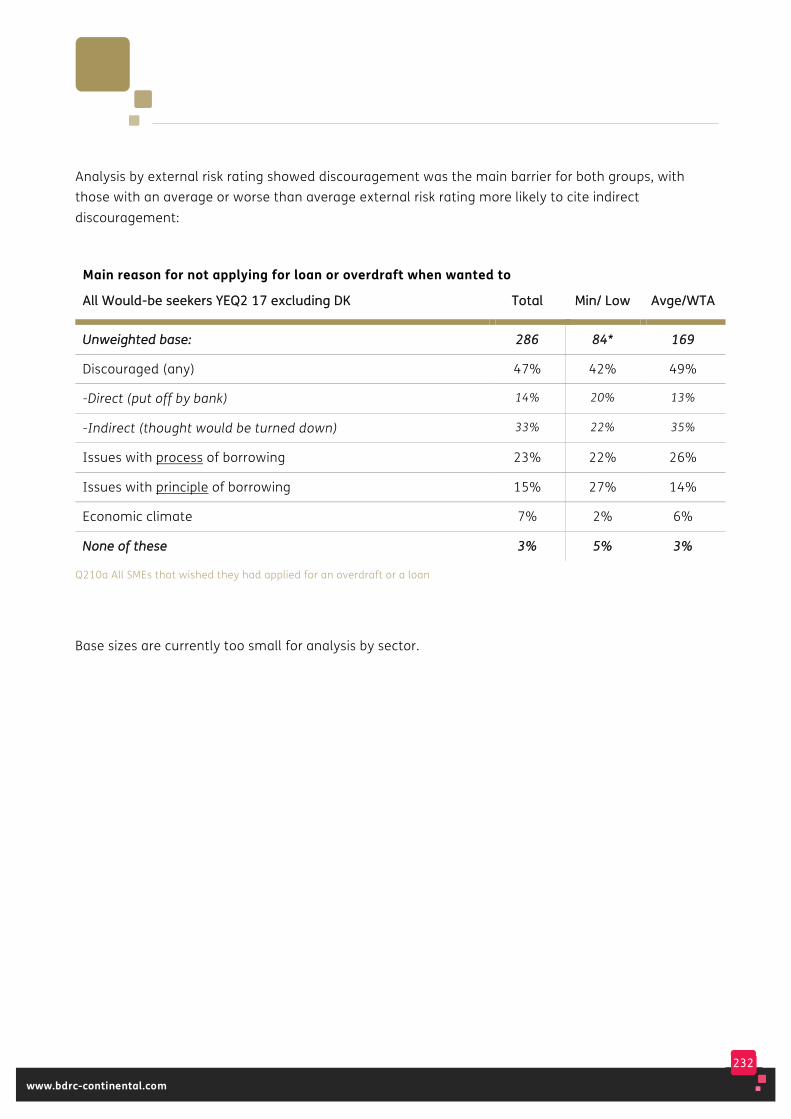
232
www.bdrc-continental.com
Analysis by external risk rating showed discouragement was the main barrier for both groups, with those with an average or worse than average external risk rating more likely to cite indirect discouragement:
Main reason for not applying for loan or overdraft when wanted to
AAllll WWoouulldd--bbee sseeeekkeerrss YYEEQQ22 1177 eexxcclluuddiinngg DDKK TToottaall MMiinn// LLooww AAvvggee//WWTTAA
UUnnwweeiigghhtteedd bbaassee:: 228866 8844** 116699
Discouraged (any) 47% 42% 49%
-Direct (put off by bank) 14% 20% 13%
-Indirect (thought would be turned down) 33% 22% 35%
Issues with process of borrowing 23% 22% 26%
Issues with principle of borrowing 15% 27% 14%
Economic climate 7% 2% 6%
NNoonnee ooff tthheessee 33%% 55%% 33%%
Q210a All SMEs that wished they had applied for an overdraft or a loan
Base sizes are currently too small for analysis by sector.

233
www.bdrc-continental.com
Previous analysis over time has tracked the reasons for not applying for an overdraft separately to those for not applying for a loan. This makes comparisons over time with the new question introduced in Q1 2016 more difficult.
The table below shows, on an annual basis from 2015, any mentions of each of the four key
themes by Would-be seekers, whether they had been put off applying for a loan or an overdraft and compares the 2015 results from the previous question to the results in 2016 and H1 2017 of the new, combined, question. This shows that discouragement remained the key barrier:
All reasons for not applying for loan or overdraft
Over time – all Would-be seekers 22001155 22001166** HH11
22001177
UUnnwweeiigghhtteedd bbaassee:: 448855 331188 113399
Discouraged (any) 42% 45% 51%
Issues with process of borrowing 48% 32% 26%
Issues with principle of borrowing 29% 26% 11%
Economic climate 11% 13% 6%
Q210a All SMEs that wished they had applied for an overdraft or a loan – question changed in 2016 and now excludes DK
In all instances, the two key reasons for not applying have been discouragement (almost all of it indirect) which has increased slightly over time, and the process of borrowing, which has decreased as a reason.
The new combined question will be tracked over time in future reports.
There is currently little evidence of Would-be seekers giving different reasons for not applying in the second half of 2016 (post-Brexit) compared to the first half of the year, or citing different reasons in 2017.
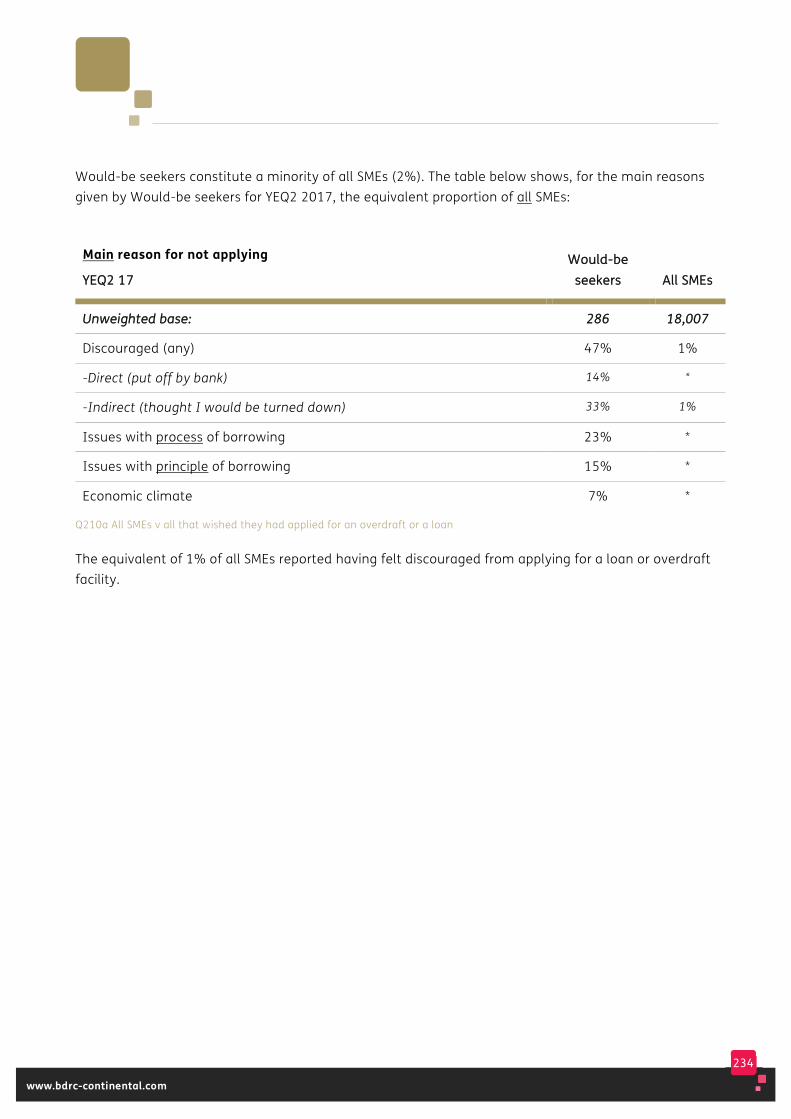
234
www.bdrc-continental.com
Would-be seekers constitute a minority of all SMEs (2%). The table below shows, for the main reasons given by Would-be seekers for YEQ2 2017, the equivalent proportion of all SMEs:
Main reason for not applying
YYEEQQ22 1177 WWoouulldd--bbee
sseeeekkeerrss AAllll SSMMEEss
UUnnwweeiigghhtteedd bbaassee:: 228866 1188,,000077
Discouraged (any) 47% 1%
-Direct (put off by bank) 14% *
-Indirect (thought I would be turned down) 33% 1%
Issues with process of borrowing 23% *
Issues with principle of borrowing 15% *
Economic climate 7% *
Q210a All SMEs v all that wished they had applied for an overdraft or a loan
The equivalent of 1% of all SMEs reported having felt discouraged from applying for a loan or overdraft facility.
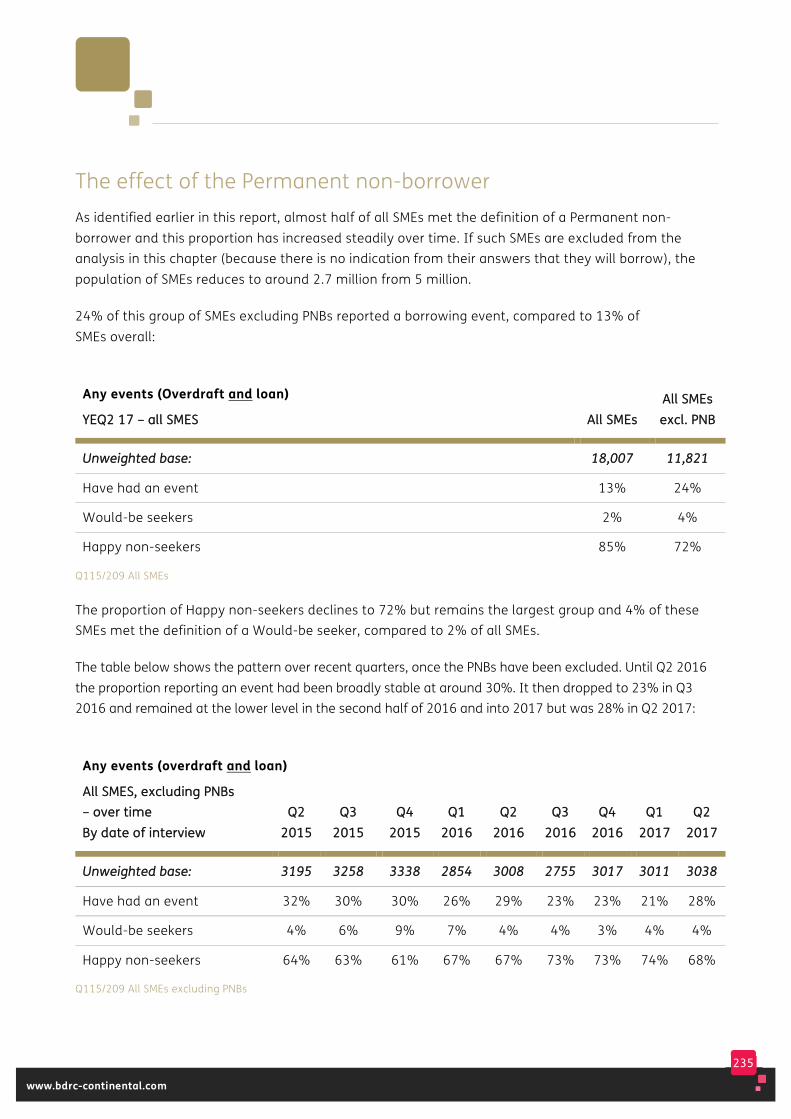
235
www.bdrc-continental.com
The effect of the Permanent non-borrower As identified earlier in this report, almost half of all SMEs met the definition of a Permanent non-borrower and this proportion has increased steadily over time. If such SMEs are excluded from the analysis in this chapter (because there is no indication from their answers that they will borrow), the population of SMEs reduces to around 2.7 million from 5 million.
24% of this group of SMEs excluding PNBs reported a borrowing event, compared to 13% of SMEs overall:
Any events (Overdraft and loan)
YYEEQQ22 1177 –– aallll SSMMEESS AAllll SSMMEEss AAllll SSMMEEss eexxccll.. PPNNBB
UUnnwweeiigghhtteedd bbaassee:: 1188,,000077 1111,,882211
Have had an event 13% 24%
Would-be seekers 2% 4%
Happy non-seekers 85% 72%
Q115/209 All SMEs
The proportion of Happy non-seekers declines to 72% but remains the largest group and 4% of these SMEs met the definition of a Would-be seeker, compared to 2% of all SMEs.
The table below shows the pattern over recent quarters, once the PNBs have been excluded. Until Q2 2016 the proportion reporting an event had been broadly stable at around 30%. It then dropped to 23% in Q3 2016 and remained at the lower level in the second half of 2016 and into 2017 but was 28% in Q2 2017:
Any events (overdraft and loan)
AAllll SSMMEESS,, eexxcclluuddiinngg PPNNBBss –– oovveerr ttiimmee BByy ddaattee ooff iinntteerrvviieeww
QQ22 22001155
QQ33 22001155
QQ44 22001155
QQ11 22001166
QQ22 22001166
QQ33 22001166
QQ44 22001166
QQ11 22001177
QQ22 22001177
UUnnwweeiigghhtteedd bbaassee:: 33119955 33225588 33333388 22885544 33000088 22775555 33001177 33001111 33003388
Have had an event 32% 30% 30% 26% 29% 23% 23% 21% 28%
Would-be seekers 4% 6% 9% 7% 4% 4% 3% 4% 4%
Happy non-seekers 64% 63% 61% 67% 67% 73% 73% 74% 68%
Q115/209 All SMEs excluding PNBs
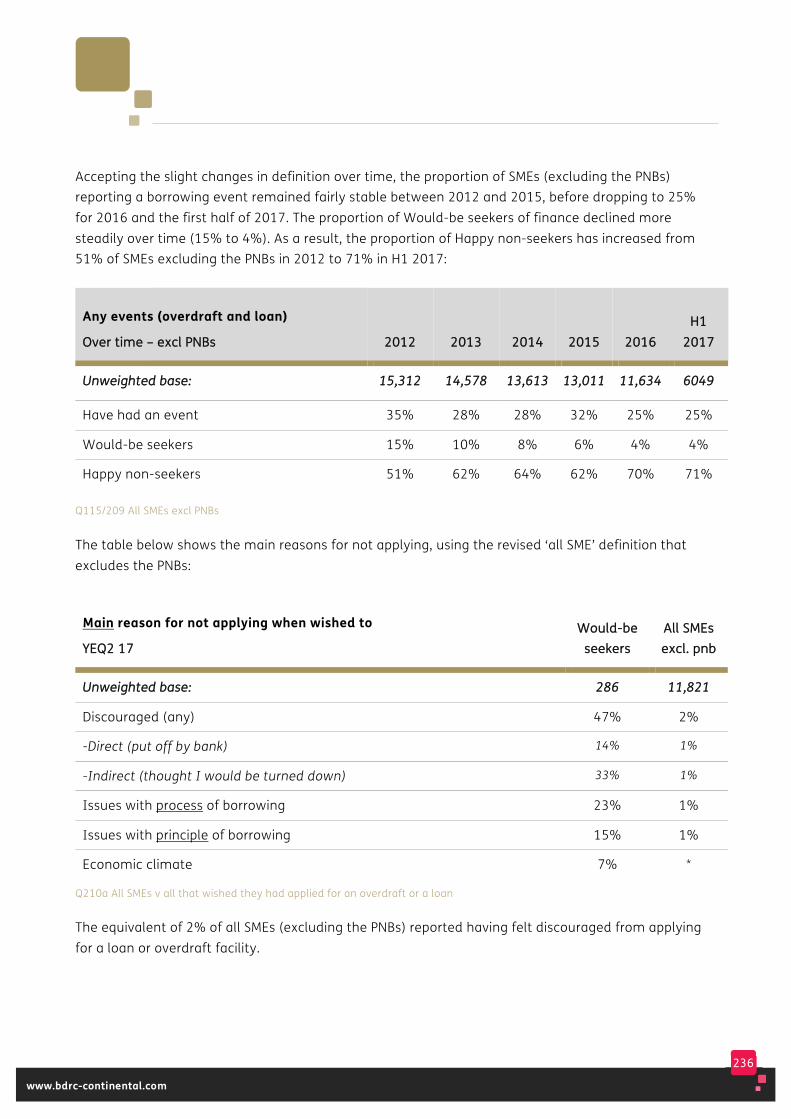
236
www.bdrc-continental.com
Accepting the slight changes in definition over time, the proportion of SMEs (excluding the PNBs) reporting a borrowing event remained fairly stable between 2012 and 2015, before dropping to 25% for 2016 and the first half of 2017. The proportion of Would-be seekers of finance declined more steadily over time (15% to 4%). As a result, the proportion of Happy non-seekers has increased from 51% of SMEs excluding the PNBs in 2012 to 71% in H1 2017:
Any events (overdraft and loan)
OOvveerr ttiimmee –– eexxccll PPNNBBss 22001122 22001133 22001144 22001155 22001166 HH11
22001177
UUnnwweeiigghhtteedd bbaassee:: 1155,,331122 1144,,557788 1133,,661133 1133,,001111 1111,,663344 66004499
Have had an event 35% 28% 28% 32% 25% 25%
Would-be seekers 15% 10% 8% 6% 4% 4%
Happy non-seekers 51% 62% 64% 62% 70% 71%
Q115/209 All SMEs excl PNBs
The table below shows the main reasons for not applying, using the revised ‘all SME’ definition that excludes the PNBs:
Main reason for not applying when wished to
YYEEQQ22 1177 WWoouulldd--bbee
sseeeekkeerrss AAllll SSMMEEss eexxccll.. ppnnbb
UUnnwweeiigghhtteedd bbaassee:: 228866 1111,,882211
Discouraged (any) 47% 2%
-Direct (put off by bank) 14% 1%
-Indirect (thought I would be turned down) 33% 1%
Issues with process of borrowing 23% 1%
Issues with principle of borrowing 15% 1%
Economic climate 7% *
Q210a All SMEs v all that wished they had applied for an overdraft or a loan
The equivalent of 2% of all SMEs (excluding the PNBs) reported having felt discouraged from applying for a loan or overdraft facility.
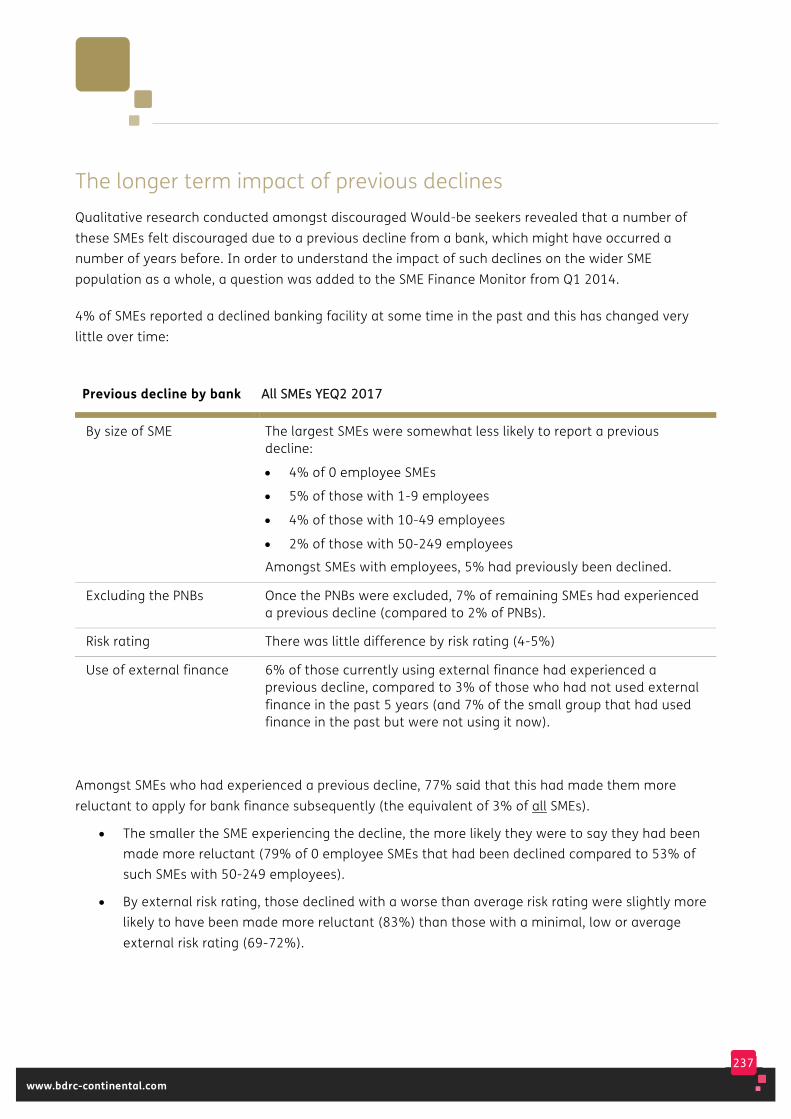
237
www.bdrc-continental.com
The longer term impact of previous declines Qualitative research conducted amongst discouraged Would-be seekers revealed that a number of these SMEs felt discouraged due to a previous decline from a bank, which might have occurred a number of years before. In order to understand the impact of such declines on the wider SME population as a whole, a question was added to the SME Finance Monitor from Q1 2014.
4% of SMEs reported a declined banking facility at some time in the past and this has changed very little over time:
Previous decline by bank AAllll SSMMEEss YYEEQQ22 22001177
By size of SME The largest SMEs were somewhat less likely to report a previous decline:
• 4% of 0 employee SMEs
• 5% of those with 1-9 employees
• 4% of those with 10-49 employees
• 2% of those with 50-249 employees
Amongst SMEs with employees, 5% had previously been declined.
Excluding the PNBs Once the PNBs were excluded, 7% of remaining SMEs had experienced a previous decline (compared to 2% of PNBs).
Risk rating There was little difference by risk rating (4-5%)
Use of external finance 6% of those currently using external finance had experienced a previous decline, compared to 3% of those who had not used external finance in the past 5 years (and 7% of the small group that had used finance in the past but were not using it now).
Amongst SMEs who had experienced a previous decline, 77% said that this had made them more reluctant to apply for bank finance subsequently (the equivalent of 3% of all SMEs).
• The smaller the SME experiencing the decline, the more likely they were to say they had been made more reluctant (79% of 0 employee SMEs that had been declined compared to 53% of such SMEs with 50-249 employees).
• By external risk rating, those declined with a worse than average risk rating were slightly more likely to have been made more reluctant (83%) than those with a minimal, low or average external risk rating (69-72%).
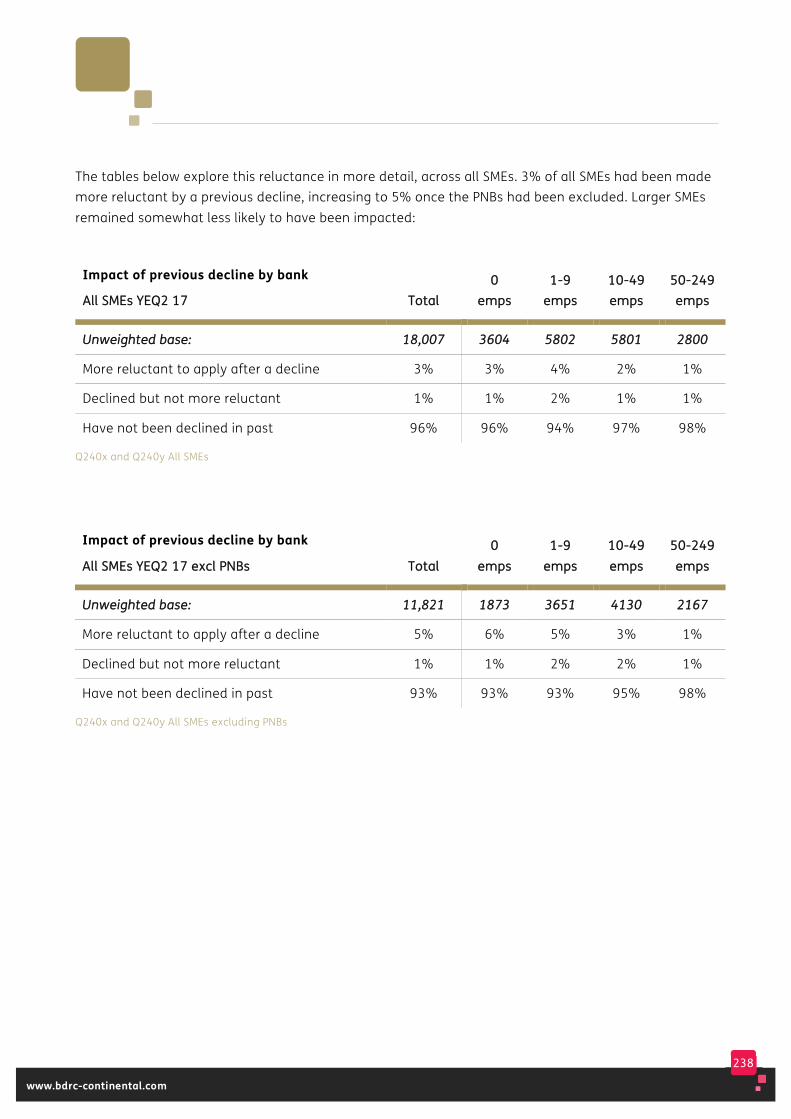
238
www.bdrc-continental.com
The tables below explore this reluctance in more detail, across all SMEs. 3% of all SMEs had been made more reluctant by a previous decline, increasing to 5% once the PNBs had been excluded. Larger SMEs remained somewhat less likely to have been impacted:
Impact of previous decline by bank
AAllll SSMMEEss YYEEQQ22 1177 TToottaall 00
eemmppss 11--99
eemmppss 1100--4499 eemmppss
5500--224499 eemmppss
UUnnwweeiigghhtteedd bbaassee:: 1188,,000077 33660044 55880022 55880011 22880000
More reluctant to apply after a decline 3% 3% 4% 2% 1%
Declined but not more reluctant 1% 1% 2% 1% 1%
Have not been declined in past 96% 96% 94% 97% 98%
Q240x and Q240y All SMEs
Impact of previous decline by bank
AAllll SSMMEEss YYEEQQ22 1177 eexxccll PPNNBBss TToottaall 00
eemmppss 11--99
eemmppss 1100--4499 eemmppss
5500--224499 eemmppss
UUnnwweeiigghhtteedd bbaassee:: 1111,,882211 11887733 33665511 44113300 22116677
More reluctant to apply after a decline 5% 6% 5% 3% 1%
Declined but not more reluctant 1% 1% 2% 2% 1%
Have not been declined in past 93% 93% 93% 95% 98%
Q240x and Q240y All SMEs excluding PNBs
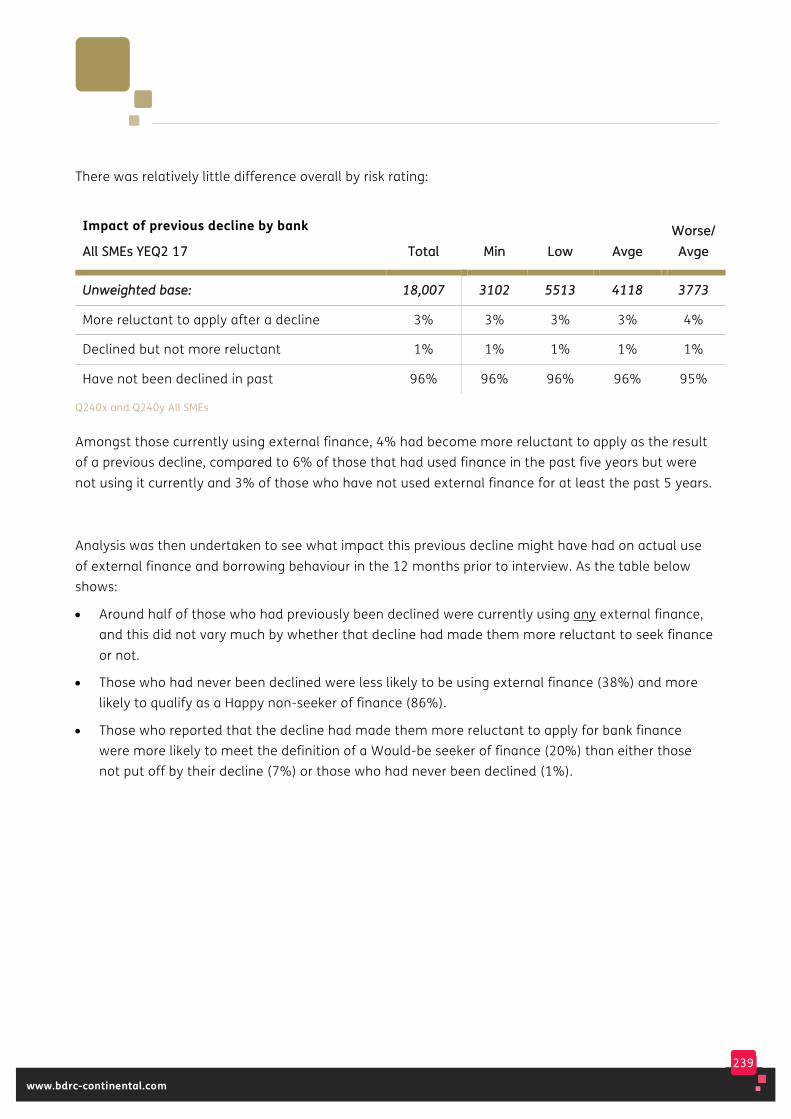
239
www.bdrc-continental.com
There was relatively little difference overall by risk rating:
Impact of previous decline by bank
AAllll SSMMEEss YYEEQQ22 1177 TToottaall MMiinn LLooww AAvvggee WWoorrssee//
AAvvggee
UUnnwweeiigghhtteedd bbaassee:: 1188,,000077 33110022 55551133 44111188 33777733
More reluctant to apply after a decline 3% 3% 3% 3% 4%
Declined but not more reluctant 1% 1% 1% 1% 1%
Have not been declined in past 96% 96% 96% 96% 95%
Q240x and Q240y All SMEs
Amongst those currently using external finance, 4% had become more reluctant to apply as the result of a previous decline, compared to 6% of those that had used finance in the past five years but were not using it currently and 3% of those who have not used external finance for at least the past 5 years.
Analysis was then undertaken to see what impact this previous decline might have had on actual use of external finance and borrowing behaviour in the 12 months prior to interview. As the table below shows:
• Around half of those who had previously been declined were currently using any external finance, and this did not vary much by whether that decline had made them more reluctant to seek finance or not.
• Those who had never been declined were less likely to be using external finance (38%) and more likely to qualify as a Happy non-seeker of finance (86%).
• Those who reported that the decline had made them more reluctant to apply for bank finance were more likely to meet the definition of a Would-be seeker of finance (20%) than either those not put off by their decline (7%) or those who had never been declined (1%).
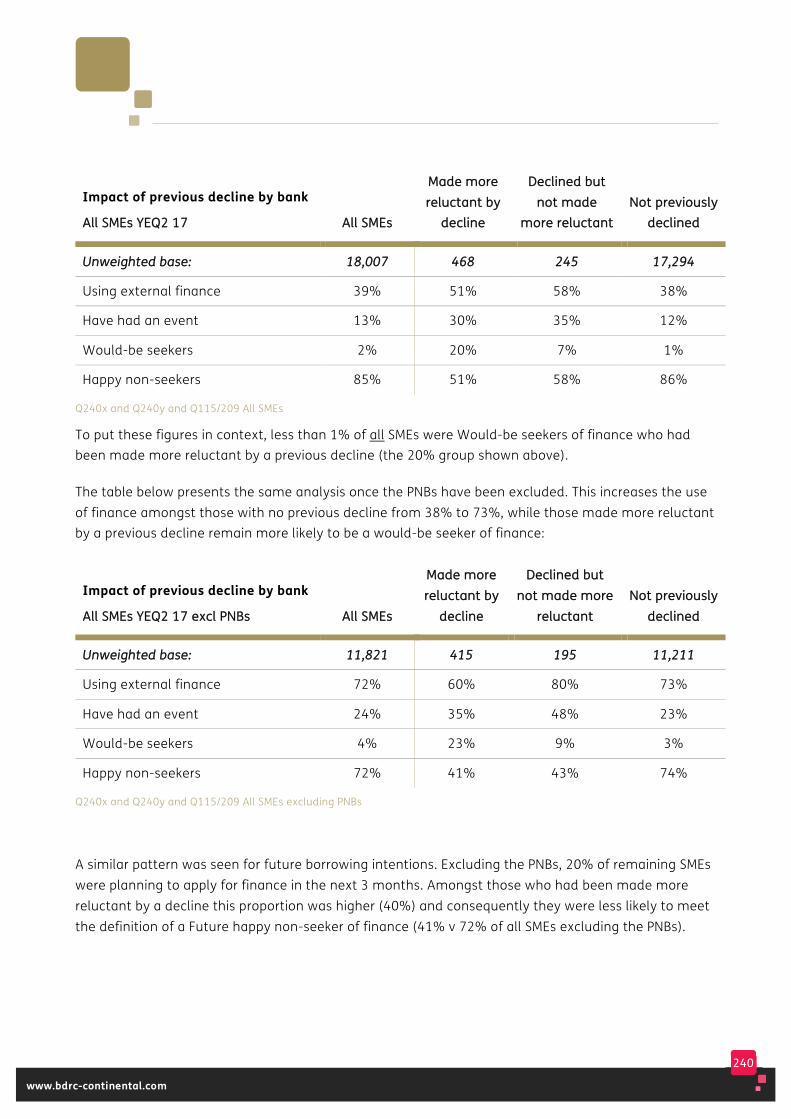
240
www.bdrc-continental.com
Impact of previous decline by bank
AAllll SSMMEEss YYEEQQ22 1177 AAllll SSMMEEss
MMaaddee mmoorree rreelluuccttaanntt bbyy
ddeecclliinnee
DDeecclliinneedd bbuutt nnoott mmaaddee
mmoorree rreelluuccttaanntt NNoott pprreevviioouussllyy
ddeecclliinneedd
UUnnwweeiigghhtteedd bbaassee:: 1188,,000077 446688 224455 1177,,229944
Using external finance 39% 51% 58% 38%
Have had an event 13% 30% 35% 12%
Would-be seekers 2% 20% 7% 1%
Happy non-seekers 85% 51% 58% 86%
Q240x and Q240y and Q115/209 All SMEs
To put these figures in context, less than 1% of all SMEs were Would-be seekers of finance who had been made more reluctant by a previous decline (the 20% group shown above).
The table below presents the same analysis once the PNBs have been excluded. This increases the use of finance amongst those with no previous decline from 38% to 73%, while those made more reluctant by a previous decline remain more likely to be a would-be seeker of finance:
Impact of previous decline by bank
AAllll SSMMEEss YYEEQQ22 1177 eexxccll PPNNBBss AAllll SSMMEEss
MMaaddee mmoorree rreelluuccttaanntt bbyy
ddeecclliinnee
DDeecclliinneedd bbuutt nnoott mmaaddee mmoorree
rreelluuccttaanntt NNoott pprreevviioouussllyy
ddeecclliinneedd
UUnnwweeiigghhtteedd bbaassee:: 1111,,882211 441155 119955 1111,,221111
Using external finance 72% 60% 80% 73%
Have had an event 24% 35% 48% 23%
Would-be seekers 4% 23% 9% 3%
Happy non-seekers 72% 41% 43% 74%
Q240x and Q240y and Q115/209 All SMEs excluding PNBs
A similar pattern was seen for future borrowing intentions. Excluding the PNBs, 20% of remaining SMEs were planning to apply for finance in the next 3 months. Amongst those who had been made more reluctant by a decline this proportion was higher (40%) and consequently they were less likely to meet the definition of a Future happy non-seeker of finance (41% v 72% of all SMEs excluding the PNBs).
241
www.bdrc-continental.com
13. The future
This chapter reports on growth plans and perceived barriers to that growth. It then explores SMEs’ intentions for the next 3 months, in terms of finance and the reasons why SMEs think that they will/will not be applying for new/renewed finance in that time period.

242
www.bdrc-continental.com
Key findings In Q2 2017, 45% of SMEs were planning to grow in the coming year ranging from 41% of those with 0 employees to 72% of those with 50-249 employees.
• This was broadly in line with recent quarters but the longer term trend is for a slight decline in the proportion planning to grow, from 49% in 2013 to 44% in the first half of 2017
• This is due to declining growth plans amongst 0 employee SMEs (46% to 40%). Amongst those with employees growth ambitions increased in the first half of 2017 and were in line with 2013
• Almost all of those planning to grow expected to do so by selling more in the UK (97%). 13% planned to sell more abroad, almost all of them already export (65% of exporters that were planning to grow were planning to sell more overseas).
There are now three key barriers to business, scoring 8-10:
• ‘Legislation, regulation and red tape’ mentioned by 14% of SMEs in Q2 2017
• ‘The current economic climate’ and ‘Political uncertainty and future government policy’, both mentioned by 13% of SMEs in Q2 2017
• A quarter of SMEs in Q2 2017 (27%) mentioned one or more of these three factors as barriers, increasing slightly by size of SME (26% of 0 employee SMEs to 34% of those with 50-249 employees)
• A new barrier, ‘Changes in the value of sterling’ was mentioned by 10% of all SMEs, 23% of those with 50-249 employees and by 26% of those who both import and export.
243
www.bdrc-continental.com
Legislation has been cited fairly consistently by SMEs over time (between 10% and 14% since 2012). Concerns about the economy declined from a peak of 34% in 2012 to 13% in 2015 and but have remained stable since. Political uncertainty was asked for the first time in 2015 (10%) and concern has increased slightly since.
Over the course of 2016 and the first half of 2017:
• Larger SMEs have become somewhat more concerned about the economic climate. International SMEs have always been more concerned about the economy than domestic SMEs, with levels of concern peaking in Q4 2016 (where around 3 in 10 cited this is a major barrier) but abating somewhat subsequently
• SMEs with employees have become more concerned about political uncertainty. So too have international SMEs, but concern in Q2 2017 was somewhat lower than was seen in other recent quarters
In Q2 2017, 12% of SMEs planned to apply for finance in the coming 3 months, with relatively little difference by size, with the exception of those with 50-249 employees where 23% planned to apply. 10% of SMEs were Future would-be seekers of finance and the largest group, 79%, were the Future happy non-seekers
• Future appetite for finance has declined somewhat over time (from 14% in 2012 to 11% in the first half of 2017)
• The proportion of Future would-be seekers has also declined (from 23% in 2012 to 10% in the first half of 2017). A reluctance to borrow in the current climate remained the key barrier for Future would-be seekers (39% in Q2 2017), especially for those with 10-249 employees.
• Discouragement (most of it indirect) was a barrier for 25% of FWBS while 19% cited the process of borrowing
• The largest group of SMEs, the Future happy non-seekers, has increased in size over time (from 63% in 2012 to 79% in the first half of 2017).
244
www.bdrc-continental.com
Amongst those planning to apply for finance, confidence of success was stable (55% in Q2 2017) and remains higher than in 2012-14 (but lower than current success rates)
• Confidence amongst those with no plans to apply to a bank about a hypothetical application, remained somewhat higher (62%), due to higher confidence amongst larger SMEs and those expecting to be Future happy non-seekers.
• Overall confidence amongst all SMEs (whatever their plans) was 63% for the first half of 2017, in line with the first half, but somewhat lower than the second half, of 2016 (67%), due to changes in confidence amongst smaller SMEs.
Demand for finance remains a key issue and 4 in 10 SMEs (41%) said they would approach their bank for finance if offered a business opportunity that required funding. Almost as many, 38% of all SMEs, said that they would look to self-fund the opportunity. 1 in 5 (18%) were concerned about the risks of taking on debt
• Larger SMEs were more likely to approach the bank (38% for 0 employee SMEs, increasing to 61% of those with 50-249 employees), as were younger SMEs. Those already using external finance were also more likely to approach their bank (51%) than those not using finance (35%)
• Self-funding did not vary much by size of business (32-39%) or by age of business and was more common for those not using finance and/or expecting to be a Future happy non-seeker
• Concerns about the risks of taking on debt were more common amongst smaller SMEs (19% of those with 0 employees compared to 11% of those with 10-49 or 50-249 employees).
245
www.bdrc-continental.com
Having reviewed performance over the 12 months prior to interview, SMEs were then asked about the ffuuttuurree. As this is looking forward, the results from each quarter can more easily be compared to each other, providing a guide to SME sentiment.
This chapter reports on growth objectives and perceived barriers to future business performance. It then explores SMEs’ intentions for the next 3 months in terms of finance and the reasons why SMEs think that they will/will
not be applying for new/renewed finance in that time period.
Most of this chapter therefore is based on Q2 2017 data gathered between April and June 2017, during which time a snap General Election was held, resulting in a hung parliament.
Given that SMEs that trade internationally will potentially see more of an impact post-Brexit, this chapter also includes a summary of how such SMEs have been feeling post the referendum result.
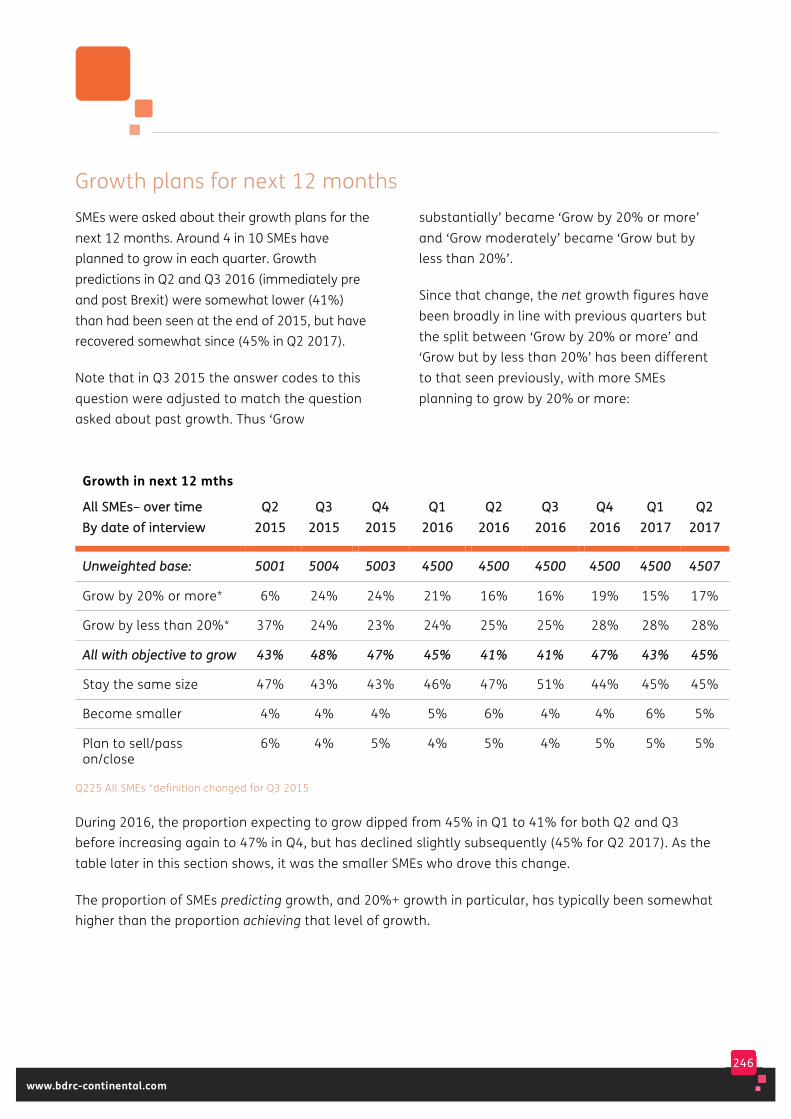
246
www.bdrc-continental.com
Growth plans for next 12 months SMEs were asked about their growth plans for the next 12 months. Around 4 in 10 SMEs have planned to grow in each quarter. Growth predictions in Q2 and Q3 2016 (immediately pre and post Brexit) were somewhat lower (41%) than had been seen at the end of 2015, but have recovered somewhat since (45% in Q2 2017).
Note that in Q3 2015 the answer codes to this question were adjusted to match the question asked about past growth. Thus ‘Grow
substantially’ became ‘Grow by 20% or more’ and ‘Grow moderately’ became ‘Grow but by less than 20%’.
Since that change, the net growth figures have been broadly in line with previous quarters but the split between ‘Grow by 20% or more’ and ‘Grow but by less than 20%’ has been different to that seen previously, with more SMEs planning to grow by 20% or more:
Growth in next 12 mths
AAllll SSMMEEss–– oovveerr ttiimmee BByy ddaattee ooff iinntteerrvviieeww
QQ22 22001155
QQ33 22001155
QQ44 22001155
QQ11 22001166
QQ22 22001166
QQ33 22001166
QQ44 22001166
QQ11 22001177
QQ22 22001177
UUnnwweeiigghhtteedd bbaassee:: 55000011 55000044 55000033 44550000 44550000 44550000 44550000 44550000 44550077
Grow by 20% or more* 6% 24% 24% 21% 16% 16% 19% 15% 17%
Grow by less than 20%* 37% 24% 23% 24% 25% 25% 28% 28% 28%
AAllll wwiitthh oobbjjeeccttiivvee ttoo ggrrooww 4433%% 4488%% 4477%% 4455%% 4411%% 4411%% 4477%% 4433%% 4455%%
Stay the same size 47% 43% 43% 46% 47% 51% 44% 45% 45%
Become smaller 4% 4% 4% 5% 6% 4% 4% 6% 5%
Plan to sell/pass on/close
6% 4% 5% 4% 5% 4% 5% 5% 5%
Q225 All SMEs *definition changed for Q3 2015
During 2016, the proportion expecting to grow dipped from 45% in Q1 to 41% for both Q2 and Q3 before increasing again to 47% in Q4, but has declined slightly subsequently (45% for Q2 2017). As the table later in this section shows, it was the smaller SMEs who drove this change.
The proportion of SMEs predicting growth, and 20%+ growth in particular, has typically been somewhat higher than the proportion achieving that level of growth.
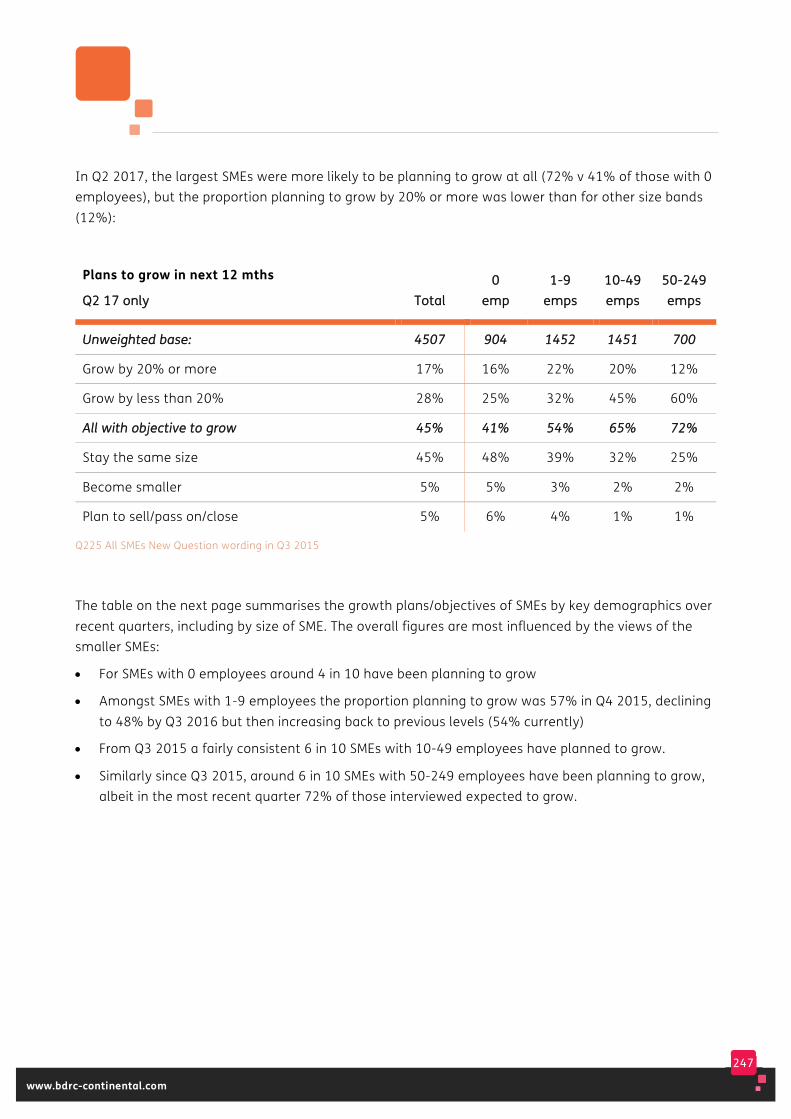
247
www.bdrc-continental.com
In Q2 2017, the largest SMEs were more likely to be planning to grow at all (72% v 41% of those with 0 employees), but the proportion planning to grow by 20% or more was lower than for other size bands (12%):
Plans to grow in next 12 mths
QQ22 1177 oonnllyy TToottaall 00
eemmpp 11--99
eemmppss 1100--4499 eemmppss
5500--224499 eemmppss
UUnnwweeiigghhtteedd bbaassee:: 44550077 990044 11445522 11445511 770000
Grow by 20% or more 17% 16% 22% 20% 12%
Grow by less than 20% 28% 25% 32% 45% 60%
AAllll wwiitthh oobbjjeeccttiivvee ttoo ggrrooww 4455%% 4411%% 5544%% 6655%% 7722%%
Stay the same size 45% 48% 39% 32% 25%
Become smaller 5% 5% 3% 2% 2%
Plan to sell/pass on/close 5% 6% 4% 1% 1%
Q225 All SMEs New Question wording in Q3 2015
The table on the next page summarises the growth plans/objectives of SMEs by key demographics over recent quarters, including by size of SME. The overall figures are most influenced by the views of the smaller SMEs:
• For SMEs with 0 employees around 4 in 10 have been planning to grow
• Amongst SMEs with 1-9 employees the proportion planning to grow was 57% in Q4 2015, declining to 48% by Q3 2016 but then increasing back to previous levels (54% currently)
• From Q3 2015 a fairly consistent 6 in 10 SMEs with 10-49 employees have planned to grow.
• Similarly since Q3 2015, around 6 in 10 SMEs with 50-249 employees have been planning to grow, albeit in the most recent quarter 72% of those interviewed expected to grow.
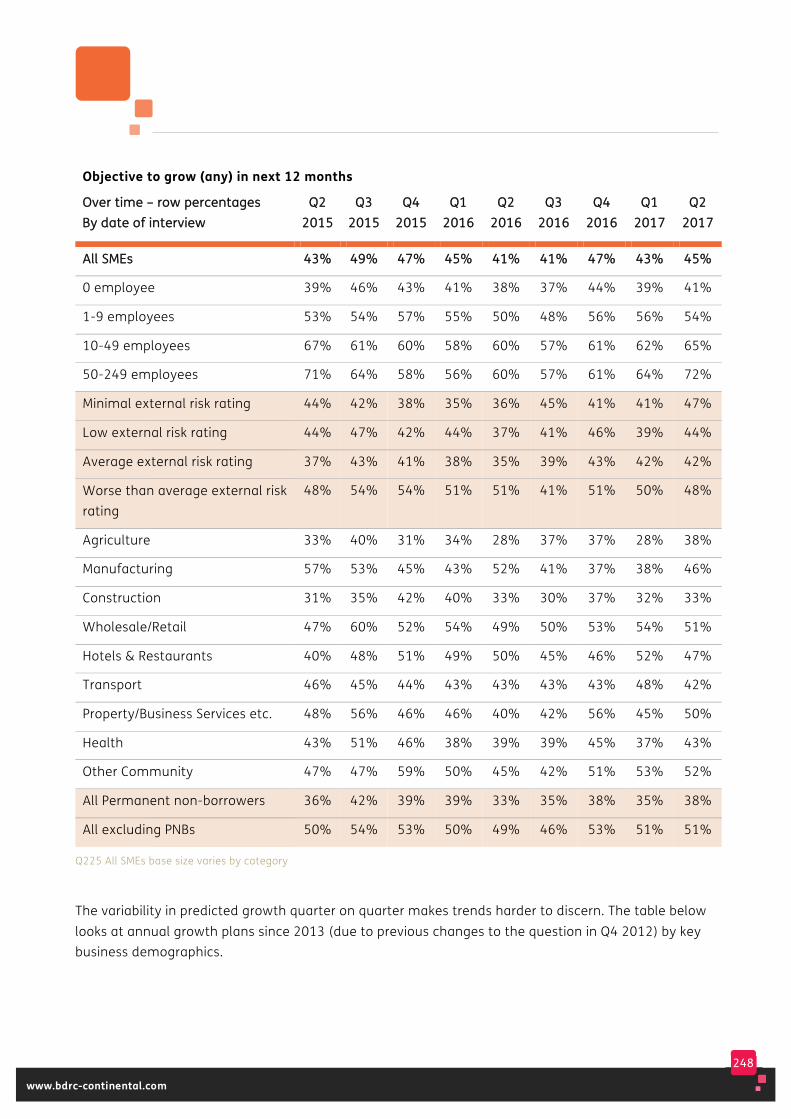
248
www.bdrc-continental.com
Objective to grow (any) in next 12 months
OOvveerr ttiimmee –– rrooww ppeerrcceennttaaggeess BByy ddaattee ooff iinntteerrvviieeww
QQ22 22001155
QQ33 22001155
QQ44 22001155
QQ11 22001166
QQ22 22001166
QQ33 22001166
QQ44 22001166
QQ11 22001177
QQ22 22001177
AAllll SSMMEEss 4433%% 4499%% 4477%% 4455%% 4411%% 4411%% 4477%% 4433%% 4455%%
0 employee 39% 46% 43% 41% 38% 37% 44% 39% 41%
1-9 employees 53% 54% 57% 55% 50% 48% 56% 56% 54%
10-49 employees 67% 61% 60% 58% 60% 57% 61% 62% 65%
50-249 employees 71% 64% 58% 56% 60% 57% 61% 64% 72%
Minimal external risk rating 44% 42% 38% 35% 36% 45% 41% 41% 47%
Low external risk rating 44% 47% 42% 44% 37% 41% 46% 39% 44%
Average external risk rating 37% 43% 41% 38% 35% 39% 43% 42% 42%
Worse than average external risk rating
48% 54% 54% 51% 51% 41% 51% 50% 48%
Agriculture 33% 40% 31% 34% 28% 37% 37% 28% 38%
Manufacturing 57% 53% 45% 43% 52% 41% 37% 38% 46%
Construction 31% 35% 42% 40% 33% 30% 37% 32% 33%
Wholesale/Retail 47% 60% 52% 54% 49% 50% 53% 54% 51%
Hotels & Restaurants 40% 48% 51% 49% 50% 45% 46% 52% 47%
Transport 46% 45% 44% 43% 43% 43% 43% 48% 42%
Property/Business Services etc. 48% 56% 46% 46% 40% 42% 56% 45% 50%
Health 43% 51% 46% 38% 39% 39% 45% 37% 43%
Other Community 47% 47% 59% 50% 45% 42% 51% 53% 52%
All Permanent non-borrowers 36% 42% 39% 39% 33% 35% 38% 35% 38%
All excluding PNBs 50% 54% 53% 50% 49% 46% 53% 51% 51%
Q225 All SMEs base size varies by category
The variability in predicted growth quarter on quarter makes trends harder to discern. The table below looks at annual growth plans since 2013 (due to previous changes to the question in Q4 2012) by key business demographics.
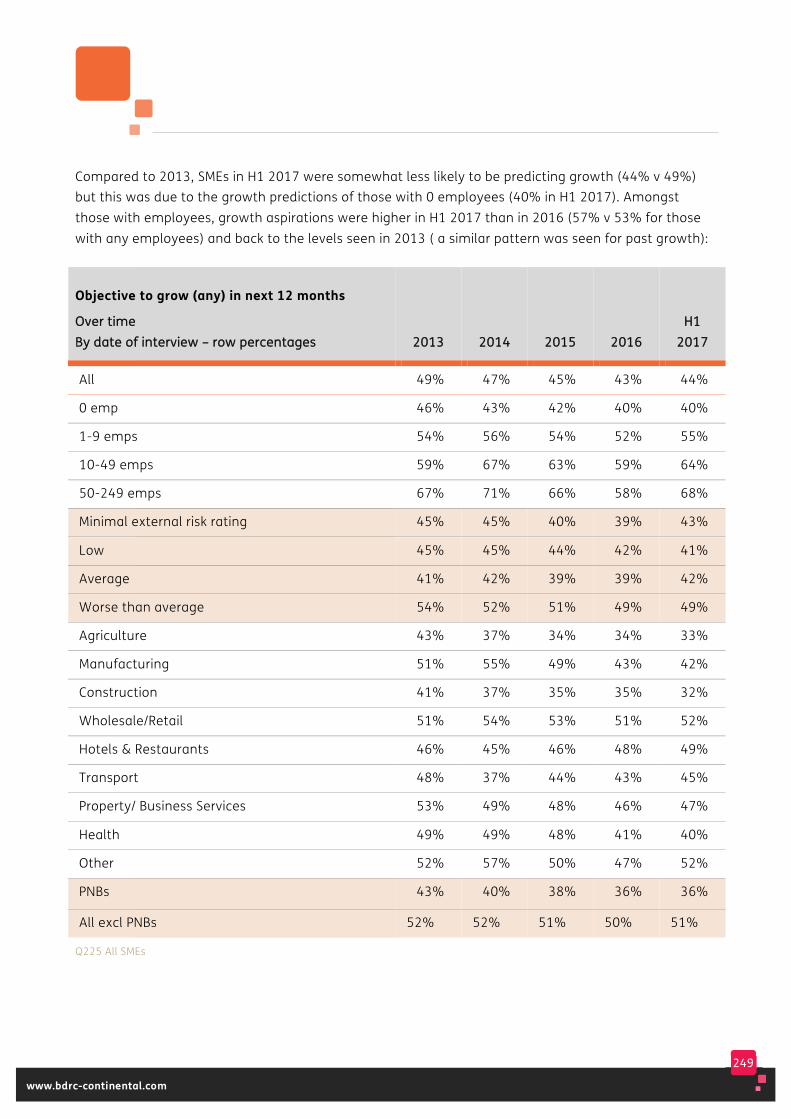
249
www.bdrc-continental.com
Compared to 2013, SMEs in H1 2017 were somewhat less likely to be predicting growth (44% v 49%) but this was due to the growth predictions of those with 0 employees (40% in H1 2017). Amongst those with employees, growth aspirations were higher in H1 2017 than in 2016 (57% v 53% for those with any employees) and back to the levels seen in 2013 ( a similar pattern was seen for past growth):
Objective to grow (any) in next 12 months
OOvveerr ttiimmee BByy ddaattee ooff iinntteerrvviieeww –– rrooww ppeerrcceennttaaggeess 22001133 22001144 22001155
22001166
HH11 22001177
All 49% 47% 45% 43% 44%
0 emp 46% 43% 42% 40% 40%
1-9 emps 54% 56% 54% 52% 55%
10-49 emps 59% 67% 63% 59% 64%
50-249 emps 67% 71% 66% 58% 68%
Minimal external risk rating 45% 45% 40% 39% 43%
Low 45% 45% 44% 42% 41%
Average 41% 42% 39% 39% 42%
Worse than average 54% 52% 51% 49% 49%
Agriculture 43% 37% 34% 34% 33%
Manufacturing 51% 55% 49% 43% 42%
Construction 41% 37% 35% 35% 32%
Wholesale/Retail 51% 54% 53% 51% 52%
Hotels & Restaurants 46% 45% 46% 48% 49%
Transport 48% 37% 44% 43% 45%
Property/ Business Services 53% 49% 48% 46% 47%
Health 49% 49% 48% 41% 40%
Other 52% 57% 50% 47% 52%
PNBs 43% 40% 38% 36% 36%
All excl PNBs 52% 52% 51% 50% 51%
Q225 All SMEs
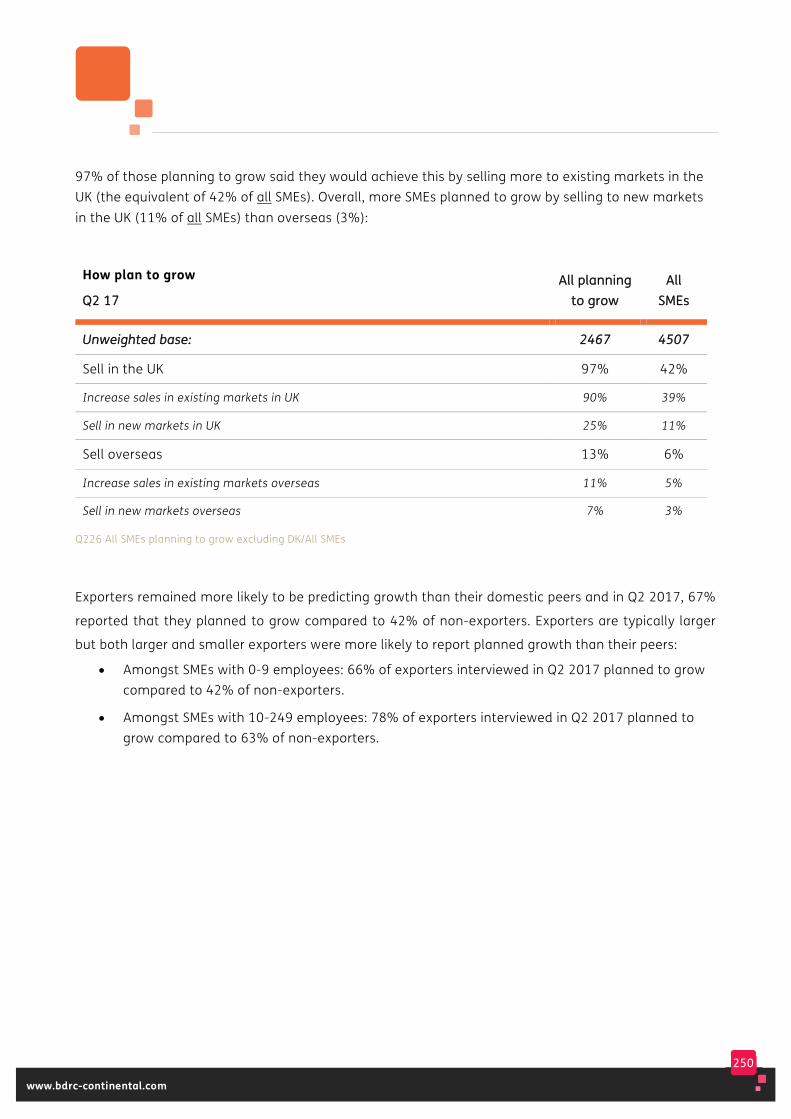
250
www.bdrc-continental.com
97% of those planning to grow said they would achieve this by selling more to existing markets in the UK (the equivalent of 42% of all SMEs). Overall, more SMEs planned to grow by selling to new markets in the UK (11% of all SMEs) than overseas (3%):
How plan to grow
QQ22 1177 AAllll ppllaannnniinngg
ttoo ggrrooww AAllll
SSMMEEss
UUnnwweeiigghhtteedd bbaassee:: 22446677 44550077
Sell in the UK 97% 42%
Increase sales in existing markets in UK 90% 39%
Sell in new markets in UK 25% 11%
Sell overseas 13% 6%
Increase sales in existing markets overseas 11% 5%
Sell in new markets overseas 7% 3%
Q226 All SMEs planning to grow excluding DK/All SMEs
Exporters remained more likely to be predicting growth than their domestic peers and in Q2 2017, 67%
reported that they planned to grow compared to 42% of non-exporters. Exporters are typically larger
but both larger and smaller exporters were more likely to report planned growth than their peers:
• Amongst SMEs with 0-9 employees: 66% of exporters interviewed in Q2 2017 planned to grow compared to 42% of non-exporters.
• Amongst SMEs with 10-249 employees: 78% of exporters interviewed in Q2 2017 planned to grow compared to 63% of non-exporters.
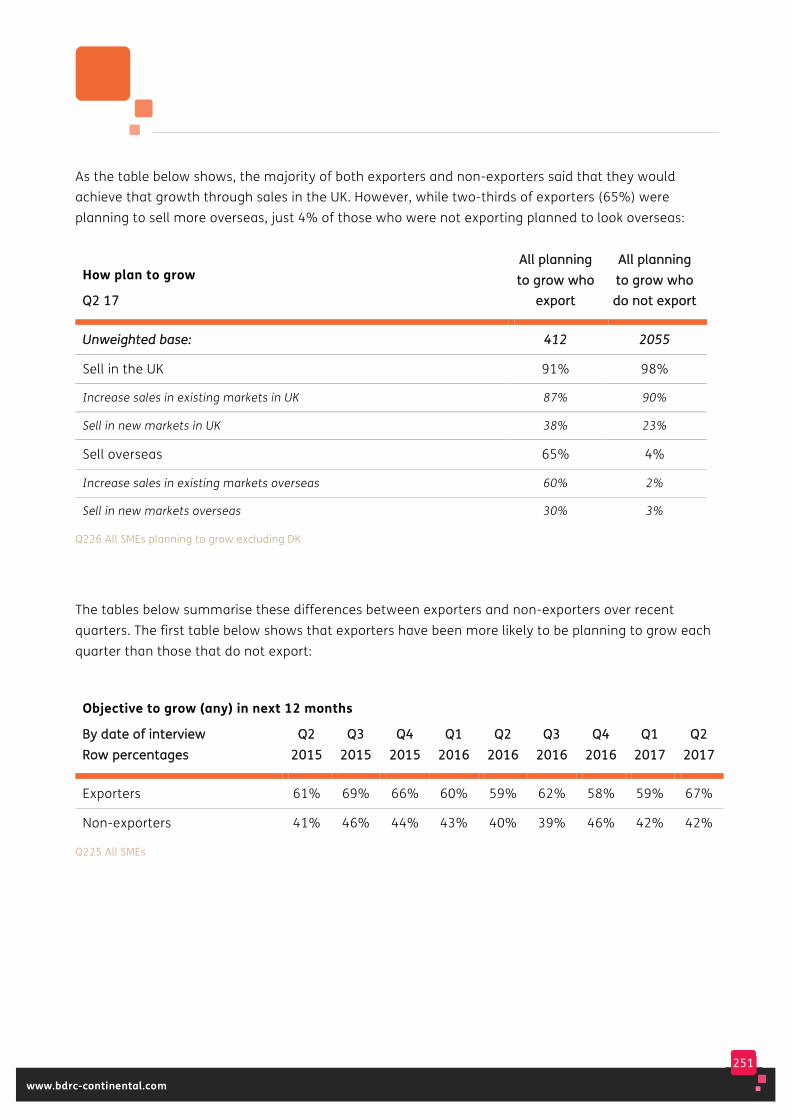
251
www.bdrc-continental.com
As the table below shows, the majority of both exporters and non-exporters said that they would achieve that growth through sales in the UK. However, while two-thirds of exporters (65%) were planning to sell more overseas, just 4% of those who were not exporting planned to look overseas:
How plan to grow
QQ22 1177
AAllll ppllaannnniinngg ttoo ggrrooww wwhhoo
eexxppoorrtt
AAllll ppllaannnniinngg ttoo ggrrooww wwhhoo ddoo nnoott eexxppoorrtt
UUnnwweeiigghhtteedd bbaassee:: 441122 22005555
Sell in the UK 91% 98%
Increase sales in existing markets in UK 87% 90%
Sell in new markets in UK 38% 23%
Sell overseas 65% 4%
Increase sales in existing markets overseas 60% 2%
Sell in new markets overseas 30% 3%
Q226 All SMEs planning to grow excluding DK
The tables below summarise these differences between exporters and non-exporters over recent quarters. The first table below shows that exporters have been more likely to be planning to grow each quarter than those that do not export:
Objective to grow (any) in next 12 months
BByy ddaattee ooff iinntteerrvviieeww RRooww ppeerrcceennttaaggeess
QQ22 22001155
QQ33 22001155
QQ44 22001155
QQ11 22001166
QQ22 22001166
QQ33 22001166
QQ44 22001166
QQ11 22001177
QQ22 22001177
Exporters 61% 69% 66% 60% 59% 62% 58% 59% 67%
Non-exporters 41% 46% 44% 43% 40% 39% 46% 42% 42%
Q225 All SMEs
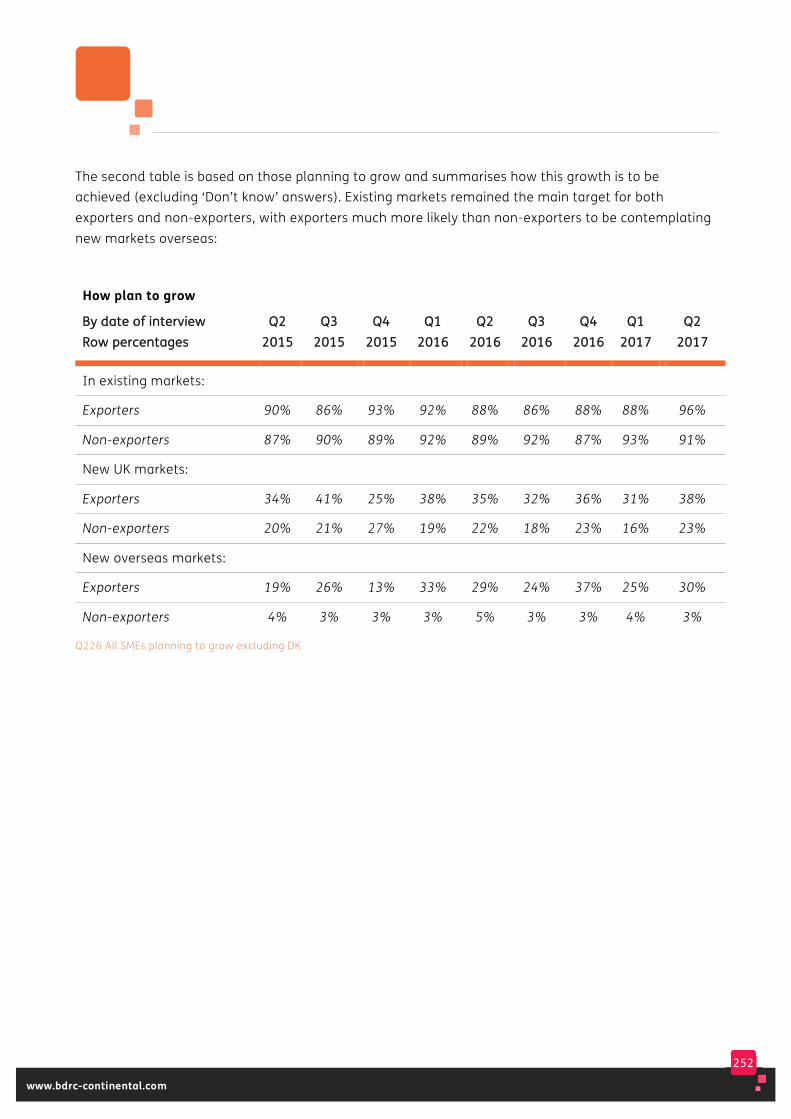
252
www.bdrc-continental.com
The second table is based on those planning to grow and summarises how this growth is to be achieved (excluding ‘Don’t know’ answers). Existing markets remained the main target for both exporters and non-exporters, with exporters much more likely than non-exporters to be contemplating new markets overseas:
How plan to grow
BByy ddaattee ooff iinntteerrvviieeww RRooww ppeerrcceennttaaggeess
QQ22 22001155
QQ33 22001155
QQ44 22001155
QQ11 22001166
QQ22 22001166
QQ33 22001166
QQ44 22001166
QQ11 22001177
QQ22 22001177
In existing markets:
Exporters 90% 86% 93% 92% 88% 86% 88% 88% 96%
Non-exporters 87% 90% 89% 92% 89% 92% 87% 93% 91%
New UK markets:
Exporters 34% 41% 25% 38% 35% 32% 36% 31% 38%
Non-exporters 20% 21% 27% 19% 22% 18% 23% 16% 23%
New overseas markets:
Exporters 19% 26% 13% 33% 29% 24% 37% 25% 30%
Non-exporters 4% 3% 3% 3% 5% 3% 3% 4% 3%
Q226 All SMEs planning to grow excluding DK
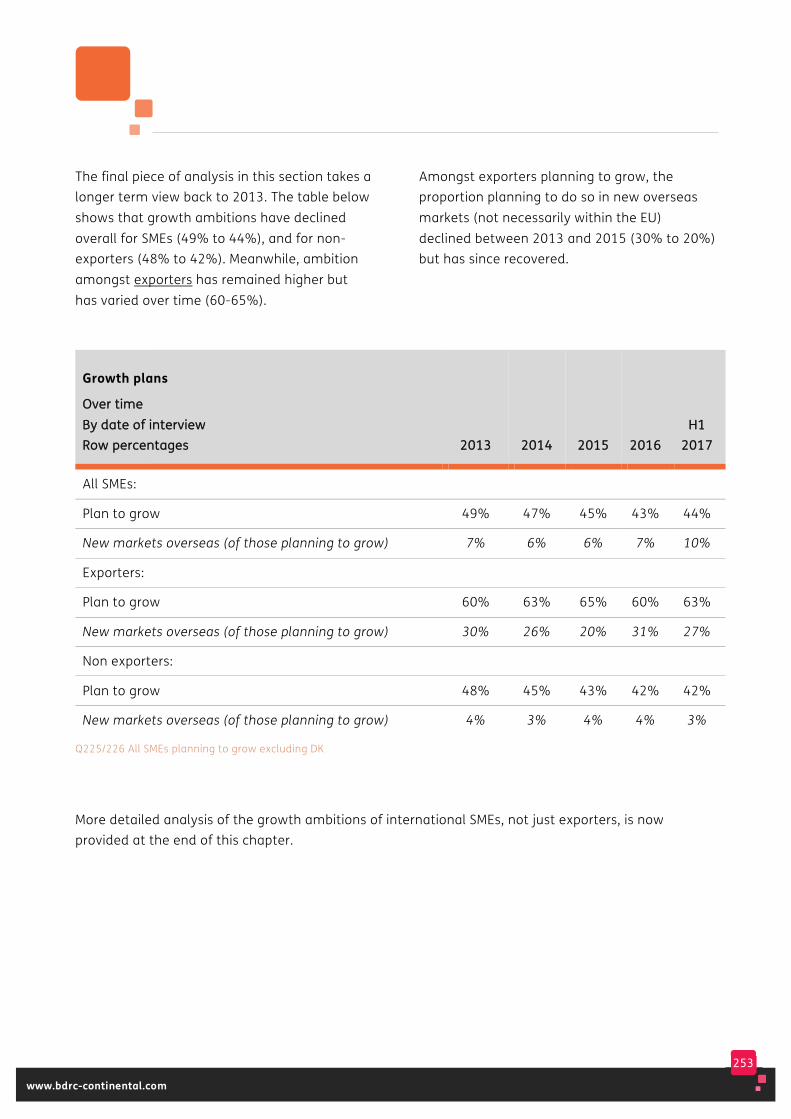
253
www.bdrc-continental.com
The final piece of analysis in this section takes a longer term view back to 2013. The table below shows that growth ambitions have declined overall for SMEs (49% to 44%), and for non-exporters (48% to 42%). Meanwhile, ambition amongst exporters has remained higher but has varied over time (60-65%).
Amongst exporters planning to grow, the proportion planning to do so in new overseas markets (not necessarily within the EU) declined between 2013 and 2015 (30% to 20%) but has since recovered.
Growth plans
OOvveerr ttiimmee BByy ddaattee ooff iinntteerrvviieeww RRooww ppeerrcceennttaaggeess 22001133 22001144 22001155 22001166
HH11 22001177
All SMEs:
Plan to grow 49% 47% 45% 43% 44%
New markets overseas (of those planning to grow) 7% 6% 6% 7% 10%
Exporters:
Plan to grow 60% 63% 65% 60% 63%
New markets overseas (of those planning to grow) 30% 26% 20% 31% 27%
Non exporters:
Plan to grow 48% 45% 43% 42% 42%
New markets overseas (of those planning to grow) 4% 3% 4% 4% 3%
Q225/226 All SMEs planning to grow excluding DK
More detailed analysis of the growth ambitions of international SMEs, not just exporters, is now provided at the end of this chapter.

254
www.bdrc-continental.com
Obstacles to running the business in the next 12 months
SMEs were asked to rate the extent to which each of a number of factors were perceived as obstacles to them running the business as they would wish in the next 12 months, using a 1 to 10 scale (where 1 meant the factor was not an obstacle at all, and 10 that it was seen as a major obstacle). Scores have been analysed in 3 bands:
• 1-4 = a minor obstacle
• 5-7 = a moderate obstacle
• 8-10 = a major obstacle.
Over time, some amendements have been made to the list of factors tested, detailed in previous reports. In Q1 2017, two further changes were made:
• ‘Changes in the value of sterling’ replaced ‘The quality of management and leadership in the business’ which had been added in Q3 2015.
• The existing code ‘Legislation and regulation’ was extended to include ‘red tape’.
The latest data was collected during and immediately after the General Election campaign. At an overall level there has been relatively little change in the proportion of SMEs rating either the current economic climate or ‘Political uncertainty and future government policy’ as major obstacles, but this was due to there being little
change in the views of 0 employee SMEs. Amongst larger SMEs and/or those who are international, both of these factors have been mentioned more as major obstacles recently, although views remain somewhat volatile as is reported later in this section.
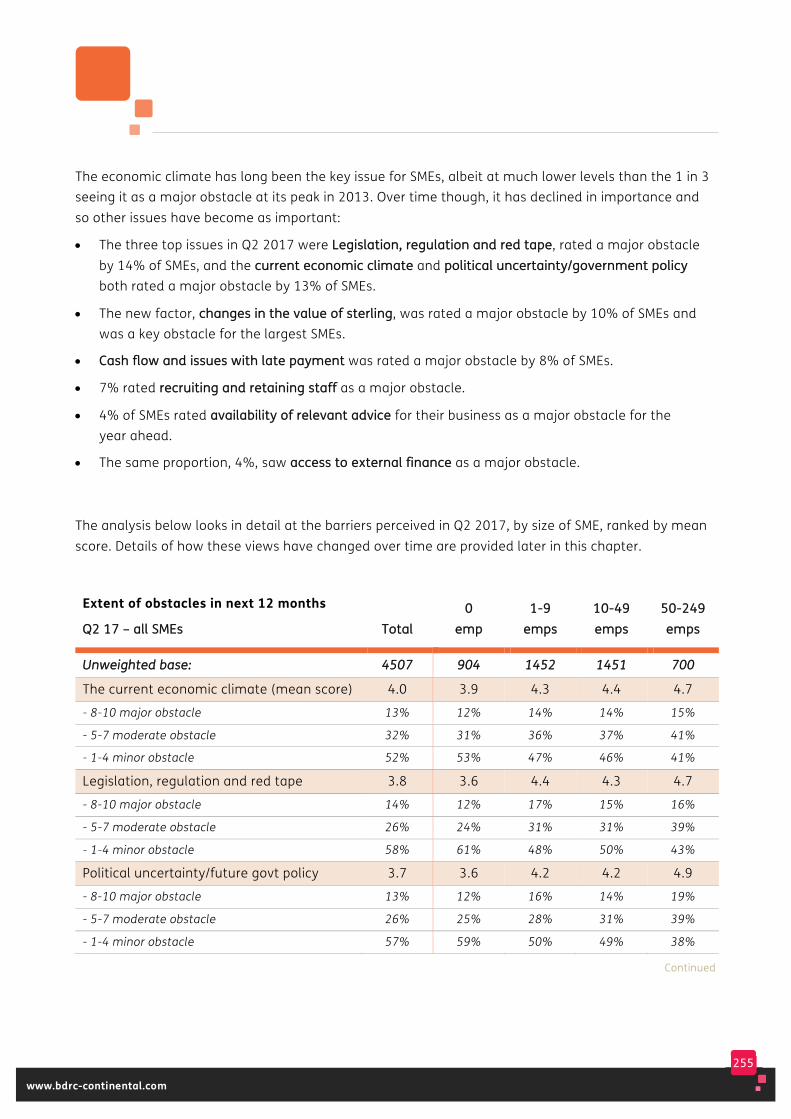
255
www.bdrc-continental.com
The economic climate has long been the key issue for SMEs, albeit at much lower levels than the 1 in 3 seeing it as a major obstacle at its peak in 2013. Over time though, it has declined in importance and so other issues have become as important:
• The three top issues in Q2 2017 were LLeeggiissllaattiioonn,, rreegguullaattiioonn aanndd rreedd ttaappee, rated a major obstacle by 14% of SMEs, and the ccuurrrreenntt eeccoonnoommiicc cclliimmaattee and ppoolliittiiccaall uunncceerrttaaiinnttyy//ggoovveerrnnmmeenntt ppoolliiccyy both rated a major obstacle by 13% of SMEs.
• The new factor, cchhaannggeess iinn tthhee vvaalluuee ooff sstteerrlliinngg, was rated a major obstacle by 10% of SMEs and was a key obstacle for the largest SMEs.
• CCaasshh ffllooww aanndd iissssuueess wwiitthh llaattee ppaayymmeenntt was rated a major obstacle by 8% of SMEs.
• 7% rated rreeccrruuiittiinngg aanndd rreettaaiinniinngg ssttaaffff as a major obstacle.
• 4% of SMEs rated aavvaaiillaabbiilliittyy ooff rreelleevvaanntt aaddvviiccee for their business as a major obstacle for the year ahead.
• The same proportion, 4%, saw aacccceessss ttoo eexxtteerrnnaall ffiinnaannccee as a major obstacle.
The analysis below looks in detail at the barriers perceived in Q2 2017, by size of SME, ranked by mean score. Details of how these views have changed over time are provided later in this chapter.
Extent of obstacles in next 12 months
QQ22 1177 –– aallll SSMMEEss TToottaall 00
eemmpp 11--99
eemmppss 1100--4499 eemmppss
5500--224499 eemmppss
UUnnwweeiigghhtteedd bbaassee:: 44550077 990044 11445522 11445511 770000
The current economic climate (mean score) 4.0 3.9 4.3 4.4 4.7
- 8-10 major obstacle 13% 12% 14% 14% 15%
- 5-7 moderate obstacle 32% 31% 36% 37% 41%
- 1-4 minor obstacle 52% 53% 47% 46% 41%
Legislation, regulation and red tape 3.8 3.6 4.4 4.3 4.7
- 8-10 major obstacle 14% 12% 17% 15% 16%
- 5-7 moderate obstacle 26% 24% 31% 31% 39%
- 1-4 minor obstacle 58% 61% 48% 50% 43%
Political uncertainty/future govt policy 3.7 3.6 4.2 4.2 4.9
- 8-10 major obstacle 13% 12% 16% 14% 19%
- 5-7 moderate obstacle 26% 25% 28% 31% 39%
- 1-4 minor obstacle 57% 59% 50% 49% 38%
Continued

256
www.bdrc-continental.com
Continued
Changes in the value of sterling 3.0 2.9 3.5 3.7 4.5
- 8-10 major obstacle 10% 9% 13% 13% 23%
- 5-7 moderate obstacle 18% 17% 21% 25% 25%
- 1-4 minor obstacle 68% 71% 62% 57% 49%
Cash flow/issues with late payment 2.9 2.8 3.1 3.1 3.1
- 8-10 major obstacle 8% 8% 9% 8% 6%
- 5-7 moderate obstacle 17% 16% 19% 19% 21%
- 1-4 minor obstacle 73% 74% 69% 70% 71%
Availability of relevant advice 2.4 2.3 2.6 2.4 2.5
- 8-10 major obstacle 4% 4% 5% 3% 2%
- 5-7 moderate obstacle 14% 13% 16% 15% 19%
- 1-4 minor obstacle 79% 80% 76% 79% 76%
Recruiting/retaining staff 2.3 2.0 3.2 3.9 4.3
- 8-10 major obstacle 7% 5% 11% 13% 13%
- 5-7 moderate obstacle 10% 7% 18% 29% 36%
- 1-4 minor obstacle 79% 84% 67% 56% 49%
Access to external finance 2.1 2.1 2.4 2.2 2.4
- 8-10 major obstacle 4% 4% 5% 4% 1%
- 5-7 moderate obstacle 11% 10% 12% 11% 18%
- 1-4 minor obstacle 82% 83% 78% 81% 78%
NNoonnee ooff tthheessee aarree mmaajjoorr oobbssttaacclleess 6644%% 6666%% 5588%% 5599%% 5555%%
Q227a All SMEs
SMEs with employees were somewhat more likely to rate some of the following as major obstacles:
• 17% rated legislation and regulation as a major obstacle, compared to 12% of those with no employees
• 16% rated political uncertainty as a major obstacle, compared to 12% of those with no employees
• 12% rated recruiting and retaining staff as a major obstacle, compared to 5% of those with no employees.

257
www.bdrc-continental.com
In Q2 2017, 64% of SMEs did not rate any of these factors as a major obstacle (scoring 8-10).
All those who did not score 8-10 for any of these factors were asked if there were any barriers missing from the list. Almost all (95%) said that there weren’t. The top other mention was terrorism (3%).
The tables below focus on those scoring 8-10 for each potential obstacle. For ease, the analysis by size of SME (provided in more detail in the previous table) is summarised below:
Extent of obstacles in next 12 months
QQ22 1177 –– aallll SSMMEEss 88--1100 iimmppaacctt ssccoorree TToottaall
00 eemmpp
11--99 eemmppss
1100--4499 eemmppss
5500--224499 eemmppss
UUnnwweeiigghhtteedd bbaassee:: 44550077 990044 11445522 11445511 770000
Legislation, regulation and red tape 14% 12% 17% 15% 16%
The current economic climate 13% 12% 14% 14% 15%
Political uncertainty/future govt policy 13% 12% 16% 14% 19%
Changes to value of sterling 10% 9% 13% 13% 23%
Cash flow/issues with late payment 8% 8% 9% 8% 6%
Recruiting/retaining staff 7% 5% 11% 13% 13%
Availability of relevant advice 4% 4% 5% 3% 2%
Access to external finance 4% 4% 5% 4% 1%
NNoonnee ooff tthheessee rraatteedd aa mmaajjoorr oobbssttaaccllee 6644%% 6666%% 5588%% 5599%% 5555%%
Q227a All SMEs
This shows that the top 3 major obstacles (the economic climate, political uncertainty and legislation) were key issues for all sizes of SMEs but mentioned more by the larger SMEs. A quarter of SMEs in Q2 2017 (27%) mentioned one or more of these three factors as barriers,
increasing slightly by size of SME (26% of 0 employee SMEs to 34% of those with 50-249 employees). The new barrier, changes to the value of sterling, was mentioned more by larger SMEs and was the number one barrier for those with 50-249 employees (23%).
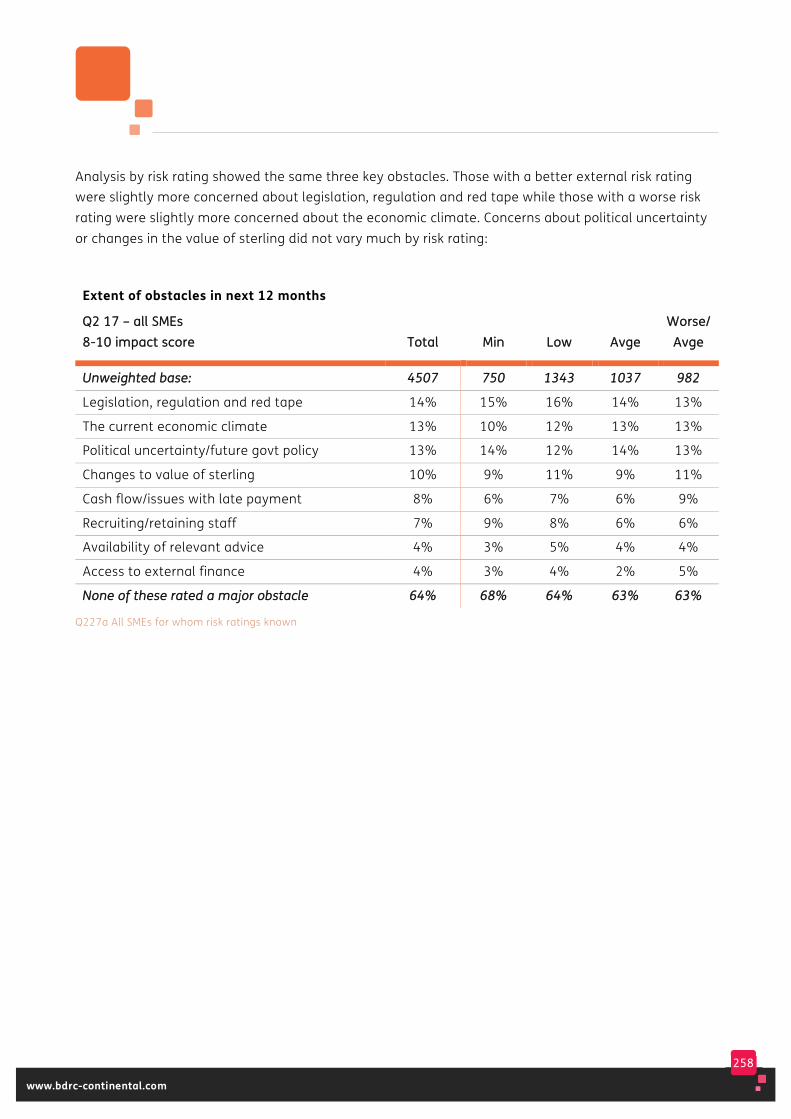
258
www.bdrc-continental.com
Analysis by risk rating showed the same three key obstacles. Those with a better external risk rating were slightly more concerned about legislation, regulation and red tape while those with a worse risk rating were slightly more concerned about the economic climate. Concerns about political uncertainty or changes in the value of sterling did not vary much by risk rating:
Extent of obstacles in next 12 months
QQ22 1177 –– aallll SSMMEEss 88--1100 iimmppaacctt ssccoorree TToottaall MMiinn LLooww AAvvggee
WWoorrssee// AAvvggee
UUnnwweeiigghhtteedd bbaassee:: 44550077 775500 11334433 11003377 998822
Legislation, regulation and red tape 14% 15% 16% 14% 13%
The current economic climate 13% 10% 12% 13% 13%
Political uncertainty/future govt policy 13% 14% 12% 14% 13%
Changes to value of sterling 10% 9% 11% 9% 11%
Cash flow/issues with late payment 8% 6% 7% 6% 9%
Recruiting/retaining staff 7% 9% 8% 6% 6%
Availability of relevant advice 4% 3% 5% 4% 4%
Access to external finance 4% 3% 4% 2% 5%
NNoonnee ooff tthheessee rraatteedd aa mmaajjoorr oobbssttaaccllee 6644%% 6688%% 6644%% 6633%% 6633%%
Q227a All SMEs for whom risk ratings known
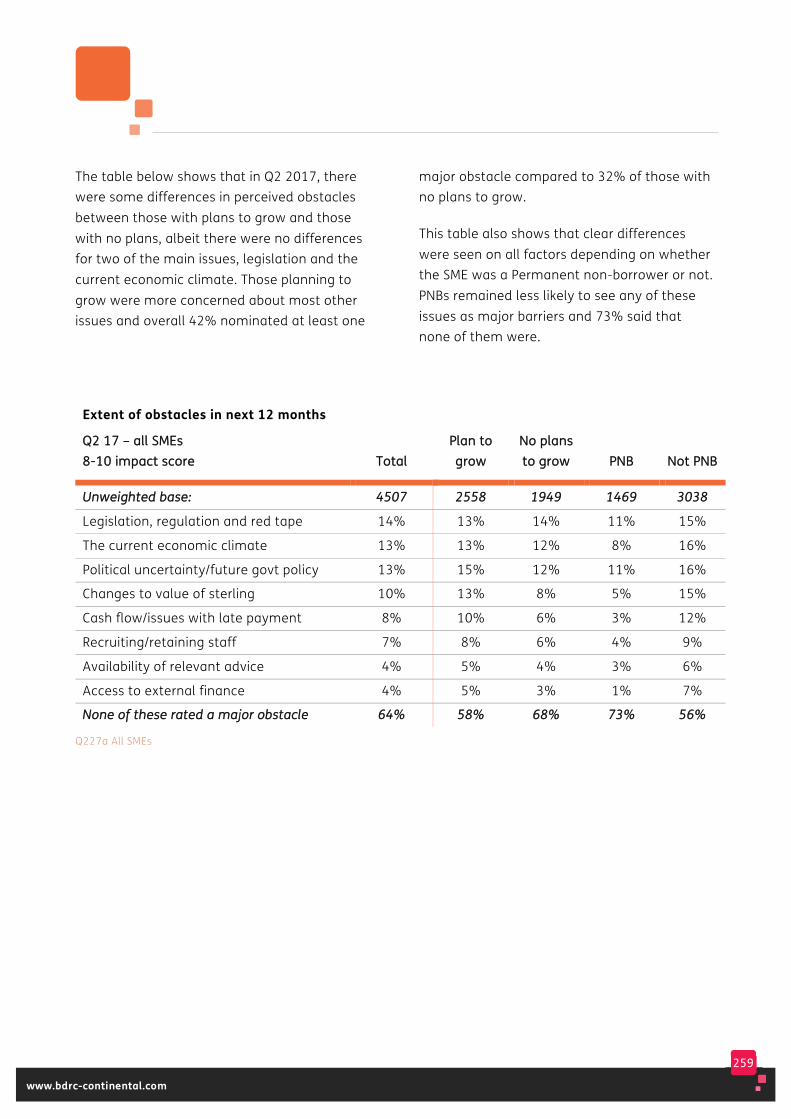
259
www.bdrc-continental.com
The table below shows that in Q2 2017, there were some differences in perceived obstacles between those with plans to grow and those with no plans, albeit there were no differences for two of the main issues, legislation and the current economic climate. Those planning to grow were more concerned about most other issues and overall 42% nominated at least one
major obstacle compared to 32% of those with no plans to grow.
This table also shows that clear differences were seen on all factors depending on whether the SME was a Permanent non-borrower or not. PNBs remained less likely to see any of these issues as major barriers and 73% said that none of them were.
Extent of obstacles in next 12 months
QQ22 1177 –– aallll SSMMEEss 88--1100 iimmppaacctt ssccoorree TToottaall
PPllaann ttoo ggrrooww
NNoo ppllaannss ttoo ggrrooww PPNNBB NNoott PPNNBB
UUnnwweeiigghhtteedd bbaassee:: 44550077 22555588 11994499 11446699 33003388
Legislation, regulation and red tape 14% 13% 14% 11% 15%
The current economic climate 13% 13% 12% 8% 16%
Political uncertainty/future govt policy 13% 15% 12% 11% 16%
Changes to value of sterling 10% 13% 8% 5% 15%
Cash flow/issues with late payment 8% 10% 6% 3% 12%
Recruiting/retaining staff 7% 8% 6% 4% 9%
Availability of relevant advice 4% 5% 4% 3% 6%
Access to external finance 4% 5% 3% 1% 7%
NNoonnee ooff tthheessee rraatteedd aa mmaajjoorr oobbssttaaccllee 6644%% 5588%% 6688%% 7733%% 5566%%
Q227a All SMEs
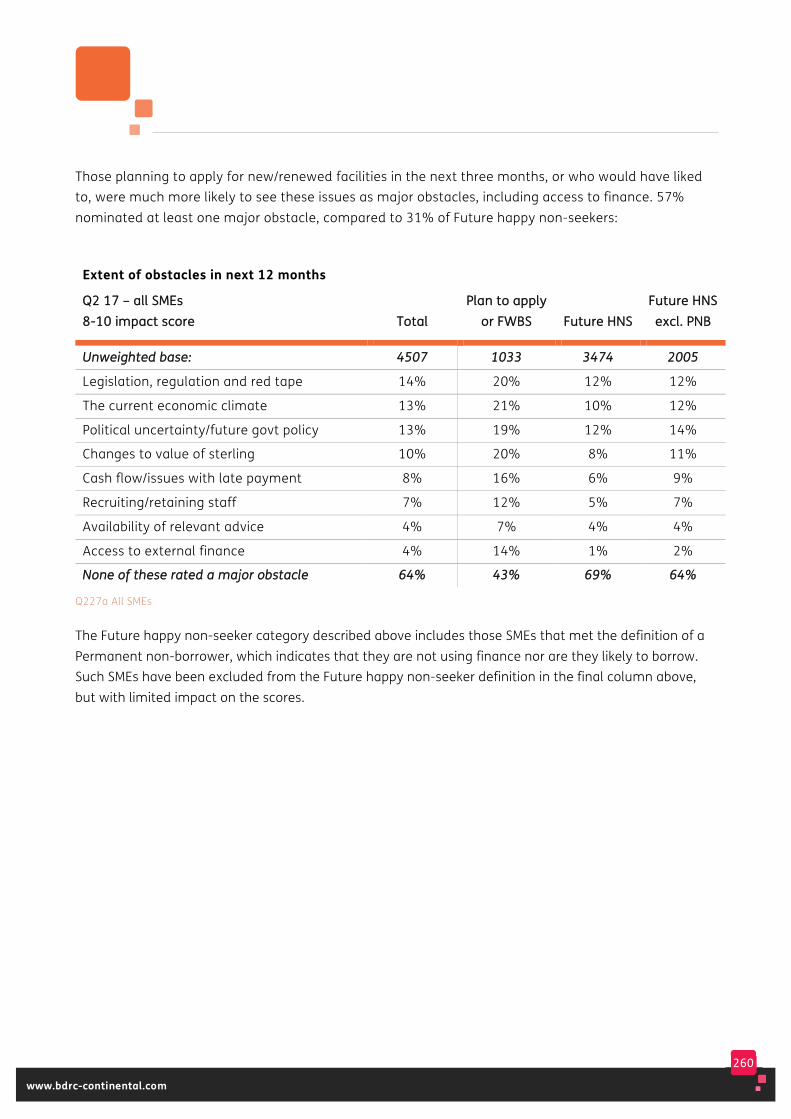
260
www.bdrc-continental.com
Those planning to apply for new/renewed facilities in the next three months, or who would have liked to, were much more likely to see these issues as major obstacles, including access to finance. 57% nominated at least one major obstacle, compared to 31% of Future happy non-seekers:
Extent of obstacles in next 12 months
QQ22 1177 –– aallll SSMMEEss 88--1100 iimmppaacctt ssccoorree TToottaall
PPllaann ttoo aappppllyy oorr FFWWBBSS FFuuttuurree HHNNSS
FFuuttuurree HHNNSS eexxccll.. PPNNBB
UUnnwweeiigghhtteedd bbaassee:: 44550077 11003333 33447744 22000055
Legislation, regulation and red tape 14% 20% 12% 12%
The current economic climate 13% 21% 10% 12%
Political uncertainty/future govt policy 13% 19% 12% 14%
Changes to value of sterling 10% 20% 8% 11%
Cash flow/issues with late payment 8% 16% 6% 9%
Recruiting/retaining staff 7% 12% 5% 7%
Availability of relevant advice 4% 7% 4% 4%
Access to external finance 4% 14% 1% 2%
NNoonnee ooff tthheessee rraatteedd aa mmaajjoorr oobbssttaaccllee 6644%% 4433%% 6699%% 6644%%
Q227a All SMEs
The Future happy non-seeker category described above includes those SMEs that met the definition of a Permanent non-borrower, which indicates that they are not using finance nor are they likely to borrow. Such SMEs have been excluded from the Future happy non-seeker definition in the final column above, but with limited impact on the scores.
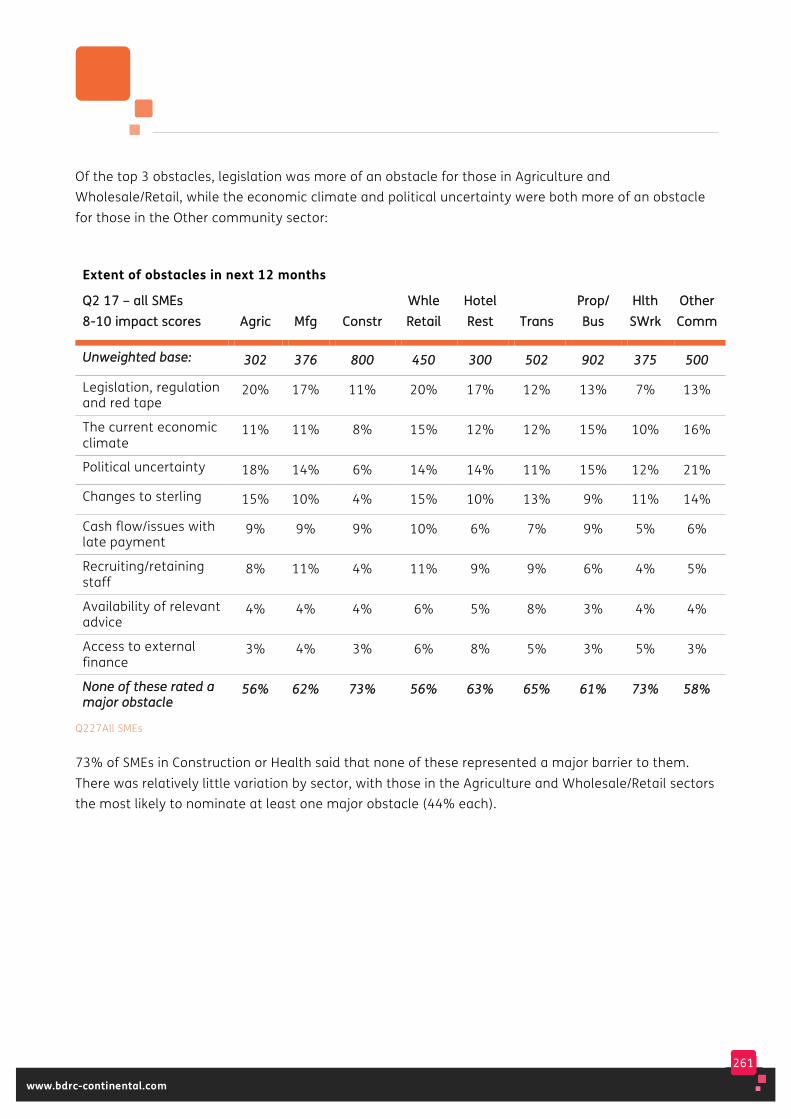
261
www.bdrc-continental.com
Of the top 3 obstacles, legislation was more of an obstacle for those in Agriculture and Wholesale/Retail, while the economic climate and political uncertainty were both more of an obstacle for those in the Other community sector:
Extent of obstacles in next 12 months
QQ22 1177 –– aallll SSMMEEss 88--1100 iimmppaacctt ssccoorreess AAggrriicc MMffgg CCoonnssttrr
WWhhllee RReettaaiill
HHootteell RReesstt TTrraannss
PPrroopp// BBuuss
HHlltthh SSWWrrkk
OOtthheerr CCoommmm
UUnnwweeiigghhtteedd bbaassee:: 330022 337766 880000 445500 330000 550022 990022 337755 550000
Legislation, regulation and red tape
20% 17% 11% 20% 17% 12% 13% 7% 13%
The current economic climate
11% 11% 8% 15% 12% 12% 15% 10% 16%
Political uncertainty 18% 14% 6% 14% 14% 11% 15% 12% 21%
Changes to sterling 15% 10% 4% 15% 10% 13% 9% 11% 14%
Cash flow/issues with late payment
9% 9% 9% 10% 6% 7% 9% 5% 6%
Recruiting/retaining staff
8% 11% 4% 11% 9% 9% 6% 4% 5%
Availability of relevant advice
4% 4% 4% 6% 5% 8% 3% 4% 4%
Access to external finance
3% 4% 3% 6% 8% 5% 3% 5% 3%
NNoonnee ooff tthheessee rraatteedd aa mmaajjoorr oobbssttaaccllee
5566%% 6622%% 7733%% 5566%% 6633%% 6655%% 6611%% 7733%% 5588%%
Q227All SMEs
73% of SMEs in Construction or Health said that none of these represented a major barrier to them. There was relatively little variation by sector, with those in the Agriculture and Wholesale/Retail sectors the most likely to nominate at least one major obstacle (44% each).
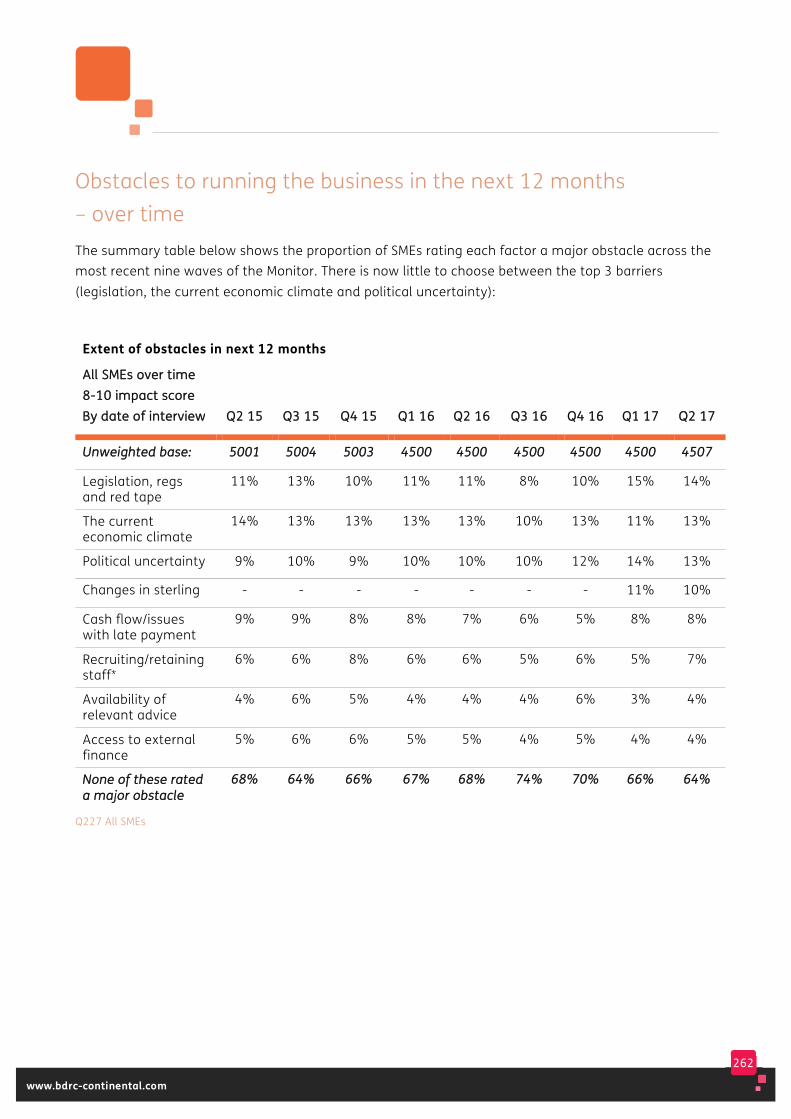
262
www.bdrc-continental.com
Obstacles to running the business in the next 12 months – over time The summary table below shows the proportion of SMEs rating each factor a major obstacle across the most recent nine waves of the Monitor. There is now little to choose between the top 3 barriers (legislation, the current economic climate and political uncertainty):
Extent of obstacles in next 12 months
AAllll SSMMEEss oovveerr ttiimmee 88--1100 iimmppaacctt ssccoorree BByy ddaattee ooff iinntteerrvviieeww QQ22 1155 QQ33 1155 QQ44 1155 QQ11 1166 QQ22 1166 QQ33 1166 QQ44 1166 QQ11 1177 QQ22 1177
UUnnwweeiigghhtteedd bbaassee:: 55000011 55000044 55000033 44550000 44550000 44550000 44550000 44550000 44550077
Legislation, regs and red tape
11% 13% 10% 11% 11% 8% 10% 15% 14%
The current economic climate
14% 13% 13% 13% 13% 10% 13% 11% 13%
Political uncertainty 9% 10% 9% 10% 10% 10% 12% 14% 13%
Changes in sterling - - - - - - - 11% 10%
Cash flow/issues with late payment
9% 9% 8% 8% 7% 6% 5% 8% 8%
Recruiting/retaining staff*
6% 6% 8% 6% 6% 5% 6% 5% 7%
Availability of relevant advice
4% 6% 5% 4% 4% 4% 6% 3% 4%
Access to external finance
5% 6% 6% 5% 5% 4% 5% 4% 4%
NNoonnee ooff tthheessee rraatteedd aa mmaajjoorr oobbssttaaccllee
6688%% 6644%% 6666%% 6677%% 6688%% 7744%% 7700%% 6666%% 6644%%
Q227 All SMEs

263
www.bdrc-continental.com
The tables below provide a longer term view back to 2012 to help identify changes over time:
Extent of obstacles in next 12 months
OOvveerr ttiimmee –– aallll SSMMEEss 88--1100 iimmppaacctt ssccoorree 22001122 22001133 22001144 22001155 22001166
HH11 22001177
UUnnwweeiigghhtteedd bbaassee:: 2200,,005555 2200,,003366 2200,,005555 2200,,004466 1188,,000000 99,,000077
Legislation, regulation and red tape 13% 13% 12% 11% 10% 14%
The current economic climate 34% 27% 17% 13% 12% 12%
Political uncertainty/future govt policy - - - 10% 10% 14%
Changes in sterling - - - - - 10%
Cash flow/issues with late payment 13% 11% 9% 9% 7% 8%
Recruiting/retaining staff 3% 3% 5% 6% 6% 6%
Availability of relevant advice 6% 6% 5% 5% 4% 4%
Access to external finance 11% 10% 7% 6% 5% 4%
Q227a All SMEs
This shows the marked decline in the proportion of SMEs citing the current economic climate as a barrier, such that it is now no more of a barrier than legislation and regulation or political uncertainty, where scores have remained more stable (albeit with an increase in H1 2017).
The 2016 data was gathered during and immediately after the EU referendum campaign and the 2017 data during a General Election campaign, both of which may affect perceptions about the future. The table below shows the changes since 2015 for two key barriers, the economic climate and political uncertainty, by size of SME. Analysis for those engaged in international trade is provided at the end of this chapter.

264
www.bdrc-continental.com
Political uncertainty is now more of a barrier than it was in 2015, and across all size bands. Scores “peaked” around Q4 2016-Q1 2017 and were little changed in Q2 2017, with the exception of those with 50-249 employees:
Political uncertainty and future govt policy
88--1100 iimmppaacctt ssccoorree RRooww ppeerrcceennttaaggeess 22001155
QQ11 22001166
QQ22 22001166
QQ33 22001166
QQ44 22001166
QQ11 22001177
QQ22 22001177
AAllll SSMMEEss 99%% 1100%% 1100%% 1100%% 1122%% 1144%% 1133%%
0 employees 9% 9% 9% 9% 11% 13% 12%
1-9 employees 12% 12% 14% 12% 17% 16% 16%
10-49 employees 9% 10% 12% 11% 15% 14% 14%
50-249 employees 7% 10% 16% 15% 15% 14% 19%
Q227a All SMEs
The current economic climate is as much of a barrier now as it was in 2015, overall and for SMEs with up to 10 employees. Larger SMEs are now more concerned about the economic climate than they were in 2015, but the scores did not increase in Q2 2017 itself:
The current economic climate
88--1100 iimmppaacctt ssccoorree RRooww ppeerrcceennttaaggeess 22001155
QQ11 22001166
QQ22 22001166
QQ33 22001166
QQ44 22001166
QQ11 22001177
QQ22 22001177
AAllll SSMMEEss 1133%% 1133%% 1133%% 1100%% 1133%% 1111%% 1133%%
0 employees 12% 12% 13% 9% 13% 11% 12%
1-9 employees 14% 14% 14% 14% 16% 13% 14%
10-49 employees 10% 11% 13% 10% 14% 14% 14%
50-249 employees 8% 12% 14% 13% 13% 17% 15%
Q227a All SMEs
Access to finance is the key theme of this report but an issue that has been less likely to be rated a barrier by SMEs over time. The table below shows these changes over recent quarters by key demographics. Access to finance remains more of a barrier for those with a future appetite for finance, but the proportion of such SMEs citing it as a barrier has changed little in recent quarters.

265
www.bdrc-continental.com
Access to finance – 8-10 impact scores
OOvveerr ttiimmee –– rrooww ppeerrcceennttaaggeess BByy ddaattee ooff iinntteerrvviieeww
QQ22 1155
QQ33 1155
QQ44 1155
QQ11 1166
QQ22 1166
QQ33 1166
QQ44 1166
QQ11 1177
QQ22 1177
AAllll SSMMEEss 55%% 66%% 66%% 55%% 55%% 44%% 55%% 44%% 44%%
0 employee 4% 5% 5% 5% 5% 4% 4% 4% 4%
1-9 employees 6% 8% 8% 6% 6% 5% 7% 5% 5%
10-49 employees 4% 6% 5% 5% 4% 3% 5% 5% 4%
50-249 employees 3% 2% 2% 2% 2% 3% 4% 4% 1%
Minimal external risk rating 5% 3% 3% 2% 2% 6% 2% 1% 3%
Low external risk rating 2% 5% 3% 3% 4% 2% 4% 4% 4%
Average external risk rating 4% 5% 5% 5% 3% 5% 4% 4% 2%
Worse than average external risk rating
5% 6% 8% 5% 8% 5% 6% 4% 5%
Agriculture 5% 4% 6% 5% 4% 8% 1% 4% 3%
Manufacturing 4% 4% 6% 6% 5% 3% 2% 4% 4%
Construction 3% 5% 5% 3% 5% 3% 4% 5% 3%
Wholesale/Retail 6% 9% 5% 4% 7% 3% 4% 6% 6%
Hotels & Restaurants 6% 8% 10%
9% 6% 8% 9% 8% 8%
Transport 5% 7% 9% 9% 8% 5% 4% 4% 5%
Property/Business Services etc. 5% 6% 6% 4% 3% 3% 6% 3% 3%
Health 2% 3% 5% 4% 7% 5% 5% 1% 5%
Other Community 6% 5% 4% 4% 4% 6% 6% 3% 3%
Use external finance 7% 8% 8% 7% 6% 4% 6% 7% 7%
Plan to borrow/FWBS 13% 13% 14%
14% 13%
11% 13% 13%
14%
Future Happy non-seekers 2% 3% 3% 2% 2% 2% 2% 2% 1%
All SMEs excluding PNBs 8% 9% 9% 8% 8% 7% 7% 6% 7%
Q227a_2 All SMEs, base sizes vary
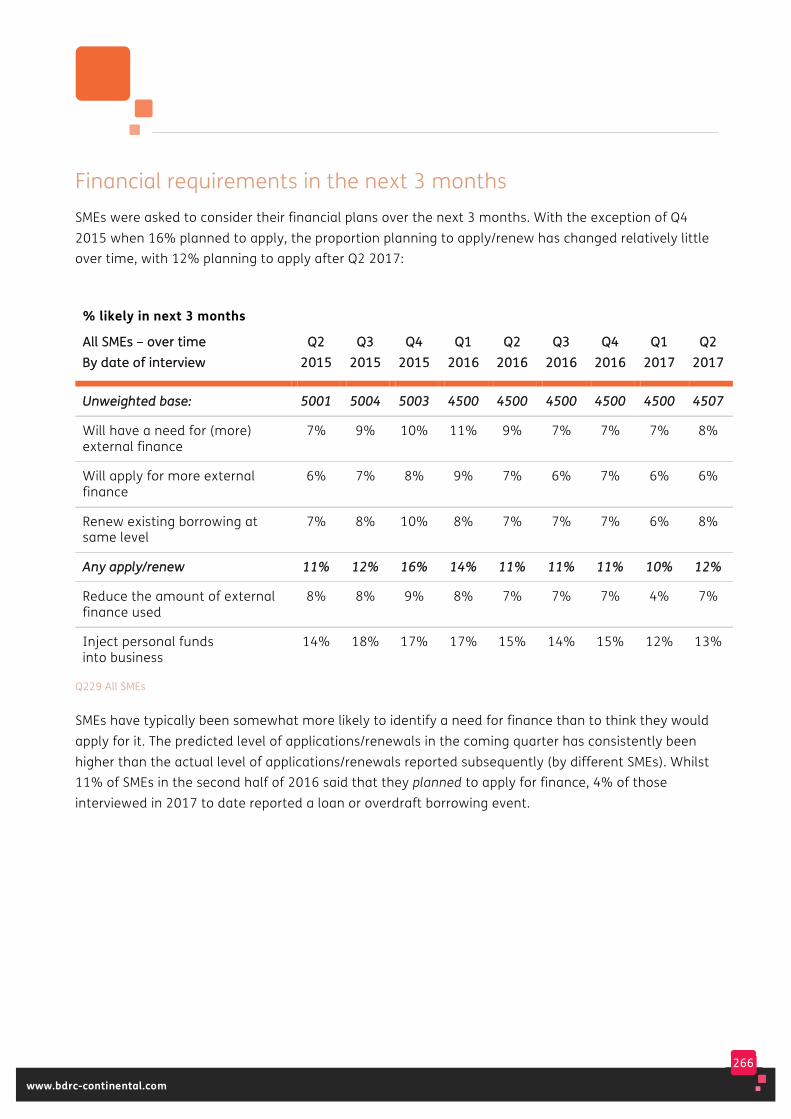
266
www.bdrc-continental.com
Financial requirements in the next 3 months SMEs were asked to consider their financial plans over the next 3 months. With the exception of Q4 2015 when 16% planned to apply, the proportion planning to apply/renew has changed relatively little over time, with 12% planning to apply after Q2 2017:
% likely in next 3 months
AAllll SSMMEEss –– oovveerr ttiimmee BByy ddaattee ooff iinntteerrvviieeww
QQ22 22001155
QQ33 22001155
QQ44 22001155
QQ11 22001166
QQ22 22001166
QQ33 22001166
QQ44 22001166
QQ11 22001177
QQ22 22001177
UUnnwweeiigghhtteedd bbaassee:: 55000011 55000044 55000033 44550000 44550000 44550000 44550000 44550000 44550077
Will have a need for (more) external finance
7% 9% 10% 11% 9% 7% 7% 7% 8%
Will apply for more external finance
6% 7% 8% 9% 7% 6% 7% 6% 6%
Renew existing borrowing at same level
7% 8% 10% 8% 7% 7% 7% 6% 8%
AAnnyy aappppllyy//rreenneeww 1111%% 1122%% 1166%% 1144%% 1111%% 1111%% 1111%% 1100%% 1122%%
Reduce the amount of external finance used
8% 8% 9% 8% 7% 7% 7% 4% 7%
Inject personal funds into business
14% 18% 17% 17% 15% 14% 15% 12% 13%
Q229 All SMEs
SMEs have typically been somewhat more likely to identify a need for finance than to think they would apply for it. The predicted level of applications/renewals in the coming quarter has consistently been higher than the actual level of applications/renewals reported subsequently (by different SMEs). Whilst 11% of SMEs in the second half of 2016 said that they planned to apply for finance, 4% of those interviewed in 2017 to date reported a loan or overdraft borrowing event.
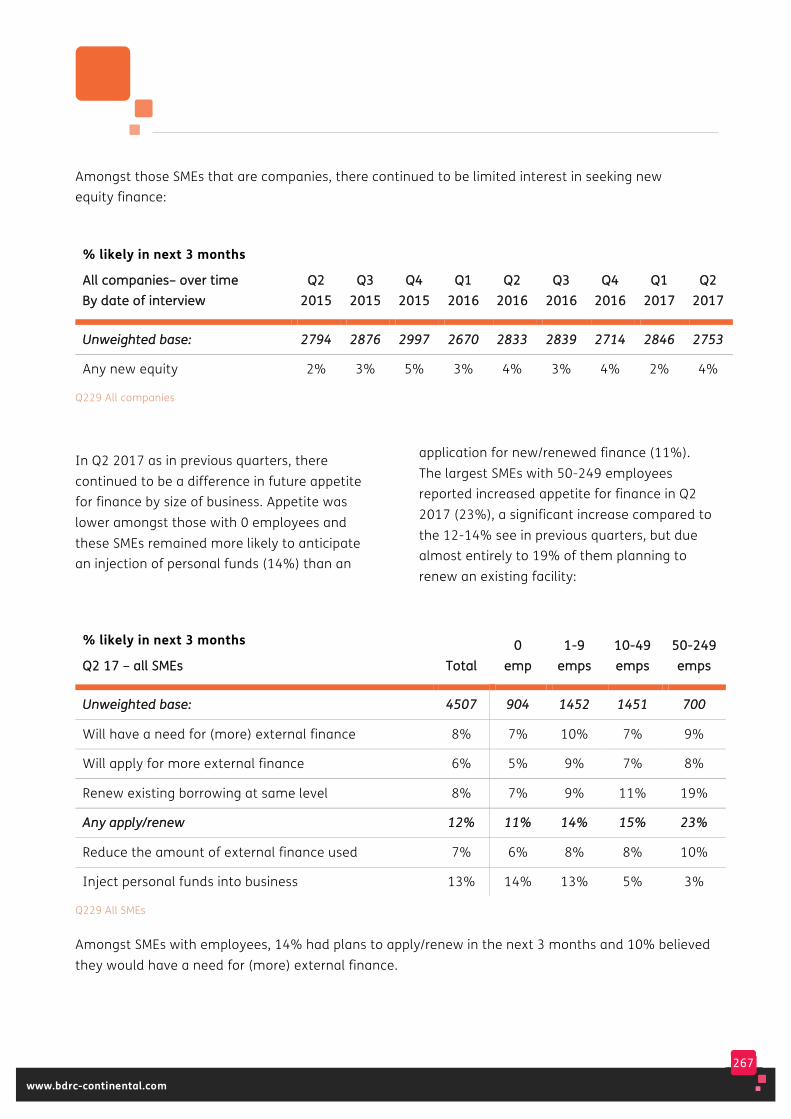
267
www.bdrc-continental.com
Amongst those SMEs that are companies, there continued to be limited interest in seeking new equity finance:
% likely in next 3 months
AAllll ccoommppaanniieess–– oovveerr ttiimmee BByy ddaattee ooff iinntteerrvviieeww
QQ22 22001155
QQ33 22001155
QQ44 22001155
QQ11 22001166
QQ22 22001166
QQ33 22001166
QQ44 22001166
QQ11 22001177
QQ22 22001177
UUnnwweeiigghhtteedd bbaassee:: 22779944 22887766 22999977 22667700 22883333 22883399 22771144 22884466 22775533
Any new equity 2% 3% 5% 3% 4% 3% 4% 2% 4%
Q229 All companies
In Q2 2017 as in previous quarters, there continued to be a difference in future appetite for finance by size of business. Appetite was lower amongst those with 0 employees and these SMEs remained more likely to anticipate an injection of personal funds (14%) than an
application for new/renewed finance (11%). The largest SMEs with 50-249 employees reported increased appetite for finance in Q2 2017 (23%), a significant increase compared to the 12-14% see in previous quarters, but due almost entirely to 19% of them planning to renew an existing facility:
% likely in next 3 months
QQ22 1177 –– aallll SSMMEEss TToottaall 00
eemmpp 11--99
eemmppss 1100--4499 eemmppss
5500--224499 eemmppss
UUnnwweeiigghhtteedd bbaassee:: 44550077 990044 11445522 11445511 770000
Will have a need for (more) external finance 8% 7% 10% 7% 9%
Will apply for more external finance 6% 5% 9% 7% 8%
Renew existing borrowing at same level 8% 7% 9% 11% 19%
AAnnyy aappppllyy//rreenneeww 1122%% 1111%% 1144%% 1155%% 2233%%
Reduce the amount of external finance used 7% 6% 8% 8% 10%
Inject personal funds into business 13% 14% 13% 5% 3%
Q229 All SMEs
Amongst SMEs with employees, 14% had plans to apply/renew in the next 3 months and 10% believed they would have a need for (more) external finance.
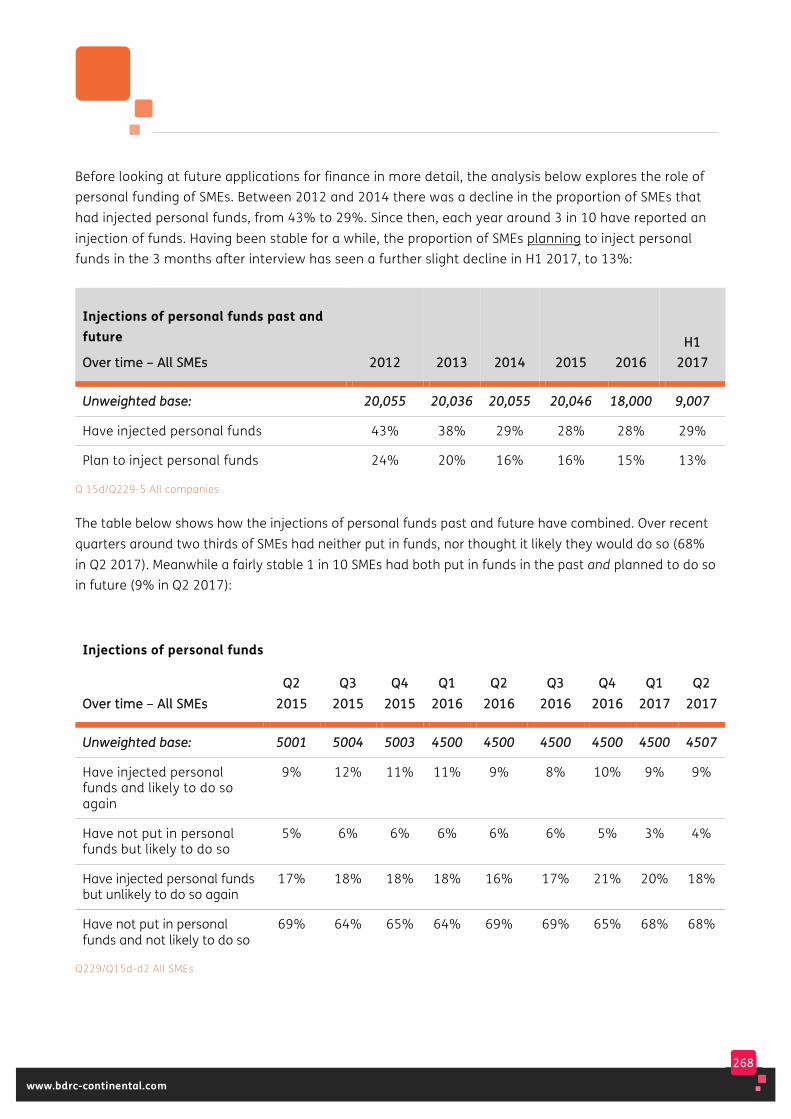
268
www.bdrc-continental.com
Before looking at future applications for finance in more detail, the analysis below explores the role of personal funding of SMEs. Between 2012 and 2014 there was a decline in the proportion of SMEs that had injected personal funds, from 43% to 29%. Since then, each year around 3 in 10 have reported an injection of funds. Having been stable for a while, the proportion of SMEs planning to inject personal funds in the 3 months after interview has seen a further slight decline in H1 2017, to 13%:
Injections of personal funds past and future
OOvveerr ttiimmee –– AAllll SSMMEEss 22001122 22001133 22001144 22001155 22001166 HH11
22001177
UUnnwweeiigghhtteedd bbaassee:: 2200,,005555 2200,,003366 2200,,005555 2200,,004466 1188,,000000 99,,000077
Have injected personal funds 43% 38% 29% 28% 28% 29%
Plan to inject personal funds 24% 20% 16% 16% 15% 13%
Q 15d/Q229-5 All companies
The table below shows how the injections of personal funds past and future have combined. Over recent quarters around two thirds of SMEs had neither put in funds, nor thought it likely they would do so (68% in Q2 2017). Meanwhile a fairly stable 1 in 10 SMEs had both put in funds in the past and planned to do so in future (9% in Q2 2017):
Injections of personal funds
OOvveerr ttiimmee –– AAllll SSMMEEss
QQ22 22001155
QQ33 22001155
QQ44 22001155
QQ11 22001166
QQ22 22001166
QQ33 22001166
QQ44 22001166
QQ11 22001177
QQ22 22001177
UUnnwweeiigghhtteedd bbaassee:: 55000011 55000044 55000033 44550000 44550000 44550000 44550000 44550000 44550077
Have injected personal funds and likely to do so again
9% 12% 11% 11% 9% 8% 10% 9% 9%
Have not put in personal funds but likely to do so
5% 6% 6% 6% 6% 6% 5% 3% 4%
Have injected personal funds but unlikely to do so again
17% 18% 18% 18% 16% 17% 21% 20% 18%
Have not put in personal funds and not likely to do so
69% 64% 65% 64% 69% 69% 65% 68% 68%
Q229/Q15d-d2 All SMEs
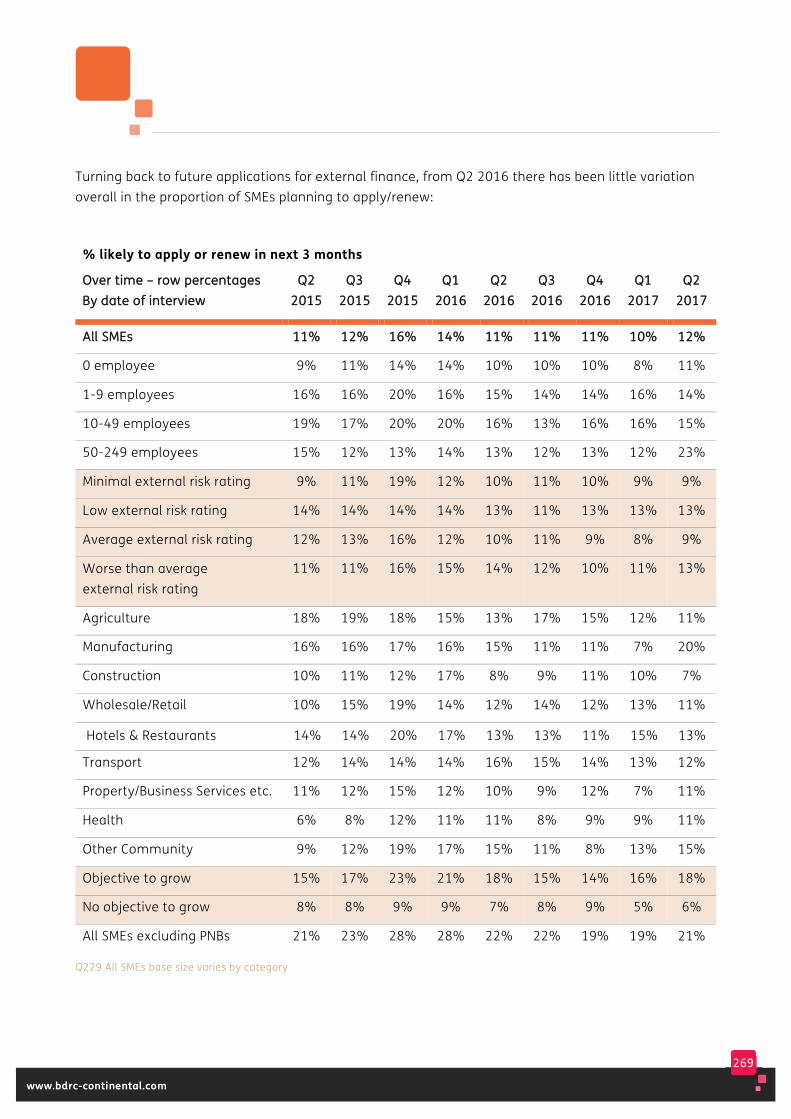
269
www.bdrc-continental.com
Turning back to future applications for external finance, from Q2 2016 there has been little variation overall in the proportion of SMEs planning to apply/renew:
% likely to apply or renew in next 3 months
OOvveerr ttiimmee –– rrooww ppeerrcceennttaaggeess BByy ddaattee ooff iinntteerrvviieeww
QQ22 22001155
QQ33 22001155
QQ44 22001155
QQ11 22001166
QQ22 22001166
QQ33 22001166
QQ44 22001166
QQ11 22001177
QQ22 22001177
AAllll SSMMEEss 1111%% 1122%% 1166%% 1144%% 1111%% 1111%% 1111%% 1100%% 1122%%
0 employee 9% 11% 14% 14% 10% 10% 10% 8% 11%
1-9 employees 16% 16% 20% 16% 15% 14% 14% 16% 14%
10-49 employees 19% 17% 20% 20% 16% 13% 16% 16% 15%
50-249 employees 15% 12% 13% 14% 13% 12% 13% 12% 23%
Minimal external risk rating 9% 11% 19% 12% 10% 11% 10% 9% 9%
Low external risk rating 14% 14% 14% 14% 13% 11% 13% 13% 13%
Average external risk rating 12% 13% 16% 12% 10% 11% 9% 8% 9%
Worse than average external risk rating
11% 11% 16% 15% 14% 12% 10% 11% 13%
Agriculture 18% 19% 18% 15% 13% 17% 15% 12% 11%
Manufacturing 16% 16% 17% 16% 15% 11% 11% 7% 20%
Construction 10% 11% 12% 17% 8% 9% 11% 10% 7%
Wholesale/Retail 10% 15% 19% 14% 12% 14% 12% 13% 11%
Hotels & Restaurants 14% 14% 20% 17% 13% 13% 11% 15% 13%
Transport 12% 14% 14% 14% 16% 15% 14% 13% 12%
Property/Business Services etc. 11% 12% 15% 12% 10% 9% 12% 7% 11%
Health 6% 8% 12% 11% 11% 8% 9% 9% 11%
Other Community 9% 12% 19% 17% 15% 11% 8% 13% 15%
Objective to grow 15% 17% 23% 21% 18% 15% 14% 16% 18%
No objective to grow 8% 8% 9% 9% 7% 8% 9% 5% 6%
All SMEs excluding PNBs 21% 23% 28% 28% 22% 22% 19% 19% 21%
Q229 All SMEs base size varies by category
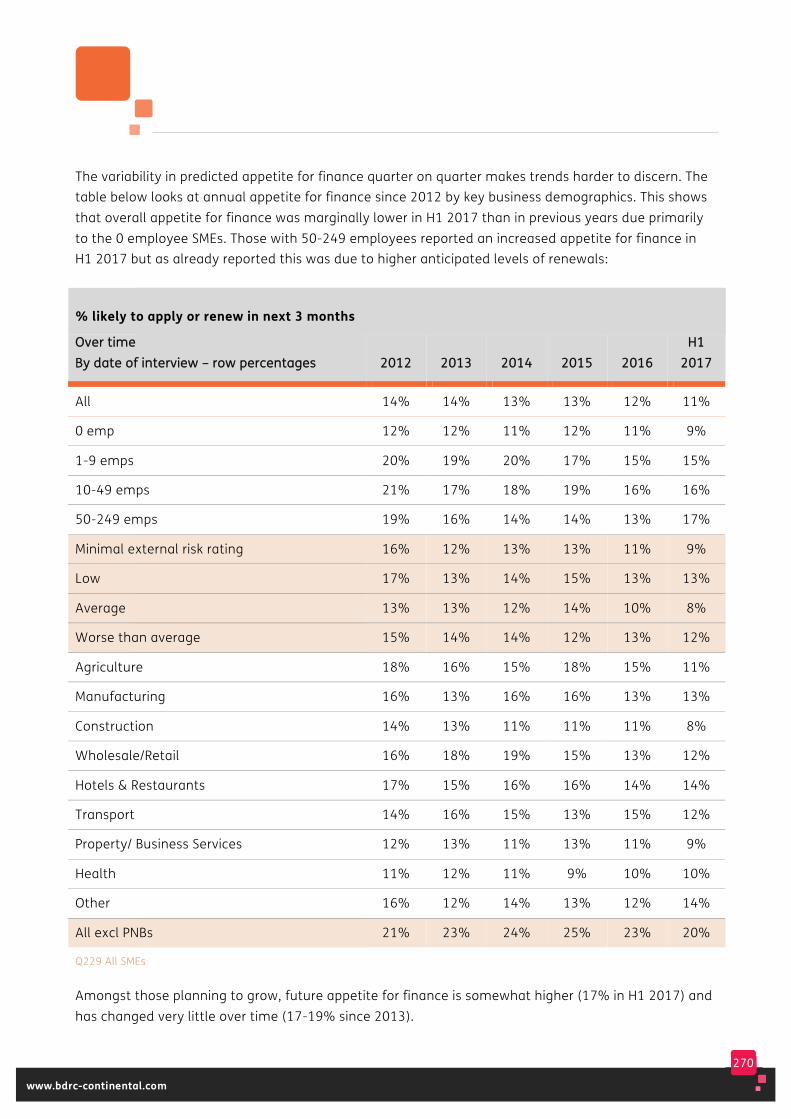
270
www.bdrc-continental.com
The variability in predicted appetite for finance quarter on quarter makes trends harder to discern. The table below looks at annual appetite for finance since 2012 by key business demographics. This shows that overall appetite for finance was marginally lower in H1 2017 than in previous years due primarily to the 0 employee SMEs. Those with 50-249 employees reported an increased appetite for finance in H1 2017 but as already reported this was due to higher anticipated levels of renewals:
% likely to apply or renew in next 3 months
OOvveerr ttiimmee BByy ddaattee ooff iinntteerrvviieeww –– rrooww ppeerrcceennttaaggeess 22001122 22001133 22001144 22001155
22001166
HH11 22001177
All 14% 14% 13% 13% 12% 11%
0 emp 12% 12% 11% 12% 11% 9%
1-9 emps 20% 19% 20% 17% 15% 15%
10-49 emps 21% 17% 18% 19% 16% 16%
50-249 emps 19% 16% 14% 14% 13% 17%
Minimal external risk rating 16% 12% 13% 13% 11% 9%
Low 17% 13% 14% 15% 13% 13%
Average 13% 13% 12% 14% 10% 8%
Worse than average 15% 14% 14% 12% 13% 12%
Agriculture 18% 16% 15% 18% 15% 11%
Manufacturing 16% 13% 16% 16% 13% 13%
Construction 14% 13% 11% 11% 11% 8%
Wholesale/Retail 16% 18% 19% 15% 13% 12%
Hotels & Restaurants 17% 15% 16% 16% 14% 14%
Transport 14% 16% 15% 13% 15% 12%
Property/ Business Services 12% 13% 11% 13% 11% 9%
Health 11% 12% 11% 9% 10% 10%
Other 16% 12% 14% 13% 12% 14%
All excl PNBs 21% 23% 24% 25% 23% 20%
Q229 All SMEs
Amongst those planning to grow, future appetite for finance is somewhat higher (17% in H1 2017) and has changed very little over time (17-19% since 2013).
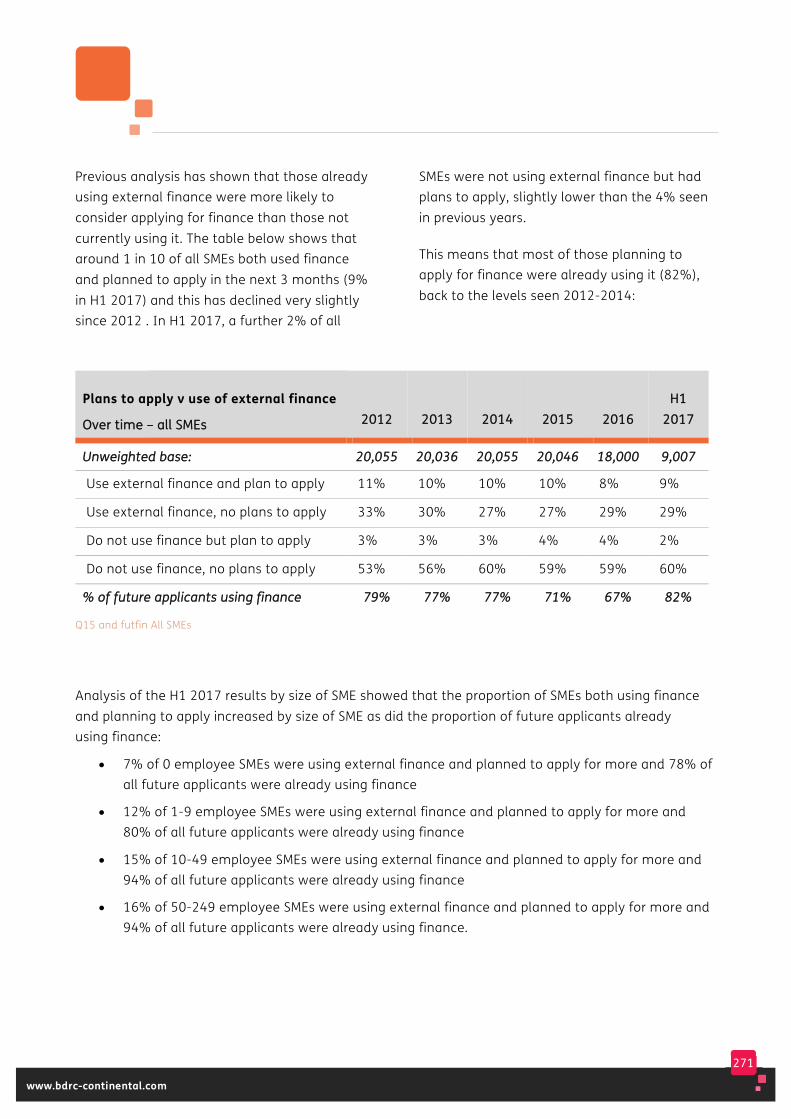
271
www.bdrc-continental.com
Previous analysis has shown that those already using external finance were more likely to consider applying for finance than those not currently using it. The table below shows that around 1 in 10 of all SMEs both used finance and planned to apply in the next 3 months (9% in H1 2017) and this has declined very slightly since 2012 . In H1 2017, a further 2% of all
SMEs were not using external finance but had plans to apply, slightly lower than the 4% seen in previous years.
This means that most of those planning to apply for finance were already using it (82%), back to the levels seen 2012-2014:
Plans to apply v use of external finance
OOvveerr ttiimmee –– aallll SSMMEEss 22001122 22001133 22001144 22001155
22001166 HH11
22001177
UUnnwweeiigghhtteedd bbaassee:: 2200,,005555 2200,,003366 2200,,005555 2200,,004466 1188,,000000 99,,000077
Use external finance and plan to apply 11% 10% 10% 10% 8% 9%
Use external finance, no plans to apply 33% 30% 27% 27% 29% 29%
Do not use finance but plan to apply 3% 3% 3% 4% 4% 2%
Do not use finance, no plans to apply 53% 56% 60% 59% 59% 60%
%% ooff ffuuttuurree aapppplliiccaannttss uussiinngg ffiinnaannccee 7799%% 7777%% 7777%% 7711%% 6677%% 8822%%
Q15 and futfin All SMEs
Analysis of the H1 2017 results by size of SME showed that the proportion of SMEs both using finance and planning to apply increased by size of SME as did the proportion of future applicants already using finance:
• 7% of 0 employee SMEs were using external finance and planned to apply for more and 78% of all future applicants were already using finance
• 12% of 1-9 employee SMEs were using external finance and planned to apply for more and 80% of all future applicants were already using finance
• 15% of 10-49 employee SMEs were using external finance and planned to apply for more and 94% of all future applicants were already using finance
• 16% of 50-249 employee SMEs were using external finance and planned to apply for more and 94% of all future applicants were already using finance.
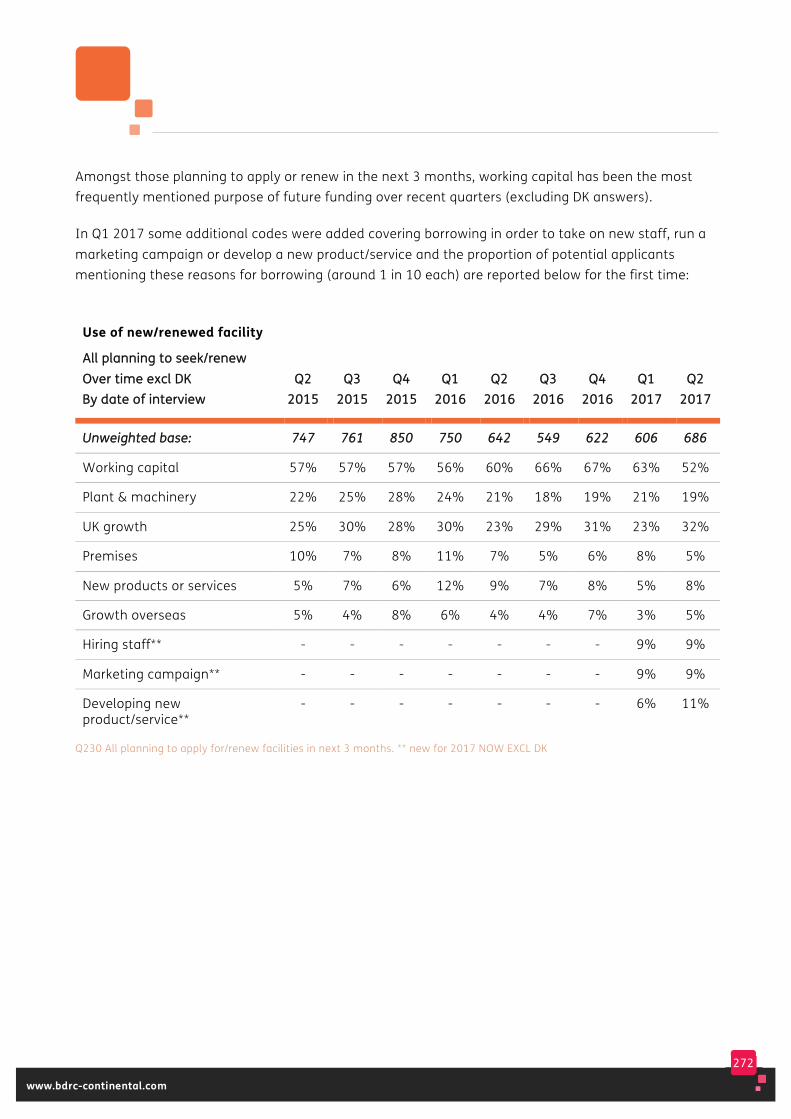
272
www.bdrc-continental.com
Amongst those planning to apply or renew in the next 3 months, working capital has been the most frequently mentioned purpose of future funding over recent quarters (excluding DK answers).
In Q1 2017 some additional codes were added covering borrowing in order to take on new staff, run a marketing campaign or develop a new product/service and the proportion of potential applicants mentioning these reasons for borrowing (around 1 in 10 each) are reported below for the first time:
Use of new/renewed facility
AAllll ppllaannnniinngg ttoo sseeeekk//rreenneeww OOvveerr ttiimmee eexxccll DDKK BByy ddaattee ooff iinntteerrvviieeww
QQ22 22001155
QQ33 22001155
QQ44 22001155
QQ11 22001166
QQ22 22001166
QQ33 22001166
QQ44 22001166
QQ11 22001177
QQ22 22001177
UUnnwweeiigghhtteedd bbaassee:: 774477 776611 885500 775500 664422 554499 662222 660066 668866
Working capital 57% 57% 57% 56% 60% 66% 67% 63% 52%
Plant & machinery 22% 25% 28% 24% 21% 18% 19% 21% 19%
UK growth 25% 30% 28% 30% 23% 29% 31% 23% 32%
Premises 10% 7% 8% 11% 7% 5% 6% 8% 5%
New products or services 5% 7% 6% 12% 9% 7% 8% 5% 8%
Growth overseas 5% 4% 8% 6% 4% 4% 7% 3% 5%
Hiring staff** - - - - - - - 9% 9%
Marketing campaign** - - - - - - - 9% 9%
Developing new product/service**
- - - - - - - 6% 11%
Q230 All planning to apply for/renew facilities in next 3 months. ** new for 2017 NOW EXCL DK
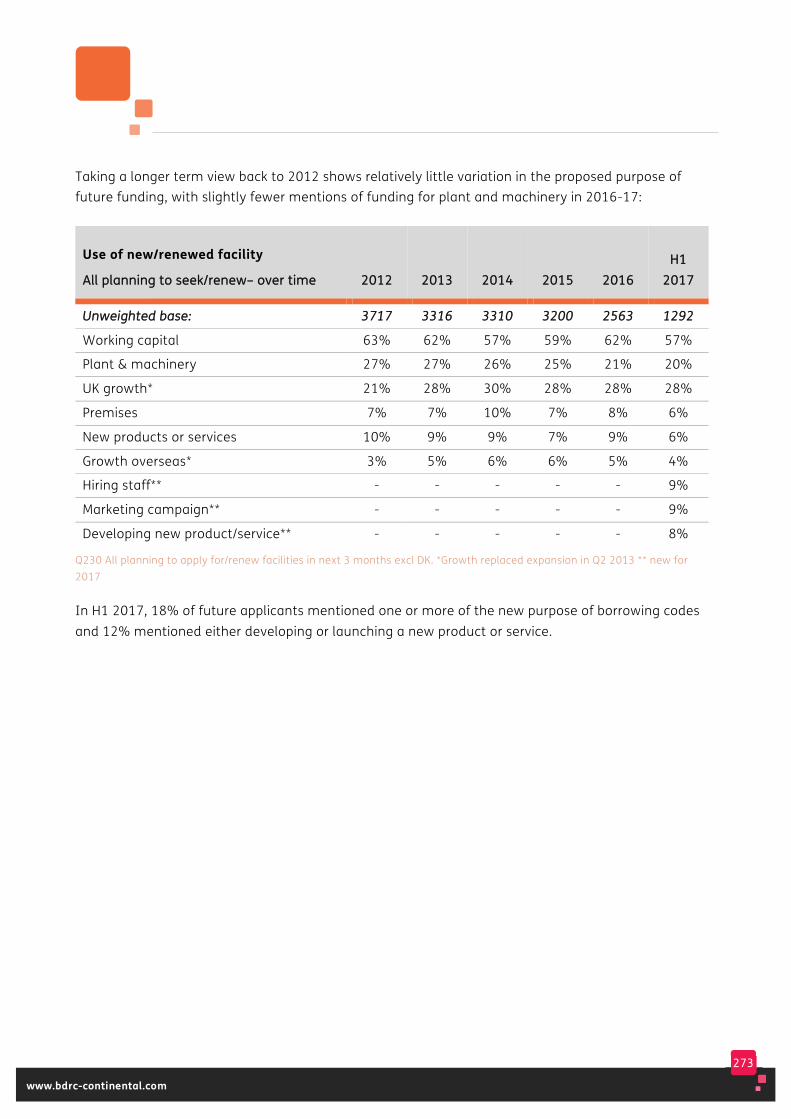
273
www.bdrc-continental.com
Taking a longer term view back to 2012 shows relatively little variation in the proposed purpose of future funding, with slightly fewer mentions of funding for plant and machinery in 2016-17:
Use of new/renewed facility
AAllll ppllaannnniinngg ttoo sseeeekk//rreenneeww–– oovveerr ttiimmee 22001122 22001133 22001144 22001155
22001166 HH11
22001177
UUnnwweeiigghhtteedd bbaassee:: 33771177 33331166 33331100 33220000 22556633 11229922
Working capital 63% 62% 57% 59% 62% 57%
Plant & machinery 27% 27% 26% 25% 21% 20%
UK growth* 21% 28% 30% 28% 28% 28%
Premises 7% 7% 10% 7% 8% 6%
New products or services 10% 9% 9% 7% 9% 6%
Growth overseas* 3% 5% 6% 6% 5% 4%
Hiring staff** - - - - - 9%
Marketing campaign** - - - - - 9%
Developing new product/service** - - - - - 8%
Q230 All planning to apply for/renew facilities in next 3 months excl DK. *Growth replaced expansion in Q2 2013 ** new for 2017
In H1 2017, 18% of future applicants mentioned one or more of the new purpose of borrowing codes and 12% mentioned either developing or launching a new product or service.

274
www.bdrc-continental.com
The table below details what types of finance those planning to apply would consider for their new/renewed funding. From Q1 2016 data has been collected at a headline level rather than for each possible type of finance.
Consideration over time of any of the core lending products (overdrafts, loans and/or
credit cards) and/or other forms of borrowing, is shown below for those planning to apply, using the new summary categories introduced from Q1 2016. It shows consideration of core finance increasing slightly in recent quarters (to 61% in Q2 2017) after previous declines:
% of those seeking/renewing finance that would consider form of funding
OOvveerr ttiimmee BByy ddaattee ooff iinntteerrvviieeww
QQ33 22001155
QQ44 22001155
QQ11 22001166
QQ22 22001166
QQ33 22001166
QQ44 22001166
QQ11 22001177
QQ22 22001177
UUnnwweeiigghhtteedd bbaassee:: 777766 889911 777711 667722 555544 663399 661166 669988
Core product (loan, O/D, credit card) 61% 57% 52% 52% 47% 55% 55% 61%
Commercial mortgage 9% 10% 18% 16% 14% 16% 13% 12%
Leasing/invoice finance 28% 29% 23% 16% 15% 16% 18% 15%
Other 49% 49% 30% 22% 21% 26% 22% 19%
NNoonnee ooff tthheessee 2255%% 2288%% 3333%% 4411%% 4455%% 3322%% 3344%% 3322%%
Q233 All SMEs seeking new/renewing finance in next 3 months
In all quarters consideration has been highest for the core products. In Q2 2017, 61% of future applicants were considering a core form of finance, compared to 19% considering any of the other forms of finance.
The proportion saying ‘none of these’ had been stable at around 1 in 4 but was higher after the new format question was introduced at the start of 2016 (37% for 2016 as a whole). Early indications for 2017 are that the proportion has stabilised at around a third of future applicants.
These undecided potential applicants were asked whether this was because they had not decided what they might use or because they were considering another form of finance not listed. In H1 2017, 67% said that they had not decided, while 33% were considering another form of finance, up from 20% in 2015.
Amongst all potential applicants in H1 2017, 67% were considering one or more of the forms of finance listed, 11% were considering another form of finance and 22% hadn’t yet decided what they might use.

275
www.bdrc-continental.com
The table below shows levels of consideration in Q2 2017 by the size of SME considering funding.
% of those seeking/renewing finance would consider funding
QQ22 1177 TToottaall 00
eemmpp 11--99
eemmppss 1100--4499 eemmppss
5500--224499 eemmppss
UUnnwweeiigghhtteedd bbaassee:: 669988 9944** 220066 223311 116677
Core product (loan, od, credit card) 61% 66% 51% 47% 65%
Commercial mortgage 12% 9% 18% 14% 20%
Leasing/invoice finance 15% 15% 16% 15% 20%
Other 19% 17% 26% 13% 7%
NNoonnee ooff tthheessee 3322%% 3311%% 3355%% 3388%% 2299%%
Q233 All SMEs seeking new/renewing finance in next 3 months
The balance between consideration of core and other forms of funding changes by size of SME. Core finance is the most likely source of funding to be considered in all size bands, but larger SMEs are more likely to also consider commercial mortgages and leasing/invoice finance.
Amongst SMEs with employees, 51% would consider one or more core products for their future lending, 17% a commercial mortgage, 16% leasing or invoice finance and 23% some other form of funding. 36% said they would not consider any of these.

276
www.bdrc-continental.com
Application confidence
Those planning to apply via loan, overdraft, leasing, invoice finance and/or credit cards were asked how confident they were that their bank would agree to their request (note that this excludes those planning to apply who were either only considering one of the other forms of finance specified or who did not nominate any form of finance).
In Q1 2017, 49% of prospective applicants were confident of success, the lowest level recorded since Q1 2016. In Q2 2017, confidence was slightly higher (55%) and also in line with the equivalent quarter of 2016:
Confidence bank would lend
AAllll ppllaannnniinngg ttoo sseeeekk ffiinnaannccee OOvveerr ttiimmee bbyy ddaattee ooff iinntteerrvviieeww
QQ22 1155
QQ33 1155
QQ44 1155
QQ11 1166
QQ22 1166
QQ33 1166
QQ44 1166
QQ11 1177
QQ22 1177
UUnnwweeiigghhtteedd bbaassee:: 449944 552222 558866 443333 337777 229955 336622 338899 443377
Very confident 25% 28% 21% 23% 22% 23% 22% 17% 14%
Fairly confident 24% 32% 31% 25% 31% 38% 37% 32% 41%
OOvveerraallll ccoonnffiiddeennccee 4499%% 6600%% 5522%% 4488%% 5533%% 6611%% 5599%% 4499%% 5555%%
Neither/nor 22% 17% 24% 33% 22% 20% 22% 22% 21%
Not confident 28% 23% 24% 19% 25% 19% 19% 28% 23%
NNeett ccoonnffiiddeennccee ((ccoonnffiiddeenntt –– nnoott ccoonnffiiddeenntt))
++2211 ++3377 ++2288 ++2299 ++2266 ++4422 ++4400 ++2211 ++3322
Q238 All SMEs seeking new/renewing finance in next 3 months
Confidence amongst prospective applicants with employees was 59% in Q2 2017.
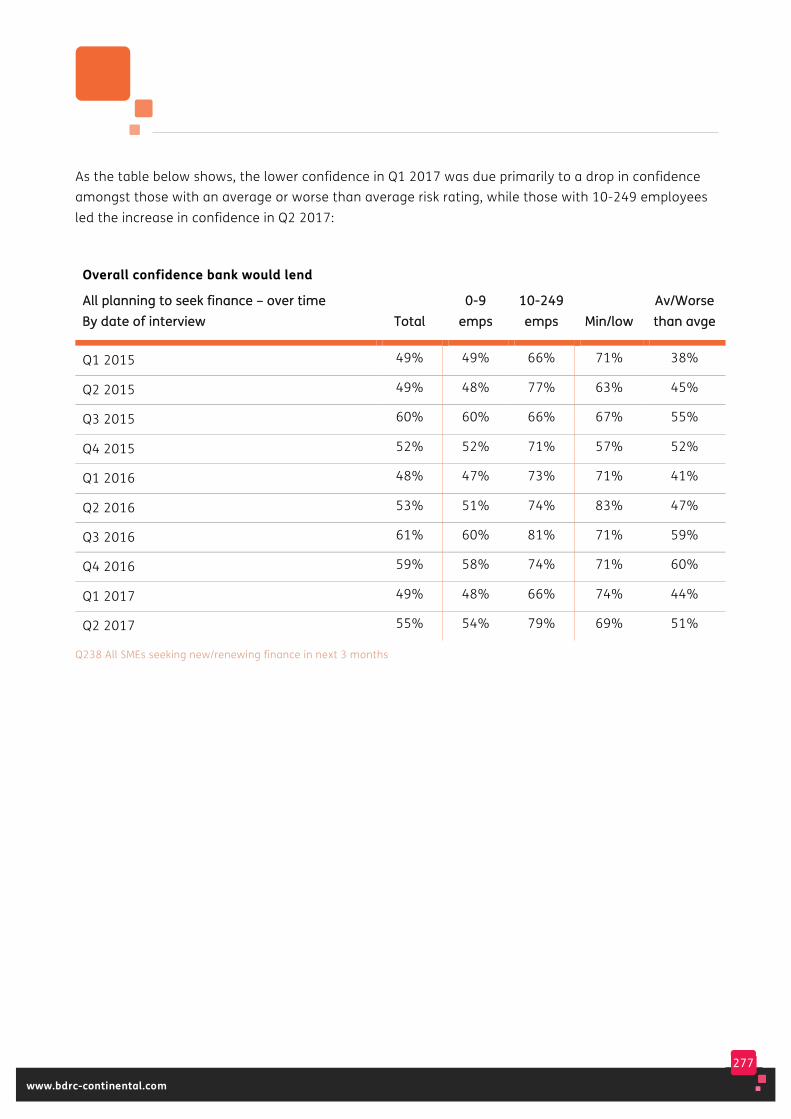
277
www.bdrc-continental.com
As the table below shows, the lower confidence in Q1 2017 was due primarily to a drop in confidence amongst those with an average or worse than average risk rating, while those with 10-249 employees led the increase in confidence in Q2 2017:
Overall confidence bank would lend
AAllll ppllaannnniinngg ttoo sseeeekk ffiinnaannccee –– oovveerr ttiimmee BByy ddaattee ooff iinntteerrvviieeww TToottaall
00--99 eemmppss
1100--224499 eemmppss MMiinn//llooww
AAvv//WWoorrssee tthhaann aavvggee
Q1 2015 49% 49% 66% 71% 38%
Q2 2015 49% 48% 77% 63% 45%
Q3 2015 60% 60% 66% 67% 55%
Q4 2015 52% 52% 71% 57% 52%
Q1 2016 48% 47% 73% 71% 41%
Q2 2016 53% 51% 74% 83% 47%
Q3 2016 61% 60% 81% 71% 59%
Q4 2016 59% 58% 74% 71% 60%
Q1 2017 49% 48% 66% 74% 44%
Q2 2017 55% 54% 79% 69% 51%
Q238 All SMEs seeking new/renewing finance in next 3 months
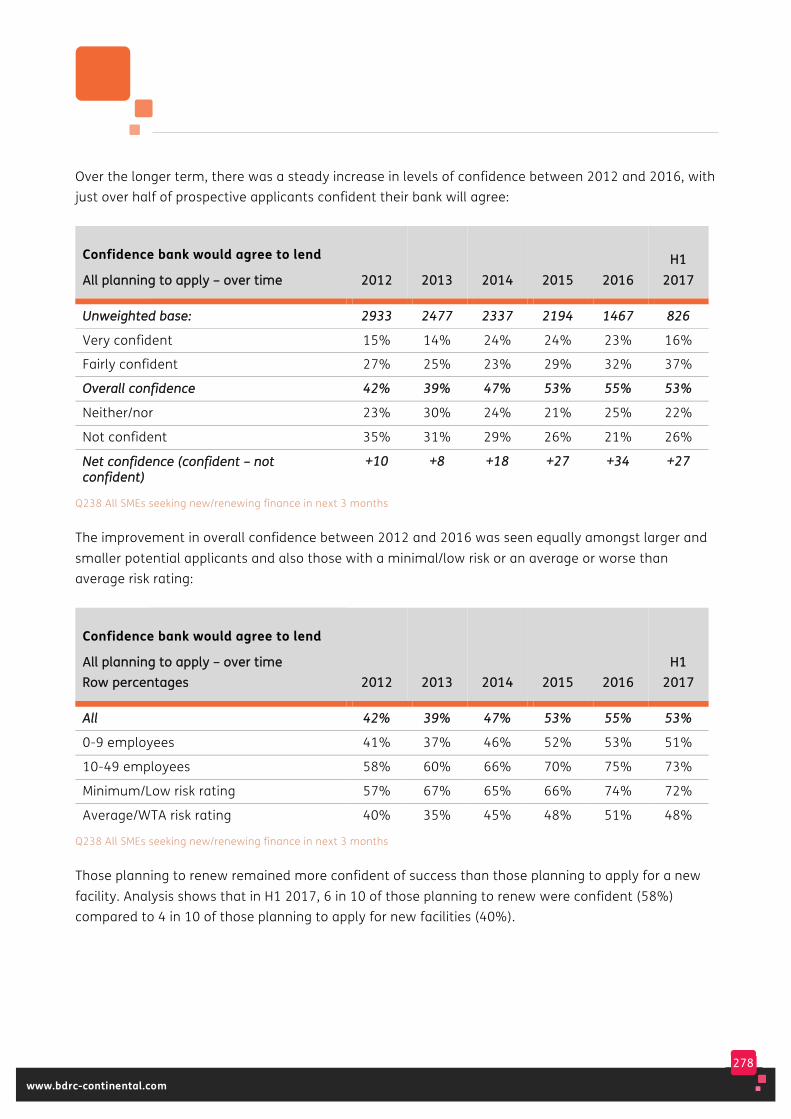
278
www.bdrc-continental.com
Over the longer term, there was a steady increase in levels of confidence between 2012 and 2016, with just over half of prospective applicants confident their bank will agree:
Confidence bank would agree to lend
AAllll ppllaannnniinngg ttoo aappppllyy –– oovveerr ttiimmee 22001122 22001133 22001144 22001155
22001166 HH11
22001177
UUnnwweeiigghhtteedd bbaassee:: 22993333 22447777 22333377 22119944 11446677 882266
Very confident 15% 14% 24% 24% 23% 16%
Fairly confident 27% 25% 23% 29% 32% 37%
OOvveerraallll ccoonnffiiddeennccee 4422%% 3399%% 4477%% 5533%% 5555%% 5533%%
Neither/nor 23% 30% 24% 21% 25% 22%
Not confident 35% 31% 29% 26% 21% 26%
NNeett ccoonnffiiddeennccee ((ccoonnffiiddeenntt –– nnoott ccoonnffiiddeenntt))
++1100 ++88 ++1188 ++2277 ++3344 ++2277
Q238 All SMEs seeking new/renewing finance in next 3 months
The improvement in overall confidence between 2012 and 2016 was seen equally amongst larger and smaller potential applicants and also those with a minimal/low risk or an average or worse than average risk rating:
Confidence bank would agree to lend
AAllll ppllaannnniinngg ttoo aappppllyy –– oovveerr ttiimmee RRooww ppeerrcceennttaaggeess 22001122 22001133 22001144 22001155
22001166
HH11 22001177
AAllll 4422%% 3399%% 4477%% 5533%% 5555%% 5533%%
0-9 employees 41% 37% 46% 52% 53% 51%
10-49 employees 58% 60% 66% 70% 75% 73%
Minimum/Low risk rating 57% 67% 65% 66% 74% 72%
Average/WTA risk rating 40% 35% 45% 48% 51% 48%
Q238 All SMEs seeking new/renewing finance in next 3 months
Those planning to renew remained more confident of success than those planning to apply for a new facility. Analysis shows that in H1 2017, 6 in 10 of those planning to renew were confident (58%) compared to 4 in 10 of those planning to apply for new facilities (40%).
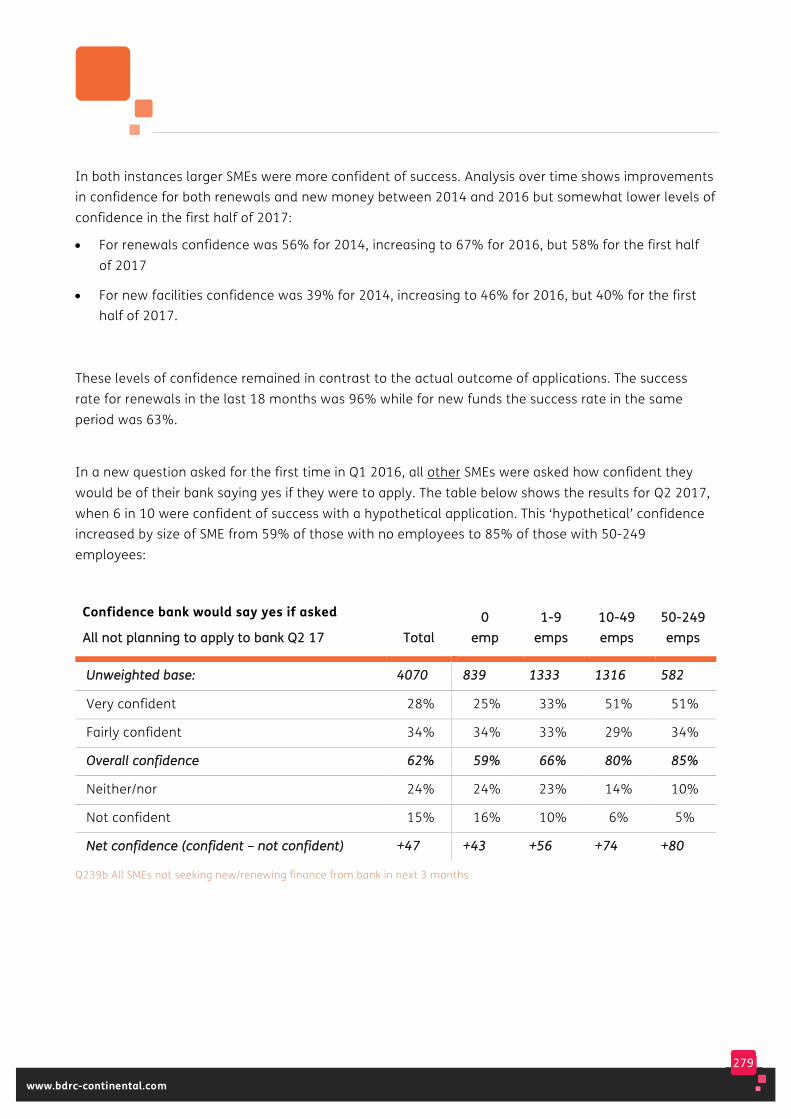
279
www.bdrc-continental.com
In both instances larger SMEs were more confident of success. Analysis over time shows improvements in confidence for both renewals and new money between 2014 and 2016 but somewhat lower levels of confidence in the first half of 2017:
• For renewals confidence was 56% for 2014, increasing to 67% for 2016, but 58% for the first half of 2017
• For new facilities confidence was 39% for 2014, increasing to 46% for 2016, but 40% for the first half of 2017.
These levels of confidence remained in contrast to the actual outcome of applications. The success rate for renewals in the last 18 months was 96% while for new funds the success rate in the same period was 63%.
In a new question asked for the first time in Q1 2016, all other SMEs were asked how confident they would be of their bank saying yes if they were to apply. The table below shows the results for Q2 2017, when 6 in 10 were confident of success with a hypothetical application. This ‘hypothetical’ confidence increased by size of SME from 59% of those with no employees to 85% of those with 50-249 employees:
Confidence bank would say yes if asked
AAllll nnoott ppllaannnniinngg ttoo aappppllyy ttoo bbaannkk QQ22 1177 TToottaall 00
eemmpp 11--99
eemmppss 1100--4499 eemmppss
5500--224499 eemmppss
UUnnwweeiigghhtteedd bbaassee:: 44007700 883399 11333333 11331166 558822
Very confident 28% 25% 33% 51% 51%
Fairly confident 34% 34% 33% 29% 34%
OOvveerraallll ccoonnffiiddeennccee 6622%% 5599%% 6666%% 8800%% 8855%%
Neither/nor 24% 24% 23% 14% 10%
Not confident 15% 16% 10% 6% 5%
NNeett ccoonnffiiddeennccee ((ccoonnffiiddeenntt –– nnoott ccoonnffiiddeenntt)) ++4477 ++4433 ++5566 ++7744 ++8800
Q239b All SMEs not seeking new/renewing finance from bank in next 3 months

280
www.bdrc-continental.com
Included in the table above are those who planned to renew/apply but then did not nominate any bank products (or indeed any products) for consideration. The table below summarises the confidence of all SMEs in Q2 2017, whether they were planning to apply to a bank (55% confident), apply but for another form of finance (50%), not apply because they were a Would-be seeker of finance (37%) or not apply because they were a Future happy non-seeker of finance (65%):
Confidence bank would say yes if asked
QQ22 1177 –– aallll SSMMEEss
AAllll ppllaannnniinngg ttoo aappppllyy ttoo bbaannkk
AAllll ootthheerrss ppllaannnniinngg ttoo
aappppllyy FFuuttuurree WWBBSS
FFuuttuurree HHNNSS
UUnnwweeiigghhtteedd bbaassee:: 443377 226611 333355 33447744
Very confident 14% 22% 11% 30%
Fairly confident 41% 28% 26% 35%
OOvveerraallll ccoonnffiiddeennccee 5555%% 5500%% 3377%% 6655%%
Neither/nor 21% 37% 23% 23%
Not confident 23% 14% 40% 11%
NNeett ccoonnffiiddeennccee ((ccoonnffiiddeenntt –– nnoott ccoonnffiiddeenntt)) ++3322 ++3366 --33 ++5544
Q238/ 239b All SMEs
Those who had no need or plans to apply (the Future happy non-seekers) remained the most confident that if they were to approach their bank they would be successful (65%). Around half of those planning to apply for a non-bank product were confident (in line with those planning to apply for a bank product) while Future would-be seekers of finance were somewhat less confident.
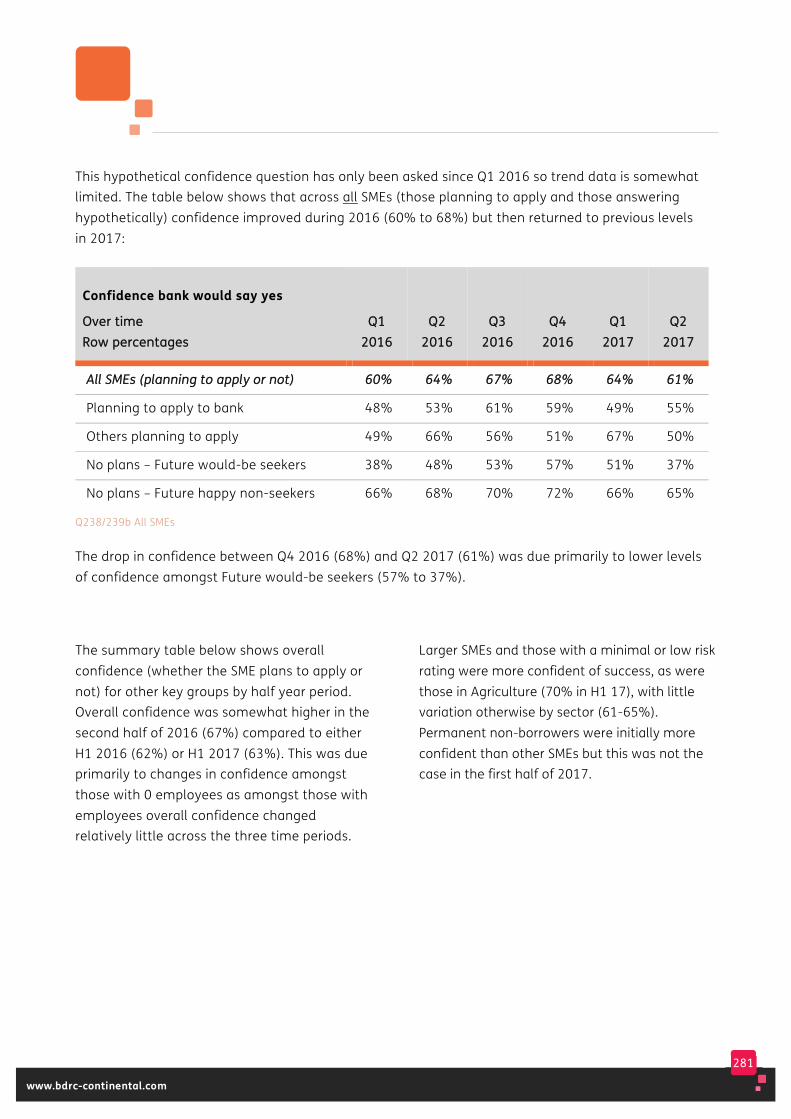
281
www.bdrc-continental.com
This hypothetical confidence question has only been asked since Q1 2016 so trend data is somewhat limited. The table below shows that across all SMEs (those planning to apply and those answering hypothetically) confidence improved during 2016 (60% to 68%) but then returned to previous levels in 2017:
Confidence bank would say yes
OOvveerr ttiimmee RRooww ppeerrcceennttaaggeess
QQ11 22001166
QQ22 22001166
QQ33 22001166
QQ44 22001166
QQ11 22001177
QQ22 22001177
AAllll SSMMEEss ((ppllaannnniinngg ttoo aappppllyy oorr nnoott)) 6600%% 6644%% 6677%% 6688%% 6644%% 6611%%
Planning to apply to bank 48% 53% 61% 59% 49% 55%
Others planning to apply 49% 66% 56% 51% 67% 50%
No plans – Future would-be seekers 38% 48% 53% 57% 51% 37%
No plans – Future happy non-seekers 66% 68% 70% 72% 66% 65%
Q238/239b All SMEs
The drop in confidence between Q4 2016 (68%) and Q2 2017 (61%) was due primarily to lower levels of confidence amongst Future would-be seekers (57% to 37%).
The summary table below shows overall confidence (whether the SME plans to apply or not) for other key groups by half year period. Overall confidence was somewhat higher in the second half of 2016 (67%) compared to either H1 2016 (62%) or H1 2017 (63%). This was due primarily to changes in confidence amongst those with 0 employees as amongst those with employees overall confidence changed relatively little across the three time periods.
Larger SMEs and those with a minimal or low risk rating were more confident of success, as were those in Agriculture (70% in H1 17), with little variation otherwise by sector (61-65%). Permanent non-borrowers were initially more confident than other SMEs but this was not the case in the first half of 2017.
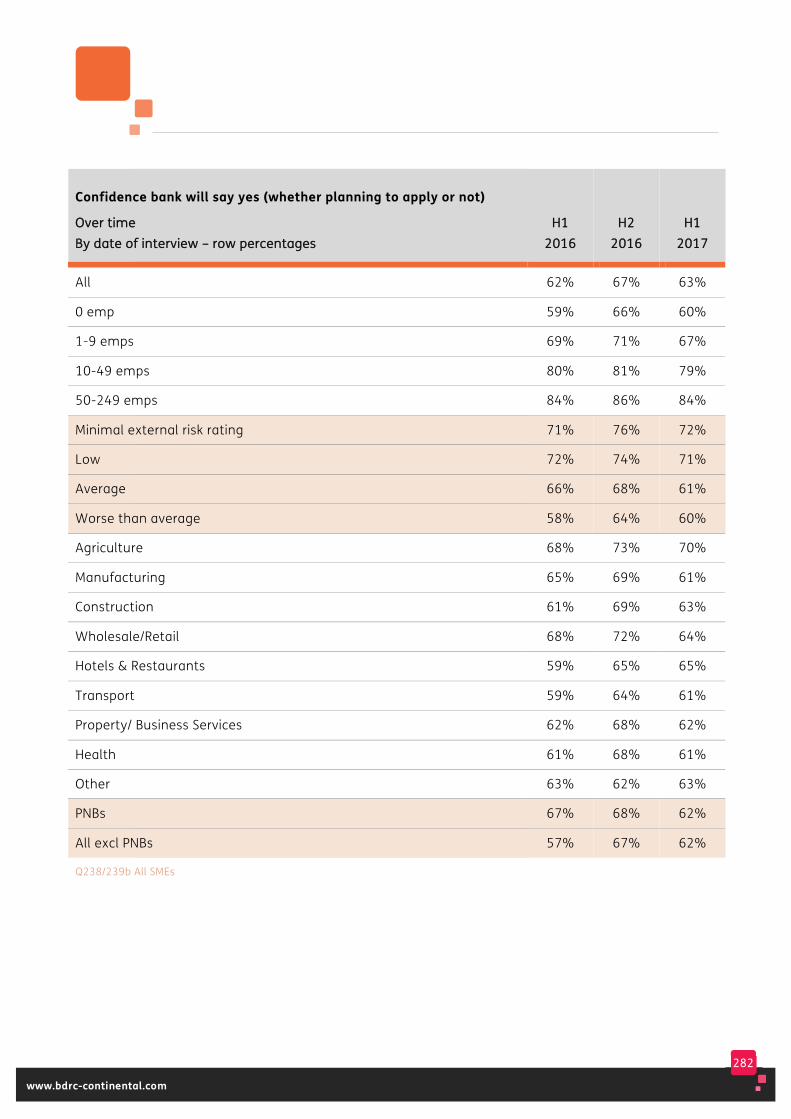
282
www.bdrc-continental.com
Confidence bank will say yes (whether planning to apply or not)
OOvveerr ttiimmee BByy ddaattee ooff iinntteerrvviieeww –– rrooww ppeerrcceennttaaggeess
HH11 22001166
HH22 22001166
HH11 22001177
All 62% 67% 63%
0 emp 59% 66% 60%
1-9 emps 69% 71% 67%
10-49 emps 80% 81% 79%
50-249 emps 84% 86% 84%
Minimal external risk rating 71% 76% 72%
Low 72% 74% 71%
Average 66% 68% 61%
Worse than average 58% 64% 60%
Agriculture 68% 73% 70%
Manufacturing 65% 69% 61%
Construction 61% 69% 63%
Wholesale/Retail 68% 72% 64%
Hotels & Restaurants 59% 65% 65%
Transport 59% 64% 61%
Property/ Business Services 62% 68% 62%
Health 61% 68% 61%
Other 63% 62% 63%
PNBs 67% 68% 62%
All excl PNBs 57% 67% 62%
Q238/239b All SMEs
283
www.bdrc-continental.com
Those not planning to seek or renew facilities in the next 3 months In Q2 2017, 12% of all SMEs reported plans to apply for, or renew, facilities in the following 3 months, leaving the majority (88%) with no such plans. 57% of all SMEs neither used external finance nor had any immediate plans to apply for any. On an annual basis, the proportion neither using nor applying for finance increased from 50% of SMEs in 2011 to 60% for 2014 and has been stable since (59% for both 2015 and 2016 as a whole and 60% for H1 2017).
When thinking about SMEs with no plans to apply/renew, it is important to distinguish between two groups:
• those that were happy with the decision because they did not need to borrow (more) or already had the facilities they needed – the Future happy non-seekers
• those that felt that there were barriers that might stop them making an application (such as discouragement, the economy or the principle or process of borrowing) – the Future would-be seekers.
These Future would-be seekers can then be split into 2 further groups:
• those that had already identified that they were likely to need external finance in the coming 3 months (and could foresee barriers to an application to meet that need).
• those that thought it unlikely that they would have a need for external finance in the next 3 months but who thought there would be barriers to their applying, were a need to emerge.
As reported later in this chapter, very few of the Future would-be seekers had an actual need for finance already identified, and thus they are a wider group than the Would-be seekers of the past 12 months, all of whom reported having an identified need for a loan or overdraft that they had not applied for.
There have been no changes over time to these definitions, unlike the equivalent question for past behaviour featured earlier in this report (although the option ‘I prefer not to borrow’ as a reason why Future would-be seekers were not planning to seek facilities was removed in Q4 2012, as it was for past behaviour).
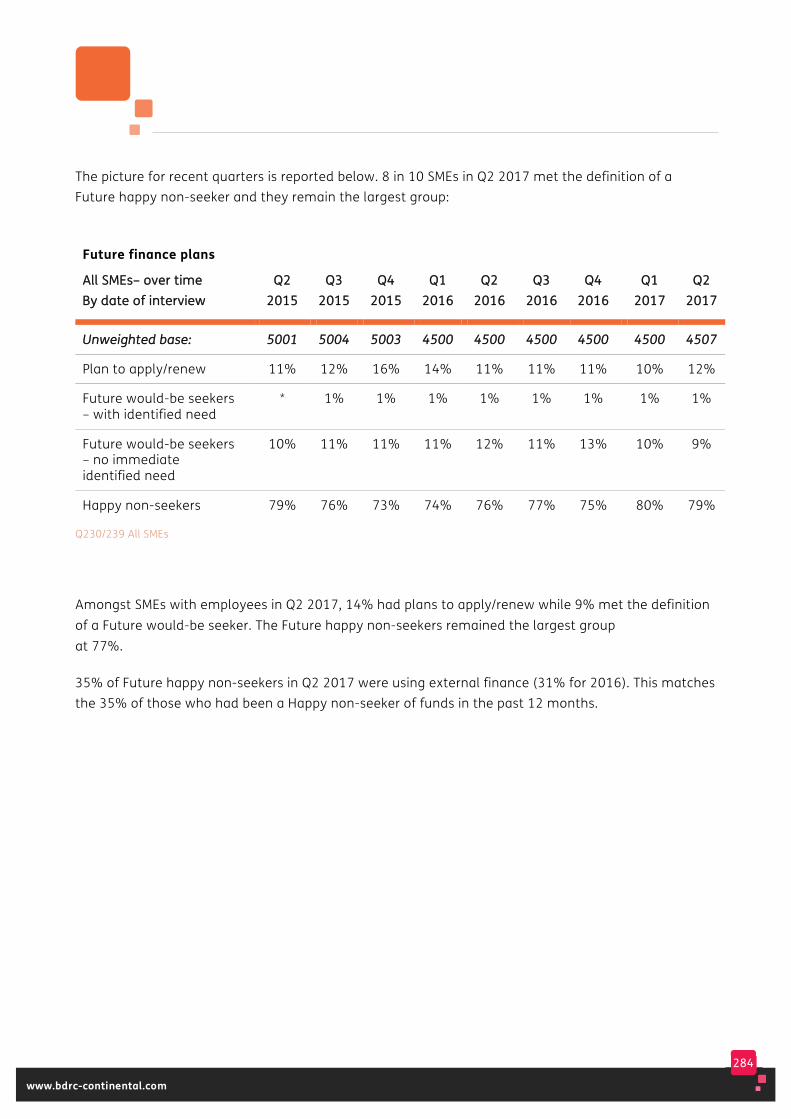
284
www.bdrc-continental.com
The picture for recent quarters is reported below. 8 in 10 SMEs in Q2 2017 met the definition of a Future happy non-seeker and they remain the largest group:
Future finance plans
AAllll SSMMEEss–– oovveerr ttiimmee BByy ddaattee ooff iinntteerrvviieeww
QQ22 22001155
QQ33 22001155
QQ44 22001155
QQ11 22001166
QQ22 22001166
QQ33 22001166
QQ44 22001166
QQ11 22001177
QQ22 22001177
UUnnwweeiigghhtteedd bbaassee:: 55000011 55000044 55000033 44550000 44550000 44550000 44550000 44550000 44550077
Plan to apply/renew 11% 12% 16% 14% 11% 11% 11% 10% 12%
Future would-be seekers – with identified need
* 1% 1% 1% 1% 1% 1% 1% 1%
Future would-be seekers – no immediate identified need
10% 11% 11% 11% 12% 11% 13% 10% 9%
Happy non-seekers 79% 76% 73% 74% 76% 77% 75% 80% 79%
Q230/239 All SMEs
Amongst SMEs with employees in Q2 2017, 14% had plans to apply/renew while 9% met the definition of a Future would-be seeker. The Future happy non-seekers remained the largest group at 77%.
35% of Future happy non-seekers in Q2 2017 were using external finance (31% for 2016). This matches the 35% of those who had been a Happy non-seeker of funds in the past 12 months.
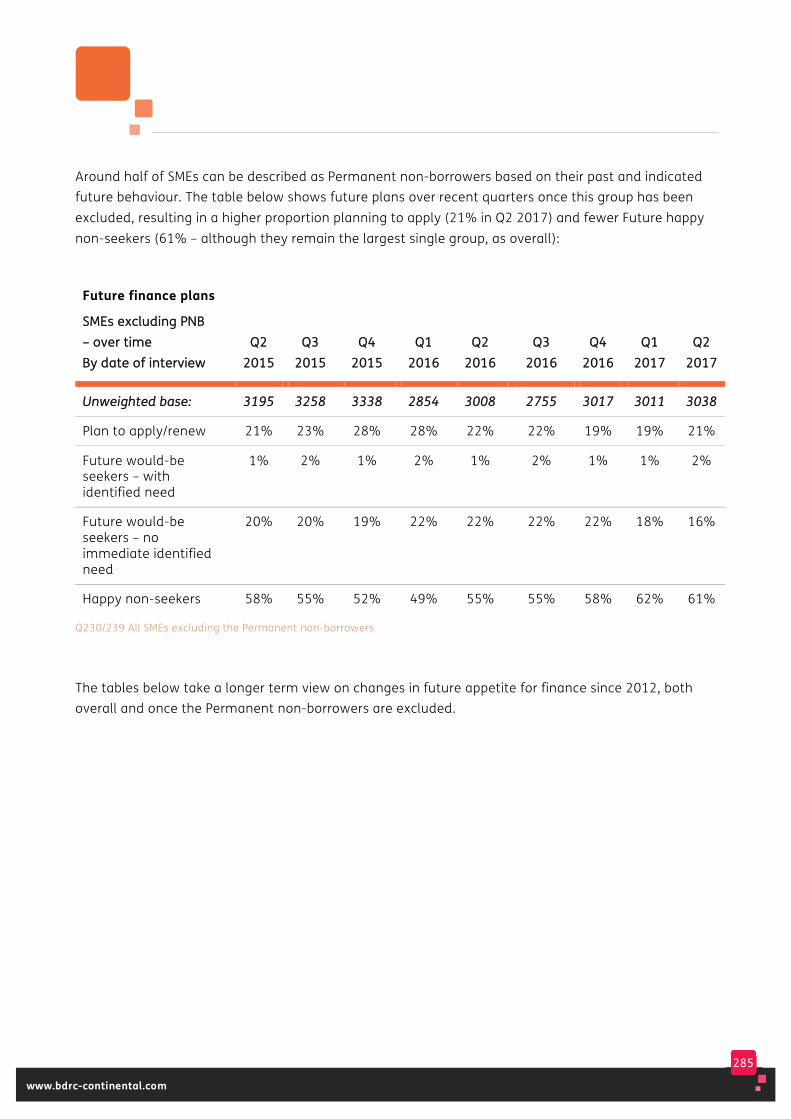
285
www.bdrc-continental.com
Around half of SMEs can be described as Permanent non-borrowers based on their past and indicated future behaviour. The table below shows future plans over recent quarters once this group has been excluded, resulting in a higher proportion planning to apply (21% in Q2 2017) and fewer Future happy non-seekers (61% – although they remain the largest single group, as overall):
Future finance plans
SSMMEEss eexxcclluuddiinngg PPNNBB –– oovveerr ttiimmee BByy ddaattee ooff iinntteerrvviieeww
QQ22 22001155
QQ33 22001155
QQ44 22001155
QQ11 22001166
QQ22 22001166
QQ33 22001166
QQ44 22001166
QQ11 22001177
QQ22 22001177
UUnnwweeiigghhtteedd bbaassee:: 33119955 33225588 33333388 22885544 33000088 22775555 33001177 33001111 33003388
Plan to apply/renew 21% 23% 28% 28% 22% 22% 19% 19% 21%
Future would-be seekers – with identified need
1% 2% 1% 2% 1% 2% 1% 1% 2%
Future would-be seekers – no immediate identified need
20% 20% 19% 22% 22% 22% 22% 18% 16%
Happy non-seekers 58% 55% 52% 49% 55% 55% 58% 62% 61%
Q230/239 All SMEs excluding the Permanent non-borrowers
The tables below take a longer term view on changes in future appetite for finance since 2012, both overall and once the Permanent non-borrowers are excluded.
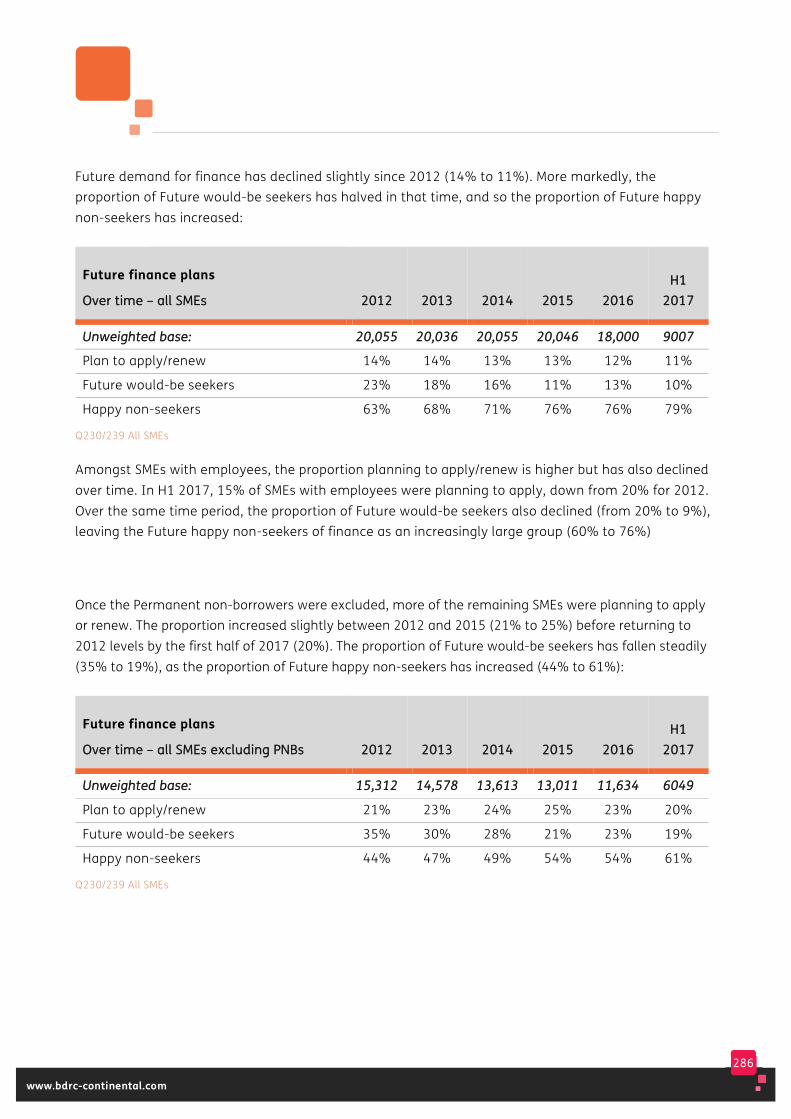
286
www.bdrc-continental.com
Future demand for finance has declined slightly since 2012 (14% to 11%). More markedly, the proportion of Future would-be seekers has halved in that time, and so the proportion of Future happy non-seekers has increased:
Future finance plans
OOvveerr ttiimmee –– aallll SSMMEEss 22001122 22001133 22001144 22001155
22001166 HH11
22001177
UUnnwweeiigghhtteedd bbaassee:: 2200,,005555 2200,,003366 2200,,005555 2200,,004466 1188,,000000 99000077
Plan to apply/renew 14% 14% 13% 13% 12% 11%
Future would-be seekers 23% 18% 16% 11% 13% 10%
Happy non-seekers 63% 68% 71% 76% 76% 79%
Q230/239 All SMEs
Amongst SMEs with employees, the proportion planning to apply/renew is higher but has also declined over time. In H1 2017, 15% of SMEs with employees were planning to apply, down from 20% for 2012. Over the same time period, the proportion of Future would-be seekers also declined (from 20% to 9%), leaving the Future happy non-seekers of finance as an increasingly large group (60% to 76%)
Once the Permanent non-borrowers were excluded, more of the remaining SMEs were planning to apply or renew. The proportion increased slightly between 2012 and 2015 (21% to 25%) before returning to 2012 levels by the first half of 2017 (20%). The proportion of Future would-be seekers has fallen steadily (35% to 19%), as the proportion of Future happy non-seekers has increased (44% to 61%):
Future finance plans
OOvveerr ttiimmee –– aallll SSMMEEss eexxcclluuddiinngg PPNNBBss 22001122 22001133 22001144 22001155
22001166 HH11
22001177
UUnnwweeiigghhtteedd bbaassee:: 1155,,331122 1144,,557788 1133,,661133 1133,,001111 1111,,663344 66004499
Plan to apply/renew 21% 23% 24% 25% 23% 20%
Future would-be seekers 35% 30% 28% 21% 23% 19%
Happy non-seekers 44% 47% 49% 54% 54% 61%
Q230/239 All SMEs
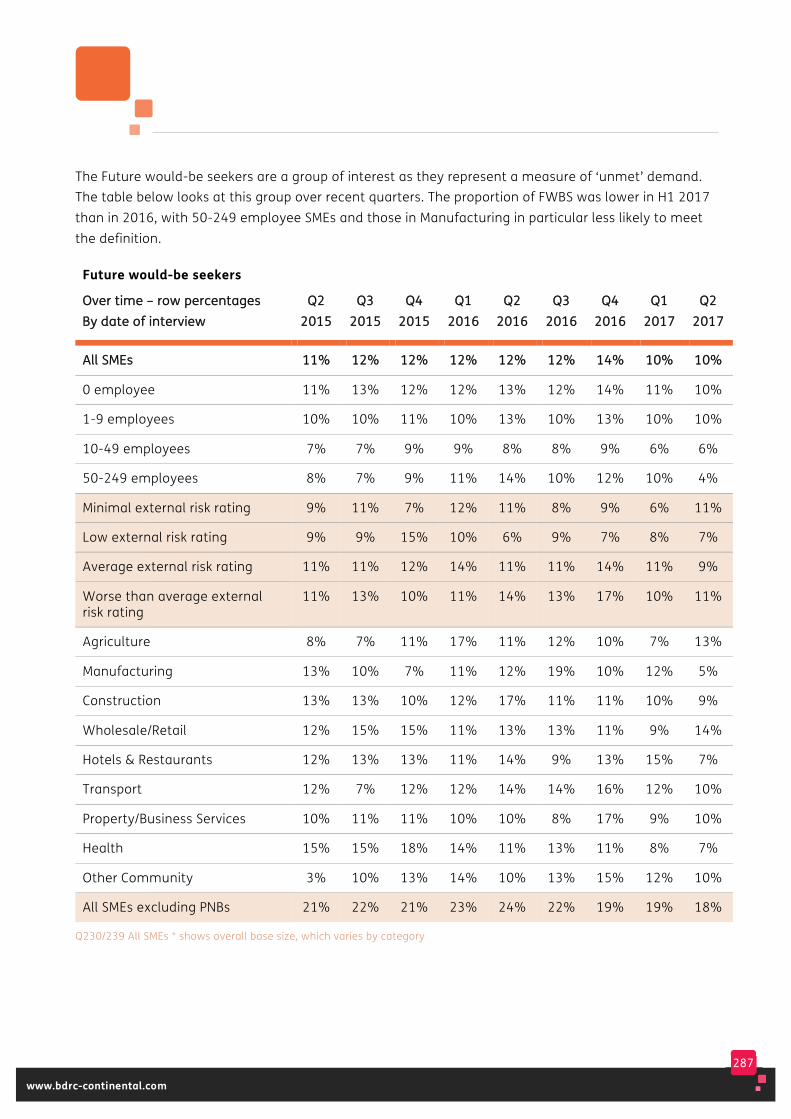
287
www.bdrc-continental.com
The Future would-be seekers are a group of interest as they represent a measure of ‘unmet’ demand. The table below looks at this group over recent quarters. The proportion of FWBS was lower in H1 2017 than in 2016, with 50-249 employee SMEs and those in Manufacturing in particular less likely to meet the definition.
Future would-be seekers
OOvveerr ttiimmee –– rrooww ppeerrcceennttaaggeess BByy ddaattee ooff iinntteerrvviieeww
QQ22 22001155
QQ33 22001155
QQ44 22001155
QQ11 22001166
QQ22 22001166
QQ33 22001166
QQ44 22001166
QQ11 22001177
QQ22 22001177
AAllll SSMMEEss 1111%% 1122%% 1122%% 1122%% 1122%% 1122%% 1144%% 1100%% 1100%%
0 employee 11% 13% 12% 12% 13% 12% 14% 11% 10%
1-9 employees 10% 10% 11% 10% 13% 10% 13% 10% 10%
10-49 employees 7% 7% 9% 9% 8% 8% 9% 6% 6%
50-249 employees 8% 7% 9% 11% 14% 10% 12% 10% 4%
Minimal external risk rating 9% 11% 7% 12% 11% 8% 9% 6% 11%
Low external risk rating 9% 9% 15% 10% 6% 9% 7% 8% 7%
Average external risk rating 11% 11% 12% 14% 11% 11% 14% 11% 9%
Worse than average external risk rating
11% 13% 10% 11% 14% 13% 17% 10% 11%
Agriculture 8% 7% 11% 17% 11% 12% 10% 7% 13%
Manufacturing 13% 10% 7% 11% 12% 19% 10% 12% 5%
Construction 13% 13% 10% 12% 17% 11% 11% 10% 9%
Wholesale/Retail 12% 15% 15% 11% 13% 13% 11% 9% 14%
Hotels & Restaurants 12% 13% 13% 11% 14% 9% 13% 15% 7%
Transport 12% 7% 12% 12% 14% 14% 16% 12% 10%
Property/Business Services 10% 11% 11% 10% 10% 8% 17% 9% 10%
Health 15% 15% 18% 14% 11% 13% 11% 8% 7%
Other Community 3% 10% 13% 14% 10% 13% 15% 12% 10%
All SMEs excluding PNBs 21% 22% 21% 23% 24% 22% 19% 19% 18%
Q230/239 All SMEs * shows overall base size, which varies by category
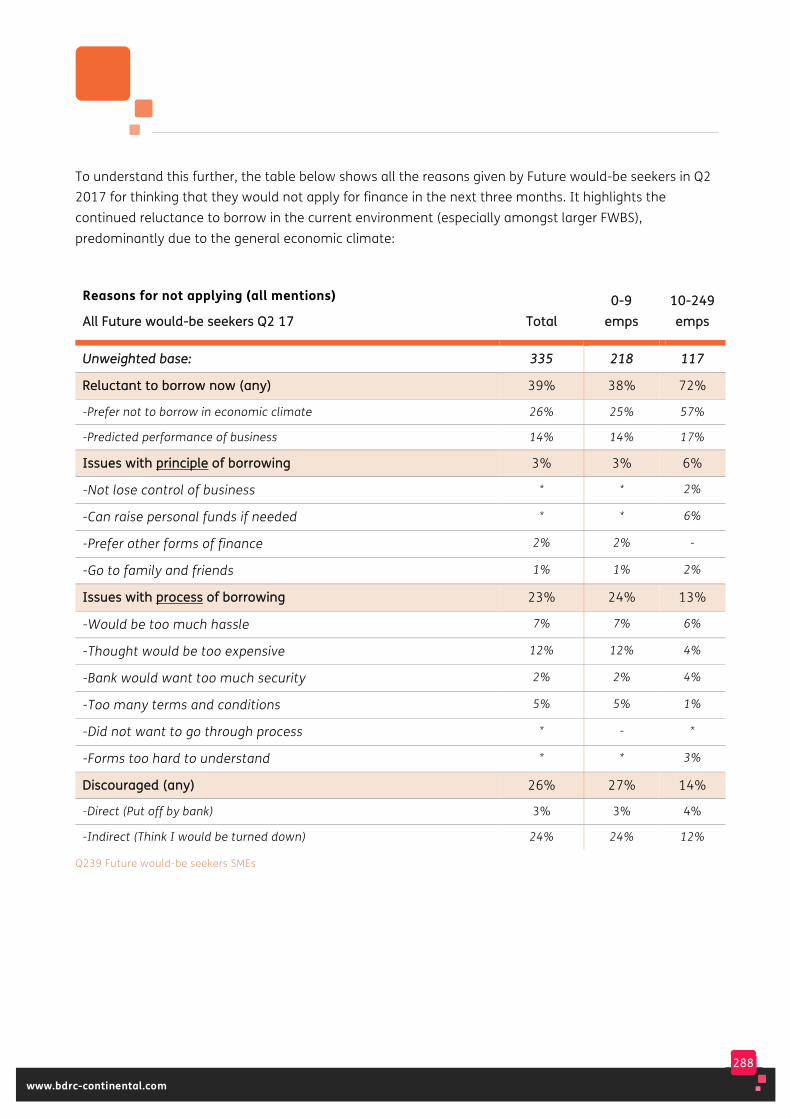
288
www.bdrc-continental.com
To understand this further, the table below shows all the reasons given by Future would-be seekers in Q2 2017 for thinking that they would not apply for finance in the next three months. It highlights the continued reluctance to borrow in the current environment (especially amongst larger FWBS), predominantly due to the general economic climate:
Reasons for not applying (all mentions)
AAllll FFuuttuurree wwoouulldd--bbee sseeeekkeerrss QQ22 1177 TToottaall 00--99
eemmppss 1100--224499 eemmppss
UUnnwweeiigghhtteedd bbaassee:: 333355 221188 111177
RReelluuccttaanntt ttoo bboorrrrooww nnooww ((aannyy)) 39% 38% 72%
-Prefer not to borrow in economic climate 26% 25% 57%
-Predicted performance of business 14% 14% 17%
IIssssuueess wwiitthh pprriinncciippllee ooff bboorrrroowwiinngg 3% 3% 6%
-Not lose control of business * * 2%
-Can raise personal funds if needed * * 6%
-Prefer other forms of finance 2% 2% -
-Go to family and friends 1% 1% 2%
IIssssuueess wwiitthh pprroocceessss ooff bboorrrroowwiinngg 23% 24% 13%
-Would be too much hassle 7% 7% 6%
-Thought would be too expensive 12% 12% 4%
-Bank would want too much security 2% 2% 4%
-Too many terms and conditions 5% 5% 1%
-Did not want to go through process * - *
-Forms too hard to understand * * 3%
DDiissccoouurraaggeedd ((aannyy)) 26% 27% 14%
-Direct (Put off by bank) 3% 3% 4%
-Indirect (Think I would be turned down) 24% 24% 12%
Q239 Future would-be seekers SMEs
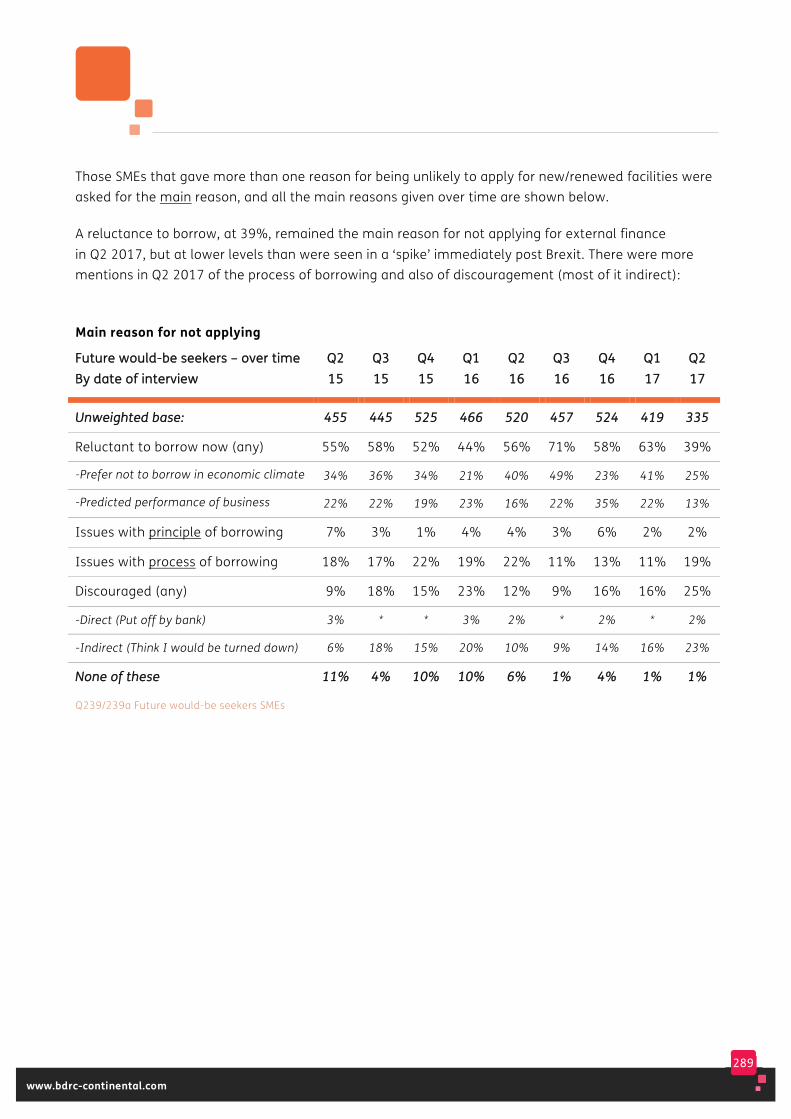
289
www.bdrc-continental.com
Those SMEs that gave more than one reason for being unlikely to apply for new/renewed facilities were asked for the main reason, and all the main reasons given over time are shown below.
A reluctance to borrow, at 39%, remained the main reason for not applying for external finance in Q2 2017, but at lower levels than were seen in a ‘spike’ immediately post Brexit. There were more mentions in Q2 2017 of the process of borrowing and also of discouragement (most of it indirect):
Main reason for not applying
FFuuttuurree wwoouulldd--bbee sseeeekkeerrss –– oovveerr ttiimmee BByy ddaattee ooff iinntteerrvviieeww
QQ22 1155
QQ33 1155
QQ44 1155
QQ11 1166
QQ22 1166
QQ33 1166
QQ44 1166
QQ11 1177
QQ22 1177
UUnnwweeiigghhtteedd bbaassee:: 445555 444455 552255 446666 552200 445577 552244 441199 333355
Reluctant to borrow now (any) 55% 58% 52% 44% 56% 71% 58% 63% 39%
-Prefer not to borrow in economic climate 34% 36% 34% 21% 40% 49% 23% 41% 25%
-Predicted performance of business 22% 22% 19% 23% 16% 22% 35% 22% 13%
Issues with principle of borrowing 7% 3% 1% 4% 4% 3% 6% 2% 2%
Issues with process of borrowing 18% 17% 22% 19% 22% 11% 13% 11% 19%
Discouraged (any) 9% 18% 15% 23% 12% 9% 16% 16% 25%
-Direct (Put off by bank) 3% * * 3% 2% * 2% * 2%
-Indirect (Think I would be turned down) 6% 18% 15% 20% 10% 9% 14% 16% 23%
NNoonnee ooff tthheessee 1111%% 44%% 1100%% 1100%% 66%% 11%% 44%% 11%% 11%%
Q239/239a Future would-be seekers SMEs
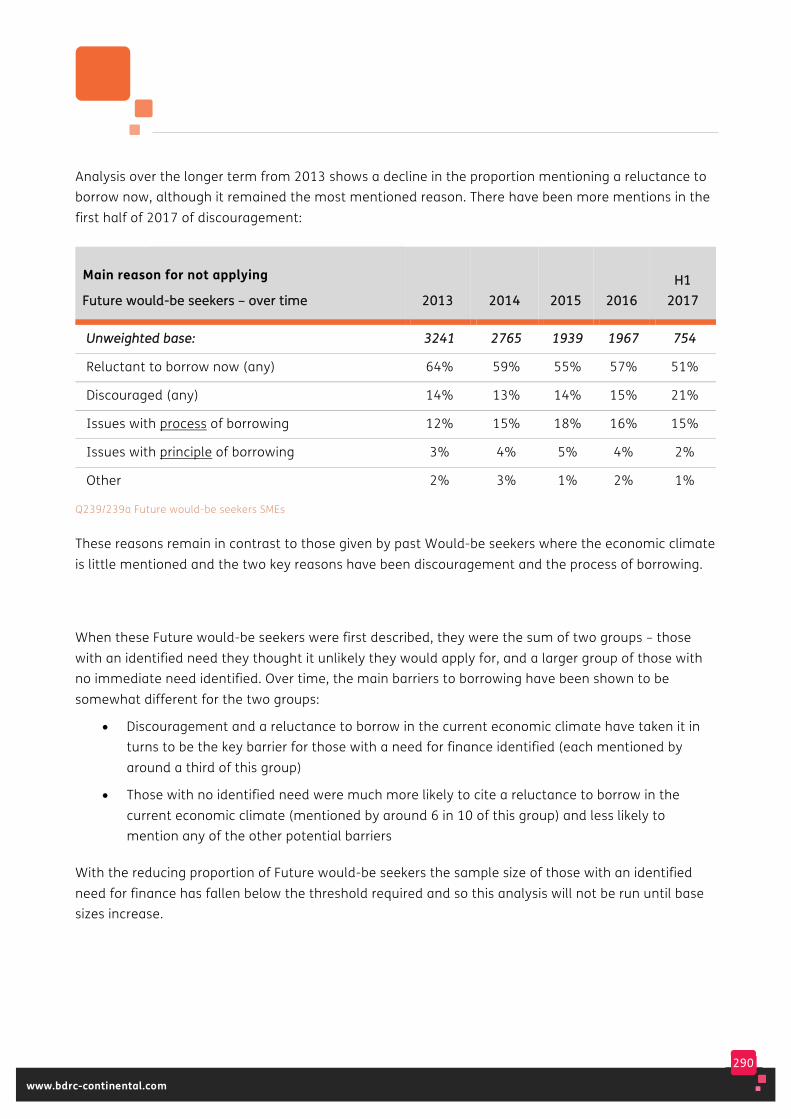
290
www.bdrc-continental.com
Analysis over the longer term from 2013 shows a decline in the proportion mentioning a reluctance to borrow now, although it remained the most mentioned reason. There have been more mentions in the first half of 2017 of discouragement:
Main reason for not applying
FFuuttuurree wwoouulldd--bbee sseeeekkeerrss –– oovveerr ttiimmee 22001133 22001144 22001155
22001166 HH11
22001177
UUnnwweeiigghhtteedd bbaassee:: 33224411 22776655 11993399 11996677 775544
Reluctant to borrow now (any) 64% 59% 55% 57% 51%
Discouraged (any) 14% 13% 14% 15% 21%
Issues with process of borrowing 12% 15% 18% 16% 15%
Issues with principle of borrowing 3% 4% 5% 4% 2%
Other 2% 3% 1% 2% 1%
Q239/239a Future would-be seekers SMEs
These reasons remain in contrast to those given by past Would-be seekers where the economic climate is little mentioned and the two key reasons have been discouragement and the process of borrowing.
When these Future would-be seekers were first described, they were the sum of two groups – those with an identified need they thought it unlikely they would apply for, and a larger group of those with no immediate need identified. Over time, the main barriers to borrowing have been shown to be somewhat different for the two groups:
• Discouragement and a reluctance to borrow in the current economic climate have taken it in turns to be the key barrier for those with a need for finance identified (each mentioned by around a third of this group)
• Those with no identified need were much more likely to cite a reluctance to borrow in the current economic climate (mentioned by around 6 in 10 of this group) and less likely to mention any of the other potential barriers
With the reducing proportion of Future would-be seekers the sample size of those with an identified need for finance has fallen below the threshold required and so this analysis will not be run until base sizes increase.

291
www.bdrc-continental.com
Further analysis of all Future would-be seekers including by size and risk rating, is based on the latest quarter (Q2 2017).
A ‘reluctance to borrow now’ , especially in the current economic climate, was the top reason given, particularly for the larger SMEs:
Main reason for not applying
FFuuttuurree wwoouulldd--bbee sseeeekkeerrss bbyy ssiizzee QQ22 1177 TToottaall
00--99 eemmppss
1100--224499 eemmppss
UUnnwweeiigghhtteedd bbaassee:: 333355 221188 111177
Reluctant to borrow now (any) 39% 38% 71%
-Prefer not to borrow in economic climate 25% 24% 54%
-Predicted performance of business 13% 13% 17%
Issues with principle of borrowing 2% 2% 3%
Issues with process of borrowing 19% 20% 10%
Discouraged (any) 25% 26% 11%
-Direct (Put off by bank) 2% 2% 3%
-Indirect (Think I would be turned down) 23% 23% 9%
Q239/239a Future would-be seekers SMEs
Excluding the Future would-be seekers with 0 employees saw 58% of FWBS with employees citing a reluctance to borrow now, and discouragement and the process of borrowing being cited by 15% each.

292
www.bdrc-continental.com
The table below shows the main reasons given for not applying in Q2 2017 split by risk rating. A ‘reluctance to borrow now’ remained the main barrier across the risk ratings, but those with an average or worse than average rating were more likely to mention discouragement (28%) or the process of borrowing (20%) than those with a minimal or low risk rating:
Main reason for not applying
FFuuttuurree wwoouulldd--bbee sseeeekkeerrss bbyy rriisskk rraattiinngg QQ22 1177 TToottaall MMiinn//LLooww
AAvvggee//
WWoorrssee AAvvgg
UUnnwweeiigghhtteedd bbaassee:: 333355 111155 117777
Reluctant to borrow now (any) 39% 59% 39%
-Prefer not to borrow in economic climate 25% 33% 27%
-Predicted performance of business 13% 26% 12%
Issues with principle of borrowing 2% 3% 2%
Issues with process of borrowing 19% 7% 20%
Discouraged (any) 25% 8% 28%
-Direct (Put off by bank) 2% * 1%
-Indirect (Think I would be turned down) 23% 8% 27%
Q239/239a Future would-be seekers SMEs
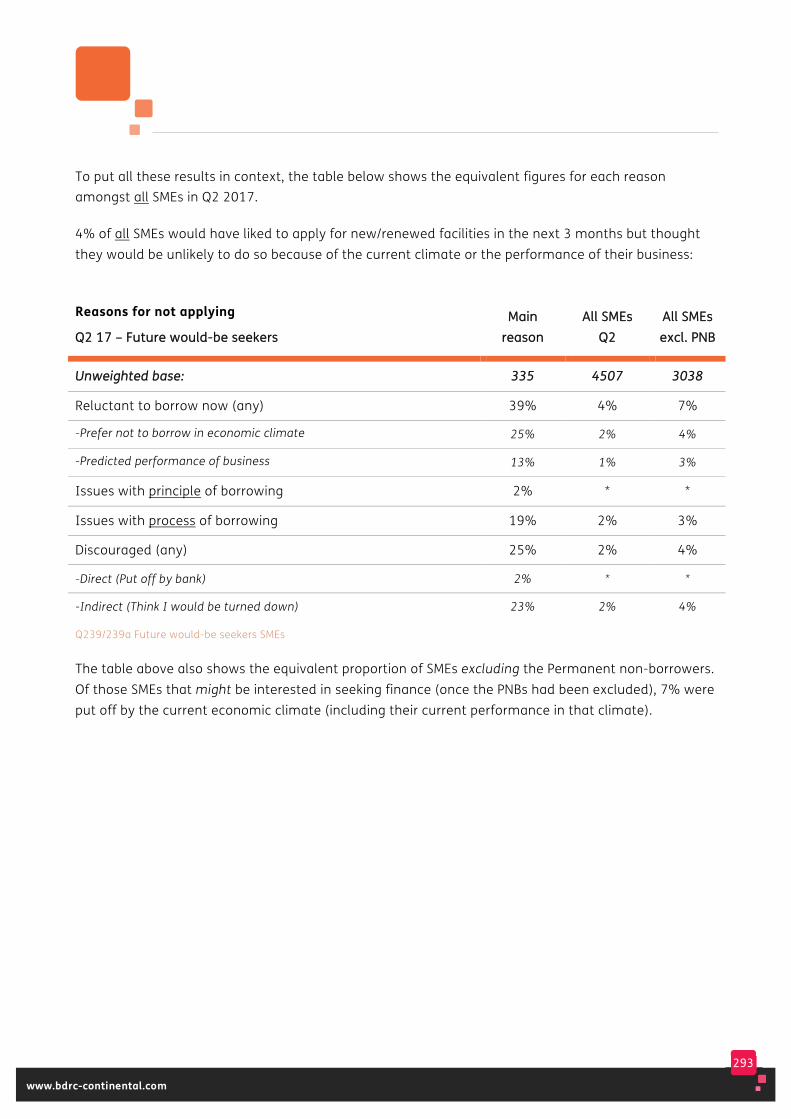
293
www.bdrc-continental.com
To put all these results in context, the table below shows the equivalent figures for each reason amongst all SMEs in Q2 2017.
4% of all SMEs would have liked to apply for new/renewed facilities in the next 3 months but thought they would be unlikely to do so because of the current climate or the performance of their business:
Reasons for not applying
QQ22 1177 –– FFuuttuurree wwoouulldd--bbee sseeeekkeerrss MMaaiinn
rreeaassoonn AAllll SSMMEEss
QQ22 AAllll SSMMEEss eexxccll.. PPNNBB
UUnnwweeiigghhtteedd bbaassee:: 333355 44550077 33003388
Reluctant to borrow now (any) 39% 4% 7%
-Prefer not to borrow in economic climate 25% 2% 4%
-Predicted performance of business 13% 1% 3%
Issues with principle of borrowing 2% * *
Issues with process of borrowing 19% 2% 3%
Discouraged (any) 25% 2% 4%
-Direct (Put off by bank) 2% * *
-Indirect (Think I would be turned down) 23% 2% 4%
Q239/239a Future would-be seekers SMEs
The table above also shows the equivalent proportion of SMEs excluding the Permanent non-borrowers. Of those SMEs that might be interested in seeking finance (once the PNBs had been excluded), 7% were put off by the current economic climate (including their current performance in that climate).
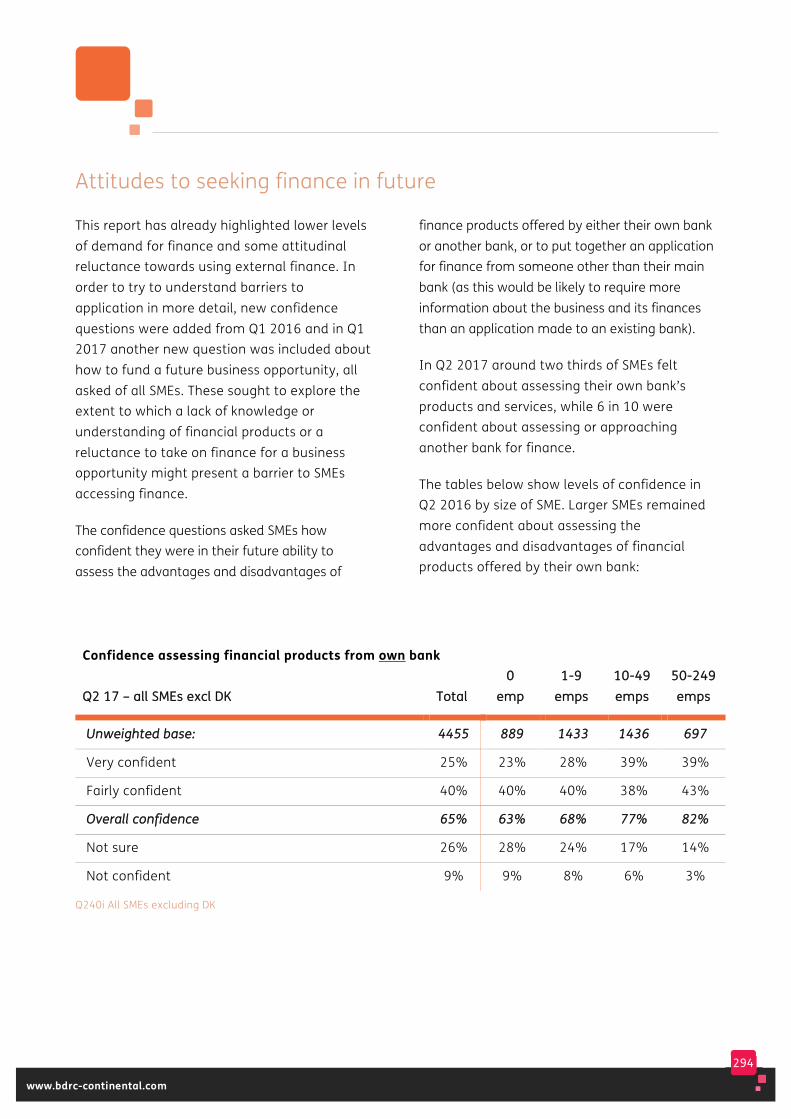
294
www.bdrc-continental.com
Attitudes to seeking finance in future
This report has already highlighted lower levels of demand for finance and some attitudinal reluctance towards using external finance. In order to try to understand barriers to application in more detail, new confidence questions were added from Q1 2016 and in Q1 2017 another new question was included about how to fund a future business opportunity, all asked of all SMEs. These sought to explore the extent to which a lack of knowledge or understanding of financial products or a reluctance to take on finance for a business opportunity might present a barrier to SMEs accessing finance.
The confidence questions asked SMEs how confident they were in their future ability to assess the advantages and disadvantages of
finance products offered by either their own bank or another bank, or to put together an application for finance from someone other than their main bank (as this would be likely to require more information about the business and its finances than an application made to an existing bank).
In Q2 2017 around two thirds of SMEs felt confident about assessing their own bank’s products and services, while 6 in 10 were confident about assessing or approaching another bank for finance.
The tables below show levels of confidence in Q2 2016 by size of SME. Larger SMEs remained more confident about assessing the advantages and disadvantages of financial products offered by their own bank:
Confidence assessing financial products from own bank
QQ22 1177 –– aallll SSMMEEss eexxccll DDKK TToottaall 00
eemmpp 11--99
eemmppss 1100--4499 eemmppss
5500--224499 eemmppss
UUnnwweeiigghhtteedd bbaassee:: 44445555 888899 11443333 11443366 669977
Very confident 25% 23% 28% 39% 39%
Fairly confident 40% 40% 40% 38% 43%
OOvveerraallll ccoonnffiiddeennccee 6655%% 6633%% 6688%% 7777%% 8822%%
Not sure 26% 28% 24% 17% 14%
Not confident 9% 9% 8% 6% 3%
Q240i All SMEs excluding DK
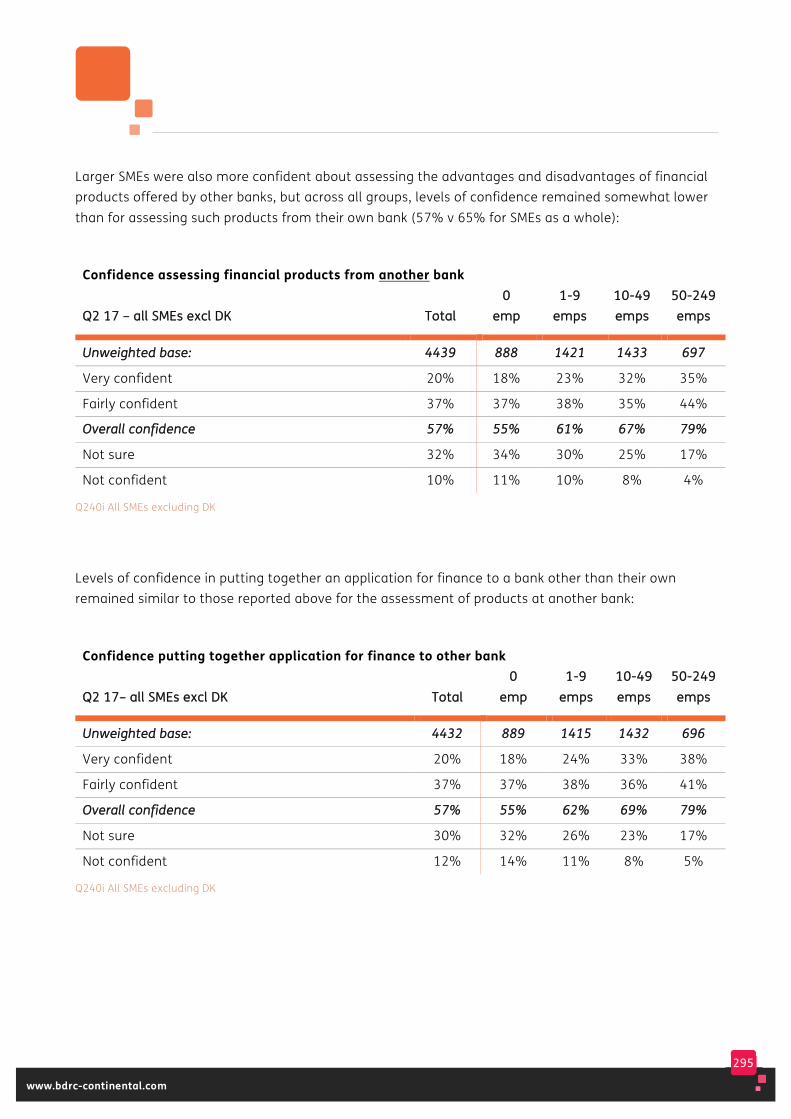
295
www.bdrc-continental.com
Larger SMEs were also more confident about assessing the advantages and disadvantages of financial products offered by other banks, but across all groups, levels of confidence remained somewhat lower than for assessing such products from their own bank (57% v 65% for SMEs as a whole):
Confidence assessing financial products from another bank
QQ22 1177 –– aallll SSMMEEss eexxccll DDKK TToottaall 00
eemmpp 11--99
eemmppss 1100--4499 eemmppss
5500--224499 eemmppss
UUnnwweeiigghhtteedd bbaassee:: 44443399 888888 11442211 11443333 669977
Very confident 20% 18% 23% 32% 35%
Fairly confident 37% 37% 38% 35% 44%
OOvveerraallll ccoonnffiiddeennccee 5577%% 5555%% 6611%% 6677%% 7799%%
Not sure 32% 34% 30% 25% 17%
Not confident 10% 11% 10% 8% 4%
Q240i All SMEs excluding DK
Levels of confidence in putting together an application for finance to a bank other than their own remained similar to those reported above for the assessment of products at another bank:
Confidence putting together application for finance to other bank
QQ22 1177–– aallll SSMMEEss eexxccll DDKK TToottaall 00
eemmpp 11--99
eemmppss 1100--4499 eemmppss
5500--224499 eemmppss
UUnnwweeiigghhtteedd bbaassee:: 44443322 888899 11441155 11443322 669966
Very confident 20% 18% 24% 33% 38%
Fairly confident 37% 37% 38% 36% 41%
OOvveerraallll ccoonnffiiddeennccee 5577%% 5555%% 6622%% 6699%% 7799%%
Not sure 30% 32% 26% 23% 17%
Not confident 12% 14% 11% 8% 5%
Q240i All SMEs excluding DK
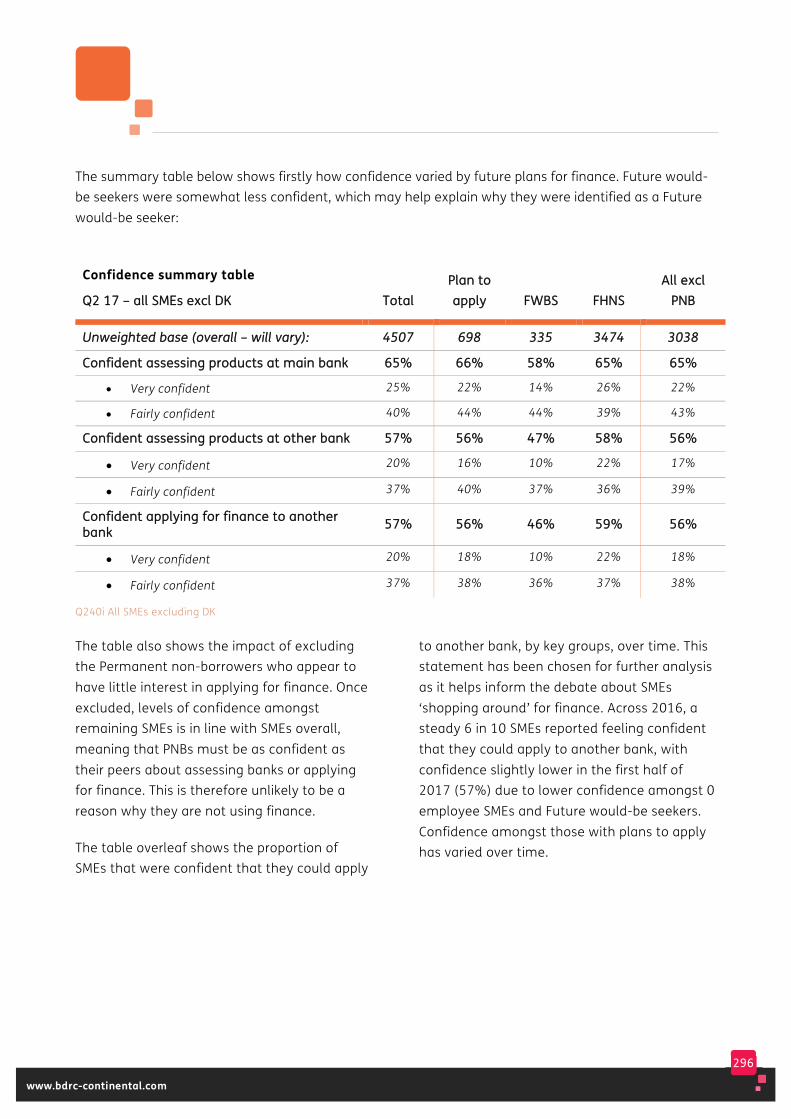
296
www.bdrc-continental.com
The summary table below shows firstly how confidence varied by future plans for finance. Future would-be seekers were somewhat less confident, which may help explain why they were identified as a Future would-be seeker:
Confidence summary table
QQ22 1177 –– aallll SSMMEEss eexxccll DDKK TToottaall PPllaann ttoo aappppllyy FFWWBBSS FFHHNNSS
AAllll eexxccll PPNNBB
UUnnwweeiigghhtteedd bbaassee ((oovveerraallll –– wwiillll vvaarryy)):: 44550077 669988 333355 33447744 33003388
CCoonnffiiddeenntt aasssseessssiinngg pprroodduuccttss aatt mmaaiinn bbaannkk 6655%% 6666%% 5588%% 6655%% 6655%%
• Very confident 25% 22% 14% 26% 22%
• Fairly confident 40% 44% 44% 39% 43%
CCoonnffiiddeenntt aasssseessssiinngg pprroodduuccttss aatt ootthheerr bbaannkk 5577%% 5566%% 4477%% 5588%% 5566%%
• Very confident 20% 16% 10% 22% 17%
• Fairly confident 37% 40% 37% 36% 39%
CCoonnffiiddeenntt aappppllyyiinngg ffoorr ffiinnaannccee ttoo aannootthheerr bbaannkk 5577%% 5566%% 4466%% 5599%% 5566%%
• Very confident 20% 18% 10% 22% 18%
• Fairly confident 37% 38% 36% 37% 38%
Q240i All SMEs excluding DK
The table also shows the impact of excluding the Permanent non-borrowers who appear to have little interest in applying for finance. Once excluded, levels of confidence amongst remaining SMEs is in line with SMEs overall, meaning that PNBs must be as confident as their peers about assessing banks or applying for finance. This is therefore unlikely to be a reason why they are not using finance.
The table overleaf shows the proportion of SMEs that were confident that they could apply
to another bank, by key groups, over time. This statement has been chosen for further analysis as it helps inform the debate about SMEs ‘shopping around’ for finance. Across 2016, a steady 6 in 10 SMEs reported feeling confident that they could apply to another bank, with confidence slightly lower in the first half of 2017 (57%) due to lower confidence amongst 0 employee SMEs and Future would-be seekers. Confidence amongst those with plans to apply has varied over time.
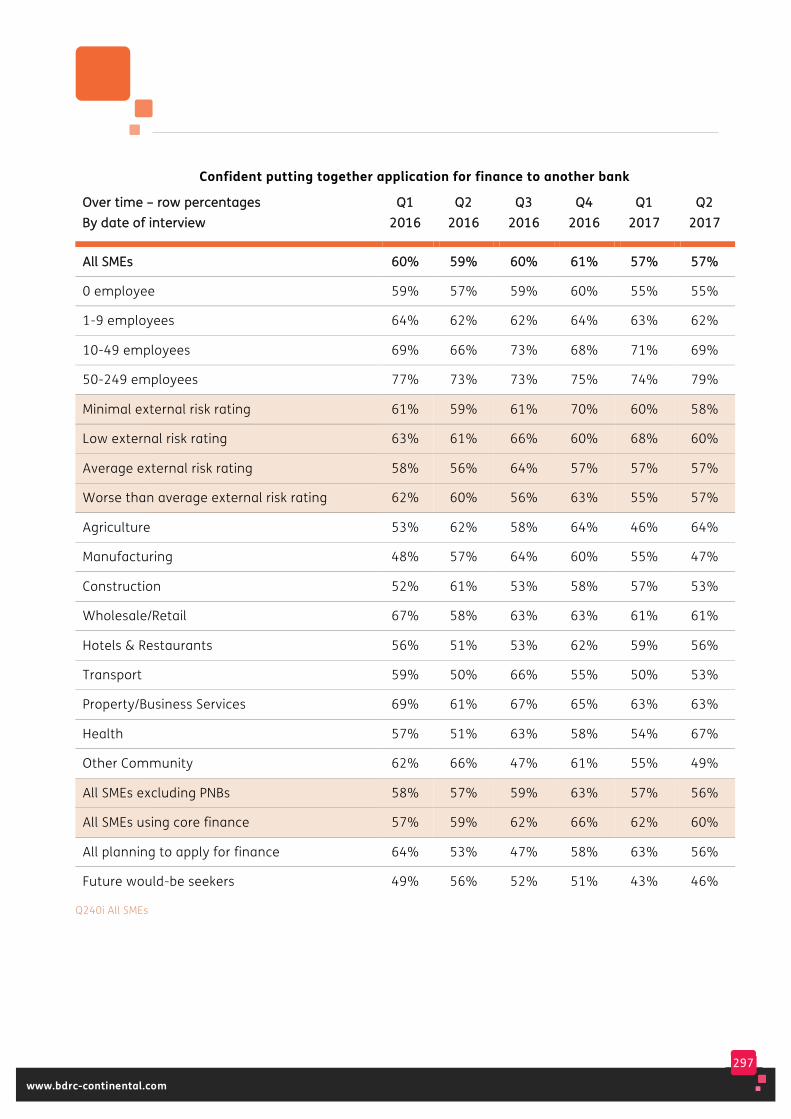
297
www.bdrc-continental.com
Confident putting together application for finance to another bank
OOvveerr ttiimmee –– rrooww ppeerrcceennttaaggeess BByy ddaattee ooff iinntteerrvviieeww
QQ11 22001166
QQ22 22001166
QQ33 22001166
QQ44 22001166
QQ11 22001177
QQ22 22001177
AAllll SSMMEEss 6600%% 5599%% 6600%% 6611%% 5577%% 5577%%
0 employee 59% 57% 59% 60% 55% 55%
1-9 employees 64% 62% 62% 64% 63% 62%
10-49 employees 69% 66% 73% 68% 71% 69%
50-249 employees 77% 73% 73% 75% 74% 79%
Minimal external risk rating 61% 59% 61% 70% 60% 58%
Low external risk rating 63% 61% 66% 60% 68% 60%
Average external risk rating 58% 56% 64% 57% 57% 57%
Worse than average external risk rating 62% 60% 56% 63% 55% 57%
Agriculture 53% 62% 58% 64% 46% 64%
Manufacturing 48% 57% 64% 60% 55% 47%
Construction 52% 61% 53% 58% 57% 53%
Wholesale/Retail 67% 58% 63% 63% 61% 61%
Hotels & Restaurants 56% 51% 53% 62% 59% 56%
Transport 59% 50% 66% 55% 50% 53%
Property/Business Services 69% 61% 67% 65% 63% 63%
Health 57% 51% 63% 58% 54% 67%
Other Community 62% 66% 47% 61% 55% 49%
All SMEs excluding PNBs 58% 57% 59% 63% 57% 56%
All SMEs using core finance 57% 59% 62% 66% 62% 60%
All planning to apply for finance 64% 53% 47% 58% 63% 56%
Future would-be seekers 49% 56% 52% 51% 43% 46%
Q240i All SMEs
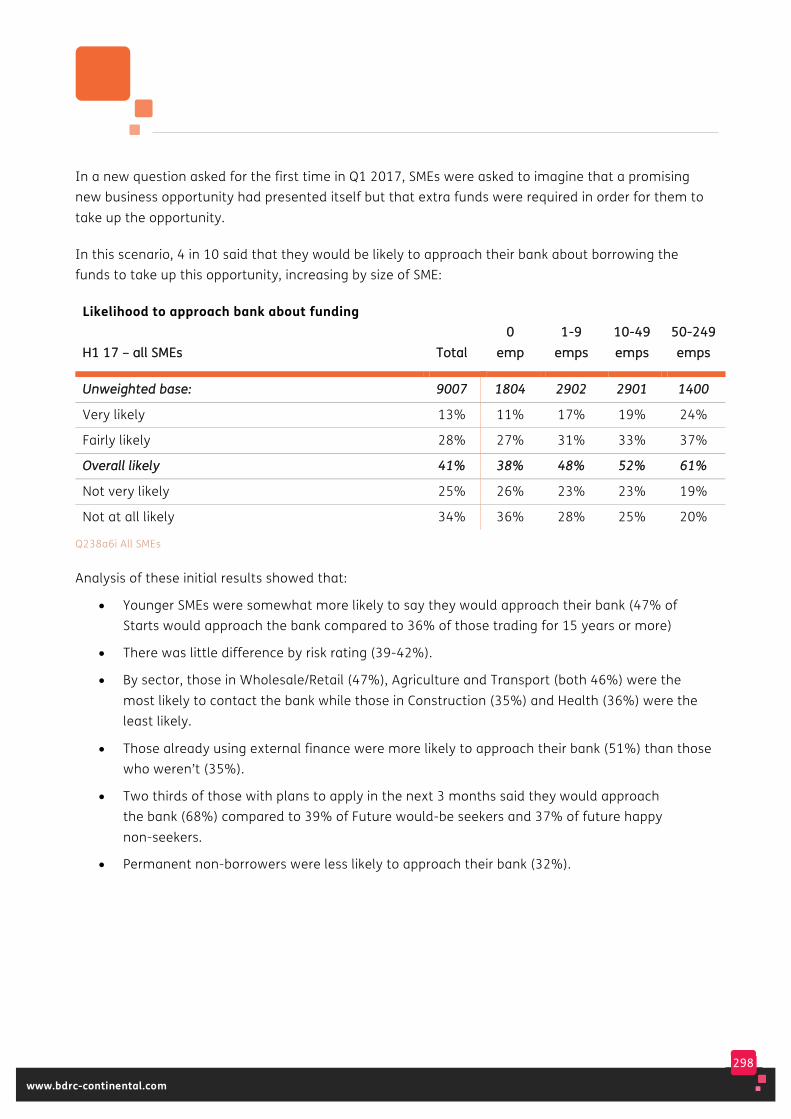
298
www.bdrc-continental.com
In a new question asked for the first time in Q1 2017, SMEs were asked to imagine that a promising new business opportunity had presented itself but that extra funds were required in order for them to take up the opportunity.
In this scenario, 4 in 10 said that they would be likely to approach their bank about borrowing the funds to take up this opportunity, increasing by size of SME:
Likelihood to approach bank about funding
HH11 1177 –– aallll SSMMEEss TToottaall 00
eemmpp 11--99
eemmppss 1100--4499 eemmppss
5500--224499 eemmppss
UUnnwweeiigghhtteedd bbaassee:: 99000077 11880044 22990022 22990011 11440000
Very likely 13% 11% 17% 19% 24%
Fairly likely 28% 27% 31% 33% 37%
OOvveerraallll lliikkeellyy 4411%% 3388%% 4488%% 5522%% 6611%%
Not very likely 25% 26% 23% 23% 19%
Not at all likely 34% 36% 28% 25% 20%
Q238a6i All SMEs
Analysis of these initial results showed that:
• Younger SMEs were somewhat more likely to say they would approach their bank (47% of Starts would approach the bank compared to 36% of those trading for 15 years or more)
• There was little difference by risk rating (39-42%).
• By sector, those in Wholesale/Retail (47%), Agriculture and Transport (both 46%) were the most likely to contact the bank while those in Construction (35%) and Health (36%) were the least likely.
• Those already using external finance were more likely to approach their bank (51%) than those who weren’t (35%).
• Two thirds of those with plans to apply in the next 3 months said they would approach the bank (68%) compared to 39% of Future would-be seekers and 37% of future happy non-seekers.
• Permanent non-borrowers were less likely to approach their bank (32%).
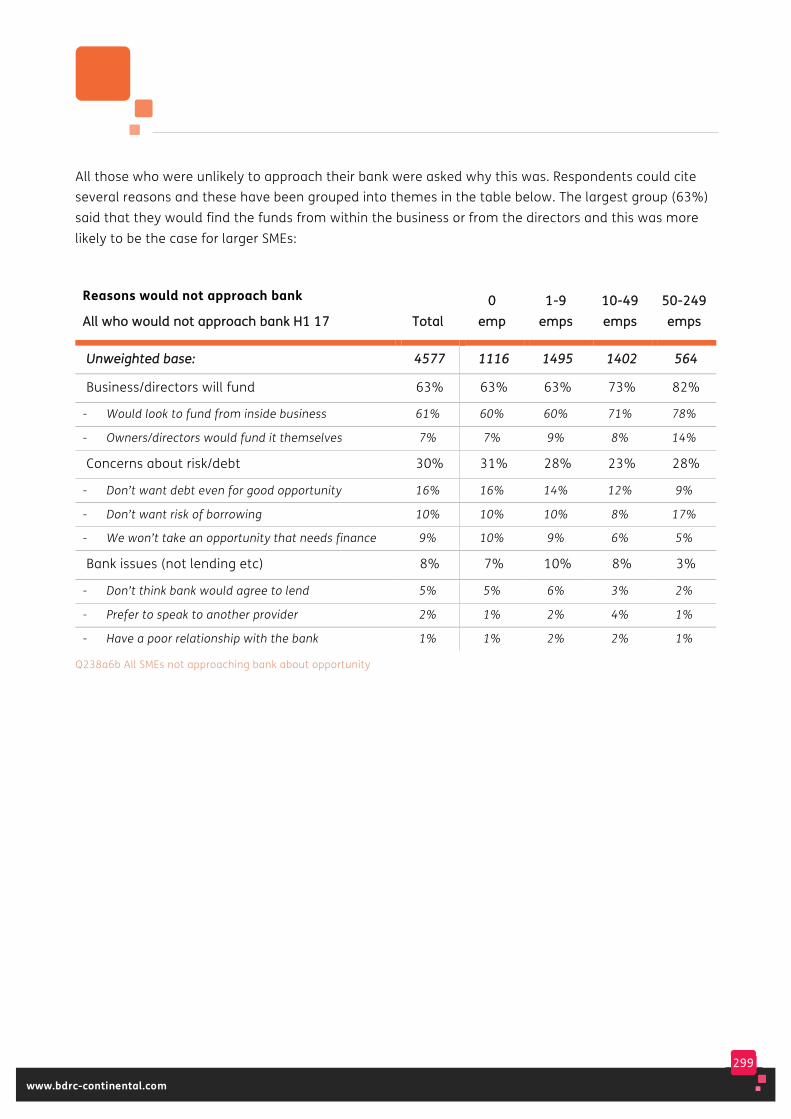
299
www.bdrc-continental.com
All those who were unlikely to approach their bank were asked why this was. Respondents could cite several reasons and these have been grouped into themes in the table below. The largest group (63%) said that they would find the funds from within the business or from the directors and this was more likely to be the case for larger SMEs:
Reasons would not approach bank
AAllll wwhhoo wwoouulldd nnoott aapppprrooaacchh bbaannkk HH11 1177 TToottaall 00
eemmpp 11--99
eemmppss 1100--4499 eemmppss
5500--224499 eemmppss
UUnnwweeiigghhtteedd bbaassee:: 44557777 11111166 11449955 11440022 556644
Business/directors will fund 63% 63% 63% 73% 82%
- Would look to fund from inside business 61% 60% 60% 71% 78%
- Owners/directors would fund it themselves 7% 7% 9% 8% 14%
Concerns about risk/debt 30% 31% 28% 23% 28%
- Don’t want debt even for good opportunity 16% 16% 14% 12% 9%
- Don’t want risk of borrowing 10% 10% 10% 8% 17%
- We won’t take an opportunity that needs finance 9% 10% 9% 6% 5%
Bank issues (not lending etc) 8% 7% 10% 8% 3%
- Don’t think bank would agree to lend 5% 5% 6% 3% 2%
- Prefer to speak to another provider 2% 1% 2% 4% 1%
- Have a poor relationship with the bank 1% 1% 2% 2% 1%
Q238a6b All SMEs not approaching bank about opportunity

300
www.bdrc-continental.com
The table below summarises these key themes and also includes those likely to approach the bank, to give an overall view across all SMEs. It shows smaller SMEs more concerned about risk or taking on debt and so not approaching the bank. Amongst the largest SMEs most of those not planning to approach the bank said that they would self-fund:
Likelihood to approach bank about funding
HH11 1177 –– aallll SSMMEEss TToottaall 00
eemmpp 11--99
eemmppss 1100--4499 eemmppss
5500--224499 eemmppss
UUnnwweeiigghhtteedd bbaassee:: 99000077 11880044 22990022 22990011 11440000
Likely to approach bank 41% 38% 48% 52% 61%
Unlikely - Business/directors will fund 38% 39% 33% 35% 32%
Unlikely - Concerns about risk/debt 18% 19% 14% 11% 11%
Unlikely - Bank issues (not lending etc) 5% 5% 5% 4% 1%
Q238a6i All SMEs
Self-funding was also more likely amongst those with a better external risk rating (44% of those with a minimal risk rating v 36% of those with a worse than average rating).
As the table below shows, the older the SME, the more likely they were to nominate self-funding and the less likely they were to think they would approach their bank. Concerns about risk, or about the bank, varied very little by age:
HH11 1177 –– aallll SSMMEEss SSttaarrttss 22--55
yyeeaarrss 66--99
yyeeaarrss 1100--1155 yyeeaarrss
1155 yyeeaarrss++
UUnnwweeiigghhtteedd bbaassee:: 990022 886611 993355 11550033 44880066
Likely to approach bank 47% 45% 40% 41% 36%
Unlikely – Business/directors will fund 31% 35% 41% 39% 41%
Unlikely – Concerns about risk/debt 18% 16% 20% 18% 18%
Unlikely – Bank issues (not lending etc) 6% 6% 3% 2% 5%
Q238a6i All SMEs
Those not currently using any external finance and those expecting to be a Future happy non-seeker were more likely to self-fund (both 42%) than Future would-be seekers (28%) or those already planning to apply for finance (17%).
The proportion planning to self-fund did not vary greatly by sector (31-40%).
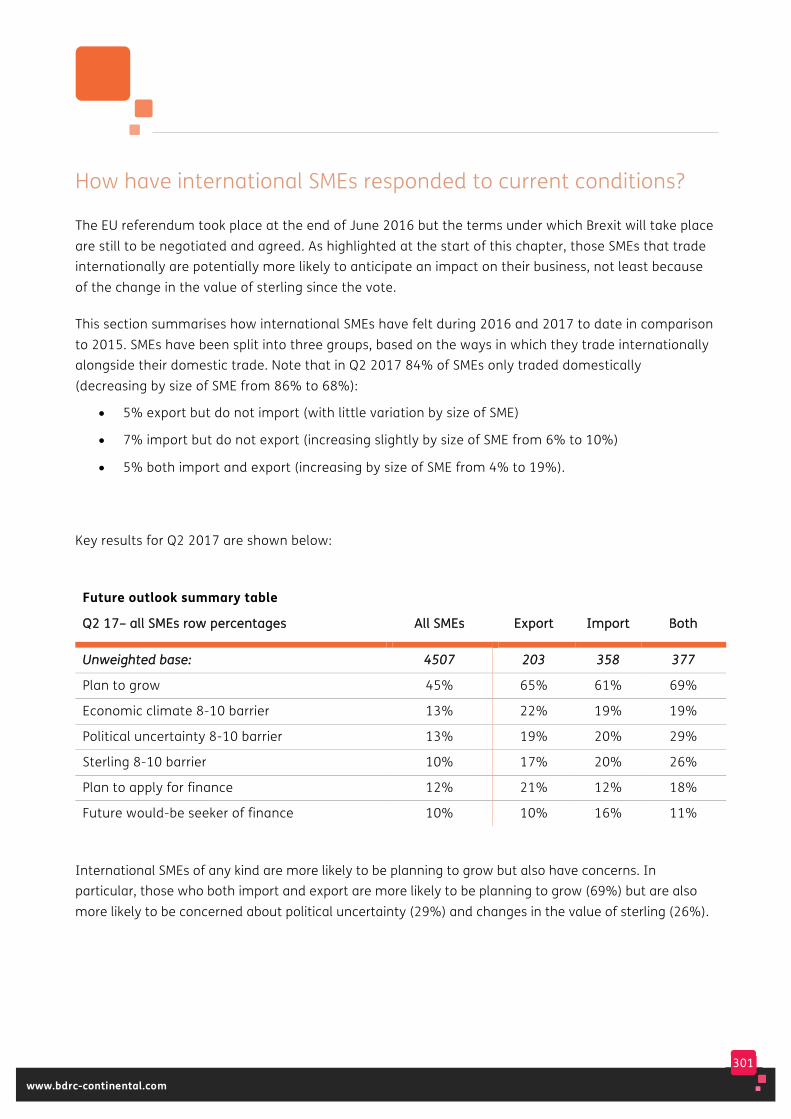
301
www.bdrc-continental.com
How have international SMEs responded to current conditions?
The EU referendum took place at the end of June 2016 but the terms under which Brexit will take place are still to be negotiated and agreed. As highlighted at the start of this chapter, those SMEs that trade internationally are potentially more likely to anticipate an impact on their business, not least because of the change in the value of sterling since the vote.
This section summarises how international SMEs have felt during 2016 and 2017 to date in comparison to 2015. SMEs have been split into three groups, based on the ways in which they trade internationally alongside their domestic trade. Note that in Q2 2017 84% of SMEs only traded domestically (decreasing by size of SME from 86% to 68%):
• 5% export but do not import (with little variation by size of SME)
• 7% import but do not export (increasing slightly by size of SME from 6% to 10%)
• 5% both import and export (increasing by size of SME from 4% to 19%).
Key results for Q2 2017 are shown below:
Future outlook summary table
QQ22 1177–– aallll SSMMEEss rrooww ppeerrcceennttaaggeess AAllll SSMMEEss EExxppoorrtt IImmppoorrtt BBootthh
UUnnwweeiigghhtteedd bbaassee:: 44550077 220033 335588 337777
Plan to grow 45% 65% 61% 69%
Economic climate 8-10 barrier 13% 22% 19% 19%
Political uncertainty 8-10 barrier 13% 19% 20% 29%
Sterling 8-10 barrier 10% 17% 20% 26%
Plan to apply for finance 12% 21% 12% 18%
Future would-be seeker of finance 10% 10% 16% 11%
International SMEs of any kind are more likely to be planning to grow but also have concerns. In particular, those who both import and export are more likely to be planning to grow (69%) but are also more likely to be concerned about political uncertainty (29%) and changes in the value of sterling (26%).

302
www.bdrc-continental.com
The tables below show how these views have changed over different time periods. The first shows that compared to the end of 2016, exporters in 2017 were more likely to be planning to grow and/or apply for finance, all international SMEs are more concerned about the economic climate and those who both import and export have more concerns about political uncertainty and the value of sterling:
Future outlook summary table
OOvveerr ttiimmee –– aallll SSMMEEss QQ11 1166 QQ22 1166 QQ33 1166 QQ44 1166 QQ11 1177 QQ22 1177
PPllaann ttoo ggrrooww
• All SMEs 45% 41% 41% 47% 43% 45%
• Export only 48% 52% 54% 40% 52% 65%
• Import only 63% 59% 59% 70% 65% 61%
• Import and export 70% 66% 70% 75% 67% 69%
PPllaann ttoo aappppllyy ffoorr ffiinnaannccee
• All SMEs 14% 11% 11% 11% 10% 12%
• Export only 18% 19% 21% 16% 10% 21%
• Import only 24% 18% 19% 17% 13% 12%
• Import and export 26% 31% 22% 18% 18% 18%
EEccoonnoommiicc cclliimmaattee 88--1100 bbaarrrriieerr
• All SMEs 13% 13% 10% 13% 11% 13%
• Export only 9% 19% 13% 27% 14% 22%
• Import only 10% 13% 18% 24% 10% 19%
• Import and export 13% 20% 20% 35% 18% 19%
PPoolliittiiccaall uunncceerrttaaiinnttyy 88--1100 bbaarrrriieerr
• All SMEs 10% 10% 10% 12% 14% 13%
• Export only 7% 7% 12% 15% 25% 19%
• Import only 14% 7% 16% 26% 19% 20%
• Import and export 10% 19% 21% 32% 21% 29%
CChhaannggeess iinn sstteerrlliinngg 88--1100 bbaarrrriieerr
• All SMEs - - - - 11% 10%
• Export only - - - - 16% 17%
• Import only - - - - 25% 20%
• Import and export - - - - 27% 26%
303
www.bdrc-continental.com
The second table takes a longer term view back to 2013 where data exists. This shows the following patterns:
• EExxppoorrtteerrss have always been more likely to be planning to grow than SMEs generally but ambition dipped in 2016, before recovering in H1 2017. Their appetite for finance peaked at 22% in 2015 but is currently 15%, only slightly ahead of the market. They have become increasingly worried about political uncertainty, but concerns about the economic climate are currently stable
• IImmppoorrtteerrss have also always been more likely to be planning to grow than SMEs generally, and a stable 6 in 10 have been planning to grow. Their appetite for finance has declined since 2014 and is currently in line with SMEs overall. Levels of concern about both the economic climate and political uncertainty are currently stable
• TThhoossee wwhhoo iimmppoorrtt aanndd eexxppoorrtt have also always been more likely to be planning to grow than SMEs generally, and since 2014 a stable 7 in 10 have been planning to grow. They have more of an appetite for finance than SMEs generally but it has varied over time and is somewhat lower in H1 2017 than in 2016. Like exporting SMEs, their concern about political uncertainty continues to increase but levels of concern about the economic climate are currently stable.

304
www.bdrc-continental.com
Future outlook summary table
OOvveerr ttiimmee –– aallll SSMMEEss 22001133 22001144 22001155 22001166 HH11
22001177
PPllaann ttoo ggrrooww
• All SMEs 49% 47% 45% 43% 44%
• Export only 54% 56% 59% 49% 58%
• Import only 63% 65% 62% 63% 63%
• Import and export 66% 69% 72% 70% 68%
PPllaann ttoo aappppllyy ffoorr ffiinnaannccee
• All SMEs 14% 13% 13% 12% 11%
• Export only 19% 20% 22% 19% 15%
• Import only 19% 24% 19% 19% 12%
• Import and export 21% 24% 19% 25% 18%
EEccoonnoommiicc cclliimmaattee 88--1100 bbaarrrriieerr
• All SMEs 27% 17% 13% 12% 12%
• Export only 29% 14% 19% 17% 18%
• Import only 26% 20% 12% 16% 15%
• Import and export 24% 15% 17% 21% 19%
PPoolliittiiccaall uunncceerrttaaiinnttyy 88--1100 bbaarrrriieerr
• All SMEs - - 9% 10% 14%
• Export only - - 9% 10% 22%
• Import only - - 11% 16% 20%
• Import and export - - 8% 20% 25%
305
www.bdrc-continental.com
As reported earlier, from Q3 2016 exporters have been asked the extent to which they sell to the EU. Analysis for H1 2017 shows that those who make all or the majority of their international sales to the EU are more concerned than other exporters:
• 37% of those who make all or the majority of their international sales to the EU nominate political uncertainty as a major barrier (compared to 18% of those making some sales to the EU and 19% of those making no sales).
• 35% of those who make all or the majority of their international sales to the EU nominate changes in the value of sterling as a major barrier (compared to 18% of those making some sales to the EU and 9% of those making no sales).
• 29% of those who make all or the majority of their international sales to the EU nominate the current economic climate as a major barrier (compared to 14% of those making either some or no sales to the EU).
• 12% of those who make all or the majority of their international sales to the EU plan to apply for finance (compared to 17% of those making some sales to the EU and 21% of those making no sales).
• 57% of those who make all or the majority of their international sales to the EU expect to grow (compared to 68% of those making some sales to the EU and 57% of those making no sales).
More analysis will be provided as base sizes increase.

306
www.bdrc-continental.com
14. Awareness of taskforce and other initiatives
This final section of the report looks at awareness amongst SMEs of some of the Business Finance Taskforce commitments, together with other relevant initiatives.
307
www.bdrc-continental.com
Key findings Half of all SMEs (55%) were aware of one or more of the initiatives tested, increasing slightly by size of SME (54% of those with 0 employees to 68% of those with 50-249 employees).
• Awareness remained highest for Start-up Loans (39% in Q2 2017)
• Awareness of the new referral platforms was 7% in Q2 2017
• 7% of SMEs were aware of the appeals process in Q2 2017. Since 2015, awareness of the appeals process has declined slightly amongst all SMEs (from 14% in 2015 to 8% for the first half of 2017) and also amongst those using, or planning to apply for, finance.
In the first half of 2017, 38% of SMEs (excluding the PNBs) had heard of either equity based crowd funding (31%) or peer to peer lending (27%). 22% had heard of Business Angels. Awareness increased somewhat by size of SME.
• Use of crowd funding remained very limited, while 1 in 10 would consider using it in future
• Awareness and consideration of crowd funding were somewhat lower in the first half of 2017 than in recent years, which may be partly as a result of a change to the way in which the question is asked.
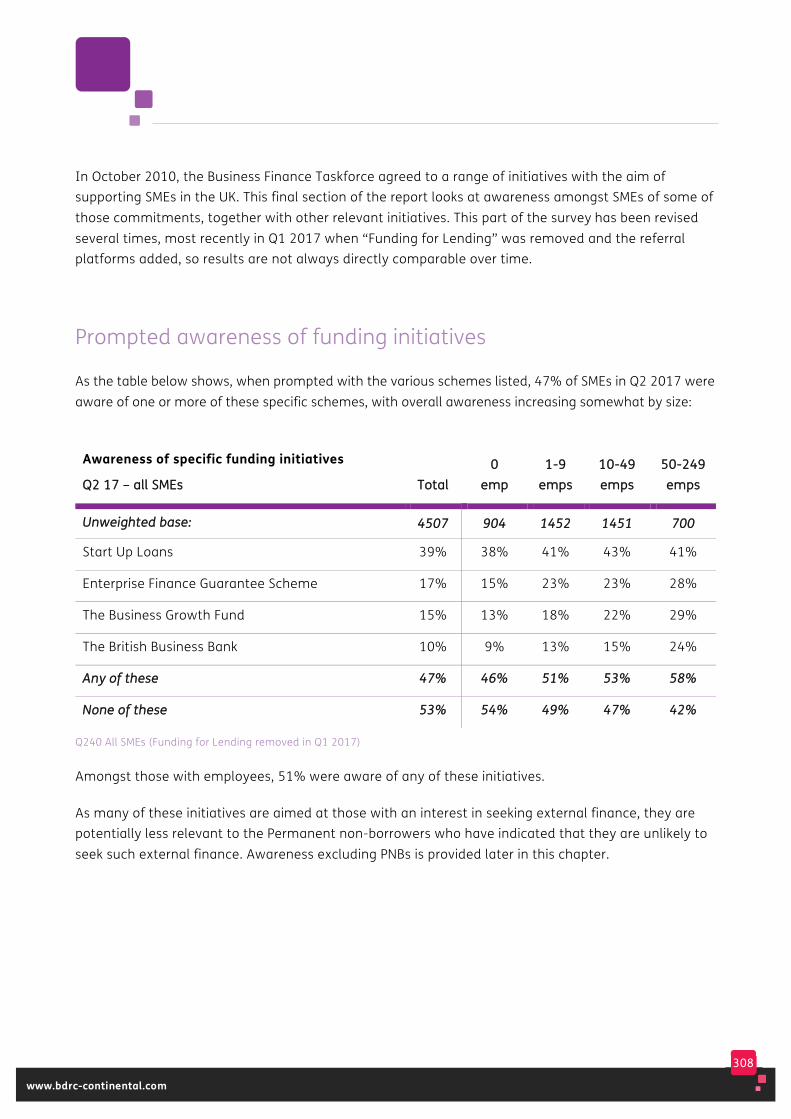
308
www.bdrc-continental.com
In October 2010, the Business Finance Taskforce agreed to a range of initiatives with the aim of supporting SMEs in the UK. This final section of the report looks at awareness amongst SMEs of some of those commitments, together with other relevant initiatives. This part of the survey has been revised several times, most recently in Q1 2017 when “Funding for Lending” was removed and the referral platforms added, so results are not always directly comparable over time.
Prompted awareness of funding initiatives
As the table below shows, when prompted with the various schemes listed, 47% of SMEs in Q2 2017 were aware of one or more of these specific schemes, with overall awareness increasing somewhat by size:
Awareness of specific funding initiatives
QQ22 1177 –– aallll SSMMEEss TToottaall 00
eemmpp 11--99
eemmppss 1100--4499 eemmppss
5500--224499 eemmppss
UUnnwweeiigghhtteedd bbaassee:: 44550077 990044 11445522 11445511 770000
Start Up Loans 39% 38% 41% 43% 41%
Enterprise Finance Guarantee Scheme 17% 15% 23% 23% 28%
The Business Growth Fund 15% 13% 18% 22% 29%
The British Business Bank 10% 9% 13% 15% 24%
AAnnyy ooff tthheessee 4477%% 4466%% 5511%% 5533%% 5588%%
NNoonnee ooff tthheessee 5533%% 5544%% 4499%% 4477%% 4422%%
Q240 All SMEs (Funding for Lending removed in Q1 2017)
Amongst those with employees, 51% were aware of any of these initiatives.
As many of these initiatives are aimed at those with an interest in seeking external finance, they are potentially less relevant to the Permanent non-borrowers who have indicated that they are unlikely to seek such external finance. Awareness excluding PNBs is provided later in this chapter.
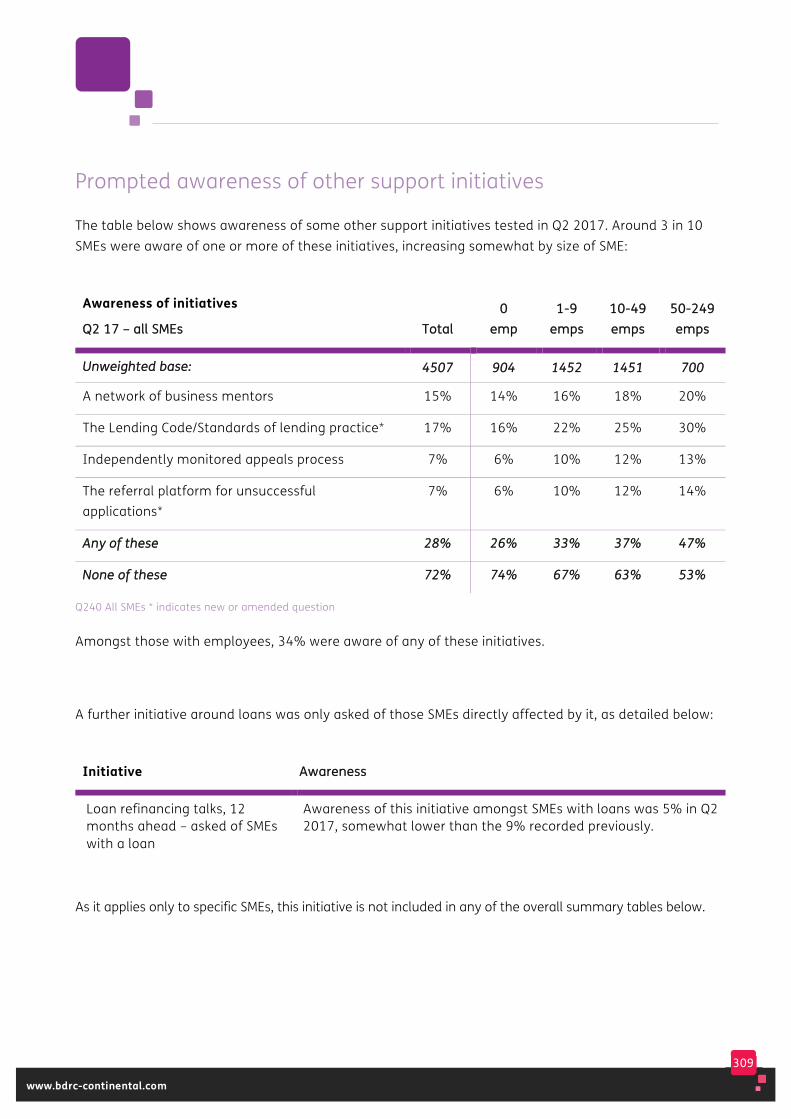
309
www.bdrc-continental.com
Prompted awareness of other support initiatives
The table below shows awareness of some other support initiatives tested in Q2 2017. Around 3 in 10 SMEs were aware of one or more of these initiatives, increasing somewhat by size of SME:
Awareness of initiatives
QQ22 1177 –– aallll SSMMEEss TToottaall 00
eemmpp 11--99
eemmppss 1100--4499 eemmppss
5500--224499 eemmppss
UUnnwweeiigghhtteedd bbaassee:: 44550077 990044 11445522 11445511 770000
A network of business mentors 15% 14% 16% 18% 20%
The Lending Code/Standards of lending practice* 17% 16% 22% 25% 30%
Independently monitored appeals process 7% 6% 10% 12% 13%
The referral platform for unsuccessful applications*
7% 6% 10% 12% 14%
AAnnyy ooff tthheessee 2288%% 2266%% 3333%% 3377%% 4477%%
NNoonnee ooff tthheessee 7722%% 7744%% 6677%% 6633%% 5533%%
Q240 All SMEs * indicates new or amended question
Amongst those with employees, 34% were aware of any of these initiatives.
A further initiative around loans was only asked of those SMEs directly affected by it, as detailed below:
Initiative AAwwaarreenneessss
Loan refinancing talks, 12 months ahead – asked of SMEs with a loan
Awareness of this initiative amongst SMEs with loans was 5% in Q2 2017, somewhat lower than the 9% recorded previously.
As it applies only to specific SMEs, this initiative is not included in any of the overall summary tables below.
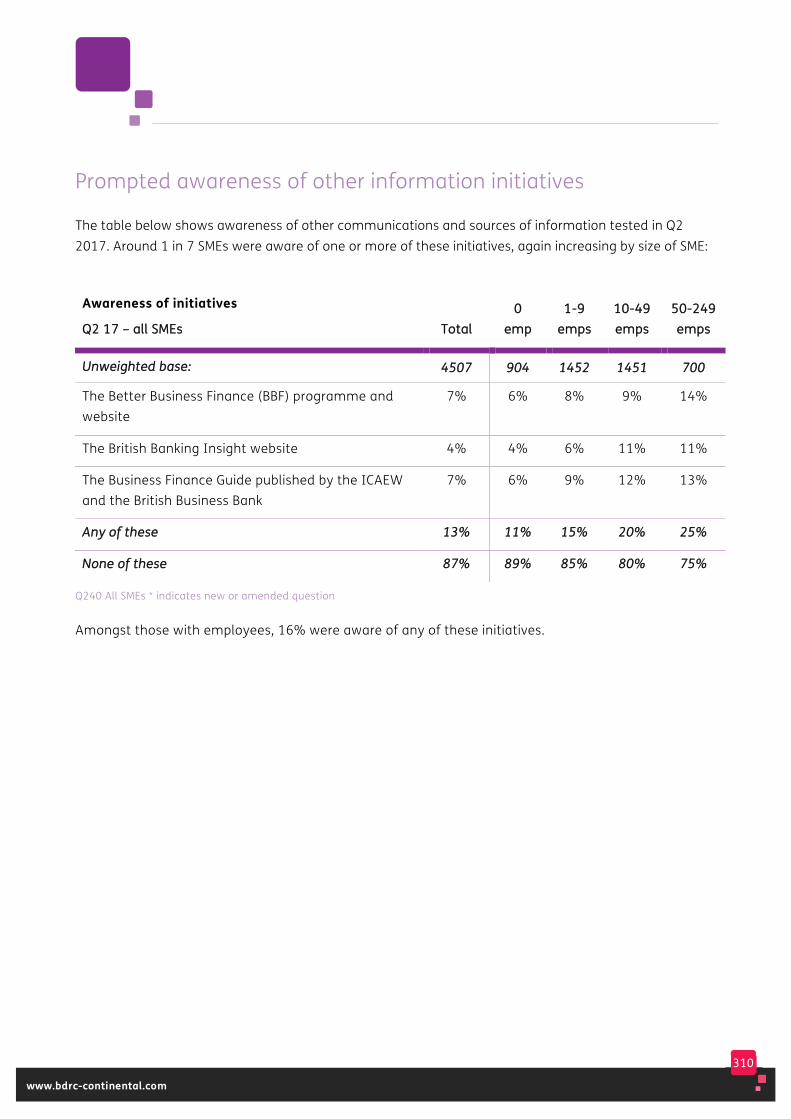
310
www.bdrc-continental.com
Prompted awareness of other information initiatives
The table below shows awareness of other communications and sources of information tested in Q2 2017. Around 1 in 7 SMEs were aware of one or more of these initiatives, again increasing by size of SME:
Awareness of initiatives
QQ22 1177 –– aallll SSMMEEss TToottaall 00
eemmpp 11--99
eemmppss 1100--4499 eemmppss
5500--224499 eemmppss
UUnnwweeiigghhtteedd bbaassee:: 44550077 990044 11445522 11445511 770000
The Better Business Finance (BBF) programme and website
7% 6% 8% 9% 14%
The British Banking Insight website 4% 4% 6% 11% 11%
The Business Finance Guide published by the ICAEW and the British Business Bank
7% 6% 9% 12% 13%
AAnnyy ooff tthheessee 1133%% 1111%% 1155%% 2200%% 2255%%
NNoonnee ooff tthheessee 8877%% 8899%% 8855%% 8800%% 7755%%
Q240 All SMEs * indicates new or amended question
Amongst those with employees, 16% were aware of any of these initiatives.
311
www.bdrc-continental.com
Awareness of all initiatives by key groups
55% of all SMEs in Q2 2017 were aware of one or more of these initiatives after prompting. This is lower than the 64% in Q4 2016, but reflects changes made to the questionnaire (In Q4 2016, 29% were aware of Funding for Lending which is no longer included in this question).
Total awareness increased slightly by size of SME:
• 54% of SMEs with no employees were aware of any of these initiatives
• 59% of those with 1-9 employees were aware of any of these initiatives
• 62% of those with 10-49 employees were aware of any of these initiatives
• 68% of SMEs with 50-249 employees were aware of any of these initiatives.
Excluding the PNBs increased overall awareness slightly to 59%.
There was relatively little variation in overall awareness by age of business (53-57%).
Those currently using external finance were more likely to be aware (61%) than those not using finance (51%), as were those planning to apply in the next 3 months (59%, compared to 50% of Future would-be seekers and 55% of Future happy non-seekers).

312
www.bdrc-continental.com
The table below details awareness by sector of all the initiatives tested in Q2 2017. Overall awareness varied from 45% for Construction to 61% for the Property/Business Services and Health sectors:
% aware of initiatives
QQ22 1177 –– aallll SSMMEEss AAggrriicc MMffgg CCoonnssttrr WWhhllee RReettaaiill
HHootteell RReesstt TTrraannss
PPrroopp// BBuuss
HHlltthh SSWWrrkk
OOtthheerr CCoommmm
UUnnwweeiigghhtteedd bbaassee:: 330022 337766 880000 445500 330000 550022 990022 337755 550000
Start Up Loans 42% 43% 33% 39% 40% 41% 38% 43% 44%
A network of business mentors
15% 15% 11% 14% 15% 12% 17% 13% 19%
The Lending Code 14% 17% 16% 18% 19% 11% 19% 20% 22%
Enterprise Finance Guarantee Scheme
17% 19% 13% 20% 19% 16% 20% 12% 20%
The Business Growth Fund 15% 15% 12% 13% 18% 13% 16% 12% 21%
Independently monitored appeals process
7% 9% 5% 9% 9% 3% 7% 3% 12%
Referral platform 2% 7% 5% 11% 6% 7% 8% 5% 9%
The British Business Bank 13% 9% 8% 12% 14% 9% 9% 12% 11%
BetterBusinessFinance.co.uk 4% 9% 2% 8% 8% 8% 7% 11% 7%
The BBI website* 5% 5% 2% 8% 5% 6% 2% 8% 5%
The Business Finance Guide*
9% 9% 4% 6% 9% 6% 8% 8% 8%
AAnnyy ooff tthheessee 5511%% 5588%% 4455%% 5555%% 5577%% 5500%% 6611%% 6611%% 5599%%
NNoonnee ooff tthheessee 4499%% 4422%% 5555%% 4455%% 4433%% 5500%% 3399%% 3399%% 4411%%
Q240 All SMEs * indicates new or amended question
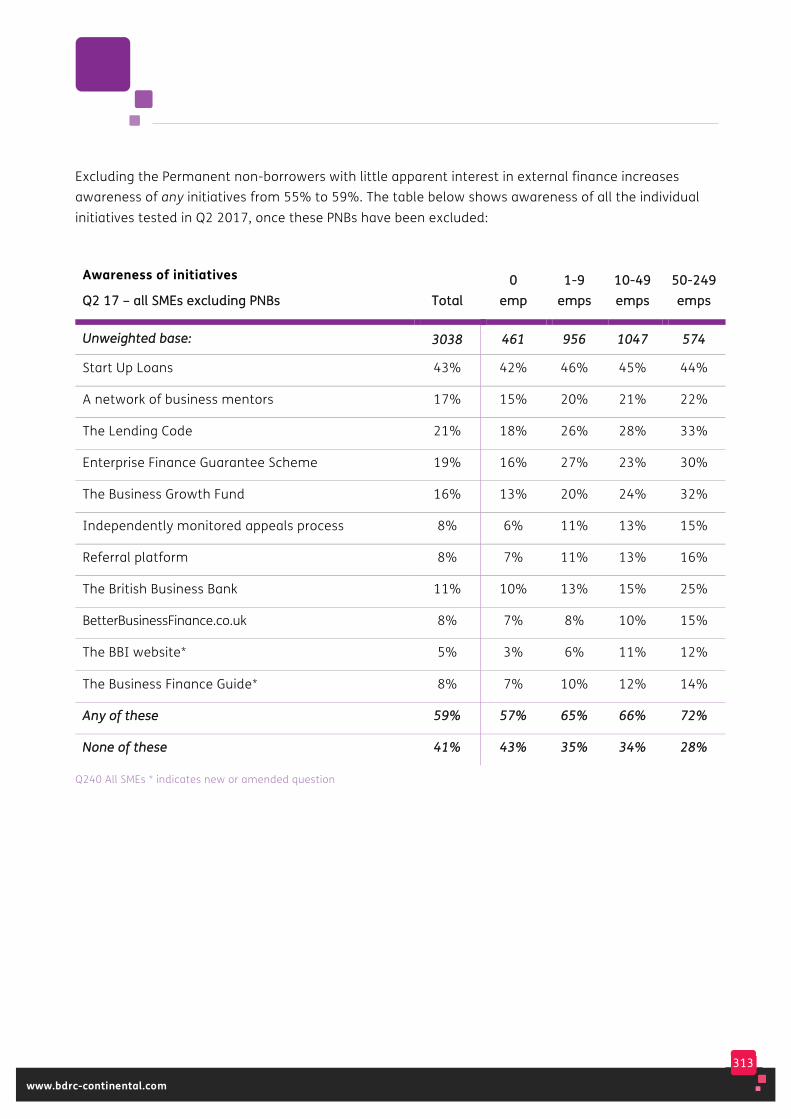
313
www.bdrc-continental.com
Excluding the Permanent non-borrowers with little apparent interest in external finance increases awareness of any initiatives from 55% to 59%. The table below shows awareness of all the individual initiatives tested in Q2 2017, once these PNBs have been excluded:
Awareness of initiatives
QQ22 1177 –– aallll SSMMEEss eexxcclluuddiinngg PPNNBBss TToottaall 00
eemmpp 11--99
eemmppss 1100--4499 eemmppss
5500--224499 eemmppss
UUnnwweeiigghhtteedd bbaassee:: 33003388 446611 995566 11004477 557744
Start Up Loans 43% 42% 46% 45% 44%
A network of business mentors 17% 15% 20% 21% 22%
The Lending Code 21% 18% 26% 28% 33%
Enterprise Finance Guarantee Scheme 19% 16% 27% 23% 30%
The Business Growth Fund 16% 13% 20% 24% 32%
Independently monitored appeals process 8% 6% 11% 13% 15%
Referral platform 8% 7% 11% 13% 16%
The British Business Bank 11% 10% 13% 15% 25%
BetterBusinessFinance.co.uk 8% 7% 8% 10% 15%
The BBI website* 5% 3% 6% 11% 12%
The Business Finance Guide* 8% 7% 10% 12% 14%
AAnnyy ooff tthheessee 5599%% 5577%% 6655%% 6666%% 7722%%
NNoonnee ooff tthheessee 4411%% 4433%% 3355%% 3344%% 2288%%
Q240 All SMEs * indicates new or amended question
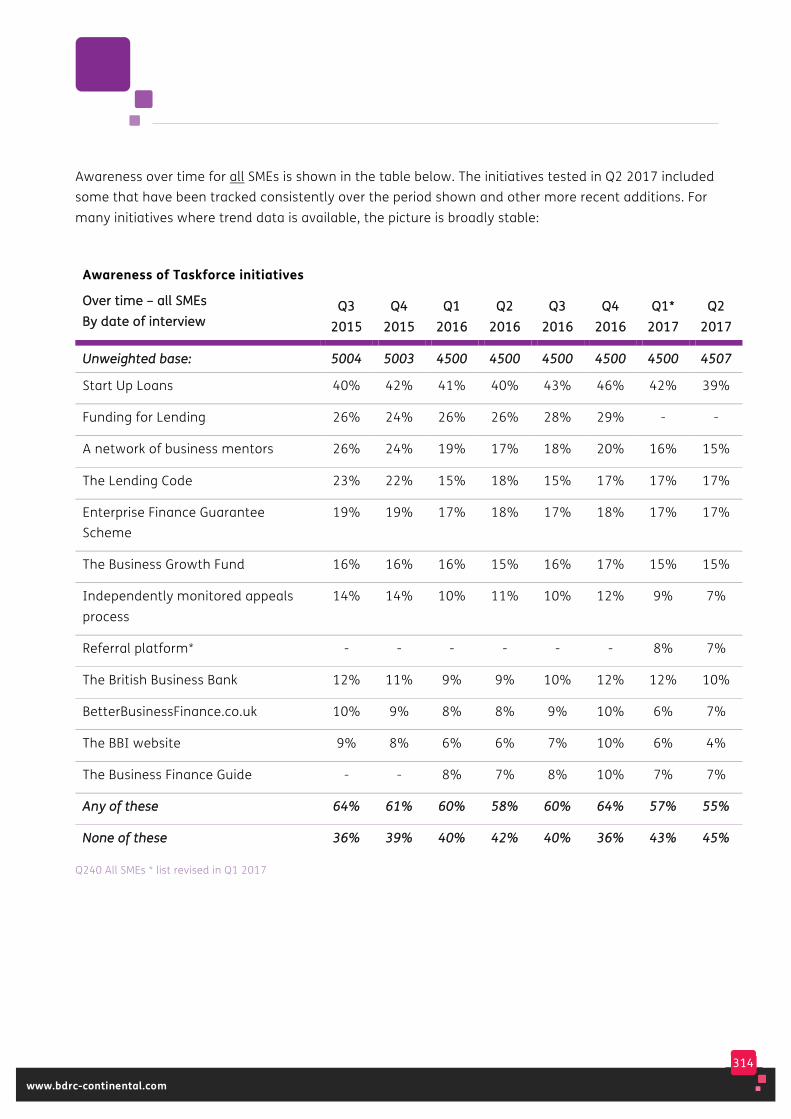
314
www.bdrc-continental.com
Awareness over time for all SMEs is shown in the table below. The initiatives tested in Q2 2017 included some that have been tracked consistently over the period shown and other more recent additions. For many initiatives where trend data is available, the picture is broadly stable:
Awareness of Taskforce initiatives
OOvveerr ttiimmee –– aallll SSMMEEss BByy ddaattee ooff iinntteerrvviieeww
QQ33 22001155
QQ44 22001155
QQ11 22001166
QQ22 22001166
QQ33 22001166
QQ44 22001166
QQ11** 22001177
QQ22 22001177
UUnnwweeiigghhtteedd bbaassee:: 55000044 55000033 44550000 44550000 44550000 44550000 44550000 44550077
Start Up Loans 40% 42% 41% 40% 43% 46% 42% 39%
Funding for Lending 26% 24% 26% 26% 28% 29% - -
A network of business mentors 26% 24% 19% 17% 18% 20% 16% 15%
The Lending Code 23% 22% 15% 18% 15% 17% 17% 17%
Enterprise Finance Guarantee Scheme
19% 19% 17% 18% 17% 18% 17% 17%
The Business Growth Fund 16% 16% 16% 15% 16% 17% 15% 15%
Independently monitored appeals process
14% 14% 10% 11% 10% 12% 9% 7%
Referral platform* - - - - - - 8% 7%
The British Business Bank 12% 11% 9% 9% 10% 12% 12% 10%
BetterBusinessFinance.co.uk 10% 9% 8% 8% 9% 10% 6% 7%
The BBI website 9% 8% 6% 6% 7% 10% 6% 4%
The Business Finance Guide - - 8% 7% 8% 10% 7% 7%
AAnnyy ooff tthheessee 6644%% 6611%% 6600%% 5588%% 6600%% 6644%% 5577%% 5555%%
NNoonnee ooff tthheessee 3366%% 3399%% 4400%% 4422%% 4400%% 3366%% 4433%% 4455%%
Q240 All SMEs * list revised in Q1 2017
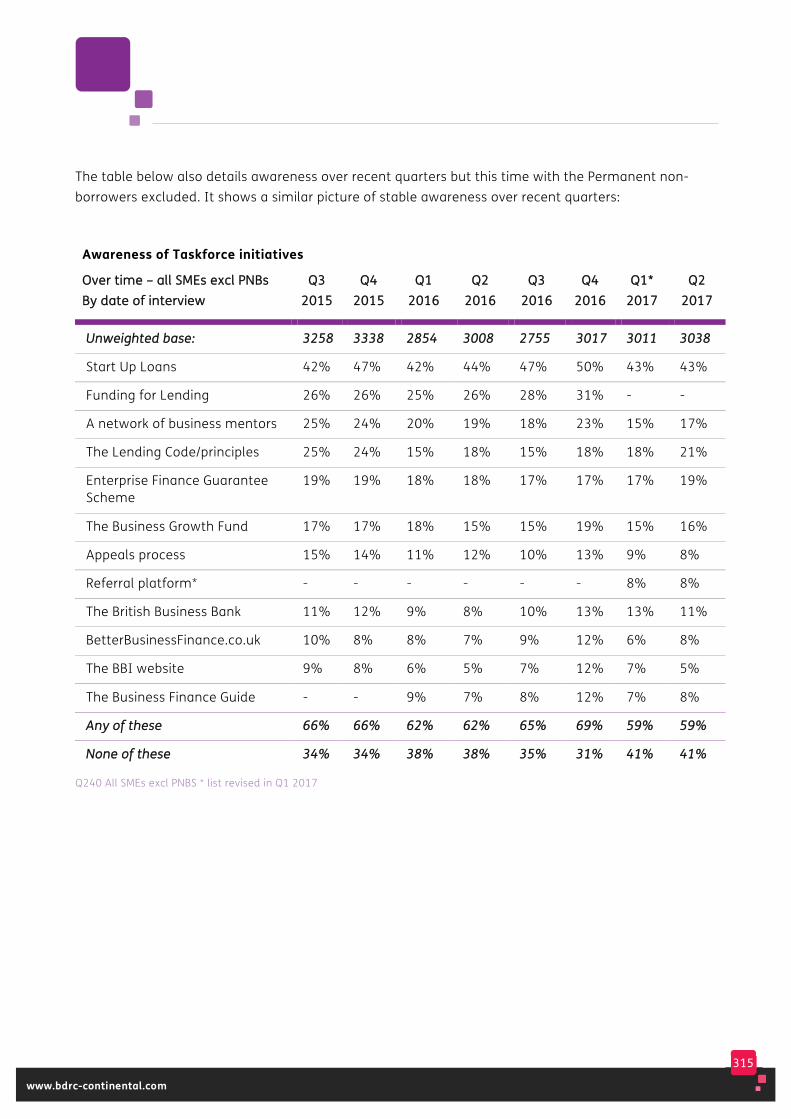
315
www.bdrc-continental.com
The table below also details awareness over recent quarters but this time with the Permanent non-borrowers excluded. It shows a similar picture of stable awareness over recent quarters:
Awareness of Taskforce initiatives
OOvveerr ttiimmee –– aallll SSMMEEss eexxccll PPNNBBss BByy ddaattee ooff iinntteerrvviieeww
QQ33 22001155
QQ44 22001155
QQ11 22001166
QQ22 22001166
QQ33 22001166
QQ44 22001166
QQ11** 22001177
QQ22 22001177
UUnnwweeiigghhtteedd bbaassee:: 33225588 33333388 22885544 33000088 22775555 33001177 33001111 33003388
Start Up Loans 42% 47% 42% 44% 47% 50% 43% 43%
Funding for Lending 26% 26% 25% 26% 28% 31% - -
A network of business mentors 25% 24% 20% 19% 18% 23% 15% 17%
The Lending Code/principles 25% 24% 15% 18% 15% 18% 18% 21%
Enterprise Finance Guarantee Scheme
19% 19% 18% 18% 17% 17% 17% 19%
The Business Growth Fund 17% 17% 18% 15% 15% 19% 15% 16%
Appeals process 15% 14% 11% 12% 10% 13% 9% 8%
Referral platform* - - - - - - 8% 8%
The British Business Bank 11% 12% 9% 8% 10% 13% 13% 11%
BetterBusinessFinance.co.uk 10% 8% 8% 7% 9% 12% 6% 8%
The BBI website 9% 8% 6% 5% 7% 12% 7% 5%
The Business Finance Guide - - 9% 7% 8% 12% 7% 8%
AAnnyy ooff tthheessee 6666%% 6666%% 6622%% 6622%% 6655%% 6699%% 5599%% 5599%%
NNoonnee ooff tthheessee 3344%% 3344%% 3388%% 3388%% 3355%% 3311%% 4411%% 4411%%
Q240 All SMEs excl PNBS * list revised in Q1 2017
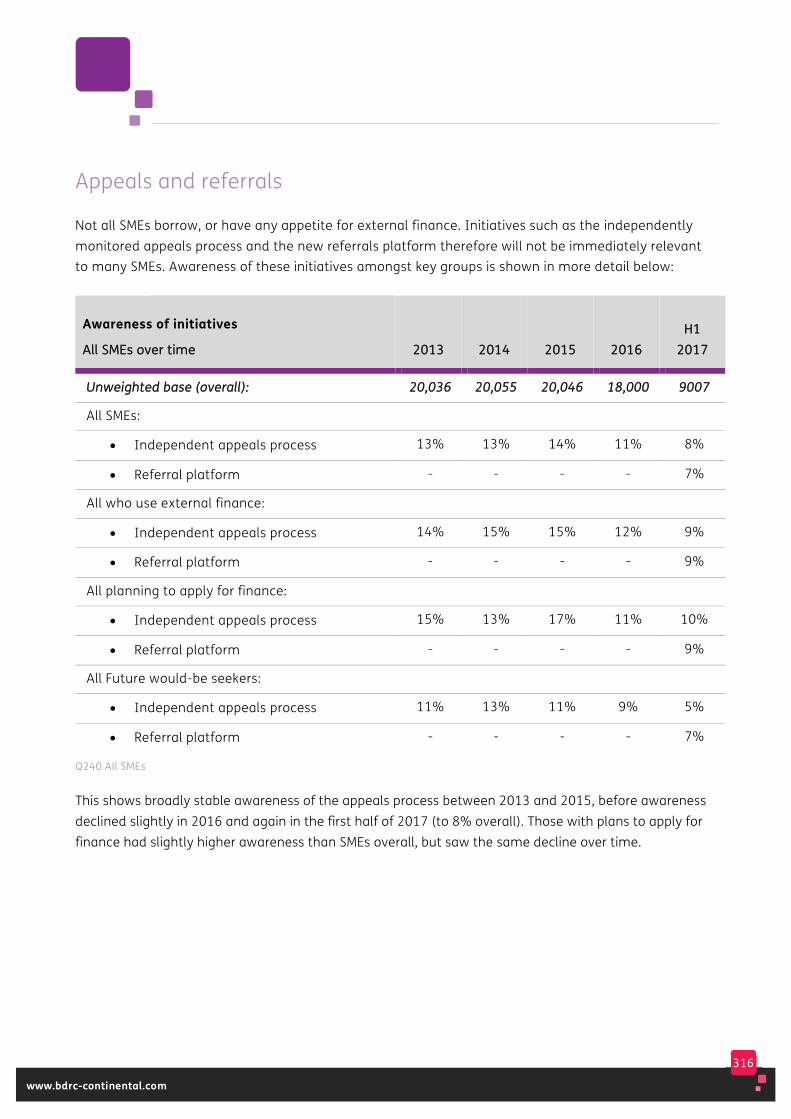
316
www.bdrc-continental.com
Appeals and referrals
Not all SMEs borrow, or have any appetite for external finance. Initiatives such as the independently monitored appeals process and the new referrals platform therefore will not be immediately relevant to many SMEs. Awareness of these initiatives amongst key groups is shown in more detail below:
Awareness of initiatives
AAllll SSMMEEss oovveerr ttiimmee 22001133 22001144 22001155 22001166 HH11
22001177
UUnnwweeiigghhtteedd bbaassee ((oovveerraallll)):: 2200,,003366 2200,,005555 2200,,004466 1188,,000000 99000077
All SMEs:
• Independent appeals process 13% 13% 14% 11% 8%
• Referral platform - - - - 7%
All who use external finance:
• Independent appeals process 14% 15% 15% 12% 9%
• Referral platform - - - - 9%
All planning to apply for finance:
• Independent appeals process 15% 13% 17% 11% 10%
• Referral platform - - - - 9%
All Future would-be seekers:
• Independent appeals process 11% 13% 11% 9% 5%
• Referral platform - - - - 7%
Q240 All SMEs
This shows broadly stable awareness of the appeals process between 2013 and 2015, before awareness declined slightly in 2016 and again in the first half of 2017 (to 8% overall). Those with plans to apply for finance had slightly higher awareness than SMEs overall, but saw the same decline over time.
317
www.bdrc-continental.com
Awareness of the appeals process amongst those reporting a past borrowing event followed a similar pattern to those planning to apply, with 16% aware in 2015, declining to 11% in H1 2017.
In H1 2017, 7% of all SMEs had heard of the referral platforms, with slightly higher awareness amongst those planning to apply (9%). As with appeals, those who had reported
a previous borrowing event were also more likely to be aware (11%).
12% of all SMEs in H1 2017 had heard of either the appeals process and/or the referral platforms. Those planning to apply were more likely to have heard of either of these (17%) as were those already using external finance (15%), or those who had applied for finance in the previous 12 months (18%).
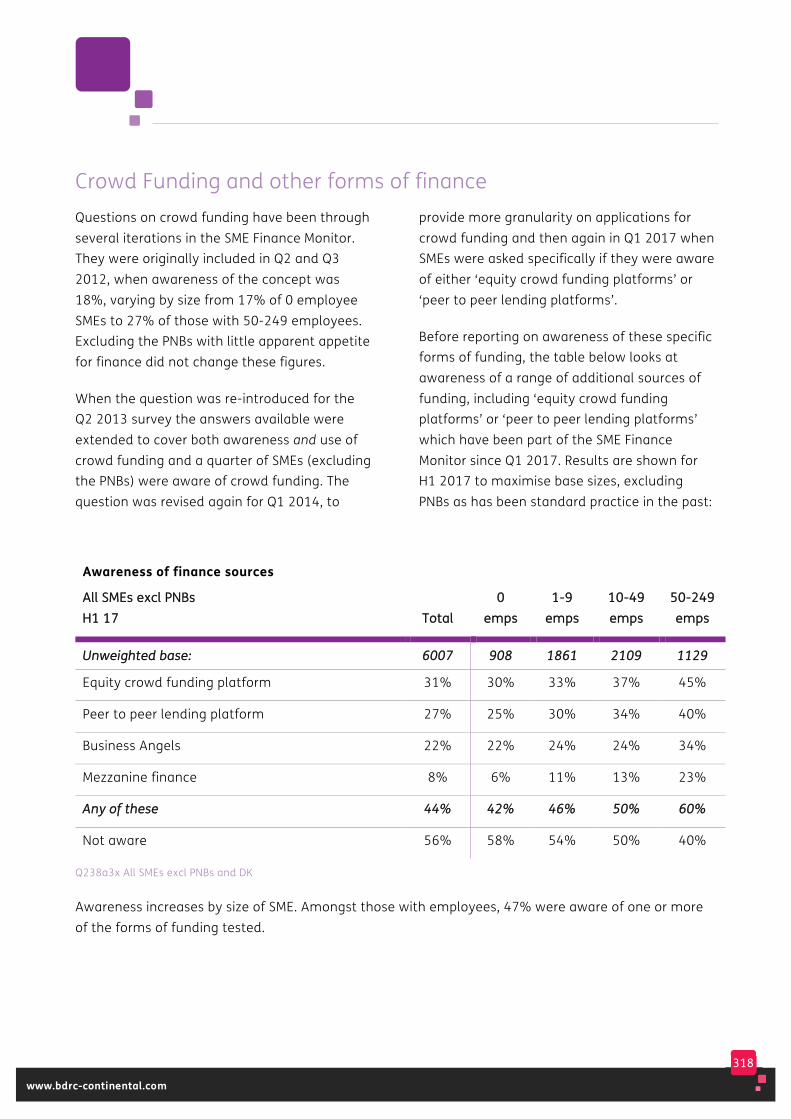
318
www.bdrc-continental.com
Crowd Funding and other forms of finance Questions on crowd funding have been through several iterations in the SME Finance Monitor. They were originally included in Q2 and Q3 2012, when awareness of the concept was 18%, varying by size from 17% of 0 employee SMEs to 27% of those with 50-249 employees. Excluding the PNBs with little apparent appetite for finance did not change these figures.
When the question was re-introduced for the Q2 2013 survey the answers available were extended to cover both awareness and use of crowd funding and a quarter of SMEs (excluding the PNBs) were aware of crowd funding. The question was revised again for Q1 2014, to
provide more granularity on applications for crowd funding and then again in Q1 2017 when SMEs were asked specifically if they were aware of either ‘equity crowd funding platforms’ or ‘peer to peer lending platforms’.
Before reporting on awareness of these specific forms of funding, the table below looks at awareness of a range of additional sources of funding, including ‘equity crowd funding platforms’ or ‘peer to peer lending platforms’ which have been part of the SME Finance Monitor since Q1 2017. Results are shown for H1 2017 to maximise base sizes, excluding PNBs as has been standard practice in the past:
Awareness of finance sources
AAllll SSMMEEss eexxccll PPNNBBss HH11 1177 TToottaall
00 eemmppss
11--99 eemmppss
1100--4499 eemmppss
5500--224499 eemmppss
UUnnwweeiigghhtteedd bbaassee:: 66000077 990088 11886611 22110099 11112299
Equity crowd funding platform 31% 30% 33% 37% 45%
Peer to peer lending platform 27% 25% 30% 34% 40%
Business Angels 22% 22% 24% 24% 34%
Mezzanine finance 8% 6% 11% 13% 23%
AAnnyy ooff tthheessee 4444%% 4422%% 4466%% 5500%% 6600%%
Not aware 56% 58% 54% 50% 40%
Q238a3x All SMEs excl PNBs and DK
Awareness increases by size of SME. Amongst those with employees, 47% were aware of one or more of the forms of funding tested.
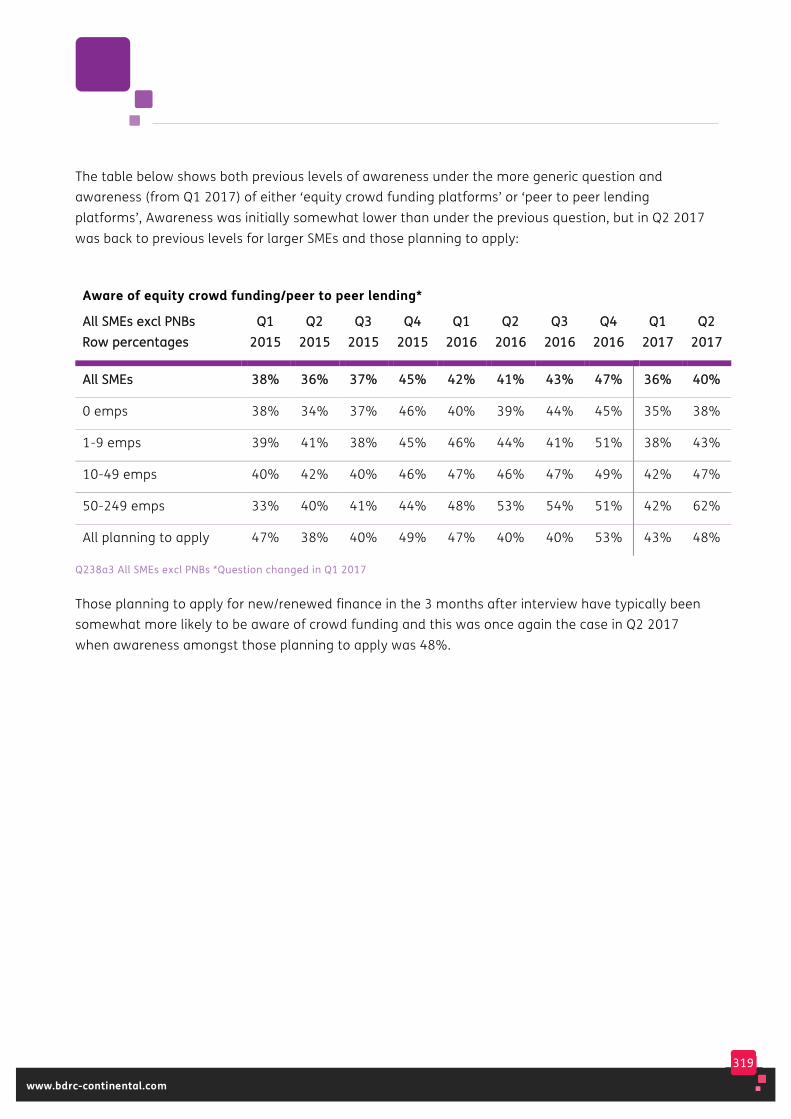
319
www.bdrc-continental.com
The table below shows both previous levels of awareness under the more generic question and awareness (from Q1 2017) of either ‘equity crowd funding platforms’ or ‘peer to peer lending platforms’, Awareness was initially somewhat lower than under the previous question, but in Q2 2017 was back to previous levels for larger SMEs and those planning to apply:
Aware of equity crowd funding/peer to peer lending*
AAllll SSMMEEss eexxccll PPNNBBss RRooww ppeerrcceennttaaggeess
QQ11 22001155
QQ22 22001155
QQ33 22001155
QQ44 22001155
QQ11 22001166
QQ22 22001166
QQ33 22001166
QQ44 22001166
QQ11 22001177
QQ22 22001177
AAllll SSMMEEss 3388%% 3366%% 3377%% 4455%% 4422%% 4411%% 4433%% 4477%% 3366%% 4400%%
0 emps 38% 34% 37% 46% 40% 39% 44% 45% 35% 38%
1-9 emps 39% 41% 38% 45% 46% 44% 41% 51% 38% 43%
10-49 emps 40% 42% 40% 46% 47% 46% 47% 49% 42% 47%
50-249 emps 33% 40% 41% 44% 48% 53% 54% 51% 42% 62%
All planning to apply 47% 38% 40% 49% 47% 40% 40% 53% 43% 48%
Q238a3 All SMEs excl PNBs *Question changed in Q1 2017
Those planning to apply for new/renewed finance in the 3 months after interview have typically been somewhat more likely to be aware of crowd funding and this was once again the case in Q2 2017 when awareness amongst those planning to apply was 48%.
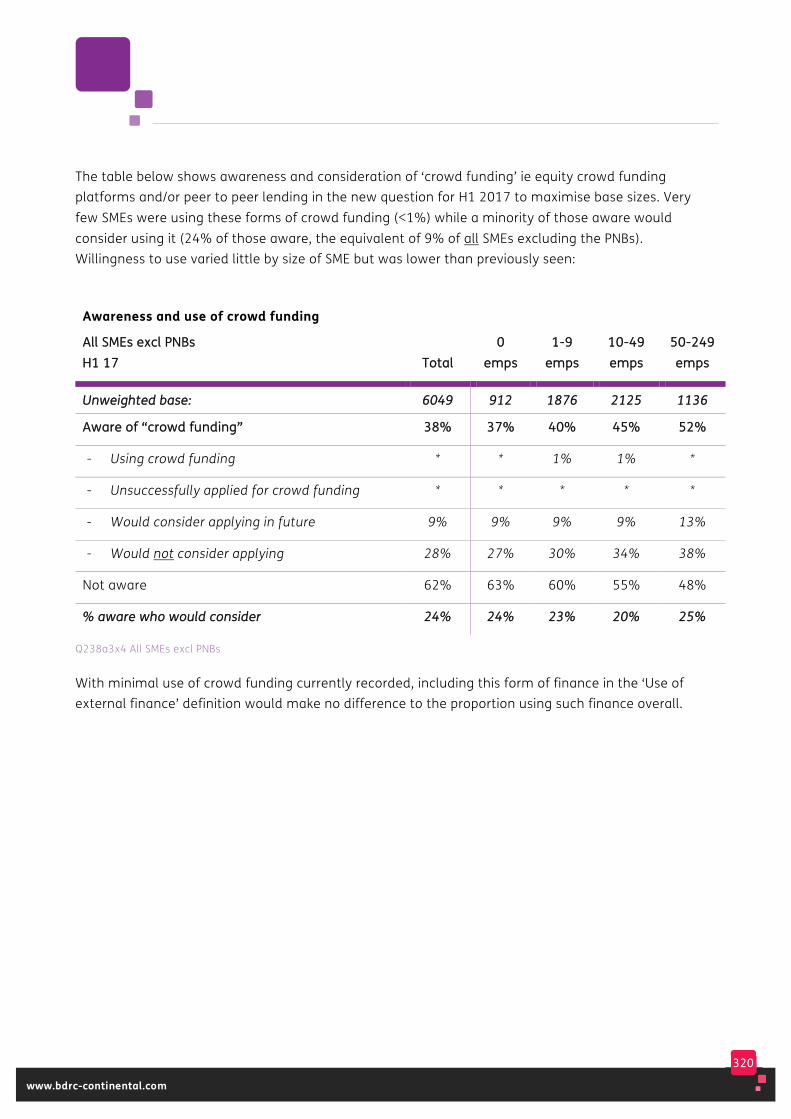
320
www.bdrc-continental.com
The table below shows awareness and consideration of ‘crowd funding’ ie equity crowd funding platforms and/or peer to peer lending in the new question for H1 2017 to maximise base sizes. Very few SMEs were using these forms of crowd funding (<1%) while a minority of those aware would consider using it (24% of those aware, the equivalent of 9% of all SMEs excluding the PNBs). Willingness to use varied little by size of SME but was lower than previously seen:
Awareness and use of crowd funding
AAllll SSMMEEss eexxccll PPNNBBss HH11 1177 TToottaall
00 eemmppss
11--99 eemmppss
1100--4499 eemmppss
5500--224499 eemmppss
UUnnwweeiigghhtteedd bbaassee:: 66004499 991122 11887766 22112255 11113366
AAwwaarree ooff ““ccrroowwdd ffuunnddiinngg”” 3388%% 3377%% 4400%% 4455%% 5522%%
- Using crowd funding * * 1% 1% *
- Unsuccessfully applied for crowd funding * * * * *
- Would consider applying in future 9% 9% 9% 9% 13%
- Would not consider applying 28% 27% 30% 34% 38%
Not aware 62% 63% 60% 55% 48%
%% aawwaarree wwhhoo wwoouulldd ccoonnssiiddeerr 2244%% 2244%% 2233%% 2200%% 2255%%
Q238a3x4 All SMEs excl PNBs
With minimal use of crowd funding currently recorded, including this form of finance in the ‘Use of external finance’ definition would make no difference to the proportion using such finance overall.
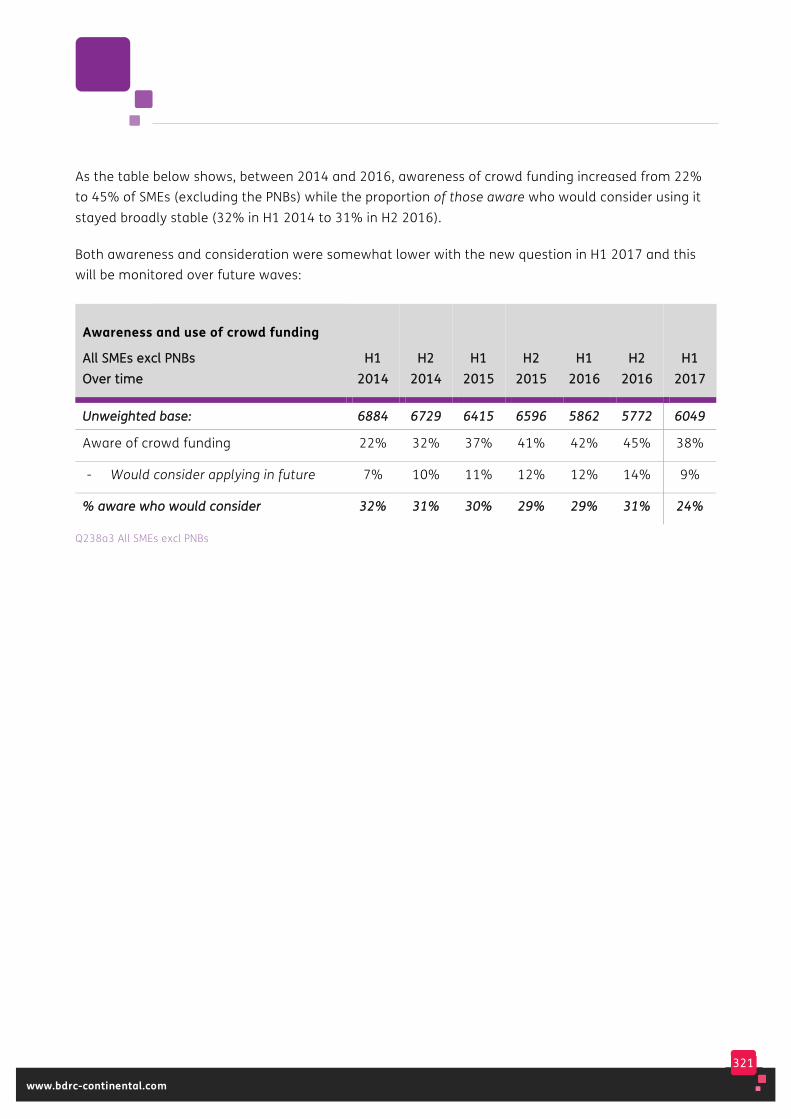
321
www.bdrc-continental.com
As the table below shows, between 2014 and 2016, awareness of crowd funding increased from 22% to 45% of SMEs (excluding the PNBs) while the proportion of those aware who would consider using it stayed broadly stable (32% in H1 2014 to 31% in H2 2016).
Both awareness and consideration were somewhat lower with the new question in H1 2017 and this will be monitored over future waves:
Awareness and use of crowd funding
AAllll SSMMEEss eexxccll PPNNBBss OOvveerr ttiimmee
HH11 22001144
HH22 22001144
HH11 22001155
HH22 22001155
HH11 22001166
HH22 22001166
HH11 22001177
UUnnwweeiigghhtteedd bbaassee:: 66888844 66772299 66441155 66559966 55886622 55777722 66004499
Aware of crowd funding 22% 32% 37% 41% 42% 45% 38%
- Would consider applying in future 7% 10% 11% 12% 12% 14% 9%
%% aawwaarree wwhhoo wwoouulldd ccoonnssiiddeerr 3322%% 3311%% 3300%% 2299%% 2299%% 3311%% 2244%%
Q238a3 All SMEs excl PNBs

322
www.bdrc-continental.com
15. Selected Graphs and Charts
This chapter presents some of the key data in graphical form to provide data on longer term trends.

323
www.bdrc-continental.com
Much of the data in this report is provided and analysed over time, typically by quarter. After twenty five waves of the SME Finance Monitor, the tables containing data for each quarter have become too large to fit comfortably on a page. The main tables therefore show the most recent quarters only and a series of summary tables have been developed for key questions to show longer terms trends on an annual basis. This chapter also provides longer trend data, but this time quarter by quarter for key questions from 2012. At the bottom of each chart there is a reference to the page in the man report where the current data is presented in a table, and a summary of the trend shown.
Charts reflecting data reported in Chapter 4 External risk rating from D&B or Experian
TTiimmee SSeerriieess:: RRiisskk rraattiinngg ppeerr qquuaarrtteerr
Risk rating
This chart relates to the analysis found on page 34 of the main report. The proportion of SMEs with a minimal or low rating increased from 16% in 2012 and 2013 to 25% in 2015, but was somewhat lower for 2016 (22%) and H1 2017 (21%). The proportion with a worse than average risk rating moved from above to below 50% in 2014 and has remained there since (45% for H1 2017).
Q1 12 Q2 12 Q3 12 Q4 12 Q2 13 Q3 13 Q4 13
6%
12%
30%
53%
5%
11%
33%
51%
2%
13%
30%
55%
5%
9%
32%
53%
5%
10%
29%
56%
6%
10%
30%
54%
Q1 13
6%
10%
28%
55%
Minimal Average Worse than averageLow
7%
11%
31%
52%
Q1 14 Q2 14
7%
13%
34%
47%
7%
16%
30%
47%
Q3 14 Q4 14
7%
15%
33%
45%
8%
17%
33%
43%
Q1 15 Q2 15
9%
18%
30%
44%
7%
17%
31%
45%
Q3 15 Q4 15
8%
17%
27%
48%
7%
16%
28%
48%
Q1 16
6%
13%
28%
53%
Q2 16
8%
16%
32%
44%
Q3 16
8%
14%
30%
48%
Q4 16
6%
16%
27%
51%
Q1 17
7%
15%
35%
42%
Q2 17
5%
14%
33%
48%
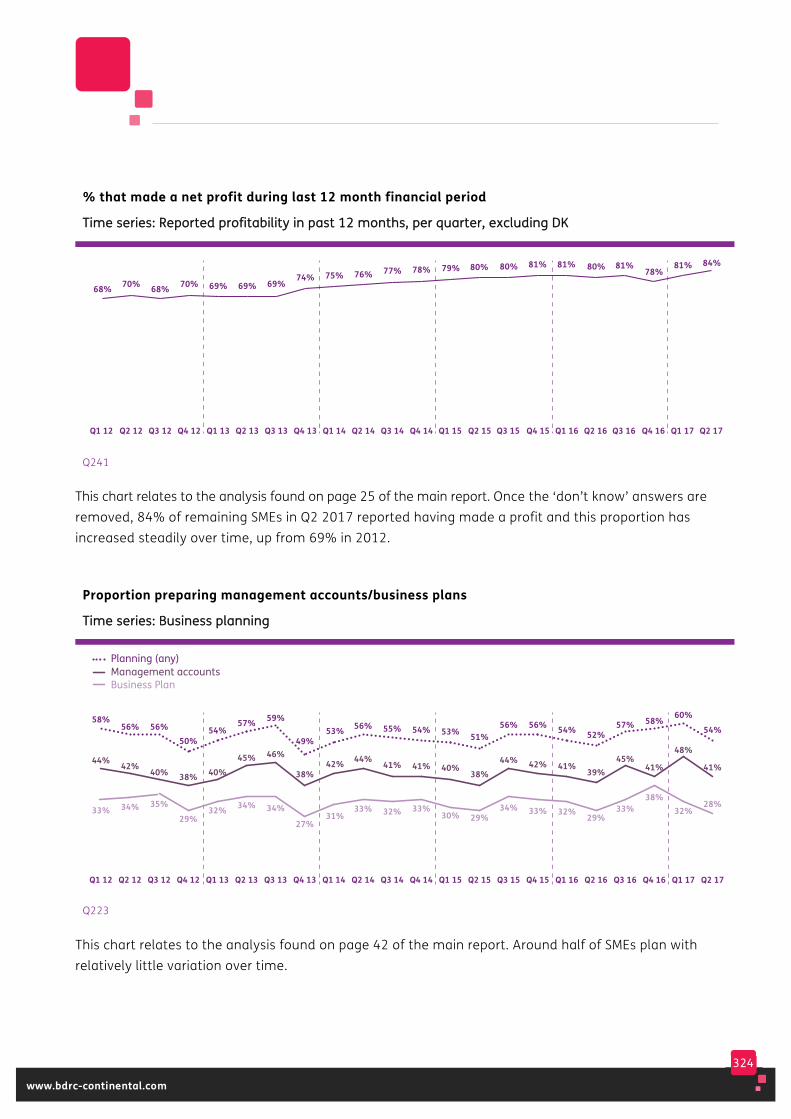
324
www.bdrc-continental.com
% that made a net profit during last 12 month financial period
TTiimmee sseerriieess:: RReeppoorrtteedd pprrooffiittaabbiilliittyy iinn ppaasstt 1122 mmoonntthhss,, ppeerr qquuaarrtteerr,, eexxcclluuddiinngg DDKK
Q241
This chart relates to the analysis found on page 25 of the main report. Once the ‘don’t know’ answers are removed, 84% of remaining SMEs in Q2 2017 reported having made a profit and this proportion has increased steadily over time, up from 69% in 2012.
Proportion preparing management accounts/business plans
TTiimmee sseerriieess:: BBuussiinneessss ppllaannnniinngg
Q223
This chart relates to the analysis found on page 42 of the main report. Around half of SMEs plan with relatively little variation over time.
Q1 12 Q2 12 Q3 12 Q4 12 Q1 13 Q2 13
69% 69%
Q3 13
69%68% 68%70% 70%
Q4 13
74%
Q1 14
75%
Q2 14
76%
Q3 14
77%
Q4 14
78% 79% 80%
Q1 15 Q2 15
80% 81%
Q3 15
80%
Q2 16
81%
Q3 16
78%
Q4 16
81%
Q1 17
84%
Q2 17Q4 15
81%
Q1 16
58%56% 56%
50%54%
57%
33% 34% 35%29%
32% 34%
44% 42%40% 38% 40%
45%
Q1 12 Q2 12 Q3 12 Q4 12 Q1 13 Q2 13
59%
34%
46%
Q3 13
Planning (any)Management accountsBusiness Plan
49%
27%
38%
Q4 13
53%
31%
42%
Q1 14
56%
33%
44%
Q2 14
55%
32%
41%
Q3 14
54%
33%
41%
32%
54%
41%
Q4 14
53%
30%
40%
Q1 15
51%
29% 29%
38%
Q2 15
56%
34%
44%
Q3 15
56%
33%
42%
Q4 15 Q1 16
52%
39%
Q2 16
33%
57%
45%
Q3 16
38%
58%
41%
Q4 16
32%
60%
48%
Q1 17
28%
54%
41%
Q2 17
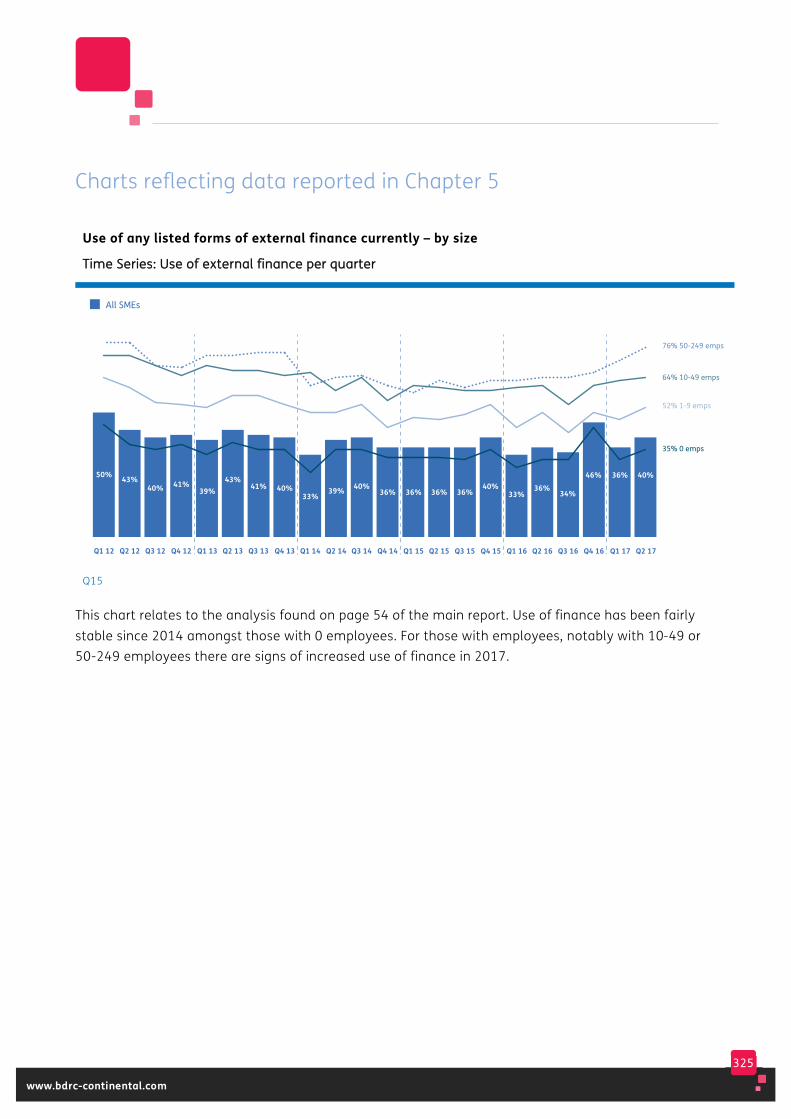
325
www.bdrc-continental.com
Charts reflecting data reported in Chapter 5
Use of any listed forms of external finance currently – by size
TTiimmee SSeerriieess:: UUssee ooff eexxtteerrnnaall ffiinnaannccee ppeerr qquuaarrtteerr
Q15
This chart relates to the analysis found on page 54 of the main report. Use of finance has been fairly stable since 2014 amongst those with 0 employees. For those with employees, notably with 10-49 or 50-249 employees there are signs of increased use of finance in 2017.
Q1 12 Q2 12 Q3 12 Q4 12 Q1 13
50% 43%40% 41%
39%
Q2 13 Q3 13
43%41%
All SMEs
76% 50-249 emps
64% 10-49 emps
52% 1-9 emps
35% 0 emps
Q4 13
40%
Q1 14
33%
Q2 14
39%
Q3 14
40%
Q4 14
36%
Q1 15
36%
Q2 15
36% 36%40%
Q3 15 Q4 15
33%
Q1 16
36%
Q2 16
34%
Q3 16
46%
Q4 16
36%
Q1 17
40%
Q2 17
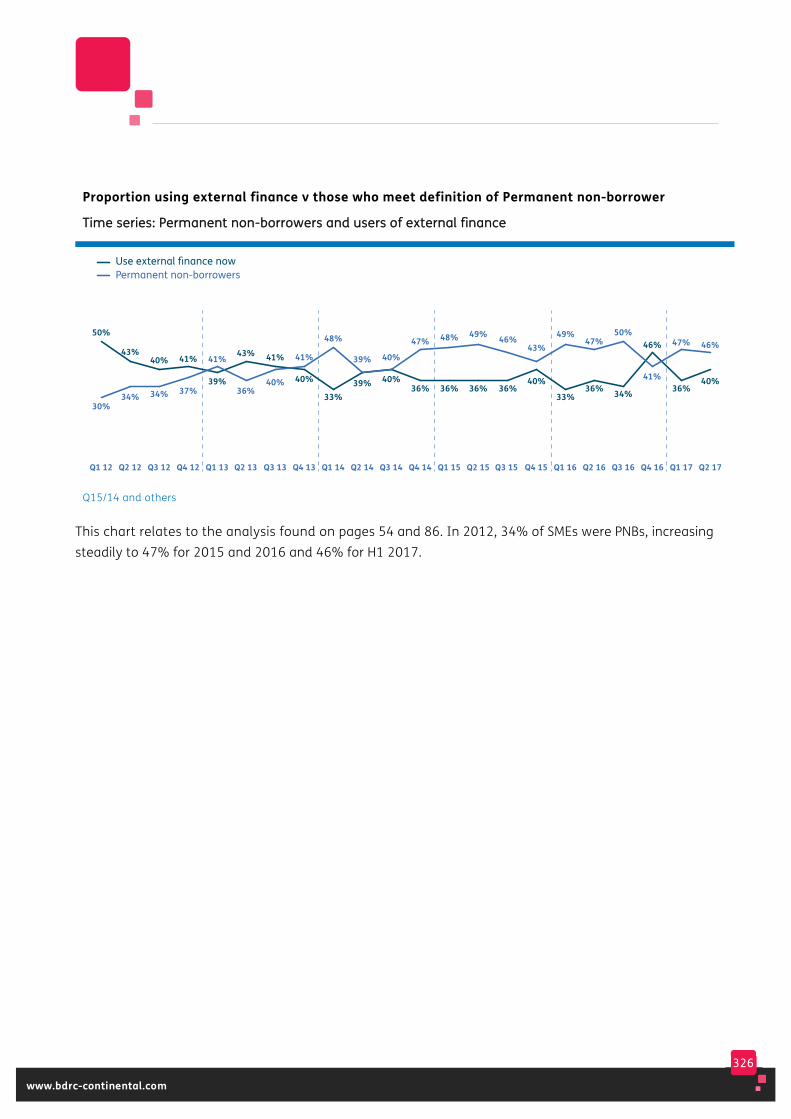
326
www.bdrc-continental.com
Proportion using external finance v those who meet definition of Permanent non-borrower
TTiimmee sseerriieess:: PPeerrmmaanneenntt nnoonn--bboorrrroowweerrss aanndd uusseerrss ooff eexxtteerrnnaall ffiinnaannccee
Q15/14 and others
This chart relates to the analysis found on pages 54 and 86. In 2012, 34% of SMEs were PNBs, increasing steadily to 47% for 2015 and 2016 and 46% for H1 2017.
30%34% 34% 37%
41%
40%
50%
43%40% 41%
39%
41%
Q1 12 Q2 12 Q3 12 Q4 12 Q1 13 Q3 13
36%
43%
Q2 13
Permanent non-borrowersUse external finance now
40%
41%
Q4 13
33%
48%
Q1 14
39%
39%
Q2 14
40%
40%
Q3 14
36%
47% 47%
Q4 14
36%
48%
Q1 15
36%
49%
Q2 15
36% 36%
46%
40%
43%
Q3 15 Q4 15
33%
49%
Q1 16 Q2 16
50%
34%
Q3 16
41%
46%
Q4 16
47%
36%
Q1 17
46%
40%
Q2 17
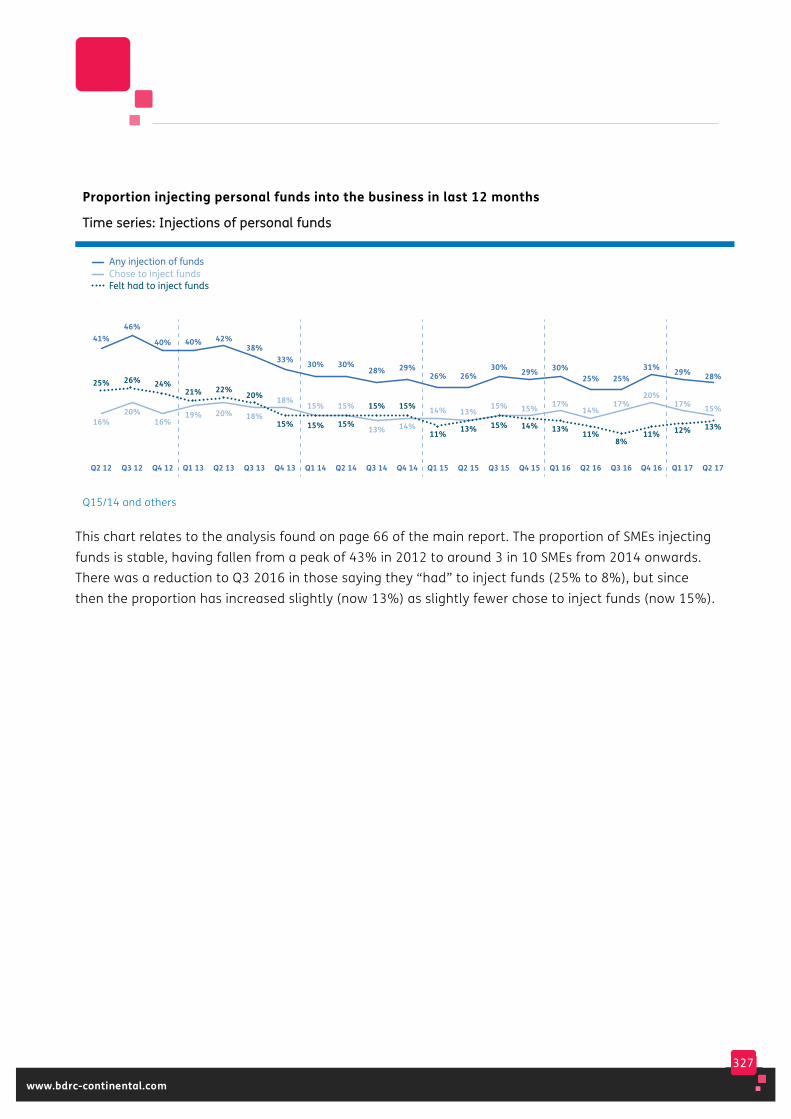
327
www.bdrc-continental.com
Proportion injecting personal funds into the business in last 12 months
TTiimmee sseerriieess:: IInnjjeeccttiioonnss ooff ppeerrssoonnaall ffuunnddss
Q15/14 and others
This chart relates to the analysis found on page 66 of the main report. The proportion of SMEs injecting funds is stable, having fallen from a peak of 43% in 2012 to around 3 in 10 SMEs from 2014 onwards. There was a reduction to Q3 2016 in those saying they “had” to inject funds (25% to 8%), but since then the proportion has increased slightly (now 13%) as slightly fewer chose to inject funds (now 15%).
41%
16%20%
16%19% 20%
46%
40% 40% 42%
25% 26% 24%21% 22%
Q2 12 Q3 12 Q4 12 Q1 13 Q2 13
18%
38%
20%
Q3 13
Any injection of fundsChose to inject fundsFelt had to inject funds
15%
33%
18%
Q4 13
15%
30%
15%
Q1 14
15%
30%
15%
Q2 14
15%
28%
13%
Q3 14
14%
29%
15%
Q4 14
14% 14%
26% 25%
11% 11%
Q1 15
13% 13%
26%
13%15%
30%
15% 14%
29%
15%
Q2 15 Q3 15 Q4 15
30%
17%
Q1 16 Q2 16
17%
25%
8%
Q3 16
20%
31%
11%
Q4 16
17%
29%
12%
Q1 17
15%
28%
13%
Q2 17

328
www.bdrc-continental.com
Charts reflecting data reported in Chapter 6
Borrowing events in 12 months prior to interview
TTiimmee sseerriieess:: BBoorrrroowwiinngg eevveennttss
Interviewed in
Q26
This chart relates to the analysis found on pages 105 and 119 of the main report. The proportion of SMEs applying for new/renewed finance has more than halved since 2012. In the first half of 2016, 6% of SMEs had a Type 1 event, in the second half it was 4%. It was also 4% in the first half of 2017.
12% 11%10%
9%
9%
8% 8%
12% 12%
10%9%
8%
2%1% 1%
2% 2% 2%
4%3% 3% 3% 3%
4%
Q1 12 Q2 12
Q3 12 Q4 12 Q1 13 Q2 13
7%
7%
1%
3%
Q3 13
Type 2 = Cancel/re-negotiation by bankType 1 = new application/renewal
Type 3 = SME chose to pay off/reduce facilityAuto = Automatic renewal of overdraft facility
8%
8%
2%
3%
Q4 13
8%7%
7%6%
2% 2%
3% 3%
Q1 14 Q2 14
7%8%
6%7%
3%
1%
5%
3%
Q3 14 Q4 14
8% 8%6%
8%7%
8%
3% 2%
4%3%
Q1 15 Q2 15
9%8%
7%6% 6%
7%
2% 2%1% 1%
3% 3%2% 2%
Q3 15 Q4 15 Q1 16 Q2 16
8% 8%
4% 4%
0%1%
1%2%
Q3 16 Q4 16
6%
4%
1%
1%
Q1 17
10%
4%
2%
1%
Q2 17
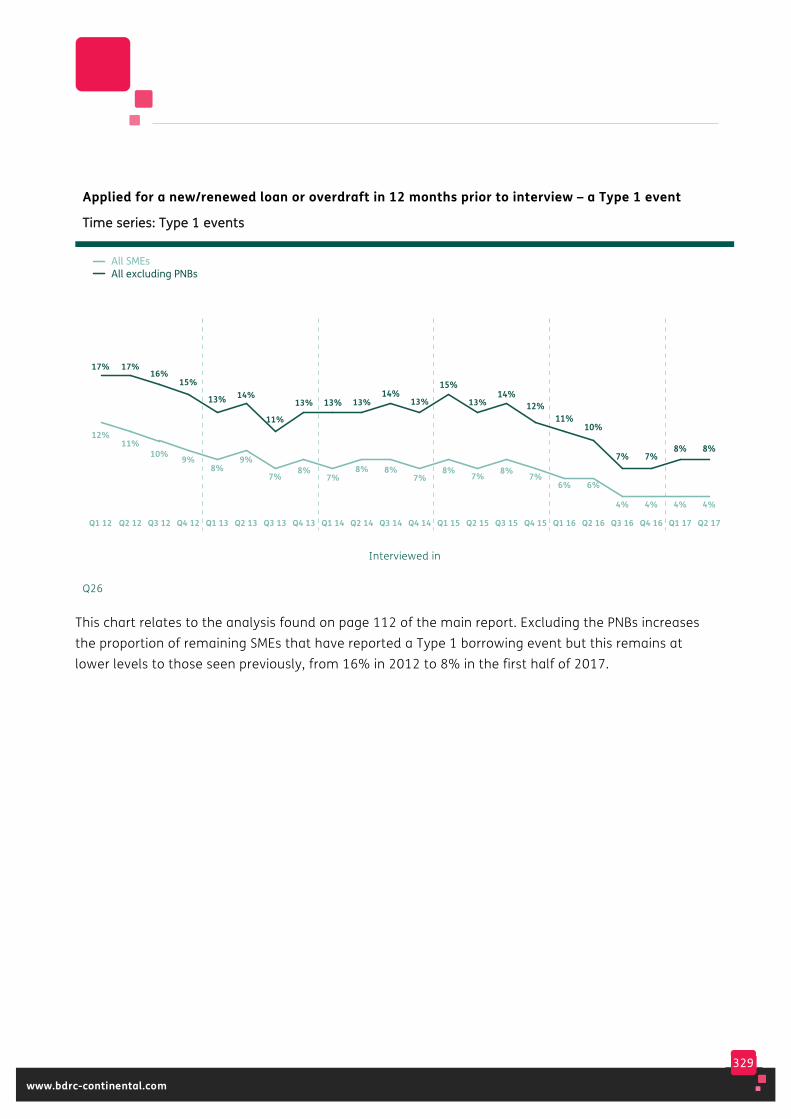
329
www.bdrc-continental.com
Applied for a new/renewed loan or overdraft in 12 months prior to interview – a Type 1 event
TTiimmee sseerriieess:: TTyyppee 11 eevveennttss
Interviewed in
Q26
This chart relates to the analysis found on page 112 of the main report. Excluding the PNBs increases the proportion of remaining SMEs that have reported a Type 1 borrowing event but this remains at lower levels to those seen previously, from 16% in 2012 to 8% in the first half of 2017.
12%11%
10% 9%
14%
8%9%
17% 17%16%
15%
13%
Q1 12 Q2 12
Q3 12 Q4 12 Q1 13 Q2 13
11%
7%
Q3 13
All excluding PNBsAll SMEs
13%
8%
Q4 13
13%
7%8%
13%
Q1 14 Q2 14
13%
8%7%
14%
Q3 14 Q4 14
13%
8%7%
15%
Q1 15 Q2 15
8%7%
14%12%
Q3 15 Q4 15
6%
11%
Q1 16
6%
10%
Q2 16
4% 4%
7% 7%
Q3 16 Q4 16
4%
8%
Q1 17
4%
8%
Q2 17

330
www.bdrc-continental.com
Charts reflecting data reported in Chapter 7
Proportion of all applications that were made by first time applicants
TTiimmee sseerriieess:: PPrrooppoorrttiioonn ooff aapppplliiccaattiioonnss mmaaddee bbyy ffiirrsstt ttiimmee aapppplliiccaannttss
Applied in
Q52/Q349
This chart relates to the analysis found on pages 128 and 134 of the main report. 3 in 10 applicants for loans and overdrafts in the last 18 months have been first time applicants.
33%29%
25%
33%
28%
46%
37%
50%
38%34%
Q1 12 Q2 12 Q3 12 Q4 12 Q1 13
45%
31%
Q2 13
% of loan applications% of overdraft applications
42%
20%
Q3 13
41%
28%
Q4 13
19%
Q1 14
28%
Q2 14
27%
Q3 14
43%
18% 18%23% 22%
37%
27%28%30%
Q4 14
27%
28%
Q1 15
20%
32%
Q2 15
14%
28%
24%
32%35%
10%
19%
59%
Q3 15 Q4 15 Q1 16* Q2 16* Q3 16* Q4 16* Q1 17*
22%
31%
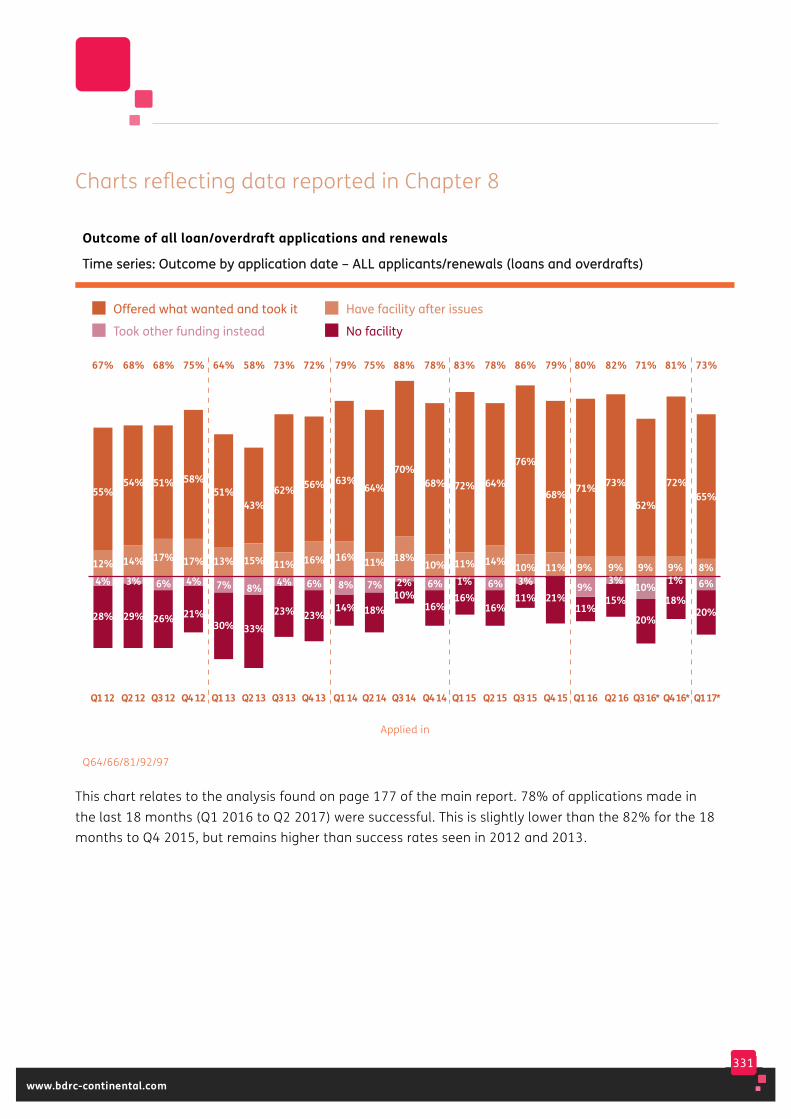
331
www.bdrc-continental.com
Charts reflecting data reported in Chapter 8
Outcome of all loan/overdraft applications and renewals
TTiimmee sseerriieess:: OOuuttccoommee bbyy aapppplliiccaattiioonn ddaattee –– AALLLL aapppplliiccaannttss//rreenneewwaallss ((llooaannss aanndd oovveerrddrraaffttss))
Applied in
Q64/66/81/92/97
This chart relates to the analysis found on page 177 of the main report. 78% of applications made in the last 18 months (Q1 2016 to Q2 2017) were successful. This is slightly lower than the 82% for the 18 months to Q4 2015, but remains higher than success rates seen in 2012 and 2013.
Offered what wanted and took it
Took other funding instead No facility
Have facility after issues
28%
4%12%
55%
29%
3%
14%
54%
26%
6%
17%
51%
21%
4%
17%
58%
30%
7%
13%
51%
33%
8%
15%
43%
Q3 13
23%
4%11%
62%
Q4 13 Q1 14 Q2 14 Q3 14
23%
6%
16%
56%
14%10%
18%
70%
16%
6%
10%
68%
16%1%2%
11%
72%
Q1 12 Q2 12 Q3 12 Q4 12 Q1 13 Q2 13
67% 68% 68% 75% 64% 58% 73% 79% 88%72% 75%
Q4 14 Q1 15
16%
6%
14%
64%
11%3%
10%
76%
83%78% 86%
21%
11%
68%
79%
11%
9%
9%
71%
80% 82%78%
Q2 15 Q3 15 Q4 15 Q1 16
3%
15%
9%
73%
Q2 16
71%
10%
20%
9%
62%
Q3 16*
81%
1%
18%
9%
72%
Q4 16*
73%
6%
20%
8%
65%
Q1 17*
14%
8%
16%
63%
18%
7%
11%
64%
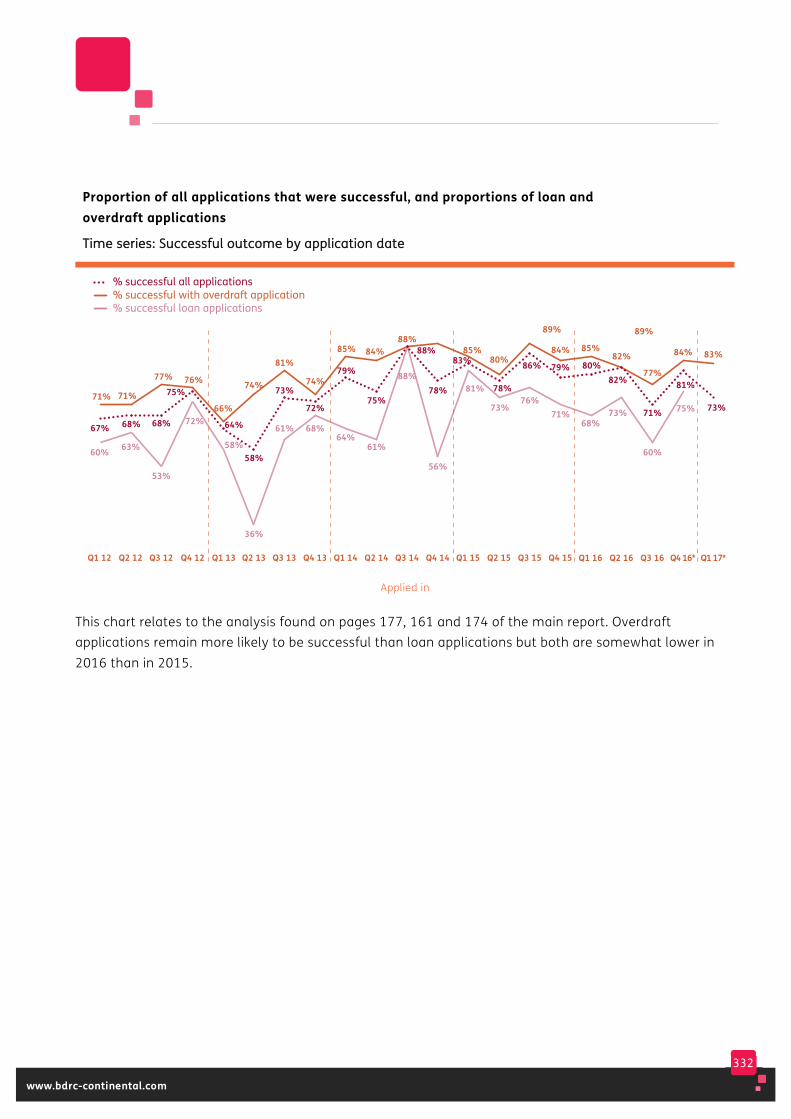
332
www.bdrc-continental.com
Proportion of all applications that were successful, and proportions of loan and overdraft applications
TTiimmee sseerriieess:: SSuucccceessssffuull oouuttccoommee bbyy aapppplliiccaattiioonn ddaattee
Applied in
This chart relates to the analysis found on pages 177, 161 and 174 of the main report. Overdraft applications remain more likely to be successful than loan applications but both are somewhat lower in 2016 than in 2015.
67% 68% 68%
75%
60% 63%
53%
72%
58%
61%
71% 71%
77% 76%
66%
Q1 12 Q2 12 Q3 12 Q4 12 Q1 13 Q2 13
% successful with overdraft application% successful loan applications
% successful all applications
64%
74%
58%
Q3 13
81%
73%
Q4 13 Q1 14
36%
68%
74%
72%
85%
79%
Q2 14 Q3 14
61%64%
84%
75%
88%88%
Q4 14
89%
78%
Q1 15
81%
56%
88%
85% 84% 85%82%
77%
84% 83%83%
Q2 15
80%
78%
Q3 15 Q4 15 Q1 16 Q2 16 Q3 16 Q4 16* Q1 17*
76%71%
68%
60%
75%73%73%
89%
86% 79% 80%82%
71%
81%
73%
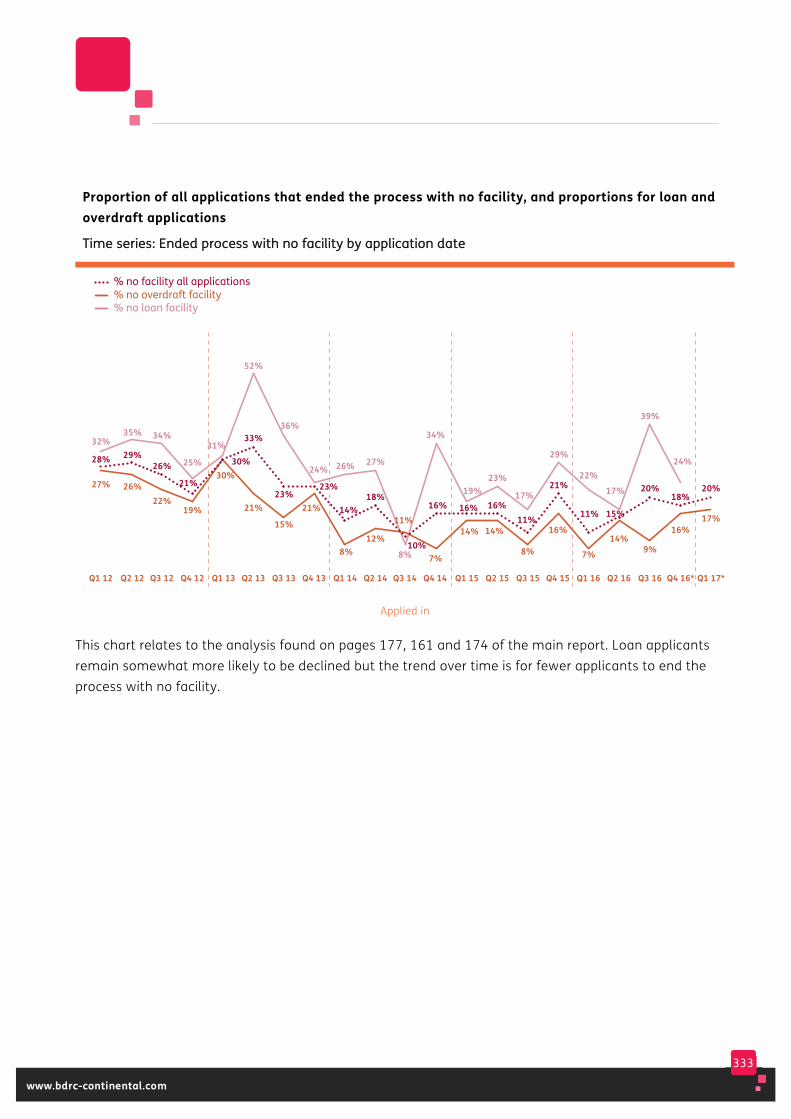
333
www.bdrc-continental.com
Proportion of all applications that ended the process with no facility, and proportions for loan and overdraft applications
TTiimmee sseerriieess:: EEnnddeedd pprroocceessss wwiitthh nnoo ffaacciilliittyy bbyy aapppplliiccaattiioonn ddaattee
Applied in
This chart relates to the analysis found on pages 177, 161 and 174 of the main report. Loan applicants remain somewhat more likely to be declined but the trend over time is for fewer applicants to end the process with no facility.
31%32%35% 34%
25%30%
21%
27% 26%22%
19%
Q1 12 Q2 12 Q3 12 Q4 12 Q1 13 Q2 13
% no overdraft facility% no loan facility
% no facility all applications
30%
33%
28% 29%26%
21%
15%
Q3 13
23%
52%
Q4 13 Q1 14
21%
23%
26%24%
8%
14%
12%
Q2 14
18%
Q3 14
11%
10%
27%
8%
36%
Q4 14
34%
29%
22%17%
39%
24%
7%
16%
14%
Q1 15
16%
19%
Q2 15
23%
14%
16%
8% 7%
16%
Q3 15 Q4 15 Q1 16
11%
21%
11% 15%
14%9%
16%17%
Q2 16 Q3 16 Q4 16* Q1 17*
20%18%
20%17%
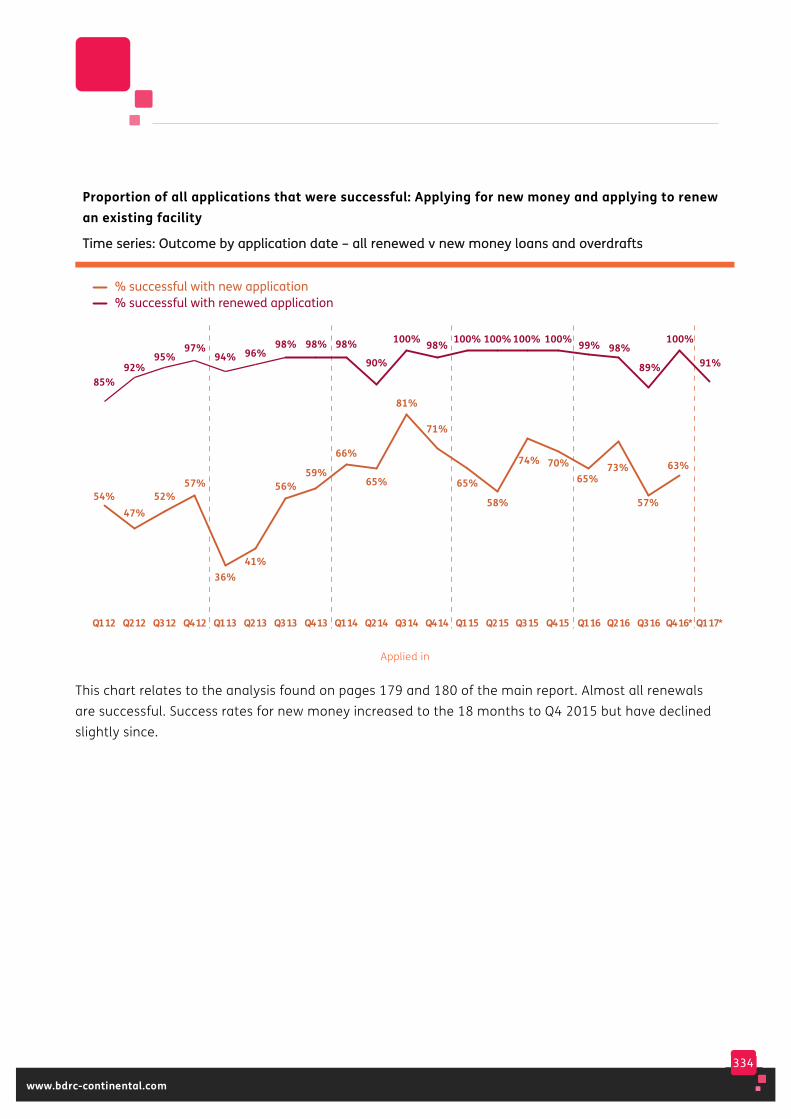
334
www.bdrc-continental.com
Proportion of all applications that were successful: Applying for new money and applying to renew an existing facility
TTiimmee sseerriieess:: OOuuttccoommee bbyy aapppplliiccaattiioonn ddaattee –– aallll rreenneewweedd vv nneeww mmoonneeyy llooaannss aanndd oovveerrddrraaffttss
Applied in
This chart relates to the analysis found on pages 179 and 180 of the main report. Almost all renewals are successful. Success rates for new money increased to the 18 months to Q4 2015 but have declined slightly since.
54%47%
52%57%
36%
Q1 12 Q2 12 Q3 12 Q4 12 Q1 13
% successful with new application% successful with renewed application
85%92%
95%97%
94%
41%
Q2 13
96%
56%
Q3 13
98%
59%
Q4 13
98%
Q1 14
98%
66%
65%
Q2 14
90%
81%
Q3 14
100%
71%
Q4 14
98%
65%
Q1 15
100%
58%
Q2 15
100% 100% 99%
74% 70%65%
98%
73%
Q3 15 Q4 15 Q1 16 Q2 16
89%
57%
Q3 16
100%
63%
Q4 16*
91%
Q1 17*
100%
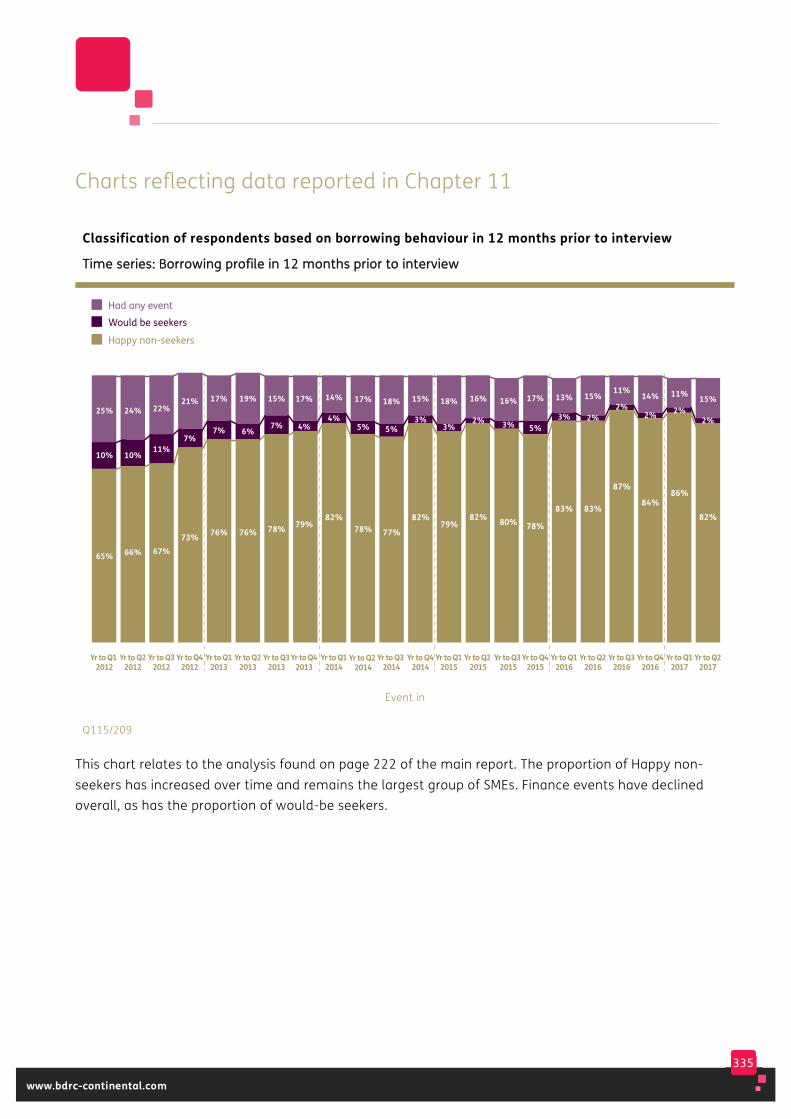
335
www.bdrc-continental.com
Charts reflecting data reported in Chapter 11
Classification of respondents based on borrowing behaviour in 12 months prior to interview
TTiimmee sseerriieess:: BBoorrrroowwiinngg pprrooffiillee iinn 1122 mmoonntthhss pprriioorr ttoo iinntteerrvviieeww
Event in
Q115/209
This chart relates to the analysis found on page 222 of the main report. The proportion of Happy non-seekers has increased over time and remains the largest group of SMEs. Finance events have declined overall, as has the proportion of would-be seekers.
25%
10%
65%
Yr to Q1 2012
24%
10%
66%
Yr to Q22012
22%
11%
67%
Yr to Q32012
7%
73%
Yr to Q42012
17%
7%
76%
Yr to Q12013
19%
6%
76%
Yr to Q22013
15%
7%
78%
Yr to Q32013
Had any event
Happy non-seekers
Would be seekers
17%
4%
79%
Yr to Q42013
17%
5%
78%
Yr to Q2 2014
14%
4%
82%
Yr to Q12014
15%
3%
82%
Yr to Q42014
18%
5%
77%
Yr to Q3 2014
21% 16%
2%
82%
Yr to Q2 2015
18%
3%
79%
Yr to Q12015
Yr to Q42015
Yr to Q3 2015
17%
5%
78%
Yr to Q12016
13%
3%
83%
Yr to Q22016
15%
2%
83%
Yr to Q32016
11%
2%
87%
Yr to Q42016
14%
2%
84%
Yr to Q12017
11%
2%
86%
Yr to Q22017
15%
2%
82%
16%
3%
80%

336
www.bdrc-continental.com
Charts reflecting data reported in Chapter 12
Plan to grow moderately/substantially in next 12 months
TTiimmee sseerriieess:: PPllaann ttoo ggrrooww
Q26/Q225
This chart relates to the analysis found on page 248 of the main report. 0 employee SMEs are now less likely to be planning to grow than they were in 2013. Amongst those with employees, predicted growth is back to, or exceeds, levels seen in 2013.
Q1 12 Q2 12 Q3 12 Q4 12 Q1 13
47% 47% 47%44%
48%
Q2 13
51%
Q3 13
47%
Q4 13
48%
All SMEs
72% 50-249 emps
65% 10-49 emps
54% 1-9 emps
41% 0 emps
Q1 14
45%
Q2 14
53%
Q3 14
46%
Q4 14
43%
Q1 15
43%
Q2 15
48%
Q3 15
47%
Q4 15
45%
Q1 16
41%
Q2 16
41%
Q3 16
47%
Q4 16
43%
Q1 17
45%
Q2 17
43%
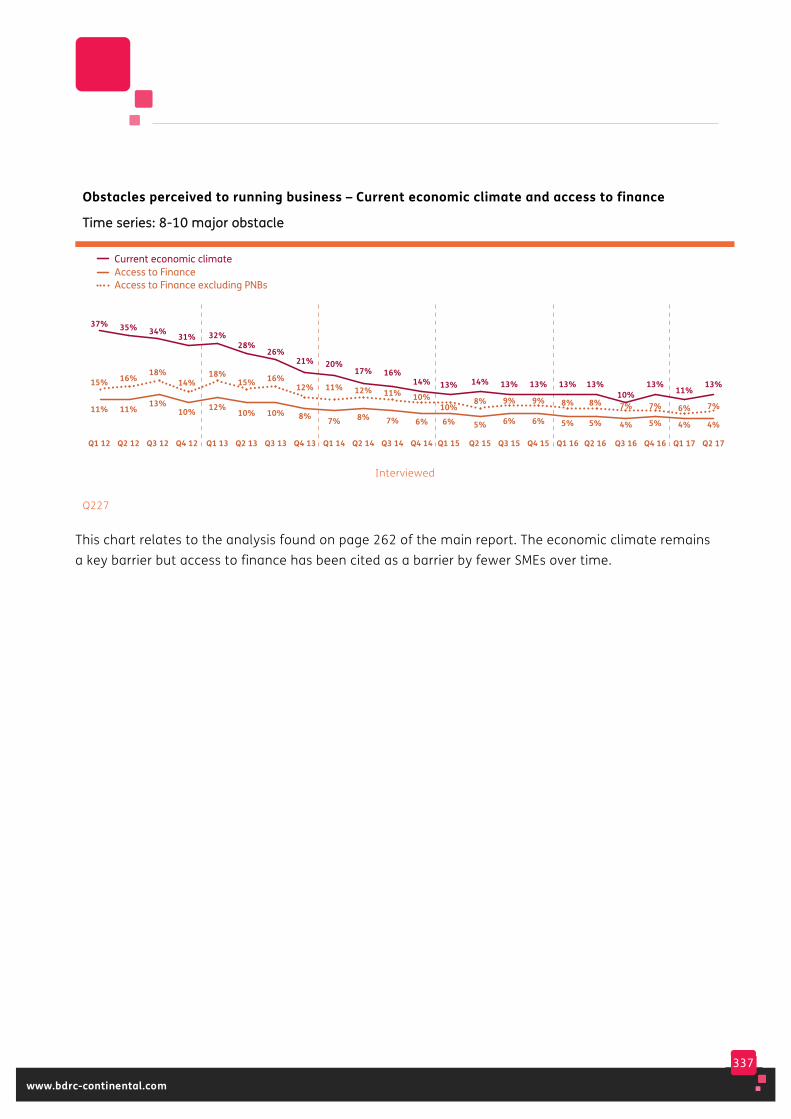
337
www.bdrc-continental.com
Obstacles perceived to running business – Current economic climate and access to finance
TTiimmee sseerriieess:: 88--1100 mmaajjoorr oobbssttaaccllee
Interviewed
Q227
This chart relates to the analysis found on page 262 of the main report. The economic climate remains a key barrier but access to finance has been cited as a barrier by fewer SMEs over time.
37% 35% 34% 31% 32%28%
15% 16%18%
14%18%
15%
11% 11% 13%10% 12% 10%
Q1 12 Q2 12 Q3 12 Q4 12 Q1 13 Q2 13
26%
16%
10%
Q3 13
21%
12%
8%
Q4 13
Access to FinanceAccess to Finance excluding PNBs
Current economic climate
20%
11%
7%
Q1 14
17%
12%
8%
Q2 14
16%
11%
7%
Q3 14
14%
10%
6%
Q4 14
13%
10%6%
Q1 15
14%
8%
5%
Q2 15
13%
9%
6%
Q3 15 Q4 15
13%
9%
6%
Q1 16
13%
8%
5%
Q2 16
13%
8%
5%
Q4 16
13%
7%
5%
Q3 16
10%7%
4%
Q2 17
13%
7%
4%
Q1 17
11%
6%
4%
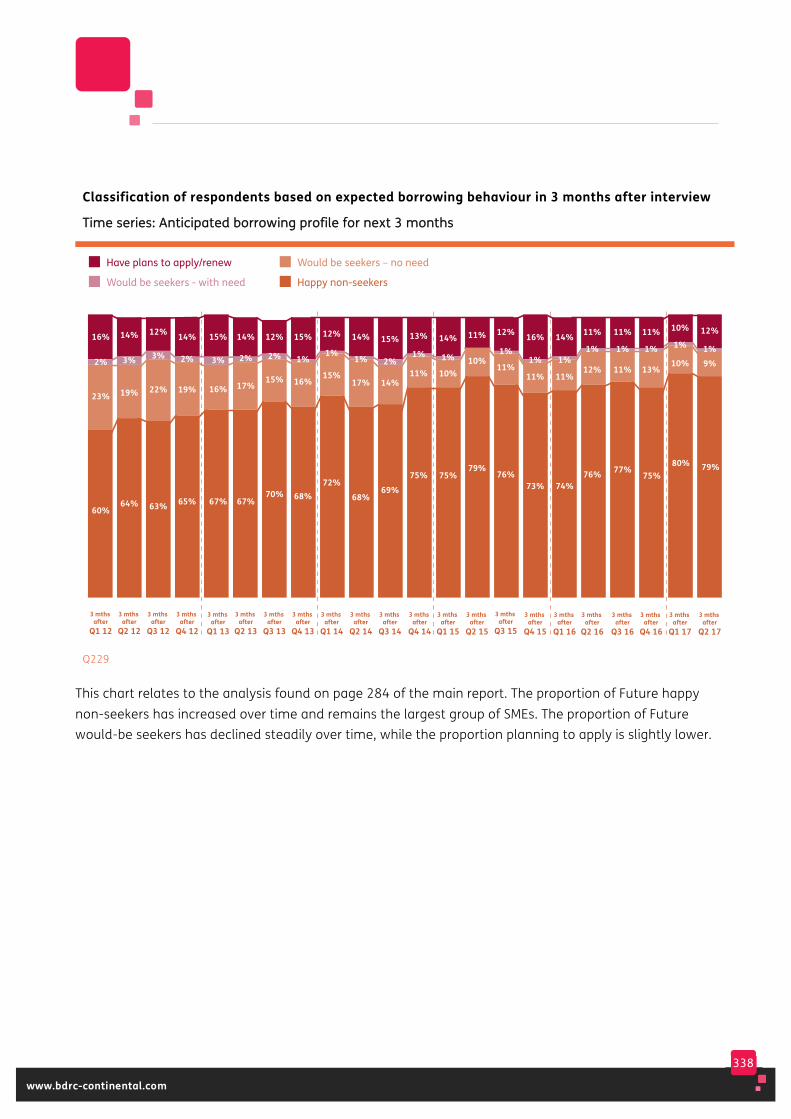
338
www.bdrc-continental.com
Classification of respondents based on expected borrowing behaviour in 3 months after interview
TTiimmee sseerriieess:: AAnnttiicciippaatteedd bboorrrroowwiinngg pprrooffiillee ffoorr nneexxtt 33 mmoonntthhss
Q229
This chart relates to the analysis found on page 284 of the main report. The proportion of Future happy non-seekers has increased over time and remains the largest group of SMEs. The proportion of Future would-be seekers has declined steadily over time, while the proportion planning to apply is slightly lower.
3 mths after
Q1 12
3 mths after
Q2 12
3 mths after
Q3 12
3 mths after
Q4 12
3 mths after
Q2 13
16%
2%
23%
60%
14%
3%
19%
64%
12%
3%
22%
63%
14%
2%
19%
65%
14%
2%
17%
67%
3 mths after
Q3 13
12%
2%
15%
70%
3 mths after
Q4 13
15%
1%
16%
68%
3 mths after
Q1 13
15%
3%
16%
67%
Have plans to apply/renew Would be seekers – no need
Happy non-seekersWould be seekers - with need
3 mths after
Q1 14
12%
1%
15%
72%
3 mths after
Q2 14
14%
1%
17%
68%
3 mths after
Q3 14
15%
2%
14%
69%
3 mths after
Q4 14
13%
1%
11%
75%
3 mths after
Q1 15
14%
1%
10%
75%
3 mths after
Q2 15
11%
10%
79%
3 mths after
Q3 15
3 mths after
Q4 15
12%
1%
11%
76%
16%
11%
73%
1%
3 mths after
Q1 16
14%
11%
74%
1%
3 mths after
Q2 16
11%
12%
76%
1%
3 mths after
Q3 16
11%
11%
77%
1%
3 mths after
Q4 16
11%
13%
75%
1%
3 mths after
Q1 17
10%
10%
80%
1%
3 mths after
Q2 17
12%
9%
79%
1%
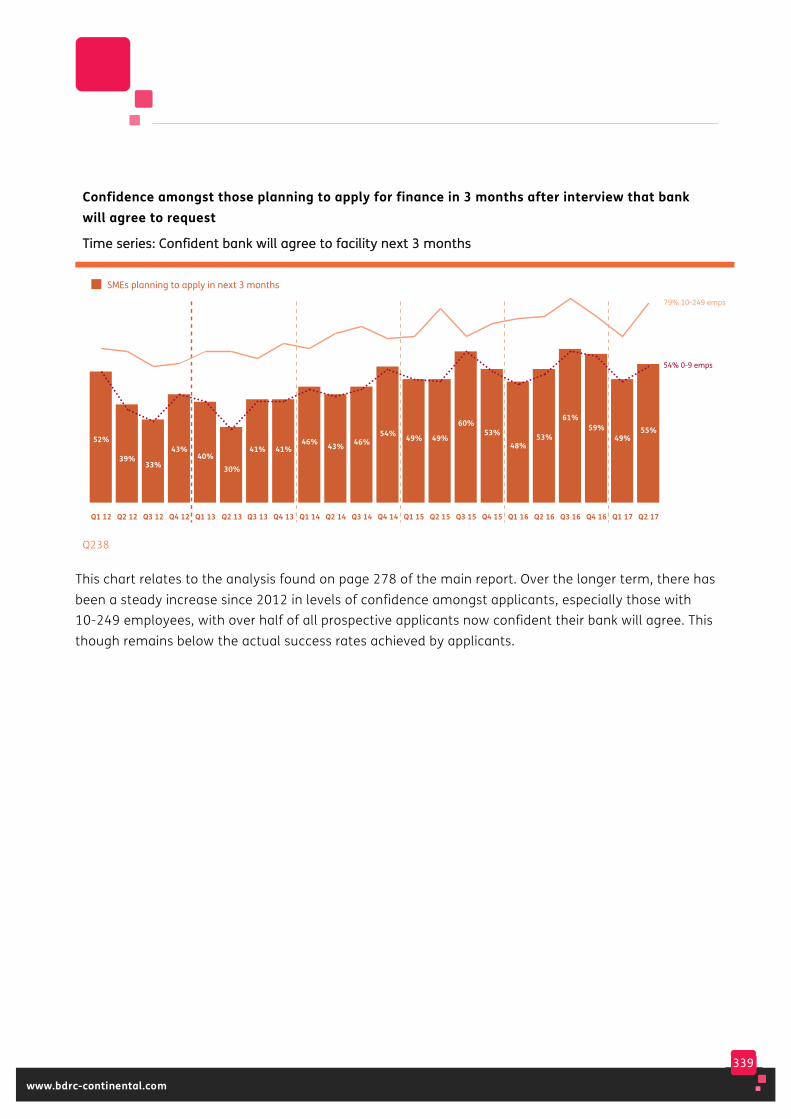
339
www.bdrc-continental.com
Confidence amongst those planning to apply for finance in 3 months after interview that bank will agree to request
TTiimmee sseerriieess:: CCoonnffiiddeenntt bbaannkk wwiillll aaggrreeee ttoo ffaacciilliittyy nneexxtt 33 mmoonntthhss
Q238
This chart relates to the analysis found on page 278 of the main report. Over the longer term, there has been a steady increase since 2012 in levels of confidence amongst applicants, especially those with 10-249 employees, with over half of all prospective applicants now confident their bank will agree. This though remains below the actual success rates achieved by applicants.
Q1 12 Q2 12 Q3 12 Q4 12 Q1 13
52%
39%33%
43%40%
Q2 13
30%
Q3 13
41%
Q4 13
41%
SMEs planning to apply in next 3 months
79% 10-249 emps
54% 0-9 emps
Q1 14
46%
Q2 14
43%
Q3 14
46%
Q4 14
54%
Q1 15
49%
Q2 15
49%
Q3 15
60%
Q4 15
53%
Q1 16
48%
Q2 16
53%
Q3 16
61%
Q4 16
59%
Q1 17
49%
Q2 17
55%
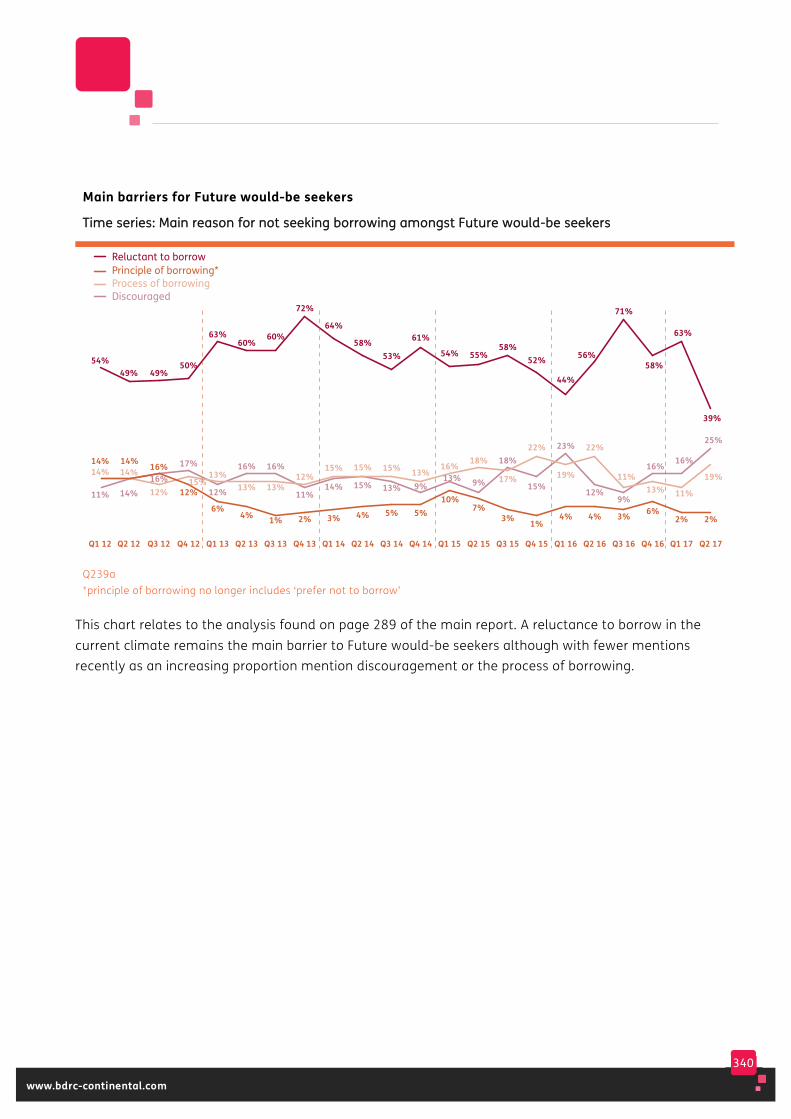
340
www.bdrc-continental.com
Main barriers for Future would-be seekers
TTiimmee sseerriieess:: MMaaiinn rreeaassoonn ffoorr nnoott sseeeekkiinngg bboorrrroowwiinngg aammoonnggsstt FFuuttuurree wwoouulldd--bbee sseeeekkeerrss
Q239a *principle of borrowing no longer includes ‘prefer not to borrow’
This chart relates to the analysis found on page 289 of the main report. A reluctance to borrow in the current climate remains the main barrier to Future would-be seekers although with fewer mentions recently as an increasing proportion mention discouragement or the process of borrowing.
Principle of borrowing*Process of borrowingDiscouraged
Reluctant to borrow
11% 14%16%
17%
12%
16%
54%49% 49%
50%
63%60%
14% 14%
12%
13%13%
14% 14% 16%
12%
6%4%
16%
60%
13%
1%
11%
72%
12%
2%
15%
64%
3%
15%
58%
15%
14%
15%
4%
Q1 12 Q2 12 Q3 12 Q4 12 Q1 13 Q2 13 Q3 13 Q4 13 Q1 14 Q2 14
53%
5%
9%
61%
13%
13%
15%
5%
Q3 14 Q4 14
13%
54%
16%
10%
Q1 15
55%
7%
9%
18%
Q2 15 Q3 15 Q4 15
18%
58%
17%
3%
52%
1%
15% 12%
22% 22%
Q1 16 Q2 16
44%
56%
4% 4%
9%
11%
Q3 16
71%
58%
3%
16%
13%
Q4 16
6%
63%
16%
11%
Q1 17
2%
39%
25%
19%
Q2 17
2%
23%
19%
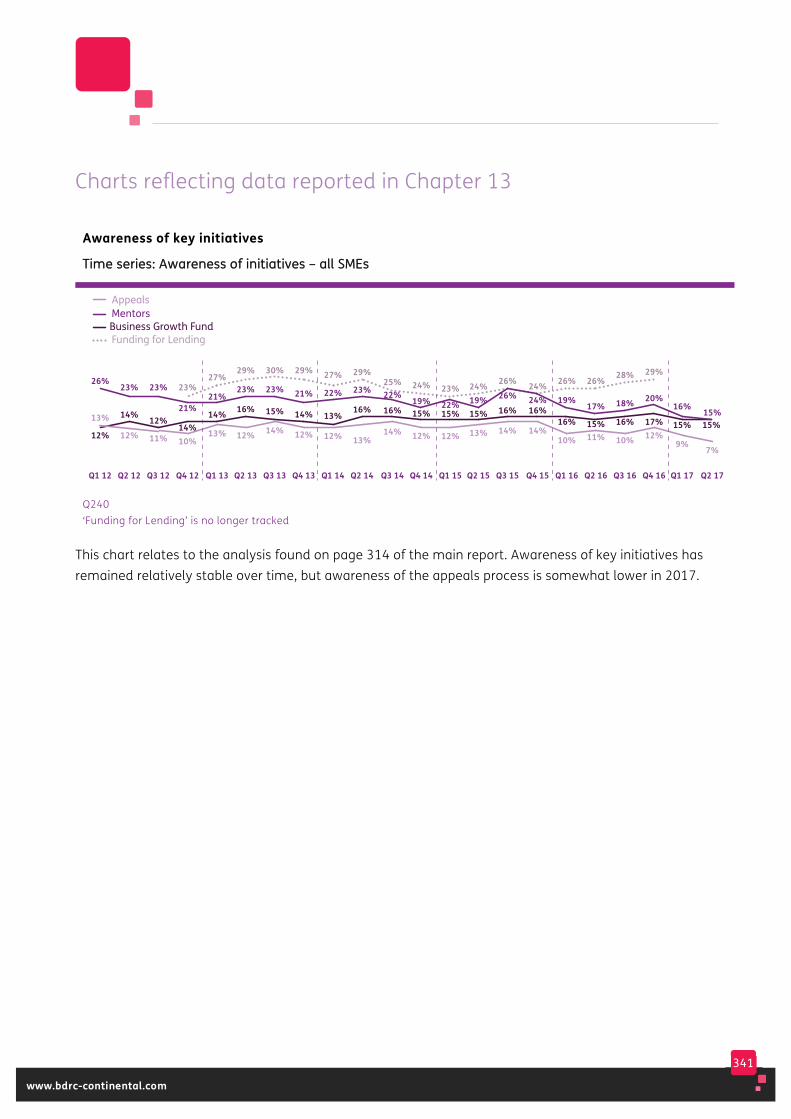
341
www.bdrc-continental.com
Charts reflecting data reported in Chapter 13
Awareness of key initiatives
TTiimmee sseerriieess:: AAwwaarreenneessss ooff iinniittiiaattiivveess –– aallll SSMMEEss
Q240 ‘Funding for Lending’ is no longer tracked
This chart relates to the analysis found on page 314 of the main report. Awareness of key initiatives has remained relatively stable over time, but awareness of the appeals process is somewhat lower in 2017.
MentorsBusiness Growth FundFunding for Lending
Appeals
23%27%
29%
13%
12% 11% 10%13% 12%12%
14% 12% 14% 16%
26%23% 23%
21%21%
23%
30%
14%
15%
23%
29%
12%
14%
21%
14%
27%
12%
13%
22%
29%
13%
16%
23%
Q1 12 Q2 12 Q3 12 Q4 12 Q1 13 Q2 13 Q3 13 Q4 13 Q1 14 Q2 14
25%
14%
16%
22%24%
12%
15%19%
Q3 14 Q4 14
23%
12%
15%22%
Q1 15
24%
13%
15%19%
Q2 15
26%
14%
16%26%
Q3 15
24%
14%
16%24%
Q4 15
26%
10%
16%
19%
Q1 16
26%
11%15%
17%
Q2 16
28%
10%
16%
18%
Q3 16
29%
12%17%
20%
Q4 16
9%
15%
16%
Q1 17
7%
15%15%
Q2 17
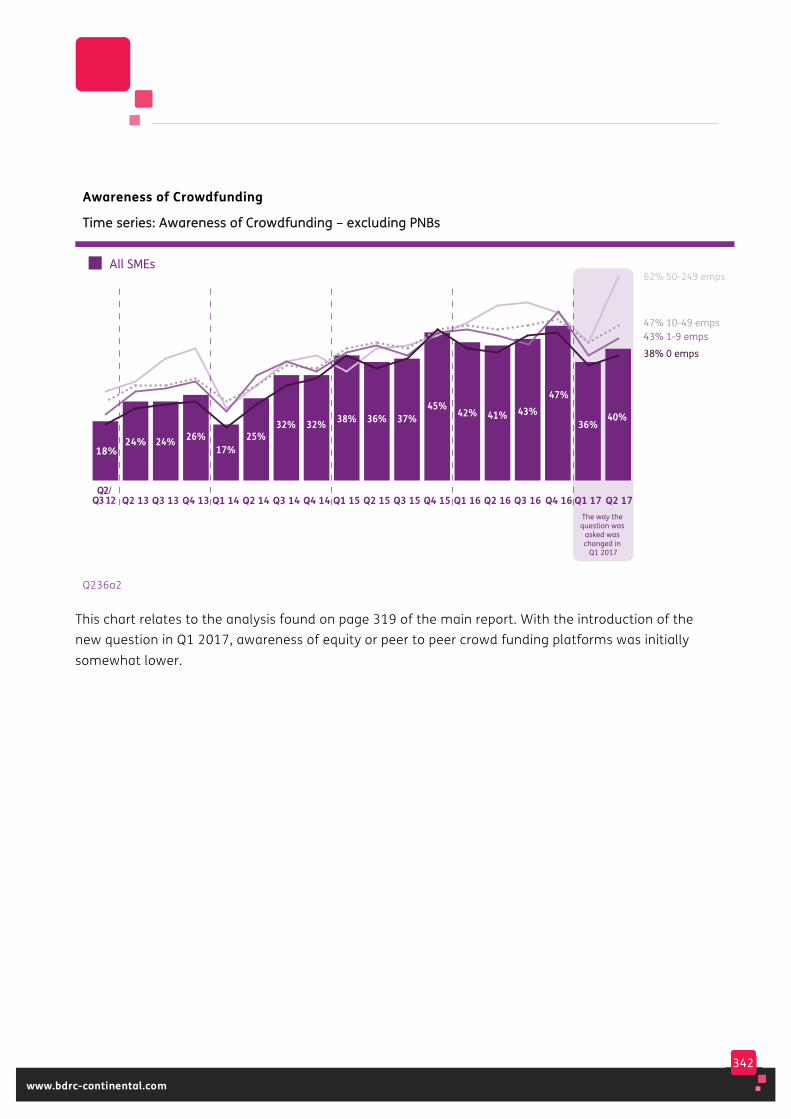
342
www.bdrc-continental.com
Awareness of Crowdfunding
TTiimmee sseerriieess:: AAwwaarreenneessss ooff CCrroowwddffuunnddiinngg –– eexxcclluuddiinngg PPNNBBss
Q236a2
This chart relates to the analysis found on page 319 of the main report. With the introduction of the new question in Q1 2017, awareness of equity or peer to peer crowd funding platforms was initially somewhat lower.
18%
Q2/Q3 12
Q2 13 Q3 13 Q4 13 Q1 14
24% 24% 26%17%
All SMEs
The way the question was
asked was changed in
Q1 2017
62% 50-249 emps
47% 10-49 emps43% 1-9 emps
38% 0 emps
Q2 14 Q3 14
25%32%
Q4 14 Q1 15
32% 38%
Q2 15 Q3 15
36% 37%
Q4 15
45%
Q1 16
42%
Q2 16
41%
Q3 16
43%
Q4 16
47%
Q1 17
36%
Q2 17
40%

343
www.bdrc-continental.com
16. Technical Appendix
This chapter covers the technical elements of the report – sample size and structure, weighting and analysis techniques.
344
www.bdrc-continental.com
Eligible SMEs In order to qualify for interview, SMEs had to meet the following criteria in addition to the quotas by size, sector and region:
• not 50%+ owned by another company
• not run as a social enterprise or as a not for profit organisation
• turnover of less than £25m.
The respondent was the person in charge of managing the business’s finances. No changes have been made to the screening criteria in any of the waves conducted to date.
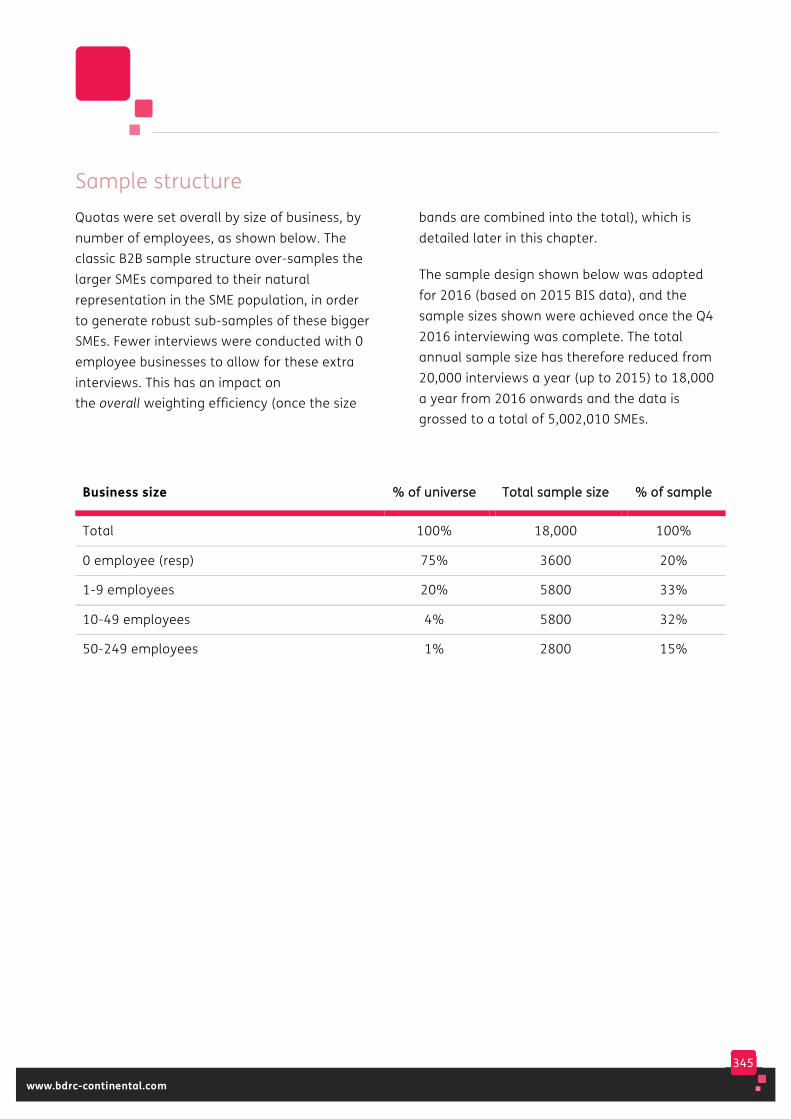
345
www.bdrc-continental.com
Sample structure Quotas were set overall by size of business, by number of employees, as shown below. The classic B2B sample structure over-samples the larger SMEs compared to their natural representation in the SME population, in order to generate robust sub-samples of these bigger SMEs. Fewer interviews were conducted with 0 employee businesses to allow for these extra interviews. This has an impact on the overall weighting efficiency (once the size
bands are combined into the total), which is detailed later in this chapter.
The sample design shown below was adopted for 2016 (based on 2015 BIS data), and the sample sizes shown were achieved once the Q4 2016 interviewing was complete. The total annual sample size has therefore reduced from 20,000 interviews a year (up to 2015) to 18,000 a year from 2016 onwards and the data is grossed to a total of 5,002,010 SMEs.
Business size %% ooff uunniivveerrssee TToottaall ssaammppllee ssiizzee %% ooff ssaammppllee
Total 100% 18,000 100%
0 employee (resp) 75% 3600 20%
1-9 employees 20% 5800 33%
10-49 employees 4% 5800 32%
50-249 employees 1% 2800 15%

346
www.bdrc-continental.com
Overall quotas were set by sector and region as detailed below. In order to ensure a balanced sample, these overall region and sector quotas were then allocated within employee size band to ensure that SMEs of all sizes were interviewed in each sector and region.
Business sector*
((SSIICC 22000077 iinn bbrraacckkeettss)) %% ooff uunniivveerrssee TToottaall ssaammppllee ssiizzee %% ooff ssaammppllee
AB Agriculture etc. (A) 3% 1200 7%
D Manufacturing (C) 6% 1500 8%
F Construction (F) 19% 3200 18%
G Wholesale etc. (G) 10% 1800 10%
H Hotels etc. (I) 4% 1200 7%
I Transport etc. (H&J) 12% 2000 11%
K Property/Business Services (L,M,N) 27% 3600 20%
N Health etc. (Q) 7% 1500 8%
O Other (R&S) 12% 2000 11%
Quotas were set overall to reflect the natural profile by sector, but with some amendments to ensure that a robust sub-sample was available for each sector. Thus, fewer interviews were conducted in Construction and Property/Business Services to allow for interviews in other sectors to be increased, in particular for Agriculture and Hotels & Restaurants.
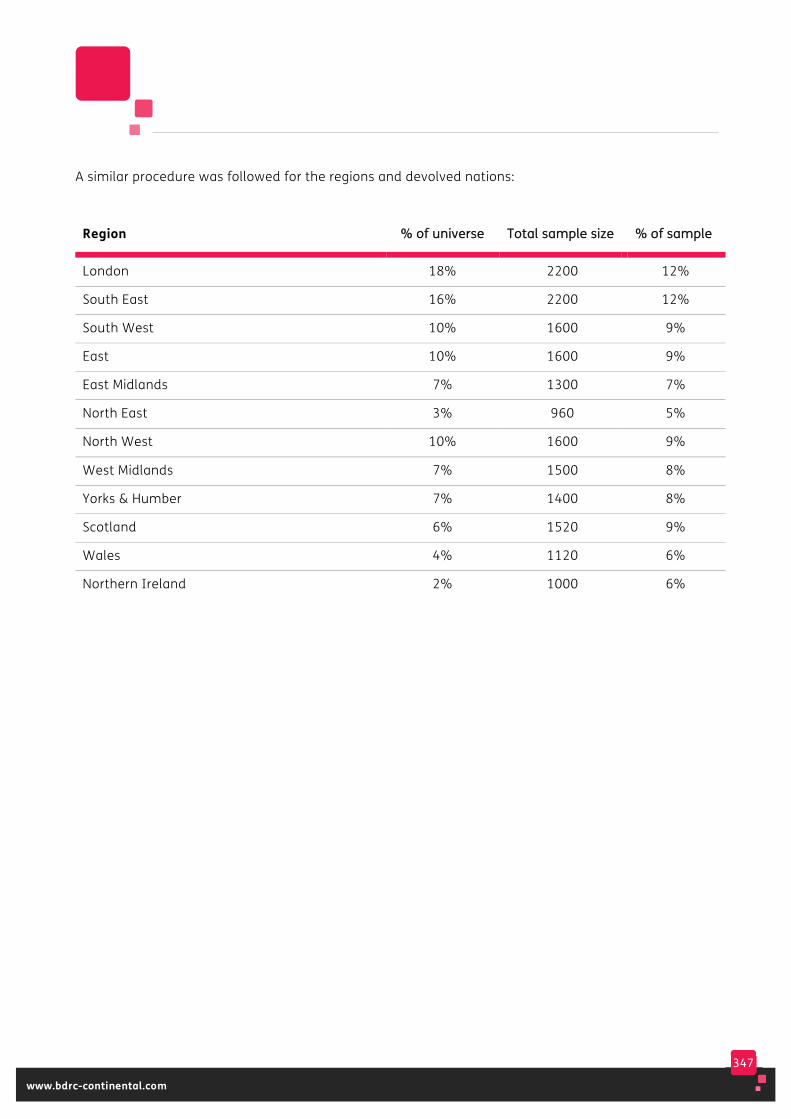
347
www.bdrc-continental.com
A similar procedure was followed for the regions and devolved nations:
Region %% ooff uunniivveerrssee TToottaall ssaammppllee ssiizzee %% ooff ssaammppllee
London 18% 2200 12%
South East 16% 2200 12%
South West 10% 1600 9%
East 10% 1600 9%
East Midlands 7% 1300 7%
North East 3% 960 5%
North West 10% 1600 9%
West Midlands 7% 1500 8%
Yorks & Humber 7% 1400 8%
Scotland 6% 1520 9%
Wales 4% 1120 6%
Northern Ireland 2% 1000 6%
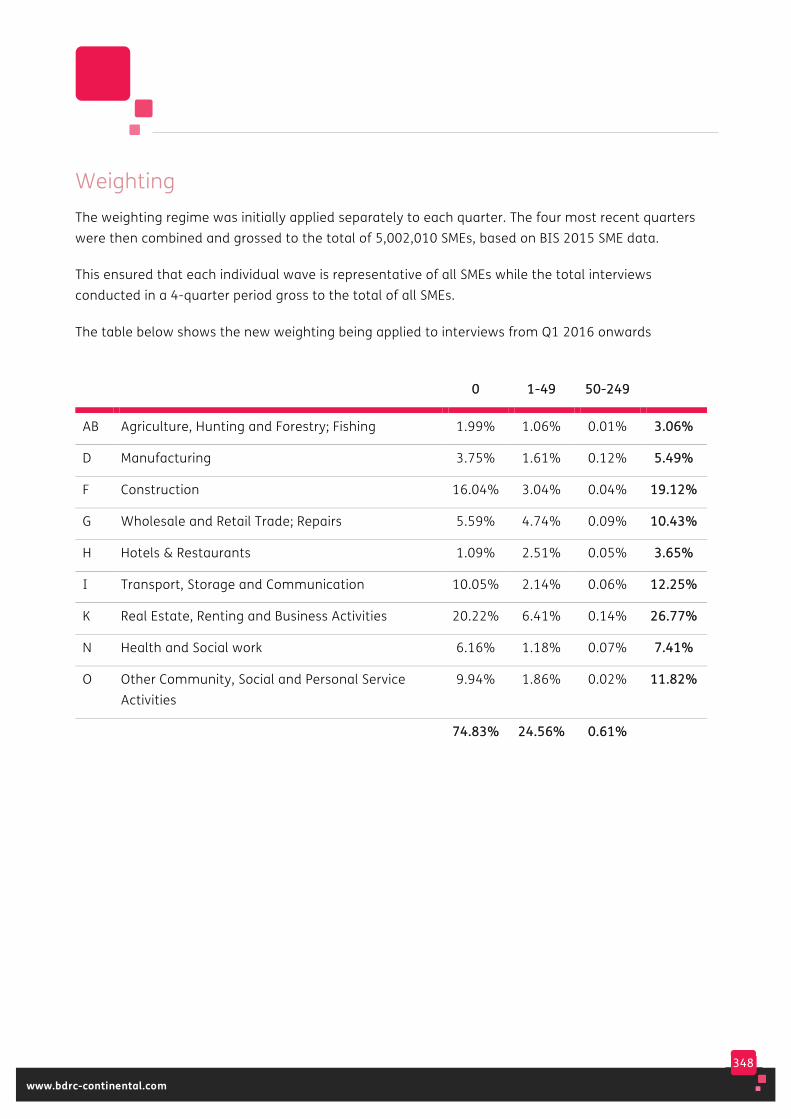
348
www.bdrc-continental.com
Weighting The weighting regime was initially applied separately to each quarter. The four most recent quarters were then combined and grossed to the total of 5,002,010 SMEs, based on BIS 2015 SME data.
This ensured that each individual wave is representative of all SMEs while the total interviews conducted in a 4-quarter period gross to the total of all SMEs.
The table below shows the new weighting being applied to interviews from Q1 2016 onwards
00 11--4499 5500--224499
AB Agriculture, Hunting and Forestry; Fishing 1.99% 1.06% 0.01% 33..0066%%
D Manufacturing 3.75% 1.61% 0.12% 55..4499%%
F Construction 16.04% 3.04% 0.04% 1199..1122%%
G Wholesale and Retail Trade; Repairs 5.59% 4.74% 0.09% 1100..4433%%
H Hotels & Restaurants 1.09% 2.51% 0.05% 33..6655%%
I Transport, Storage and Communication 10.05% 2.14% 0.06% 1122..2255%%
K Real Estate, Renting and Business Activities 20.22% 6.41% 0.14% 2266..7777%%
N Health and Social work 6.16% 1.18% 0.07% 77..4411%%
O Other Community, Social and Personal Service Activities
9.94% 1.86% 0.02% 1111..8822%%
7744..8833%% 2244..5566%% 00..6611%%
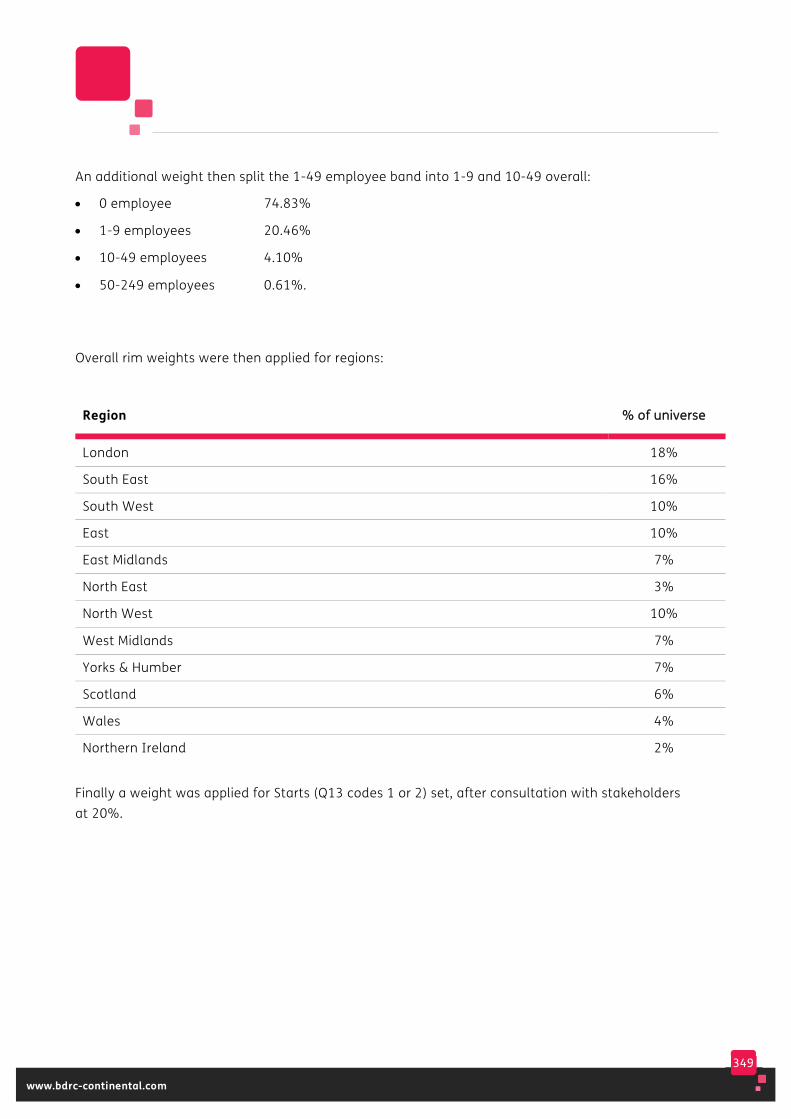
349
www.bdrc-continental.com
An additional weight then split the 1-49 employee band into 1-9 and 10-49 overall:
• 0 employee 74.83%
• 1-9 employees 20.46%
• 10-49 employees 4.10%
• 50-249 employees 0.61%.
Overall rim weights were then applied for regions:
Region %% ooff uunniivveerrssee
London 18%
South East 16%
South West 10%
East 10%
East Midlands 7%
North East 3%
North West 10%
West Midlands 7%
Yorks & Humber 7%
Scotland 6%
Wales 4%
Northern Ireland 2%
Finally a weight was applied for Starts (Q13 codes 1 or 2) set, after consultation with stakeholders at 20%.
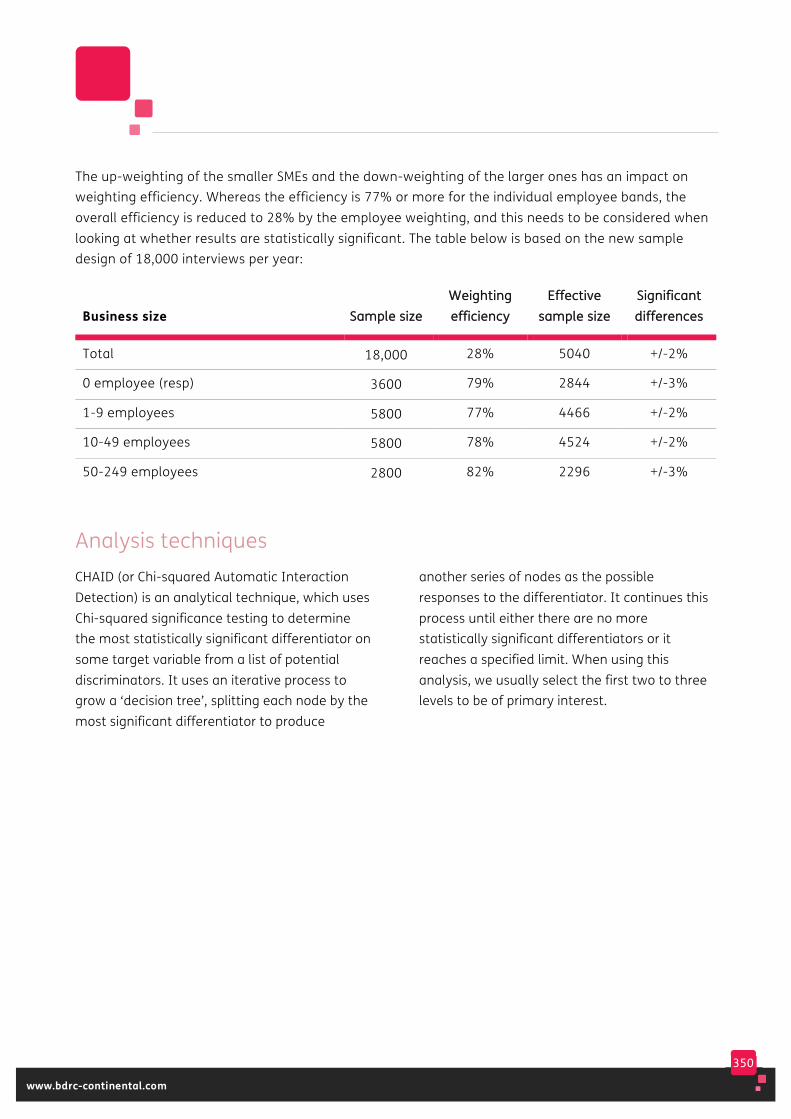
350
www.bdrc-continental.com
The up-weighting of the smaller SMEs and the down-weighting of the larger ones has an impact on weighting efficiency. Whereas the efficiency is 77% or more for the individual employee bands, the overall efficiency is reduced to 28% by the employee weighting, and this needs to be considered when looking at whether results are statistically significant. The table below is based on the new sample design of 18,000 interviews per year:
Business size SSaammppllee ssiizzee WWeeiigghhttiinngg eeffffiicciieennccyy
EEffffeeccttiivvee ssaammppllee ssiizzee
SSiiggnniiffiiccaanntt ddiiffffeerreenncceess
Total 18,000 28% 5040 +/-2%
0 employee (resp) 3600 79% 2844 +/-3%
1-9 employees 5800 77% 4466 +/-2%
10-49 employees 5800 78% 4524 +/-2%
50-249 employees 2800 82% 2296 +/-3%
Analysis techniques CHAID (or Chi-squared Automatic Interaction Detection) is an analytical technique, which uses Chi-squared significance testing to determine the most statistically significant differentiator on some target variable from a list of potential discriminators. It uses an iterative process to grow a ‘decision tree’, splitting each node by the most significant differentiator to produce
another series of nodes as the possible responses to the differentiator. It continues this process until either there are no more statistically significant differentiators or it reaches a specified limit. When using this analysis, we usually select the first two to three levels to be of primary interest.
351
www.bdrc-continental.com
This report is the largest and most detailed study of SMEs’ views of bank finance ever undertaken in the UK. More importantly, this report is one of a series of regular reports. So not only is it based on a large enough sample for its findings to be robust, but over time the dataset has been building into a hugely valuable source of evidence about what is really happening in the SME finance market.
A report such as this can only cover the main headlines emerging from the results. Information within this report and extracts and summaries thereof are not offered as advice, and must not be treated as a substitute for financial or economic advice. This report represents BDRC Continental’s interpretation of the research information and is not intended to be used as a basis for financial or investment decisions. Advice from a suitably qualified professional should always be sought in relation to any particular matter or circumstance.