Boulder Creek Characterization attach#1 - azdeq. · PDF fileBill Williams is comprised of four...
52
1 Boulder Creek Watershed Inventory & Characterization Part I of the Boulder Creek Implementation Plan By: Max Enterline Watershed Coordinator Watershed Management Unit Arizona Department of Environmental Quality Date: February 13, 2003 Satellite Map View of the Boulder Creek Watershed
Transcript of Boulder Creek Characterization attach#1 - azdeq. · PDF fileBill Williams is comprised of four...

1
Boulder Creek Watershed Inventory
& Characterization
Part I of the Boulder Creek Implementation Plan
By: Max Enterline Watershed Coordinator
Watershed Management Unit Arizona Department of Environmental Quality
Date: February 13, 2003 Satellite Map View of the Boulder Creek Watershed

2
Abstract
This Watershed Inventory and Characterization was
prepared by Max Enterline, using Geographic Information
Systems (GIS) at the Arizona Department of
Environmental Quality (ADEQ) in 2003. The information
was compiled from existing data sources available on
ADEQ’s GIS system and other agency sources that were
available at the time of this report. ArcView 3.2 and
ArcGIS 8.3 were also used to compile the maps. The
“clipping method” was used with ESRI’s ArcInfo software
to quantify and qualify the basic environmental
information needed to further understand the nature and
“character” of the ecosystem in Boulder Creek.
ADEQ is required to prepare such a plan due to existing
and historical impairments to the watershed based on
state statutes, A.R.S. 49-231(3) (ADEQ, 2002-2003). The
geographic scale of the watershed is considered a 10-
digit Hydrologic Unit Code (HUC) watershed based on
the latest information from the National Resource
Conservation Service (NRCS), formerly known as the
Soil Conservation Service (SCS).
The goal is that this report, parts I & II can fulfill ADEQ’s
mission of compiling comprehensive environmental
information for an area of Arizona that is considered
“impaired” due to heavy metal mining contamination in
Boulder Creek. Boulder Creek has experienced problems
for many years due to the abandoned “Hillside Mine,”
three large tailings piles and a perennial adit discharge
from the toe of the middle pile. A Total Maximum Daily
Load (TMDL) report was prepared to find and allocate the
main pollution sources that are currently causing heavy
metals to be present in Boulder Creek. This report
focuses on the baseline information needed to startup the
process of planning for cleanup, and Part II focuses on
implementing the TMDL report recommendations; see
Boulder Creek Implementation Plan – Part II.
Table of Contents
3
Section…………………………………………………Page
1.0 Historical Background ……………..……………1
2.0 Geography/Topography…………………………1
3.0 Surface Hydrology……………………………….4
4.0 Climate…………………………………………….10
5.0 Groundwater Hydrology…………………………11
6.0 Geology……………………………………………13
7.0 Soils………………………………………………..16
8.0 Vegetation…………………………………...........21
8.1 Biomes/Biotic Communities……….....................21
8.2 GAP Vegetation Zones……...............................23
9.0 Fauna/Wildlife…………………...........................26
Section…………………………………………………Page
10.0 Human Disturbances…………………………...27
10.1 Land Ownership………………………………...27
10.2 Land Uses……………………………………….29
10.3 Agriculture……………………………………….31
10.4 Ranch Cattle Grazing…………………………..31
10.5 Active and Inactive Mining Operations……….32
10.6 Census Population……………………………...34
10.7 Point Sources…………………………………...36
10.8 Existing Non-point Sources…………………….39
11.0 Conclusion.……………………………………….42
12.0 References……………………………………….44
12.1 GIS File References…...………………………..46

4
Glossary of Frequently used Terms and Acronyms
ADEQ Arizona Department of Environmental Quality
ADWR Arizona Department of Water Resources
AGFD Arizona Game & Fish Department
ALRIS Arizona State Land Information System Website
ASLD Arizona State Land Department – Stakeholder
A.R.S. Arizona Revised Statutes
AZPDES Arizona Pollution Discharge Elimination System
BLM Bureau of Land Management – Stakeholder
BMP Best Management Practice – Same as MM
DOI Department of the Interior
EPA Environmental Protection Agency
FSN Fixed Station Network – Sampling Program
GAP Geographic Gap Analysis Program
GIS Geographic Information Systems – Mapping
Software
HUC Hydrologic Unit Code – Numeric Watershed Code
LTP Lower Tailings Pile
MDAS Mining Data Analysis System – A Model
MLRU Major Land Resource Unit – Land Use Cover
MM Management Measure – Same as BMP
m.s.l. Mean Sea Level
MTP Middle Tailings Pile
NPDES National Pollution Discharge Elimination System
NPS nonpoint source pollution
NRCS National Resource Conservation Service
PS Point Source pollution
TIP TMDL Implementation Plan
TMDL Total Maximum Daily Load
UMTRA Uranium Mine Tailings Reclamation Act
USFS United States Forest Service
USGS United States Geological Survey
UTP Upper Tailings Pile
WBP Watershed-based Plan
1
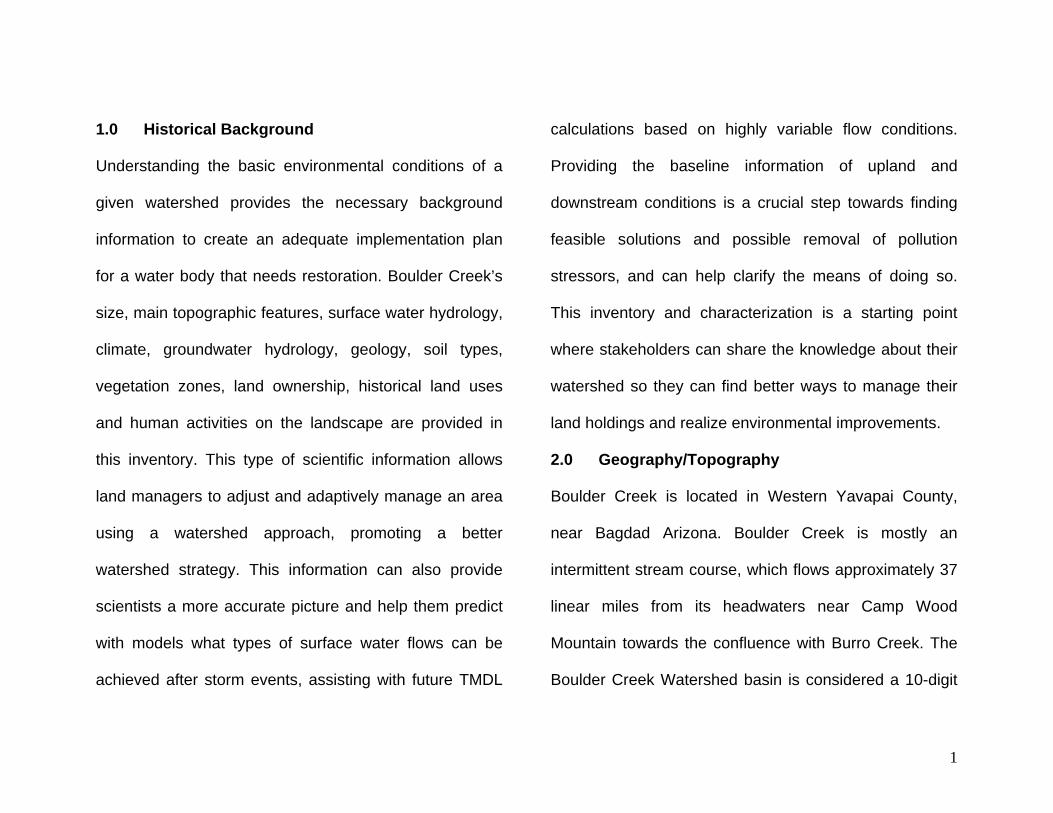
1.0 Historical Background
Understanding the basic environmental conditions of a
given watershed provides the necessary background
information to create an adequate implementation plan
for a water body that needs restoration. Boulder Creek’s
size, main topographic features, surface water hydrology,
climate, groundwater hydrology, geology, soil types,
vegetation zones, land ownership, historical land uses
and human activities on the landscape are provided in
this inventory. This type of scientific information allows
land managers to adjust and adaptively manage an area
using a watershed approach, promoting a better
watershed strategy. This information can also provide
scientists a more accurate picture and help them predict
with models what types of surface water flows can be
achieved after storm events, assisting with future TMDL
calculations based on highly variable flow conditions.
Providing the baseline information of upland and
downstream conditions is a crucial step towards finding
feasible solutions and possible removal of pollution
stressors, and can help clarify the means of doing so.
This inventory and characterization is a starting point
where stakeholders can share the knowledge about their
watershed so they can find better ways to manage their
land holdings and realize environmental improvements.
2.0 Geography/Topography
Boulder Creek is located in Western Yavapai County,
near Bagdad Arizona. Boulder Creek is mostly an
intermittent stream course, which flows approximately 37
linear miles from its headwaters near Camp Wood
Mountain towards the confluence with Burro Creek. The
Boulder Creek Watershed basin is considered a 10-digit

2
hydrologic unit code (HUC) watershed, designated by the
10 digits 15030202-03 (NRCS, 2003). ADEQ utilized the
new mapping delineation from the NRCS as a tool to help
illustrate, define and characterize the Boulder Creek
Watershed using GIS. Boulder Creek lies within the
larger Burro Creek 8-digit HUC watershed designated as
15030202. Burro Creek lies completely within the larger
Bill Williams Watershed area. Bill Williams is comprised
of four of these larger 8-digit HUCs, including Burro
Creek, the Santa Maria River, the Big Sandy River and
the Bill Williams River below Alamo Lake. The Bill
Williams Watershed is one of ten major watersheds that
ADEQ uses to divide the state into “manageable regions”
(See Map 1: Arizona’s Ten Major Watersheds).
Map 1: Arizona’s Ten Major Watersheds

3
The approximate size of the Boulder Creek Watershed is
150 square miles, and its uppermost elevation starts at
Camp Wood Mountain, elevation 7,250 feet above mean
sea level (m.s.l.). The lowest pour point of the watershed
is 2,420 feet m.s.l. as it joins at the confluence with
adjacent Burro Creek. The entire watershed drops in
elevation from the northeast to the southwest over 4,800
feet from Camp Wood Mountain to Burro Creek (See
Map 2: Bill Williams Watershed).
In a satellite photograph one can clearly see two deeply
incised canyons, Boulder and Wilder Creek Canyons that
dominate the middle and lower portions of the watershed.
The upper northeast section appears to be more level
Map 2: Bill Williams Watershed

4
terrain, comprised mostly of U.S. Forest land areas near
Camp Wood Mountain (See Cover Page: Satellite Map).
3.0 Surface Hydrology
Starting in a forested area at the top of Camp Wood
Mountain, at 7,250 m.s.l. numerous dry wash “arroyos”
are formed and they flow generally to the south-
southeast, forming a large wash known as Connell
Gulch. Several side tributaries connect to Connell Gulch.
The upland area also has several stock tanks, springs,
seeps and ephemeral ponds along the drainage areas.
Connell Gulch connects with Stubbs Gulch further
downhill forming the headwaters of Boulder Creek at
~5480 m.s.l. Boulder Creek then trends to the south,
flowing past Silent Basin, Wild Horse Basin, Behm Mesa
and Contreras Wash. Boulder Creek also flows past the
abandoned “Black Pearl” mine. Boulder Creek then joins
with the 2nd largest stream in the watershed, Wilder
Creek. Wilder Creek has numerous tributaries, stock
tanks, pools, ponds and springs that originate from
Strotjost Flat, Windy Ridge, Behm Mesa, Bozarth Mesa,
Contreras Mesa and Long Point.
Steady flows are usually dependant on winter storms and
spring snowmelt. Flows typically occur from late October
to late May, with the highest flow rates from late January
to early March. According to the TMDL report, during
summer and extended drought conditions: Boulder Creek
consists of a number of independent pools separated by
long stretches of dry streambed.
Just downstream of the confluence with Wilder Creek
and Boulder Creek, the “critical area” begins.

5
Map 4: TMDL Critical Area
The TMDL report defines the critical area where the
pollution impairments are known to be located, and
where the TMDL researchers concentrated their
sampling efforts (ADEQ, 2003). Just west and south of
the Wilder Creek confluence, remnants of the former
Hillside Mine can be easily observed next to the Boulder
Creek drainage. Three large tailings piles with eroded
dam structures and the collapsed head frame entrance
can still be seen next to the Boulder Creek main stem.
Erosion is evident on all three tailings piles and the dam
structures need repair that lie next to Boulder Creek. At
the Upper Tailings Pile the surface topography is very
steep, creating a difficult access issue for the general
area. Boulder Creek then bends back to the south
passing by the other two large tailings piles. The middle
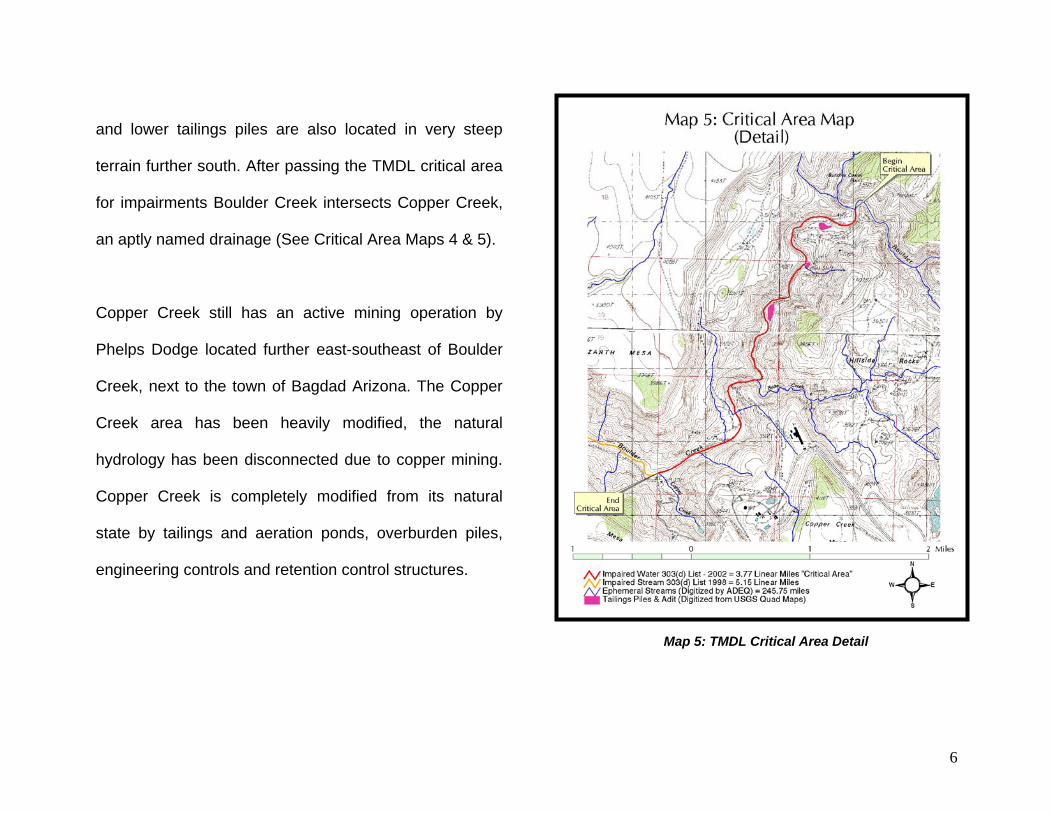
6
Map 5: TMDL Critical Area Detail
and lower tailings piles are also located in very steep
terrain further south. After passing the TMDL critical area
for impairments Boulder Creek intersects Copper Creek,
an aptly named drainage (See Critical Area Maps 4 & 5).
Copper Creek still has an active mining operation by
Phelps Dodge located further east-southeast of Boulder
Creek, next to the town of Bagdad Arizona. The Copper
Creek area has been heavily modified, the natural
hydrology has been disconnected due to copper mining.
Copper Creek is completely modified from its natural
state by tailings and aeration ponds, overburden piles,
engineering controls and retention control structures.

7
These mine structures, erosion control structures and
pollution controls limit and control surface water flows
that may contain heavy metals. The TMDL report in 2003
determined that copper mining pollutants no longer
contribute pollutant loadings to Boulder Creek from
Copper Creek. Downstream of this confluence with
Copper Creek, Boulder Creek is no longer listed for
heavy metal impairments and was subsequently “de-
listed” based on the TMDL sampling and analyses
(ADEQ, 2003).
At this point on Boulder Creek below Copper Creek most
of the heavy metals have naturally attenuated from the
Hillside Mine due to the large distance; lack of flows and
partially due to heavy metal precipitation within the water
column. Heavy metals precipitate in the water column by
dropping off and saturating within the stream sediments
as the water flow rate slows down over distance. The
TMDL model utilized this precipitation variable to more
accurately predict the fate of transport of these heavy
metal pollutants (See the Boulder Creek Implementation
Plan, Part II for further discussion pp. 15-16).
Further downstream Boulder Creek turns to the west past
Bozarth Mesa; Scorpion Mesa - a large re-vegetated
tailings pile; one side tributary from Mulholland Basin;
and past Zana Canyon located on the western fringe of
the Boulder Creek Watershed. Finally Boulder Creek
ends where it joins at the “pour point” with the Unique
Water known as Burro Creek. Burro Creek and one of the
tributaries Francis Creek were nominated as unique
waters due to their recreational or ecological significance

8
and offer critical habitat for threatened or endangered
species (ADHS & BLM, 1985).
Based on the GIS analysis conducted for this report, 32
springs, seeps or wells were identified for the entire
Boulder Creek 10-digit HUC watershed. The original
spring cover available on the State Land Department
website known as ALRIS only identified 21 springs for the
watershed after clipping. It should be noted that the
Behm Mesa 7.5 minute USGS topographic quadrangle
map did not have any springs, seeps or wells identified
on the base map. Therefore this lack of information
appears to be a data gap regarding this portion of the
watershed and could be augmented with more accurate
mapping information at a later date. ADEQ digitized all
the drainages colored blue on the USGS maps in GIS to
gain a more accurate estimate of the stream lengths by
zooming in close on each water body. The stream
lengths are listed in the text box at left.
One caveat is that some of the intermittent stream miles
shown in GIS may actually be perennial flowing stream
segments depending on annual climate conditions, based
on conversations with ADEQ’s TMDL field personnel.
Digitized Stream Lengths in GIS
All streams in Boulder Creek = 296 miles
Intermittent streams = 45 miles
Ephemeral streams = 251 miles
Boulder Creek, headwaters to pour point = 39.72 miles
Wilder Creek, headwaters to pour point = 17.26 miles
Zana Canyon, headwaters to pour point = 14.93 miles

9
Year round perennial flows in Boulder Creek’s watershed
require on-the-ground verification. GIS digitizing with
remote viewing is a method that usually has a built-in
margin of error when there is no on-the-ground
verification.
Another caveat is the GIS analysis is static in time based
on the dates of existing GIS files and USGS maps. Due
to the extreme drought conditions since the late 1990s,
streams that were once perennial can change due to
declining groundwater tables. The same is true for
intermittent streams that can dry up so much they too
change in character to being ephemeral, controlled
strictly by rain events rather than rising groundwater
tables. These changing hydrologic conditions are
dynamic, can change periodically and are not static. (See
Map 6: Surface Water Resources Map

10
Map 6: Surface Water Resources Map & large fold out
Surface Water Resources Map as a pocket part).
4.0 Climate
Typical for Arizona’s watersheds, rain events vary in
intensity from the short duration summer monsoon
storms to the longer lasting winter rains. Winter rains are
less intense and are more beneficial towards recharging
the subsurface aquifers and vegetation. Less evaporation
from surface waters and less evapotranspiration from
plants typically occur in the winter as well.
Summer monsoon events are flashier and can cause a
great deal of erosion and flood damage. These high
intensity storms are usually less beneficial in terms of
groundwater and plant recharge. Higher rates of
evaporation and evapotranspiration further limit the Map 7: Precipitation Map

11
usefulness of summer rain events to the desert
watersheds (See Map 7: Precipitation Map).
Precipitation in Boulder Creek ranges from 20-25 inches
per year in the upland Prescott Forest area, especially
near the peak of Camp Wood Mountain and elevations
above 6000 feet m.s.l. From 4500 to 6000 feet the middle
portions of the watershed typically have 15-20 inches of
rain annually. Below 4500 feet one can expect 10-15
inches of rain per year in these dry desert portions of the
watershed (See Map 7: Precipitation Map).
The nearest meteorological station in Bagdad has
recorded precipitation data, providing representative
conditions of the nearby Boulder Creek Watershed. The
station is located at 3704 feet m.s.l. and has recorded
continuous data since 1928. Average annual precipitation
in Bagdad is 15 inches, with a low annual flow of 3 inches
recorded in 1958 and a high of 29.2 inches in 1978. Daily
temperature data since 1929 for Bagdad indicates an
average annual temperature of 63.1 Fahrenheit (F). The
temperature varied from average monthly readings of
45.7 F in January to 82.7 F in July (Tetra Tech, 2001).
5.0 Groundwater Hydrology
The connection between groundwater and surface water
is very important. This relationship is especially important
in drier desert regions like Boulder Creek, where
groundwater is the only reliable source of potable water
supply for drinking water and other commercial beneficial
uses of water, such as mining. Two groundwater sub-
basins lie underneath the Boulder Creek watershed.
Groundwater “sub-basins” should not be confused with

12
surface water “sub-basins”. The most important
groundwater sub-basin is the Burro Creek Sub-basin,
which lies under most of the Boulder Creek surface
watershed. The other groundwater sub-basin, which lies
under the southern tip of the Boulder Creek Watershed,
is the Santa Maria Sub-basin (ADWR, 2003).
This inventory identified 32 total springs, seeps or wells
in the Boulder Creek watershed. These surface water
features are controlled by groundwater level and
pressure changes within the groundwater sub-basins
(See Map 8: Groundwater Resources).
One spring-seep formed by a collapsed mining adit is
located in the TMDL critical area where the Middle
Tailings Pile (MTP) is located. This seep is considered Map 8: Groundwater Resources

13
one of the main loading sources of arsenic to the Boulder
Creek river system. The TMDL report also quantifies the
percentage of arsenic needing removal so the creek can
meet applicable surface water standards (ADEQ, 2003).
6.0 Geology
The geology of Boulder Creek consists of five major rock
type categories: basalt, granitic, metamorphic,
sedimentary and volcanic. Grouping the geologic zones
into five basic rock type categories helps simplify our
understanding of Boulder Creek’s geology. Each rock
type can exhibit different levels of groundwater saturation
and storage potential.
For instance, alluvial rock types would be expected to
have the most groundwater saturation and storage
potential than other rock types. However, alluvial rock
types were not identified in this watershed, re-affirming
the dry “character” of the Boulder Creek watershed.
Sedimentary rock types, somewhat similar to alluvium,
also exhibit higher saturation and storage potential than
the remaining rock types.
With this basic understanding, we can posit that this
watershed has more limited groundwater resource
potential when compared to other alluvial-dominated
watersheds. Also, one would not expect to find as much
groundwater stored in granitic or basalt formations unless
there are subsurface fissures, pore spaces and/or voids
Rock Types Square Miles PercentageBasalt 88 58.6% Granitic 36.4 24.2% Sedimentary 20 13.3% Metamorphic 2.7 1.8% Volcanic 2.5 1.6%

14
that have the potential to store more groundwater
reserves. Based on the GIS analysis of this watershed
the Boulder Creek area is underlain by the following
geologic rock types. The magnitudes of these rock types
are also quantified by percentage of Boulder Creek’s total
area in the table above.
Based on the geologic findings one would not expect
large amounts of groundwater reserves in the Boulder
Creek area. Largest in magnitude, basalt underlies more
than half of the watershed. Granitic rocks underlie
another ¼ of the watershed. Sedimentary rock types
represent only 13% of the entire watershed. Metamorphic
rock types appear to underlie the critical area of the
Hillside Mine, colored light-green. (See Map 9: Geologic
Rock Types).
Map 9: Geologic Rock Types

15
Map Unit
Age
Rock Type
Tb Late to middle Miocene; 8 to 16 Ma Basalt
TKg Early Tertiary to Late Cretaceous; 55 to
85 Ma Granitic
Tsm Middle Miocene to Oligocene; 15 to 38
Ma Sedimentary
Xg Early Proterozoic; 1650 to 1750 Ma Granitic
Xm Early Proterozoic; 1650 to 1800 Ma Metamorphic
Xmv Early Proterozoic; 1650 to 1800 Ma Volcanic
Yg Middle Proterozoic; 14000 Ma Granitic
(Source: Stephen J. Reynolds, 1988)
Sedimentary areas of the watershed would be expected
to have more groundwater potential, more springs, seeps
or wells that are borne from sedimentary rock types in
general. These sedimentary areas (colored yellow) are
extremely important towards further development and/or
applying for the beneficial uses of potential groundwater
reserves. The different ages that these rock types were
formed are also shown on adjacent table (Reynolds,
1988).
A more detailed analysis of Boulder Creek reveals the
area’s geologic complexity. Exposed rocks in this area
are predominately Precambrian and Tertiary in age.
Older Precambrian rocks consist of metamorphosed
volcanic and sedimentary rocks that have been intruded
and deformed by granitic and gabbroic rocks. These
were subsequently covered by Cretaceous or early
Tertiary rhyolite tuffs, intruded rhyolite dikes and quartz
monzonite. Quaternary lava flows later carved into the
present day mesas (Andersen et al, 1955). In the TMDL
critical area Boulder Creek cuts through very steep
canyons and mesas capped with Quaternary basalt flows
and underlying basement rock. Near the Hillside Mine the

16
creek cuts through a section of mica schist,
metamorphosed sandstone and shale complex. Near the
lower tailings pile the creek flows over Butte Falls tuff, a
bedded, water saturated and metamorphosed tuff that
grades upward into the mica schist near the Hillside
Mine. Downstream a short distance from Butte Falls the
creek gradient decreases and the canyons walls become
less constrictive. Boulder Creek then flows over outcrops
of gabbro, Gila conglomerate and Quaternary gravels
(Andersen et al, 1955).
Another report from EPA indicates that Lawler Peak, a
nearby mountaintop composed mainly of granite strikes
underneath the Hillside Mine. The granite derived from
Lawler Peak reportedly has higher levels of uranium
naturally in the ore body than in other copper-mined
regions of Arizona (EPA, 1999). Therefore, one would
expect to see some higher background levels of uranium
from the Lawler Peak granite than the background levels
in other copper mined regions of the state.
Since the natural geology of Lawler Peak and the
subsurface under the Hillside Mine have recorded higher
background levels of uranium in the granite ore body one
would also expect to see some higher uranium-radon
readings from the Hillside Mine tailings piles than in other
copper tailings across the state. Several surface water
and soil analytical measurements were taken from the
upper and middle tailings piles in 1993 by ADEQ that do
indicate some higher levels than background for the
Lawler Peak granites (ADEQ 1993 & EPA, 1999).

17
However, it should be noted that none of the readings
taken in 1993 exceeded today’s “applicable surface water
quality standards” based on Boulder Creek’s assigned
designated uses (ADEQ, 2003). The adit discharge was
also measured and was found to have high readings of
“Gross Alpha”, a by-product of uranium decay in rocks
that would have violated 1993 drinking water standards,
but currently there are no Domestic Water Source (DWS)
designated uses are assigned to this remote area of
Boulder Creek (ADEQ, 1993 & 2003).
7.0 Soils
Soils in the Boulder Creek Watershed are extremely
important to understand. Aldo Leopold, a famous
naturalist known as the father of wildlife ecology (1887-
1948), observed that there is a strong relationship
between soils and wildlife populations. Today watershed
scientists have observed similarly that topsoil conditions
have a strong correlation with water quality conditions in
general.
This is true in the Boulder Creek region where soil
sediment transport due to erosive soils can have an
impact on the movement of heavy metal pollutants. Also,
clay-dominated soils tend to absorb, store and potentially
transport pollutants, though slow leaching and
percolation the heavy metal mercury. Since there is a
strong relationship between stream health and sediment
erosion in a given watershed, gaining a basic
understanding of soil types along the surface, their
erosive capacity, slope and saturation potential are useful
variables to consider for this Plan. Based on a clipping
procedure used in ArcInfo GIS, surface soil textures were

18
identified along with their magnitudes by percentage of
the total watershed in the table below:
One interesting finding from the GIS soil cover file is that
Wilder Creek and Boulder Creek’s main stem is underlain
by unweathered bedrock. This unweathered bedrock
area extends through the TMDL critical area where the
impairments are located. Clearly unweathered bedrock
would be expected to be less erosive. Scoured bedrock
areas would normally withstand erosional forces and
allow water to transport farther and with greater speed
down unweathered bedrock drainage areas. The erosive
capacity information is measured in specific weights of
each soil cover type, including the sum weight of the
surface soils only, and another measurement showing
the sum weight of the entire soil layer, expressed in
average numbers.
The higher the recorded sum weight “K” factor number,
the greater the erosive capacity of that soil type. For
example, the “unweathered bedrock” in Wilder and
Boulder Creek has the assigned soil weight value of
0.000, meaning this type of soil cover has a very low or
almost “zero” erosive capacity. Therefore, the higher the
sum weight average number, the more concerns we may
Soil Texture Types Square Miles
Percentage
Cobbly-Clay 71.3 47.5% Cobbly-Sandy Loam 21 14% Very Gravelly-Sandy Loam 20.4 13.6% Unweathered Bedrock 17.4 11.6% Loam 10 6.6% Gravelly-Loam 7 4.6% Very Cobbly-Fine Sandy Loam
1.7 1.1%
Sandy Loam 1 0.6%

19
have over erosion. See the soil type average sum weight
numbers in the table below:
ADEQ’s FSN Unit recently released a report that tested
the statistical significance of these sum weighted average
numbers for soils, and whether these values impact Total
Suspended Solids (TSS), field turbidity and lab turbidity.
These are typical monitoring measures of in-stream
water quality health related to sediment transport. The
FSN Unit determined that the sum weight of top layers
had a statistically stronger confidence level than the sum
weight of all layers. See table at right again that includes
both the sum weights of top layers and all layers for
clarity. The FSN unit stated, overall, as might be
intuitively expected, the upper layer’s soil erodibility was
a better indicator of water quality problems than the
average soil erodibility of all layers.
The average sum weight numbers of top layers
highlighted in bold in the above table indicate the three
most erosive areas in the watershed. Loam was the most
highly erosive soil with a sum weight of top layers being
0.3700, located west of Camp Wood Mountain. Cobbly-
Sandy Loam was 0.2360 and Sandy Loam 0.2210.
Soil Texture Types Sum Weight All-K Factors
Sum Weight Top-K Factors
Cobbly-Clay 0.1755 0.0960 Cobbly-Sandy Loam 0.1416 0.2360 Very Gravelly-Sandy Loam
0.0233 0.0300
Unweathered Bedrock
0.0000 0.0000
Loam 0.2155 0.3700 Gravelly-Loam 0.2502 0.2000 Very Cobbly-Fine Sandy Loam
0.1399 0.1510
Sandy Loam 0.2118 0.2210

20
Map 10: Soil Surface Texture Map
Based on the GIS mapping and assigned specific
weights of the top layers only, one can clearly see that
the upper reaches have higher erodibility factors, and the
downstream reaches exhibit lower erodibility factors (See
Map 10: Soil Surface Texture Map).
Therefore, one would expect during a major rainstorm to
see some of these loamy soils from the upper reaches,
moving downhill to the lower reaches and sometimes
depositing, and possibly transporting pollutants along
with the erosive soils on top of Boulder Creek’s
unweathered bedrock areas. The motility (movement) of
erosive sediments across hard landscapes like
unweathered bedrock should be expected during major
storm events. This basic understanding of soil
characteristics in Boulder Creek near the Hillside Mine

21
provides us with additional knowledge about the
geomorphology of the critical area of impairments.
Additional clues can be gleaned from this soil
characterization information, such as where Cobbly-Clay
soils are located above Wilder Creek. Knowledge of
local soil conditions can possibly assist engineers,
planners and water quality specialists to find better
solutions for improving water quality in Boulder Creek.
For instance, determining where clay dominated soils
located nearby could potentially assist in the use of
capping materials for encapsulation of tailings piles
8.0 Vegetation
Few would argue that the relationships between plant life,
wildlife, soil, groundwater, surface water, climate,
agriculture and ranching are potential variables that can
affect watershed health. In the field begin to understand
whether a watershed is suffering based on visual
indications of plant species stress.
Sometimes variables such as limited groundwater
supplies; drought conditions, pollution and/or
mismanagement of land are causally linked to vegetation
health. The recruitment of native species and invasive
species can be directly measured in the field by biologists
to help develop short and/or long-term plans for land
management.
8.1 Biomes/Biotic Communities
Arizona researchers Brown, Lowe and Pace (BLP)
helped create the first classification scheme for native
vegetation types in this southwestern region, using
22
biomes. “Use of the biome concept by BLP is its strength:
Biomes are natural communities characterized by
distinctive vegetation physiognomy and evolutionary
history within a formation, i.e. forest, grassland, and
swamp, persisting through time and space” (Halvorson et
al, 2002).
The BLP classification system uses generalizations, or
broad categories that are designated as biotic
communities of each region. The purpose of the mapping
effort was to “tie wildlife to recognized biomes to meet
local assessment needs and for use by management at
the regional level” (Halvorson et al, 2002). After clipping
in ArcInfo GIS the following biotic communities or biomes
were identified in the Boulder Creek Watershed showing
the magnitude of each biome in descending order in the
table below:
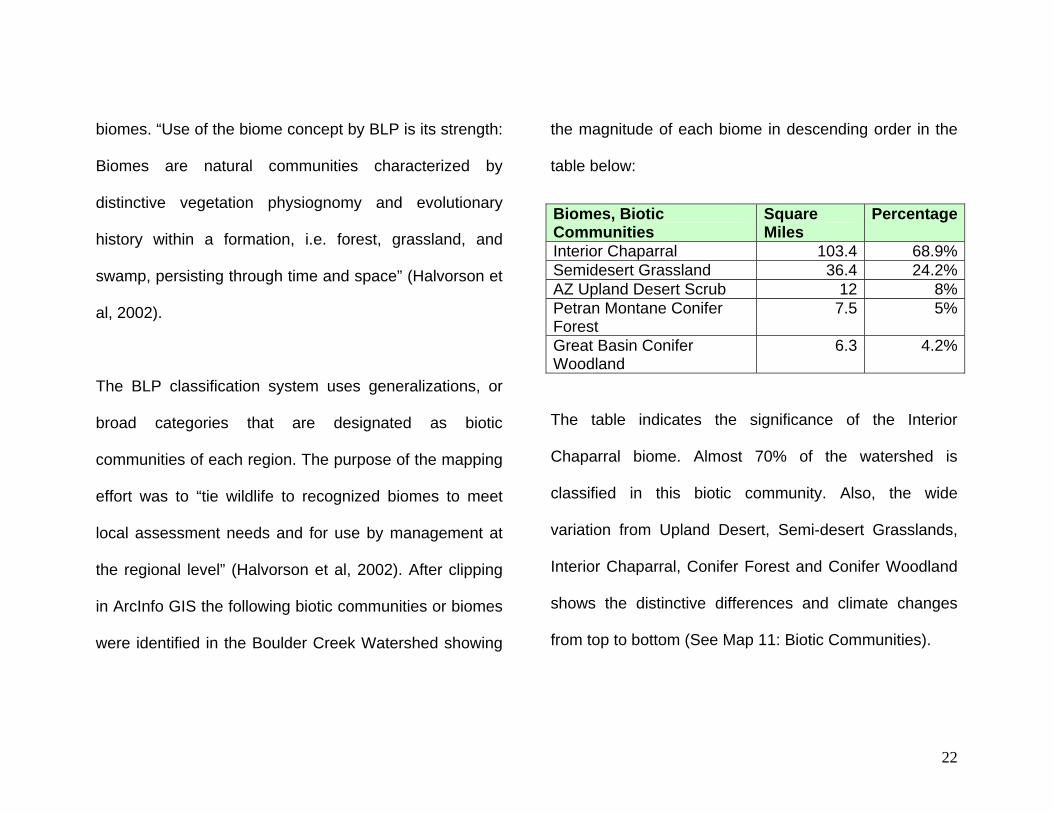
The table indicates the significance of the Interior
Chaparral biome. Almost 70% of the watershed is
classified in this biotic community. Also, the wide
variation from Upland Desert, Semi-desert Grasslands,
Interior Chaparral, Conifer Forest and Conifer Woodland
shows the distinctive differences and climate changes
from top to bottom (See Map 11: Biotic Communities).
Biomes, Biotic Communities
Square Miles
Percentage
Interior Chaparral 103.4 68.9%Semidesert Grassland 36.4 24.2%AZ Upland Desert Scrub 12 8%Petran Montane Conifer Forest
7.5 5%
Great Basin Conifer Woodland
6.3 4.2%

23
Map 11: Biotic Communities
8.2 GAP Vegetation Classes
The University of Arizona in Tucson and Northern
Arizona University in Flagstaff helped compile the GAP
vegetation classification system in 2001. The GAP was
formed to identify conservation priorities and “gaps” in the
protection of biodiversity at a landscape scale (Halvorson
et al, 2002). The researchers used satellite images taken
from 1991 through 1993. Then they digitized around
those areas that exhibited similar spectral rates, infra red
light and other light-band frequencies (Halvorson et al.,
2002).
The college researchers noted that this remote-viewing
method was particularly effective in accurately identifying
forest, woodlands, shrub and desert scrub communities.
They also observed through caveat that grassland

24
biomes were much harder to digitize with accuracy and
differentiate using remote sensing satellite photo
interpretation (Halvorson et al, 2002). The GAP project
recently created an additional mapping research effort
that directly correlates to this vegetation cover, showing
animal species richness on a landscape scale. This
species richness cover was not readily available at the
time of this report.
An accuracy assessment was conducted for each
vegetation classification in the final GAP report. “The
purpose of the accuracy assessment is to allow potential
users to determine the map’s fitness for use in their
applications.” (Halvorson et al, 2002) Two of the zones
“industrial” and “agricultural” were also considered to
have a high accuracy rate for spectral interpretation. It is
intuitive that these human-made zones would be more
discernible from satellite images because they typically
are easy to identify from surrounding more natural
GAP Vegetation Zones Square Miles
Percentage
1. PJ (Mixed)/Mixed Chaparral-Scrub
52.2 34.7%
2. Interior Chaparral (Mixed)/ Mixed Grass-Scrub Complex
23.9 15.9%
3. Semidesert Grassland 20.5 13.6% 4. Pinyon-Juniper (Mixed) 19.2 12.7% 5. PJ/Sagebrush/Mixed Grass Scrub
10.4 6.9%
6. Industrial 8.3 5.5% 7. PJ-Shrub/Ponderosa Pine-Gambel Oak-Juniper
8.4 5.5%
8. Interior Chaparral (Mixed)/ Sonoran Paloverde-Mixed Cacti
6.6 4.4%
9. Interior Chaparral-Shrub Live Oak- Pointleaf Manzanita
5.3 3.5%
10. Agriculture 0.4 0.26%
25
landscape areas.
ADEQ found it useful to query these biome classifications
to determine the extent of acreage of each type of land
cover in the Boulder Creek Watershed. Based on the
clipping procedure in GIS, fifteen different vegetation
classifications were identified, and the ten most important
types are listed in descending order in the table on page
24.
The GAP vegetation classes indicate more subtle
variations between areas than the biotic communities
established by BLP. The largest class, Pinyon Juniper
(Mixed)/Mixed Chaparral-Scrub covers 34.7% of the
entire watershed. This shows that the Interior Chaparral
areas have a scattering of Pinyon Juniper trees in the
unit, where the previous BLP information does not make
this distinction. The industrial area identified is of special
interest because it clearly shows the aerial extent of the
Phelps Dodge’s Bagdad mining operation.
The industrial classification covers over 8 square miles of
the watershed. A very small area of agriculture was
identified in the middle of the mined industrial area. Other
small vegetation area classifications were not included in
the table above for brevity. (See Map 12: GAP
Vegetation Communities).
9.0 Fauna
A multi-agency research effort is currently underway to
define critical habitat areas in Yavapai and Mohave
Counties for large ungulates (hoofed animals), such as
elk, desert bighorn, mule deer, pronghorn antelope and

26
white-tailed deer. Arizona Game & Fish Department
(AGFD) identified the need for this effort and the USGS
and Northern Arizona University are collaborating on this
thematic mapping project.
The Boulder Creek Watershed lies entirely within
Yavapai County, and their hoofed animal research will
help identify those critical habitats that are in need of
restoration and improved connectivity. Also, their
research will use satellite images to document temporal
changes across the landscape to identify trends of
habitat loss. Their research when completed can be used
to augment the inventory when the information becomes
readily available. Other animals observed in the
watershed are mountain lions, javelina, small mammals,
and various bird species. Several mountain lions sitings
Map 12: GAP Vegetation Communities

27
with new cubs were made by local area miners from
Phelps Dodge. One group apparently lives in the Butte
Creek subwatershed, a tributary to Boulder Creek near
the critical area (Karl Ford, Interview, 2003).
Boulder Creek is also home to a variety of fish, most
notably Gila robusta (Roundtail Chub) and Catostomus
insignis (Sonoran Sucker). No federally threatened or
endangered (T&E) fish species have been sighted in
Boulder Creek (Peter Unmack, Interview, 2002).
10.0 Human Disturbances
This section will cover the baseline information regarding
human-caused disturbances to the watershed. Since this
Plan is iterative in nature, this section may be expanded
at a later date.
10.1 Land Ownership
The shape, complexity and arrangement of land
ownership boundaries can directly affect the way in which
a watershed can be effectively managed. Ownership is
one of the main drivers for forming partnerships,
coordinating and managing various stakeholder interests.
Successful partnerships work towards common goals,
common interests and help to prioritize the watershed
issues in a given area. Mutual understanding and
collaboration through forming partnerships is an
educational process that requires everyone’s help,
coordination and information sharing. The inventory and
Implementation Plan Part II should help in this regard.

28
State Trust lands managed by the Arizona State Land
Department (ASLD) comprise roughly 2/3rds of the entire
watershed. The critical area of impairment at the Hillside
Mine involves three of the four landowners in the Boulder
Creek Watershed: 1) the BLM owns the upper tailings
pile (LTP), 2) a private company KFX owns the middle
tailings pile (MTP), and, 3) the ASLD owns the lower
tailings pile (LTP) (See Map 13: Land Ownership and the
Cover Page of the Implementation Plan Part II for detail).
After clipping in GIS, the following land ownership
patterns are revealed for the Boulder Creek Watershed:
Land Ownership Square Miles Percentage State Trust 99.4 66.3% Private 27.6 18.4% U.S. Forest Service 16.2 10.8% Bureau of Land Management
6.5 4.4%
Map 13: Land Ownership
29
10.2 Land Use
Sometimes understanding land ownership boundaries by
themselves can be misleading towards how a given
landscape is actually managed. Gaining a basic
understanding of land uses on the surface can provide
researchers a better picture of actual land management
strategies and concerns on the ground. The National
Resource Conservation Service (NRCS) compiled a land
use cover in GIS that combines the following variables:
vegetation, soils, elevation, topography, climate and
water resources into Major Land Resource Units
(MLRUs). (See Map 14: Land Use Map).
Multivariate MLRU’s further explain what one might
expect to find on the land surface in each defined area.
The NRCS provides a website that includes a narrative
explanation of each MLRU, describing the dominant
characteristics located in each unit, and the typical
concerns each unit is known to exhibit. This combined-
variable tool in GIS reveals the following land use trends
for the Boulder Creek Watershed:
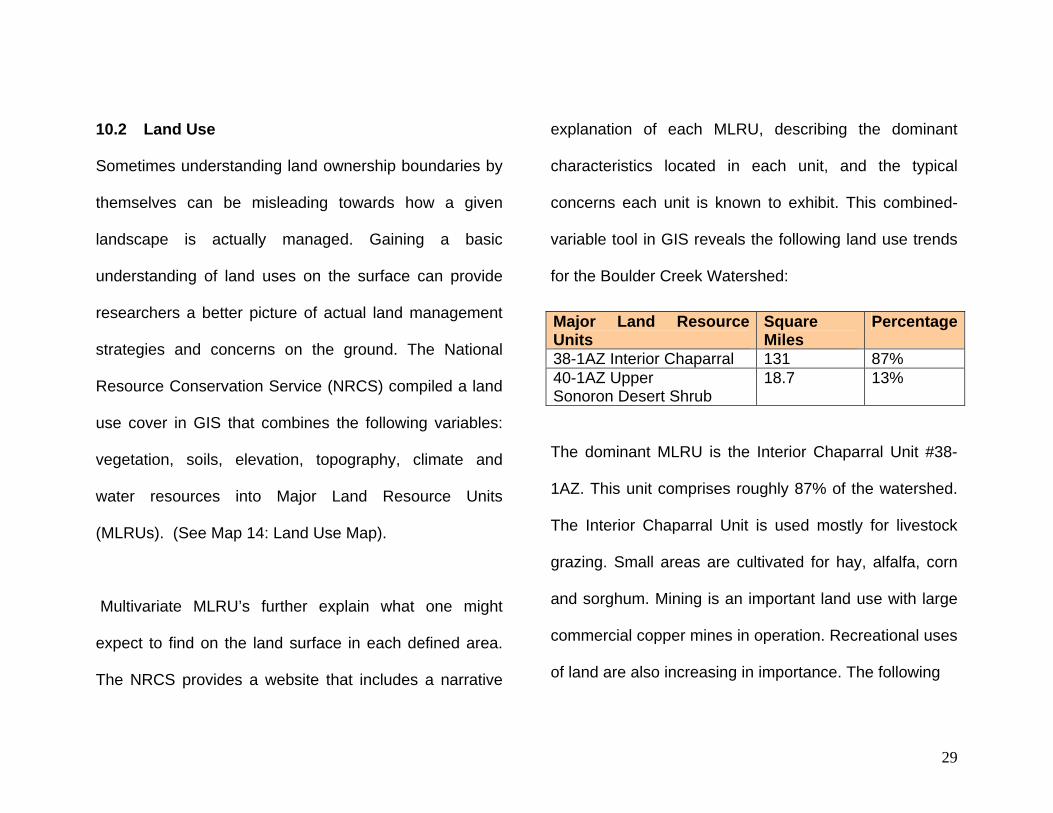
The dominant MLRU is the Interior Chaparral Unit #38-
1AZ. This unit comprises roughly 87% of the watershed.
The Interior Chaparral Unit is used mostly for livestock
grazing. Small areas are cultivated for hay, alfalfa, corn
and sorghum. Mining is an important land use with large
commercial copper mines in operation. Recreational uses
of land are also increasing in importance. The following
Major Land Resource Units
Square Miles
Percentage
38-1AZ Interior Chaparral 131 87% 40-1AZ Upper Sonoron Desert Shrub
18.7 13%

30
Map 14: Major Land Resources Units
concerns over land use were listed for the Interior
Chaparral Unit: 1) livestock predation, 2) woody fuel
buildup due to fire suppression of naturally occurring
wildfires, 3) sedimentation of water storage reservoirs, 4)
conflicts between recreational uses, livestock grazing and
mining, 5) spread of noxious plants onto grassland sites,
and, 6) limited groundwater supplies are deep and not
very abundant (NRCS Website, 2003).
Similar to the Interior Chaparral Unit, the Sonoran
Mohave Desert Scrub MLRU #40-1AZ, which comprises
13% of the watershed, is primarily used for wildlife and
livestock grazing. The number of livestock fluctuates
significantly between seasons of favorable moisture and
drought years. Groundwater is deep, not abundant, and
occurs only in local areas. Mining has been and

31
continues to be an important land use. Copper and gold
are the main minerals. Locally important materials
include sand, gravel, and river cobble (NRCS Website,
2003).
10.3 Agriculture
According to the GAP vegetation cover digitized from
1991-1993 satellite photos, only 0.25% of the watershed
is used for active cultivation (See 8.2 GAP Vegetation
Classes). Since the GAP report indicated agricultural
lands exhibited a high degree of fitness for satellite
interpretation, this reported land area of 0.4 square miles
is considered to be fairly accurate for the date of this
photograph. However, because this land use area
appeared to be so small in 1991-1993 when compared to
the rest of the watershed, agricultural crops are not
considered to be a major contributing factor to nonpoint
source pollution in 2003.
10.4 Range Cattle Grazing
Based on research and readily available information
there are two main cattle ranches in the Boulder Creek
10-digit HUC watershed, the Byner Ranch has a large
grazing allotment that allows the ranch to graze all the
way from Wikieup, through portions of Burro and Boulder
Creek areas. They currently have over 80-head of cattle
on the allotment in 2003.
The Yolo Ranch is also located in the Boulder Creek
Watershed. However, the number of animals on this
ranch was not known (Jeff Campbell, Interview, 2003).
There are also a couple of smaller private ranch holdings
that have a limited amount of livestock on them. Since

32
the Boulder Creek area is experiencing the negative
affects of an extended drought, the reported animal
numbers on the Byner Ranch have most likely been
reduced when compared to earlier, wetter years.
10.5 Active and Inactive Mining Operations
The historical mining GIS file shows 30 historical mines
formerly located in the Boulder Creek Watershed and
these include the Hillside, Tungstona and Black Pearl
Mines. There is only one active operation located in the
watershed at the Phelps Dodge Bagdad Mine near the
Copper Creek watershed. Another GIS file indicates
polygon areas where certain ore bodies exhibit a high
potential for finding certain heavy metals and groups of
heavy metals. This polygon GIS file indicates three
different areas where certain metals of geologic potential
can be found below the ground. The mine potential areas
are listed in the following table:
(Source: “Mine Potential” GIS shape file from ALRIS)
A large active mining operation is located along Copper
Creek, a sub-watershed of Boulder Creek 10 digit HUC
watershed, which flows into Boulder Creek below the
critical area of impairment, below the old Hillside Mine.
Large open strip-mining pits, active areas of placer
mining, lakes, ponds and other mining works are located
in this heavily-mined area. Phelps Dodge is the active
Mine Potential Areas Further Description Copper Porphryry w/or w/out molybdenum,
manganese, gold & peripheral lead-zinc-
silver
Copper, gold, silver with
or without zinc
Stratabound volcanogene massive
sulfide
Tungsten Skarn & veins or pegmatites w/or w/out
beryllium or lithium

33
mine operator at the aptly named Bagdad Mine next to
Bagdad Arizona.
According to an interview with Jeff Campbell from the
Phelps Dodge Bagdad Mine, two tailings piles are
currently being processed for copper and one pond
receives the tailings surface water flows in the Copper
Creek sub-watershed. Two additional seepage collection
return ponds gather seepage from the mining operation
and residual storm water flows from the face of the
tailings piles and natural hillside. The seepage collection
return ponds provide temporary storage of the seepage
and storm water. Then the mine pumps the water back
up the hill to the mill facility where the grinding lines are
located (Jeff Campbell, Interview, 2003).
The northern extent of the Phelps Dodge property is
located near the Butte Creek drainage where several
overburden stockpiles have been placed. Overburden
piles are not expected to contain large amounts of heavy
metals; rather they usually contain less contaminated
soils that were removed to get to the ore bodies below for
mining (See Map 15: Mining Map). A large tailings pile
can be observed on the USGS Topographic quad map
just below the Copper Boulder Creek confluence along
the southern edge of Boulder Creek, near Scorpion
Mesa. This tailings pile was capped and re-seeded many
years ago (Jeff Campbell, 2003).
According to the GAP vegetation cover, the “industrial”
area extent in Boulder Creek was determined to be 8.3
square miles in size. Since the GAP report indicated a

34
Map 15: Mining
high fitness rating for satellite interpretation, this reported
“industrial” land area is considered to be fairly accurate
for the date of the satellite photos, 1991-1993. Therefore
the estimated size of the active Phelps Dodge Bagdad
Mine is 8.3 square miles (See 8.2 GAP Vegetation
Classes).
The Hillside, Tungstona and Black Pearl Mines are three
former mining operations in the Boulder Creek
Watershed. The abandoned Black Pearl Mine is located
south of Boulder Creek’s headwaters, further east and
uphill of Wilder Creek and the Urie Basin area. The
abandoned Tungstona Mine is located above the
confluence of Wilder Creek with Boulder Creek. The
abandoned Hillside Mine is located downstream of the

35
Map 16: Population Density per Square Mile
Wilder Creek confluence. This north and upstream of the
critical area of impairment where the Hillside Mine tailings
piles are located. Three large tailings piles and eroded
dam structures along the stream. The Hillside Mine is
considered a problem area for water quality impairments,
defined as the “critical area” for the TMDL report in
section 3 of this Plan.
10.6 Census Population
The western edges of the Town of Bagdad are situated
inside the Boulder Creek Watershed. The largest portions
of Bagdad lie outside of the watershed boundary.
However, due to its close proximity to Boulder Creek the
population in Bagdad can affect the environmental
condition of Boulder Creek through recreational land
uses, wildcat dumping, hunting, and off road vehicle
usage. According to the Year 2000 Census, 1,578 people

36
live in the Town of Bagdad, Arizona. The 1990 Census
figures were higher when 1,858 people lived in Bagdad.
The Year 2000 Census lists Bagdad as a Census Data
Place (CDP), a place not large enough to be considered
an incorporated town. The Year 2000 Census also lists
that 813 housing units are located in Bagdad. It is no
coincidence that population declines mirror the downturn
of the copper industry in the 1990s and can be seen in
the 1990 through 2000 population trends. Projected
population growth estimates show a very slow growth
trend for Bagdad with 1,860 people in 1997 and a
projected population of 1,879 in 2050, a gain of only 19
people in over 50 years (U.S. Census, 2000).
However, recent copper prices in late 2003 have surged
upwards, over 90 cents a pound, which could cause an
upward trend to the population base in Bagdad. Based
on the GIS system, the population density for the vicinity
of Boulder Creek is approximately 2-5 people per square
mile by the 2000 census (See Map 16: Census
Population Density per Square Mile).
10.7 Point Sources
Point source discharges are typically described as end-
of-pipe discharges to a water body, rather than
discharges that originate from sheet-flow across the
landscape such as Non-point source discharges. An
example of a point source discharge in Boulder Creek
would be the former mining adit that seeps pollution into
Boulder Creek from near the Middle Tailings pile at the
former Hillside Mine. According to the Clean Water Act
the following definition of a point source discharge is
listed on EPA’s website: “any discernable, confined, and

37
discrete conveyance including but not limited to any pipe,
ditch, channel, tunnel, conduit, well, discrete fissure,
container, rolling stock, concentrated animal feeding
operation, or vessel or other floating craft, from which
pollutants are or may be discharged”
(http://www.epa.gov/owow/nps/qa.html).
An adit, in mining terminology, is described as a
horizontal mineshaft usually used for dewatering. The
TMDL report identified this point source adit, which
currently appears to be a seep/spring as one of the main
sources contributing arsenic, zinc and low pH water to
Boulder Creek’s main stem. Low pH is problematic in that
this overly acidic water can continue to extract heavy
metals from abandoned tailings piles, from existing
geologic formations, and can cause continued leaching
problems with heavy metals to the stream. The potential
exists that the Middle Tailings Pile is providing sub-flow
contaminated waters to the adit through percolation of
the abandoned tailings pile, and/or the former subsurface
workings of the Hillside Mine below the head frame
entrance (Karl Ford, BLM, 2003).
Other types of point sources of pollution were searched
in the Boulder Creek Watershed using the GIS system.
ADEQ assembled the following GIS files to determine if
other point sources are located in the watershed area:
AZPDES/NPDES permitted sites, underground storage
tanks (USTs), leaking underground storage tanks
(LUSTs) and the “Places” database that lists all potential
point sources in Arizona. No current AZPDES permitted
sites were found on the GIS database. ADEQ also

38
searched a GIS file known as the Source Water
Assessment Program (SWAP). This drinking water
protection program identifies drinking water wells that
may have potential contamination issues within a
specified radius of a given wellhead. The following
potential point sources were identified in the Boulder
Creek Watershed:
One leaking underground storage tank (LUST), no longer
considered open as of December 31, 2002: facility I.D. 0-
001706; and, eight “Places” identified as potential point
sources that may or may not require further AZPDES
permitting:
1) Bagdad – Concentrator Copper Filter;
2) Bagdad Mine;
3) Bagdad New Mill;
4) Bagdad Open Pit Mine;
5) Bagdad Smelter;
6) Bagdad Townsite WWTP – Waste Water
Treatment Plant;
7) Green Valley Power Corporation; and,
8) Hillside Mine (This is the adit seep site location
previously discussed above).
In addition two Source Water Assessment Program
(SWAP) well buffers were identified around two existing
wells identified on ADWR’s well registry list. They are
located above the Urie Basin area in Contreras Wash, a
small tributary of Boulder Creek just upstream and east
of the Wilder Creek confluence and the TMDL “critical
area.” These buffer zones are delineated to ascertain
whether nearby sources of pollution have the potential for

39
negatively impacting the nearby wells (See Map 17:
Potential Point Sources Map).
10.8 Existing Non-point Sources
The three abandoned tailings piles located at the Hillside
Mine along Boulder Creek are considered non-point
sources (NPS) of pollution. Unlike pollution from
industrial and sewage treatment plants, NPS comes from
many diffuse sources. NPS pollution is caused by rainfall
or snowmelt moving over and through the ground. As the
runoff moves, it picks up and carries away natural and
human-made pollutants, finally depositing them into
lakes, rivers, wetlands, coastal waters, and even our
underground sources of drinking water. Controlling NPS
from impacting downstream water bodies is one of
Arizona’s biggest water quality challenges.
Map 17: Potential Point Sources

40
NPS can originate from many areas and the most
obvious in the Boulder Creek Watershed can be
described as follows; 1) natural background due to heavy
storm events, 2) natural air deposition due to wind
erosion and dust, or, 3) anthroprogenic (human-caused)
pollution from a variety of land use activities such as the
abandoned tailings piles at the Hillside Mine.
The most common human-caused NPS in Arizona is
agricultural land use. Ranching and livestock grazing is
an example of this land use activity in the Boulder Creek
Watershed. Naturally occurring NPS pollution or human-
caused NPS pollution can wash downstream from either
natural geologic formations or heavily mined and scoured
areas. The TMDL report takes natural background
sources into account in its equilibrium calculations,
modeling and subsequent assignment of load allocations
(See the Boulder Creek Implementation Plan, Part II) for
further discussion.
11.0 Conclusion
This inventory and characterization is focused on a larger
scale watershed, the Boulder Creek 10-digit HUC
watershed, which includes upland areas. The subsequent
Boulder Creek Implementation Plan, Part II focuses on a
smaller area where the critical area of impairment is
located with some upstream areas added as “natural
background” flow areas. In short, Part II zooms in on the
Hillside Mine area and the three tailings piles (See Cover
Page of the Boulder Creek Implementation Project, Part
II for illustration).

41
It is clear that cooperation among stakeholders and
information sharing are crucial steps towards the
successful cleanup of the critical area defined in the
TMDL report. Much needed information has already been
exchanged among stakeholders in 2003, including
“outside” stakeholders such as the Phelps Dodge
Bagdad Mine and AMEC Engineering, Inc. hired by BLM
for this project.
Based on the iterative nature of this document, it can be
revisited and the “prescriptions” for improving Boulder
Creek’s ecological health should remain holistic,
economically feasible and evolve as the Plan matures.
Much like human health, a watershed must be managed
with a health care “process” plan in mind. Visits to the
“doctor” should continue for Boulder Creek and the water
quality should be revisited and monitored for the long
term. (See Flow Chart on next page).
Lastly, the entire Bill Williams Watershed region could
benefit greatly from the future cleanup of Boulder Creek
and the Hillside Mine tailings piles. Alamo Lake is
downstream and has been used for recreation and
fishing for many years. A TMDL is currently underway to
define potential mercury and methyl-mercury sources to
Alamo Lake. The overall health of the region, including
those who choose to recreate in the area is clearly at
stake with this plan.

42
43
12.0 References
Arizona Department of Environmental Quality,
2002-2003 Edition. Arizona Laws Relating to
Environmental Quality – Arizona Revised Statutes.
Phoenix, Arizona.
Arizona Department of Environmental Quality,
September 2003. Boulder Creek TMDL Final
Draft. Phoenix, Arizona.
Arizona Department of Health Services & Bureau
of Land Management, October 1985. Unique
Waters Nomination for Burro Creek and Francis
Creek. Phoenix, Arizona.
United States Geological Service, Photorevised
1980. Bozarth Mesa 7.5 Minute Quadrangle Map.
Phoenix, Arizona.
United States Geological Service, Photorevised
1980. Behm Mesa 7.5 Minute Quadrangle Map.
Phoenix, Arizona.
United States Geological Service, Photorevised
1980. Camp Wood Mountain 7.5 Minute
Quadrangle Map. Phoenix, Arizona.
Tetra Tech, Inc., 2001. Boulder Creek, AZ TMDL
Development: Data Summary Report. Fairfax,
Virginia.
Stephen J. Reynolds, Arizona Geologic Survey,
1988. Geologic Map of Arizona. Phoenix, Arizona.
Anderson, C.A., Scholz, E.A. and Strobell, J.D.,
1955. Geology and Ore Deposits of the Bagdad
Area, Yavapai County, Arizona. USGS Geological
Survey Professional Paper 278.

44
12.0 References continued….
Environmental Protection Agency, October 1999.
Technologically Enhanced Naturally Occurring
Radioactive Materials in the Southwestern Copper
Belt of Arizona – TENORM. Washington D.C.
Arizona Department of Environmental Quality,
1993. Preliminary Assessment & Site Investigation
(PASI) File Archives. Phoenix, Arizona.
Arizona Department of Environmental Quality,
Draft, 2003. The Status of Water Quality in
Arizona – 2004, Arizona’s Integrated 305(b) and
303(d) Listing Report. Phoenix, Arizona.
United States Department of Agriculture, National
Resources Conservation Service, National Soil
Survey Center, January 1995. Soil Survey
Geographic (SSURGO) Data Base. Misc.
Publication No. 1527. Fort Worth, Texas.
Arizona Department of Environmental Quality,
2002. Ambient Surface Water Quality of Rivers
and Streams in the Upper Gila Basin, Water Year
2000. Phoenix, Arizona.
Halvorson, William L., U.S. Geological Survey,
University of Arizona, Northern Arizona University
and University of Idaho, August 2002. Arizona
GAP Analysis Project. Tucson, Arizona.
USDA - National Resource Conservation Service,
2003. USDA-NRCS Website. Website link
provided:
http://az.nrcs.usda.gov/fotg/sec1/403.htm

45
12.0 References continued….
Unmack, Peter, 2002. Personal Communication for
ADEQ’s Boulder Creek TMDL Report.
U.S. Census Bureau, 2000. Census 2000 Geographic
Product Highlights. Washington, D.C. Website link
provided:
http://www.census.gov/geo/www/cob/bg2000.html
Arizona Department of Economic Security, 2001.
Populations Statistics Webpage. Phoenix, Arizona.
Website link provided:
http://www.de.state.az.us/links/economic/webpage/pa
ge14.html
Ford, Karl, Bureau of Land Management Denver
Science Center, 2003. Personal Communication for
the Boulder Creek Implementation Plan.
Arizona Department of Environmental Quality, 2002.
Ambient Surface Water Quality of Rivers and Streams
in the Upper Gila Basin, Water Year 2000. Phoenix,
Arizona.
Smith, Karen. 2002. Keynote Address at the National
TMDL Science & Policy Conference. Chandler,
Arizona.
12.1 GIS File References
ALRIS Website, 2003. 30-Meter Resolution Satellite
Map GIS Image. Phoenix, Arizona.
USDA - National Resource Conservation Service,
2003. 10-Digit Hydrologic Unit Code (HUC)
Watersheds GIS Polygon Cover. Phoenix, Arizona.

46
12.1 GIS File References continued….
Arizona Department of Environmental Quality, 2003.
Arizona’s Ten Major Watersheds GIS Polygon Cover.
Phoenix, Arizona.
ALRIS Website, 2000. 8-Digit Hydrologic Unit Code
(HUC) Watersheds GIS Polygon Cover. Phoenix,
Arizona.
Arizona Game & Fish Department, 1997. Perennial
Streams Line Cover. Phoenix, Arizona.
Arizona Game & Fish Department, 1997. Intermittent
Streams Line Cover. Phoenix, Arizona.
Arizona Department of Environmental Quality, 2003.
Digitized Streams & Arroyos in Boulder Creek Line
Shape File. Phoenix, Arizona.
Arizona Department of Environmental Quality, 2003.
Digitized Springs in Boulder Creek Point Shape File.
Phoenix, Arizona.
Arizona Department of Environmental Quality, 2003.
Digitized Pools, Ponds & Tanks in Boulder Creek
Polygon Shape File. Phoenix, Arizona.
ALRIS Website, No Date. Precipitation Contours GIS
Line Cover. Phoenix, Arizona.
ALRIS Website, No Date. Precipitation Range GIS
Polygon Cover. Phoenix, Arizona.
Arizona Department of Water Resources, No Date.
Groundwater Sub-basins GIS Polygon Cover.
Phoenix, Arizona.
47
12.1 GIS File References continued….
ALRIS Website, No Date. Stephen J. Reynolds
Geology GIS Polygon Cover. Phoenix, Arizona.
ALRIS Website, No Date. SSURGO Soils GIS
Polygon Cover. Phoenix, Arizona.
ALRIS Website, No Date. Brown, Lowe & Pace
Vegetation Biotic Communities GIS Polygon Cover.
Phoenix, Arizona.
University of Arizona and Northern Arizona University,
2001. GAP Vegetation Classes GIS Polygon Cover.
Tucson & Flagstaff, Arizona.
ALRIS Website, No Date. Land Ownership GIS
Polygon Cover. Phoenix, Arizona.
USDA-NRCS Website, 2002. Major Land Resource
Units GIS Polygon Cover. Arizona Field Office.
Arizona Game & Fish Department, 1997. Active Mine
GIS Point Cover. Phoenix, Arizona.
Arizona Game & Fish Department, 1997. Historical,
Abandoned & Inactive Mine GIS Point Cover.
Phoenix, Arizona.
Arizona Department of Environmental Quality, 2000.
Impaired Streams 303(d) List GIS Line Cover.
Phoenix, Arizona.
Arizona Department of Environmental Quality, 2002.
Impaired Streams 303(d) List GIS Line Cover.
Phoenix, Arizona.
ALRIS Website, No Date. All Streams GIS Line
Cover. Phoenix, Arizona.

48
12.1 GIS File References continued….
ALRIS Website, No Date. Mine Potential Districts GIS
Polygon Cover. Phoenix Arizona.
U.S. Census, 2000. Census 2000 GIS Database, dbf
file. Washington, D.C.
Arizona Department of Economic Security, 2001.
Census Tract GIS Polygon Cover. Phoenix, Arizona.
Arizona Department of Environmental Quality, 2003.
Leaking Underground Storage Tank (LUST) GIS Point
Cover. Phoenix, Arizona.
Arizona Department of Environmental Quality, 2003.
Places Database GIS Point Cover. Phoenix, Arizona.
Arizona Department of Environmental Quality, 2003.
Source Water Assessment Program (SWAP) GIS
Polygon Cover. Phoenix, Arizona.
End note: Most of the GIS files were clipped using the
ArcInfo Software, much like a cookie-cutter to ascertain
the quantities of a given variable “inside” of the Boulder
Creek Watershed. This inventory is intended to promote
watershed awareness to the key stakeholders and the
public at large (Enterline, 2003).