BOREHOLE GEOLOGY AND HYDROTHERMAL ALTERATION OF …
34
GEOTHERMAL TRAINING PROGRAMME Reports 2013 Orkustofnun, Grensasvegur 9, Number 10 IS-108 Reykjavik, Iceland 143 BOREHOLE GEOLOGY AND HYDROTHERMAL ALTERATION OF WELLS MW-08 AND MW-11, MENENGAI GEOTHERMAL FIELD, KENYA Loice Jemutai Kipchumba Geothermal Development Company – GDC P.O. Box 17700-20100, Nakuru KENYA [email protected] ABSTRACT In order to understand the subsurface geology in any geothermal field, drilling is essential. The borehole geologists use the cuttings obtained during drilling to study the subsurface formation so as to identify the lithology, hydrothermal alteration mineralogy and probable location of aquifers. However, it is from the drilled wells that the temperature of the reservoir is measured. With such data, the dynamics of the geothermal system can be evaluated. This paper presents the stratigraphic sequence and the hydrothermal alteration of Wells MW-08 and MW-11, drilled in the Menengai geothermal field. The stratigraphic column is made up of four rock units. They include: pyroclastics, trachyte, tuff and basalt. These dissected rocks conform to the Pre-, Syn- and Post- caldera volcanic activities that started shortly before 0.18 Ma. The highly altered basalt penetrated by the wells at greater depths is presumed to be older than the caldera and is linked to the pre-caldera volcanics. The main hydrothermal alteration minerals encountered include: zeolites, chalcedony, quartz, pyrite, calcite, smectite, illite, chlorite, epidote, wollastonite, and actinolite. From the hydrothermal alteration, four alteration zones have been identified below a zone of no alteration: a zeolite-illite zone appears followed by a quartz-illite zone, an epidote-quartz-illite, zone and finally an epidote-illite-wollastonite-actinolite zone. Aquifers in the wells are associated with fractures, lithological contacts and loss of returns. A correlation of the hydrothermal alteration, fluid inclusion analysis and measured temperatures of the wells indicates that Well MW-08 is at equilibrium or slightly heating below 1700 m depth, whereas cooling is observed in Well MW-11. 1. INTRODUCTION 1.1 General information Menengai geothermal field is one of the high-temperature fields located within the central segment of the Kenya Rift Valley. It is presumed to be at the triple junction where the failed junction Nyanzian Rift joins the main Kenya Rift Valley (Figure 1). The Kenya Rift is a volcano-tectonic feature that transects the country from Lake Turkana in the north to Lake Natron in Tanzania and is part of the East
Transcript of BOREHOLE GEOLOGY AND HYDROTHERMAL ALTERATION OF …

GEOTHERMAL TRAINING PROGRAMME Reports 2013 Orkustofnun, Grensasvegur 9, Number 10 IS-108 Reykjavik, Iceland
143
BOREHOLE GEOLOGY AND HYDROTHERMAL ALTERATION OF WELLS MW-08 AND MW-11,
MENENGAI GEOTHERMAL FIELD, KENYA
Loice Jemutai Kipchumba Geothermal Development Company – GDC
P.O. Box 17700-20100, Nakuru
KENYA [email protected]
ABSTRACT In order to understand the subsurface geology in any geothermal field, drilling is essential. The borehole geologists use the cuttings obtained during drilling to study the subsurface formation so as to identify the lithology, hydrothermal alteration mineralogy and probable location of aquifers. However, it is from the drilled wells that the temperature of the reservoir is measured. With such data, the dynamics of the geothermal system can be evaluated. This paper presents the stratigraphic sequence and the hydrothermal alteration of Wells MW-08 and MW-11, drilled in the Menengai geothermal field. The stratigraphic column is made up of four rock units. They include: pyroclastics, trachyte, tuff and basalt. These dissected rocks conform to the Pre-, Syn- and Post-caldera volcanic activities that started shortly before 0.18 Ma. The highly altered basalt penetrated by the wells at greater depths is presumed to be older than the caldera and is linked to the pre-caldera volcanics. The main hydrothermal alteration minerals encountered include: zeolites, chalcedony, quartz, pyrite, calcite, smectite, illite, chlorite, epidote, wollastonite, and actinolite. From the hydrothermal alteration, four alteration zones have been identified below a zone of no alteration: a zeolite-illite zone appears followed by a quartz-illite zone, an epidote-quartz-illite, zone and finally an epidote-illite-wollastonite-actinolite zone. Aquifers in the wells are associated with fractures, lithological contacts and loss of returns. A correlation of the hydrothermal alteration, fluid inclusion analysis and measured temperatures of the wells indicates that Well MW-08 is at equilibrium or slightly heating below 1700 m depth, whereas cooling is observed in Well MW-11.
1. INTRODUCTION
1.1 General information Menengai geothermal field is one of the high-temperature fields located within the central segment of the Kenya Rift Valley. It is presumed to be at the triple junction where the failed junction Nyanzian Rift joins the main Kenya Rift Valley (Figure 1). The Kenya Rift is a volcano-tectonic feature that transects the country from Lake Turkana in the north to Lake Natron in Tanzania and is part of the East

Kipchumba 144 Report 10
African Rift System, an active continental-continental divergence zone where the Somali and Nubian plates are drifting apart at a rate of 2 cm per year (1 cm in each direction) resulting in crustal thinning (e.g. Lagat, 2003). The segment is host to several Quaternary to recent volcanic complexes. Some of the volcanic centres are dotted with hydrothermal activity and are envisaged to host extensive geothermal systems driven by their still hot magma. Studies show that these volcanic centres have positive indications of a geothermal resource that could be commercially exploited (GDC, 2010).
Exploration drilling to prove steam, determine the resource extent, nature and chemical characteristics in Menengai geothermal field is ongoing since its commencement in February 2011; at the time of writing this report, 15 wells have been drilled, among them Wells MW-08 and MW-11. 1.2 Objective of the project The aim of the project is to study the borehole geology and hydrothermal alteration mineralogy of Wells MW-08 and MW-11 by analysing drill cuttings taken at 2 m intervals in both wells. This is to describe the subsurface lithological formations, feed zones or aquifers, the hydrothermal alteration mineral assemblage and to delineate how they relate to the formation temperatures of the wells. This project report was carried out and submitted as a partial fulfilment of the six months course in Borehole Geology at the United Nations University Geothermal Training Programme (UNU-GTP) attended in Iceland in 2013. 1.3 Previous work Previously, Menengai geothermal field has been studied by different geoscientists for different
purposes/objectives including academically based research, regional geological mapping for government institutions and regional mapping with interests in natural resources, including geothermal. Some of the most relevant publications/reports include mapping by McCall (1967) in which the geology of area around Menengai is described. Leat (1983) carried out a very comprehensive study on the petrochemistry and evolution of the Menengai volcano, which was presented in a PhD thesis. Jones and Lippard authored and co-authored a number of papers in which the geologic evolution of Menengai volcano was discussed (Jones, 1985; Jones and Lippard, 1979). Geotermica Italiana (1987) carried out
FIGURE 1: Quaternary volcanoes in the Kenya Rift (from Scott and Skilling, 1999 in Macdonald, 2003)

Report 10 145 Kipchumba
work with an interesting discussion on the occurrence of geothermal potential under the GoK/ UNDP geothermal reconnaissance project that covered the region between Menengai and Bogoria. The report described the geological and hydrogeological features of the region and attempts to interpret the relationship with the occurrence of geothermal manifestations. KenGen (2004) later carried out detailed surface exploration with the purpose of evaluating the geothermal systems and, in their results, indicated that Menengai had a potential for a geothermal resource that could be commercially exploited. In 2010, GDC conducted a detailed study in the Menengai prospect to confirm all geological observations recorded in previous work that might be associated with development and occurrences of geothermal resources in the prospect area. From this study, the geophysical analysis indicated a heat source underlying the caldera structure in Menengai and a similar one in the Ol’rongai geothermal area with reservoir temperatures >250°C, deduced from gas geothermometry. Based on these findings, exploratory wells were sited and a decision to commence drilling was reached. At the time of writing this report, drilling is ongoing and a total of 15 wells have been drilled since commencement in February 2011. 2. GEOLOGY AND STUCTURAL SETTING 2.1 Regional geology The high-temperature geothermal prospects in Kenya are located within, and are associated with, the development of the Kenya Rift. The Kenya Rift is part of the eastern arm of the East African Rift System, an incipient continental divergence zone where thinning of the crust is occurring with consequent eruption of lavas and associated volcanic activities (Lagat, 2004). The development of the Rift was initiated by rift faults within the Late Proterozoic basement of the Mozambique belt and close to the eastern margin of the Tanzania craton (Hetzel and Strecker, 1994; Smith and Mosely, 1993). The geological evolution of the Rift started during the late Oligocene (30-35 Ma) in the area known as the Turkana Rift (MacDonald, 2003). During the Miocene period, volcanism associated with the rifting began. The activity was accompanied by domal uplift of about 300 m on the crest of erupted phonolites, which were subsequently faulted (Baker and Wohlenberg, 1971; Williams, 1972; Hay and Wendlandt, 1995). The Pliocene eruptions that followed the Miocene volcanics and the subsequent faulting are divided into four principal phases (Baker et al., 1988). These phases were coupled with faulting episodes, during which time most of the structural features evolved. The first phase was the wide-spread Mau-Kinangop tuff ash flows (3.7-3.4 Ma). Major faulting occurred following the ignimbrite eruptions, which converted an earlier half graben into a graben. The second phase was the eruption of the Limuru flood trachyte (2.0-1.8 Ma) which was initiated by the progressive inward migration of the fault zones. This migration resulted in the formation of step-faulted platforms (Mau escarpments) and the fissure eruptions of the Limuru trachyte flood lavas. Basalts and basaltic trachy-andesites form the third and fourth phases, respectively (1.65-0.9 Ma). These last two phases were triggered by faulting that followed the Limuru flood trachytes. This faulting was triggered by a convecting mantle, opening up fractures which served as conduits for Quaternary volcanic activity and the development of many large shield volcanoes of silicic composition in the axis of the rift (Baker et al., 1988). These volcanoes, most of which are geothermal prospects, include Suswa, Longonot, Olkaria, Eburru, Menengai, Korosi, Paka, Silali, Emuruangogolak, and the Barrier Complex (Omenda, 2007). Geothermal manifestations like fumaroles, hot springs, hot and altered grounds are abundant within the Rift and most of them are associated with the young Quaternary volcanoes (Omenda, 1998). Thinning of the crust in the Rift is also responsible for the general high heat flow within the Rift, with a geothermal gradient of over 200°C/km (Wheildon et al., 1994).

Kipchumba 146 Report 10
2.2 Geology of the Menengai volcanic complex Menengai is a large caldera volcano located on the floor of the Kenyan Rift Valley and is within an area with complex tectonic activity characterized by a confluence of two tectono-volcanic axes, Molo and Solai (Omenda, 2007). The caldera is of the Krakatau type, formed as a result of rapid emptying of a magma chamber (McCall, 1957). Leat et al. (1984), Macdonald and Scaillet (2006), and Macdonald et al. (1970) described the surface geology of Menengai to be composed of silica-oversaturated, peralkaline, metaluminous trachytes or pantellerite. Its evolution and surface geology have been described and linked to the Pre-, Syn- and Post caldera volcanic activities (Figure 2).
Activity started shortly before 0.18 Ma and continued in the Pleistocene with the formation of the caldera and more recent activity has given rise to the flows on the caldera floor (Leat, 1984; Macdonald et. al., 1970). The volcano evolved from the growth of a broad low-angle trachyte lava shield, which probably sloped gently (10 m per Km) northward from south of Menengai (Leat, 1984). The flanks of this early structure remain intact and form low hills which slope away from the rim of the caldera while its central part foundered during the caldera collapse. The thickness and sequences of the pre-caldera volcanics, which are associated with the formation of the shield volcano, have been exposed by the caldera wall. Isopach maps of the pre-caldera volcanics illustrate that the volcano was shield-like, with flanks dipping 1.5-8° away from the summit and had a broadly oval plane with a major axis of 22 km trending NE-SW (Leat, 1984). A Krakatau-style collapse which formed a 77 km² caldera occurred as a result of
the failed rift arm at the point where the Nyanzian Rift joins the main East African Rift (GDC, 2010). Within the embayed ring-fracture, an eruption of two ash flow tuffs occurred, representing a combined magma volume of about 50 km³. The eruption of both tuffs was preceded by an air-fall phase. During post-caldera times, secondary eruptions of mainly lavas, sheet-forming air-fall pumice, and cinder cones took place. About seventy lava flows cover the caldera floor, with many flows showing both blocky
FIGURE 2: Geological map of Menengai geothermal prospect (GDC, 2010)

Report 10 147 Kipchumba
and ropy features (McCall, 1957; Leat, 1984). The air-fall beds are interbedded with the lavas and the cinder cones up to 50 m high, composed of unconsolidated scoria. To the northwest of Menengai caldera the Ol’rongai and Ol’banita calderas are found. These are thought to be older than the Menengai caldera due to the presence of ignimbrite deposits whose age suggests an older date than the lava pile of the embryonic stage of Menengai. Through extrapolation of the existing arcuate remnant scarps, a caldera that occurs at the centre of Ol’rongai volcano, and one that extends to El Bonwala ridge north of Ol’banita swamp have been proposed (GDC, 2010). 2.3 Structural setting of Menengai geothermal field From the surface geology, three main geological structures (Figure 3), which include the Molo TVA, the Solai TVA and the Menengai caldera/ring faults, can be described.
FIGURE 3: Structural map of Menengai geothermal prospect (modified from GDC, 2010)

Kipchumba 148 Report 10
Molo TVA is a prominent volcano-structural feature represented on the surface by a zone with a high concentration of faults and fractures along which volcanic eruptions have taken place. The Ol’Rongai structural system represents a part of the larger Molo TVA that has had significant volcanic activity, including eruptions in the early Pleistocene epoch that resulted into a build-up of a NNW-SSE trending ridge referred to as the Ol’Rongai volcano. The apparent high volcanism indicated by numerous eruption centres in the western part of Menengai caldera is probably due to the intersection of the caldera structures and the Molo TVA/Ol’Rongai fracture system. Solai TVA is a narrow (4 km wide on average) tectonic axis graben that runs in a NNE-SSW trend through Lake Solai. It extends into the Menengai caldera system and probably even beyond, giving rise to the Makalia fault system which passes through the western part of Nakuru Town. It is comprised of numerous fault/fractures systems trending NNE-SSW. The western boundary of the graben is associated with the Makalia fault (Mibei and Lagat, 2011). Since it is cutting through the caldera, these faults are considered younger than the Menengai caldera. Lagat and Ngenoh (2010) described the Menengai caldera/ring faults as an elliptical depression with minor and major axes measuring about 8 and 12 km. Its existence is proof of the presence of a heat source beneath Menengai. The circular rim of the caldera ring fault is well preserved with a vertical cliff at some places measuring up to about 400 m. The ring structure has only been disturbed by the Solai graben faults at the northeast end. The caldera is partially filled with post caldera lavas such that it is not possible to estimate the collapse depth or any structures that may be marking the caldera floor. 3. METHODOLOGY
3.1 Sampling Rock cutting samples were collected at a 2 m interval during drilling except at points where a partial or total loss was experienced. Binocular analysis was performed at the rig site with the aim of developing a preliminary litho-stratigraphy and to estimate the down-hole temperatures from alteration mineralogy. This was to help in the casing depth determination and in advising drillers on geotechnical aspects. The samples were taken to the laboratory for further detailed analysis and storage. Cores were not collected in these wells; hence all the descriptions and interpretations are based on the rock cuttings. 3.2 Analytical techniques 3.2.1 Binocular microscope analysis Binocular analysis was done using an Olympus SZX12 stereo microscope. It involved washing the samples thoroughly with tap water to remove dust and impurities and to enhance visibility. The small sample holder boxes containing the cleaned 2 m interval samples were then mounted on the stage of the binocular microscope, one at a time, for analysis. The physical properties of the rock cuttings were the main features which include the rock type, colour, texture and grain size, rock fabric, primary mineralogy, and secondary/alteration mineralogy. Other features like oxidation, intensity of alteration, vein fillings, intrusions, probable aquifers and various litho-stratigraphic boundaries were identified through this method of analysis. Representative samples from the lithological units penetrated by the wells were selected and prepared for further analysis using other analytical techniques.

Report 10 149 Kipchumba
3.2.2 Petrographic microscope analysis
A total of seventy thin sections, prepared from the selected representative samples, were analysed using the LeitzWetzlar petrographic microscope. These analyses were done so as to confirm the rock type and alteration minerals noted in the binocular analysis. In addition, the analyses helped to identify additional alteration minerals not observed by the binocular microscope and clearly identified the depositional sequence of the alteration minerals. 3.2.3 X-ray diffractometer analysis
Thirty six samples were prepared for XRD analysis. Each sample was prepared and analysed in three conditions: untreated, glycolated, and heated. The peaks recorded from the analyses were interpreted and the types of clay present in the selected cuttings were identified. Identification of various types of clays in the wells’ lithological columns was important in the sense that the alteration zone boundaries could be determined, hence estimating the alteration temperatures in the geothermal system through the wells’ stratigraphy. 3.2.4 Fluid inclusion analysis
Fluid inclusion analysis is simply an analysis of fluids trapped in vacuoles inside mineral grains during growth or recrystallization. The trapped fluids, termed as fluid inclusions, give an approximate temperature from the time when the fluid was trapped in the mineral grain. This is measured by heating the crystal until the fluid inclusion reaches the homogenization temperature (Th). For this study, the procedure involved careful selection and polishing of secondary quartz and calcite grains from specific depths of the study wells. Upon confirmation by use of the petrographic microscope of the presence of clear fluid inclusions, the grains, each at a time, were slowly heated on a Linkam THSMG 94 freezing and heating stage, focusing on the trapped bubble/inclusion until the fluid homogenized into a single phase (i.e. bubble disappears) and the Th was measured. Comparing the results from this analysis with the measured temperatures of the wells brings to light the thermal evolutionary history of the geothermal system. Finally, findings from all the analyses were integrated and compiled using LogPlot 2007 (RockWare, 2007) for ease of conclusive analysis and interpretation. 4. BOREHOLE GEOLOGY 4.1 Drilling of wells MW-08 and MW-11 Wells MW-08 and MW-11 are the eighth and eleventh exploration/production wells drilled in Menengai geothermal field. Their locations are E 173231.3, N 9978225.3 at an elevation of 2015 m above sea level and E 172374, N 9978707 at 1993 m above sea level, respectively (Figure 4). The wells were aimed at tapping from the NE-SW striking faults and the NNW-SSE structures associated with the Molo and Solai TVA. The specific objective for drilling the wells was to further explore and determine the subsurface geology, hydrothermal alteration, and chemical characteristics of the geothermal reservoir at Menengai. 4.1.1 Drilling of Well MW-08 Well MW-08 was spudded on 17th February, 2012 at 1315hrs and completed on 20th June, 2012 (Figure 5) after which the rig was released for demobilization. The drilling was conducted in the following four main stages:

Kipchumba 150 Report 10
FIGURE 4: Location of Wells MW-08 and MW-11 (GDC, 2013) Stage one (Drilling of 26" hole): The 26" hole was drilled to a depth of 65.03 m. This section was drilled with water complemented by mud gel sweeps. Circulation of returns was good for the entire section. A 20" casing was run in hole at 63.25 m RKB and was cemented with 10.33 m³ of cement slurry of density 1.73 g/cm³. Cement returns were not received on the surface. Therefore, a backfill job was done with 4.5 m³ of cement slurry with successful returns. Stage two (Drilling of 17½" hole): Drilling of the 17½" hole commenced on 29th February, 2012. At a depth of 179 m, a cross over failed when shearing occurred at the box end, leaving behind the 17½ " bit, bit sub, 17½" stabilizer, the crossover and two stands of 8” drill collars, necessitating a fishing job. After a successful retrieval, drilling progressed with water, complemented with mud sweeps, to a depth of 378.9 m. Returns were full with alternately partial returns at depths 230-263 m. The 13⅜” casing was run in hole to a depth of 366.22 m followed by primary cementing using 38 m³ of cement. After three backfill jobs with 34.7, 19.2, and 1.9 m³ of cement slurry for the first, second and third backfills, cement returns were received on the surface. A slurry density of 1.72 g/cm³ for primary and 1.65 g/cm³ for backfills was used. Stage three (Drilling of 12¼" hole): The 12¼“ hole was drilled to a depth of 932.25 m. The drilling fluid used included water and mud. Most of the time there were full returns, but total losses occurred at depths of 636, 638, 716, 722, 762, 859, and 861 m. The 9⅝" casings were run in the hole, landing at

Report 10 151 Kipchumba
928.08 m. A cementing operation followed with primary cementing taking in 34 m³ of cement slurry of density 1.72 g/cm³. The first and second backfills took 43 and 7 m³, respectively, both with a density of 1.65 g/cm³.
FIGURE 5: Drilling progress of Well MW-08 Stage four (Drilling of 8½" hole): The drilling fluid used in this section was aerated brine and foam with continuous returns received on the surface. The target depth of 2355.56 m was attained. However, on pulling out to run in 7" liners, it was realized that the 8½" bit, 6½" bit sub, 8½" blade stabilizer, and three 6½" drill collars were left down the hole. The total length of the tools left down the hole is 29.73 m. The fishing operation was called off after several unsuccessful attempts. The liner was then run in the hole and set at a depth of 2274 m, i.e. hanging at 51.83 m from the fish top on 17th June, 2012, followed by well completion tests from 18th June to 19th June, 2012. The well was capped on 20th June, 2012 with a 10” expandable Master valve. 4.1.2 Drilling of Well MW-11 On 28th September, 2012 at 1700hrs, Well MW-11 was spudded. The four main stages during the drilling of this well included: Stage one (Drilling of 26" hole): A 26" bit was used to spud the well. The 26" diameter hole was drilled to a depth of 70.5 m RKB. This section of the hole was drilled with water with returns received on the surface throughout. Mud sweeps were done twice per single drill pipe. A total of 7 joints of 20” 94

Kipchumba 152 Report 10
PPF BTC casings were run in, followed by primary cementing of 9.2 m3 of cement and two backfills of 3.5 m3 each. The total neat cement consumed was 12.8 m3. Stage two (Drilling of 17½" hole): The intermediate hole was drilled with a 17½" bit to a depth of 278.6 m. Generally, this section was drilled blind with water with partial returns from 90 to 156 m and total losses from 156 to 268 m. Efforts to regain circulation by use of LCM and plugging bore no fruit. Due to the failure to regain circulation and a relatively hard formation, the 13⅜” casing depth was set at 273.96 m. Primary cementing of 5 m3 of neat cement was done followed by 4 backfills of 17.67, 14.88, 28.8 and 4 m3 of neat cement, respectively. Stage three (Drilling of 12¼" hole): The third drilling stage for the production casing was drilled with a 12¼" bit to a depth of 899 m. The main drilling fluid in this section was aerated water and foam. Intermittent losses were encountered at depths of 304, 307 m and from 315 to 326 m. However, several pluggings were done due to a problem of a parted (anchor) casing that caused an obstruction at 563.78 m. The 9⅝” casing was set at a depth of 888.29 m with a total of 42.75 m3 for the plug jobs and 85.5 m3 was used in cementing the production casing. Stage four (Drilling of 8½" hole): The production section was drilled to a depth of 1842.37 m using an 8½" bit for the entire section; aerated water and foam were used as the drilling fluid. Sweeps with high viscosity mud were employed after every 5 m to ensure thorough removal of cuttings. At 1842.37 m depth, the drill string was pulled out for inspection. A tight spot encountered at 1840 m when running in the drill string called for reaming, and it was while reaming at a depth of 1841 m that the drill string got stuck. Several attempts were made to free the string but all were unsuccessful (Figure 6). It was, therefore, decided to mechanically back off the drill string. Two stands of 6½ inch drilling collars, stabilizer, and bit were left in hole. A total of eighty 7" liners were run and set at 1784.28 m and a master valve was installed. 4.2 Stratigraphy The evolution and surface geology of Menengai geothermal field have been described and linked to the Pre-, Syn- and Post caldera volcanic activities (Leat 1984; GDC, 2010). The two meter interval collected sample cuttings from Wells MW-08 and MW-11 were subjected to both binocular and petrographic microscope analysis with the aim of identifying the formations penetrated by both wells and to find if they were related to the evolutionary history of the geothermal field. From the analysis, five types of rock units were found to form the litho-stratigraphy of Wells MW-08 and MW-11. They include: pyroclastics, trachyte, tuff, syenite, and basalt. Syenite occurred as an intrusive. Pyroclastics formed the top 20 m column from the ground surface. It is made up of grey to brownish grey vesicular fragments of pumice lapilli particles, obsidian, and glass and lithics of trachytic composition. Trachyte was the most dominant rock penetrated by both wells. It was encountered from 4 m to the bottom of the wells, alternating with lenses of tuff, basalt and syenite. The rock ranges from light to dark grey, brownish grey and green in colour. The texture ranged from fine to coarse grained and porphyritic with prismatic sanidine phenocrysts embedded in the feldspar rich groundmass. This textural and grain size variation could be linked to different episodes of lava eruptions during the Pre-, Syn- and Post caldera volcanic activity. Tuff is the second most abundant rock (after trachyte) encountered in both wells. In Menengai, tuff has been identified as the marker horizon separating the pre-caldera and post-caldera volcanic stages. Wells MW-08 and MW-11 saw this formation at depths of 474 and 280 m, respectively. Significant tuff layers were also at a depths of 850 m, 962-1022 m and 1198-1222 m. It mainly occurred as a grey to brownish, poorly crystalline, vesicular rock. From the binocular analysis, the vesicles at the 300-490 m range were seen to be partially in filled with chalcedony. Calcite, quartz, and clays filled both the vesicles and veins

Report 10 153 Kipchumba
in the rocks at greater depths. In all the occurrences, the tuff was bleached and moderately to highly altered.
FIGURE 6: Drilling progress of Well MW-11 Syenite was only encountered in Well MW-08 at depths of 1830-1854 m, 1926-1948 m and 1978-2002 m, respectively. It appeared as thin lenses between the thick trachytic lavas. The rock is grey, coarse grained and porphyritic, consisting primarily of alkali feldspars together with some mafic minerals. The rock is hard and compact when encountered, deduced from the low penetration rates recorded during drilling and the disappearance of pyrite. A thick column of basalt was encountered at 1558-1810 m in Well MW-08 and from 1680 m to the bottom of the well in Well MW-11. In both occurrences, three types of basalt were identified: Glassy grey fine-grained, greyish fine-grained porphyritic and a more crystalline, dark, fine-grained type of basalt. These three types occurred in one column and systematically with the glassy, fine grained on top, fine-grained porphyritic in the middle, and the more crystalline fine grained basalt at the bottom. Importantly noted was the degree of alteration: the glassy type was extensively altered and marked by the first appearance and abundant deposition of high-temperature alteration minerals of epidote, wollastonite, and actinolite. The fine-grained porphyritic and the more crystalline types of basalt appeared compact and less altered compared to the host basalt. In Well MW-11, the greyish fine-grained porphyritic type of basalt was not seen. Below is a detailed description of the lithological units seen in Wells MW-08 and MW-11.
Kipchumba 154 Report 10
4.2.1 Well MW-08
Post-caldera volcanics: 0-12 m: Pyroclastics. It is made up of grey to brownish grey, vesicular fragments of pumice lapilli particles, obsidian, and glass and lithics of trachytic composition. The bulk of the pyroclastic is poorly sorted and unconsolidated. The alteration minerals observed are opaque (oxides) and clays, indicating an interaction due to precipitation. 12-62 m: Fine-grained trachyte. Grey to greenish grey, hypocrystalline fine-grained trachyte with trachytic texture. Greenish-yellow pleochroic clinopyroxenes appear scattered in the feldspar–rich matrix. Pyrite is seen disseminated in the groundmass. 62-66 m: Loss of returns 66-188 m: Fine-grained trachyte. The formation is light to dark grey, fine grained and porphyritic. Sanidine phenocrysts are elongated and scattered in the rock matrix. The rock is slightly oxidized but becomes intensely oxidized between 124-150 m. Chalcedony at 68 m is seen as a vesicle infill. 188-304 m: Loss of returns 304-474 m: Fine-grained trachyte. Green to bluish, equi-granular rock. Alteration intensity is low, with the feldspars and pyroxenes starting to alter slightly to clays and abundant segregates of fully grown primary quartz are found at this depth. Possible syn-caldera volcanics 474-494 m: Tuff. Reddish brown, vesicular tuff with large phenocrysts of sanidine. At 488 m scolesite and chalcedony are seen filling veins and vesicles. Possibly pre-caldera volcanics 494-532 m: Fine-grained trachyte. Brownish grey to grey, fine-grained porphyritic formation. Mixing is evident at this depth. 532-544 m: Loss of returns 544-912 m: Fine- to medium-grained trachyte. Grey to brownish grey, fine- to medium-grained porphyritic lava with feldspars, pyroxenes and amphiboles as primary minerals. Abundant quartz vein filling at depths 666 m and 754 m is evident. Pyrite is disseminated in the groundmass. 912-936 m: Loss of returns 936-962 m: Fine-grained trachyte. The rock is moderately altered and shows mild bleaching. It is grey to brownish, fine-grained feldspar porphyritic lava. Pyrite crystals are still dominant in veins and the groundmass. 962-1022 m: Tuff. The colour ranges from grey to bluish-greenish, with lithics of trachytic components embedded in a fine-grained groundmass. Minor pyrite and calcite and greenish clays form the alteration minerals at this depth. 1022-1198 m: Fine-grained trachyte. Grey moderately altered fine-grained, sanidine porphyritic lava. Bleaching on the fractured surface is evident. Veins are filled with quartz, calcite and pyrite at 1060-1080 m, 1100-1108 m and 1144-1154 m. 1198-1222 m: Tuff. Grey vesicular rock that has been highly altered to whitish clays. Calcite is abundant in this unit and quartz and silica infilling veins are noted.

Report 10 155 Kipchumba
1222-1406 m: Fine-grained trachyte. Brownish grey, moderately altered and fractured trachyte. Calcite, pyrite, clays, and quartz were the main alteration minerals observed. Epidote coloration is observed, starting at depth of 1242 m and continues downhole. 1406-1558 m. Fine-grained trachyte. Light grey to grey, fine-grained rock. It appears fractured and highly altered. High-temperature minerals characterize this formation. These include quartz, chlorite, wollastonite, and actinolite. 1558-1728 m: Glassy fine-grained basalt. Greenish grey, glass rich, fine-grained hypocrystalline rock. It is highly altered and characterized by the first appearance of epidote and an abundance of wollastonite, actinolite, and calcite. 1756-1782 m: Fine-grained porphyritic basalt. Fine-grained, more crystalline basalt with large phenocrysts of plagioclase and pyroxene. Epidote, wollastonite and actinolite still characterize this unit though not as abundantly as in the glassy basalt type. 1782-1810 m: Fine-grained basalt. Dark grey to almost black in colour. It is hypocrystalline and relatively fresh showing chilled margins at the depth of 1810 m. 1810-1854 m: Syenite. The rock unit is grey, medium to coarse grained and porphyritic, consisting primarily of alkali feldspars together with some mafic minerals. The rock is hard and compact with little permeability, deduced from the low penetration rates recorded during drilling and the disappearance of pyrite and the high-temperature alteration minerals. 1854-1926 m: Fine-grained trachyte. Greyish, fine-grained and porphyritic. It is moderately altered into whitish and greenish clays. Minor veins are filled up with quartz and calcite. 1926-1948 m: Syenite. Light grey and coarse-grained with phaneritic texture, and appears relatively fresh. 1948-1978 m: Fine-grained trachyte. Dark grey, fine-grained trachyte. The rock is highly altered with quartz, wollastonite, epidote, and abundant calcite characterizing this unit. 1978-2002 m: Syenite. Light grey, medium to coarse-grained and porphyritic consisting primarily of alkali feldspars together with some mafic minerals. It is moderately altered and fractured, but veins are filled with quartz and calcite. 2002-2344 m: Fine-grained trachyte. Brownish grey, fine-grained feldspar porphyritic lava. The rock is moderately altered into greenish clays. Deposition of clays, quartz, and calcite on the fractured surfaces was noted. At depths from 2338- 2344 m, the rock becomes fresher with only slight alteration, indicating reduced or no permeability. 4.2.2 Well MW-11
Post-caldera volcanics: 0-14 m: Pyroclastics. Grey to dark grey, fine-grained and highly vesicular rock. The vesicles are unfilled. 14-52 m: Fine-grained trachyte. Black brownish, fine-grained felsic rock. Iron oxide precipitates are observed at the margins and interstices of mafic crystals such as clinopyroxene. 52-60 m: Loss of returns

Kipchumba 156 Report 10
60-74 m: Tuff. This is fine-grained, vesicular rock exhibiting moderate oxidation and minor calcite. 74-102 m: Loss of returns 102-140 m: Fine-grained trachyte. The rock is grey, fine-grained, exhibiting slight oxidation. Sanidine phenocrysts are scattered in needle-like lath shaped crystals. Abundant opaque iron oxides, appearing brown to deep brown, are precipitated between crystals in the groundmass. Prismatic aegirine-augite microphenocrysts are seen in the crossed polars. 140-152 m: Loss of returns 152-162 m: Fine-grained trachyte. Grey, fine grained exhibiting slight oxidation. The sanidine phenocrysts are scattered in needle-like lath shaped crystals. Abundant opaque iron oxides, appearing brown to deep brown, are precipitated between crystals in the groundmass. Prismatic yellow-green sodium-pyroxene microphenocrysts are seen in the crossed polars. 162-268 m: Loss of returns 268-280 m: Medium-grained trachyte. Dark grey, medium-grained lava. The primary minerals are mainly sodium-pyroxene embayed with smaller sanidine laths. The rock appears relatively fresh. Possible syn-caldera volcanics 280-304 m: Tuff. Dark green to bluish, fine-grained, poorly crystalline vesicular rock, with fully grown quartz crystals in the matrix. The vesicles and veins are filled up with chalcedony, clays and zeolites. This rock unit is possibly related to the syn-caldera. 304-374 m: Loss of returns Possibly pre-caldera volcanics 374-480 m: Medium-grained sanidine porphyritic trachyte. Sanidine phenocrysts are scattered in a slightly oxidized feldspar rich groundmass. Scattered microphenocrysts of yellowish-green aegirine-augite crystals are present at this depth. The feldspars are seen altering to albite. 480-510 m: Loss of returns 510-604 m: Medium-grained trachyte. Grey, medium-grained phyric lava exhibiting slight alteration with minor calcite and clays. 604-666 m: Loss of returns 666-714 m: Fine-grained trachyte. Dark grey to greenish grey, fine-grained trachyte mixed with minor amounts of a vesicular, poorly crystalline tuff. Chlorite is seen forming in the rock matrix. 714-728 m: Tuff. This formation is grey to greenish, poor crystalline and vesicular with fragments of trachytic composition. It is moderately altered with yellowish- green illite clays and chlorite infilling the vesicles. 728-778 m: Loss of returns 778-822 m: Fine-grained trachyte. Grey, fine-grained, porphyritic lava with sanidine phenocrysts embedded in the matrix. Chlorite and abundant calcite characterize this unit. 822-852 m: Loss of returns

Report 10 157 Kipchumba
852-894 m: Tuff. This formation is grey to greenish, poorly crystalline and vesicular with fragments of trachytic composition. It is moderately altered with yellowish-green illite clays and chlorite infilling the vesicles. 894-1170 m: Loss of returns 1170-1222 m: Fine-grained trachyte. Light grey, fined-grained lava. It is highly altered to yellowish- grey clays. Pyrite at this depth is abundant in the groundmass and vein fillings between 1172-1210 m. Partial circulation losses at depths of 1174-1194 m due to minor fractures. First appearance of epidote at 1178 m was noted. 1222-1542 m: Loss of returns 1542-1680 m: Medium-grained trachyte. Dark–grey, porphyritic lava, moderately altered with abundant calcite. Pyrite is seen disseminated in the matrix. Minor losses were encountered at 1582-1642 m depth. 1680-1772 m: Glassy fine-grained basalt. Greenish grey, glass rich, fine-grained hypocrystalline rock. It is highly altered and characterized by the first appearance of wollastonite and an abundance of epidote, calcite and chlorite in the rock matrix. 1772-1832 m: Fine-grained basalt. Dark grey to almost black in colour. Large plagioclase phenocrysts, showing albite twinning, are embedded in the groundmass. Alteration minerals of epidote, wollastonite, and calcite characterize this zone. 4.3 Stratigraphic correlations of wells MW-08, MW-11 , MW-09 and MW-12 A stratigraphic cross-section across Wells MW-08, MW-11 and neighbouring Wells MW-09 and MW-12 (Lopeyok, 2013) is highlighted in Figure 7. From the figure it can be deduced that the subsurface geology of Menengai geothermal field is predominantly trachytic with intercalations of tuff and pyroclastics. The tuff formation dissected by the wells at depths between 220-480 m conforms to the syn-caldera volcanics. Mibei (2012) described it as a greenish brown to brownish tuff layer at 320-400 m. This formation separates the post caldera volcanics from the pre-caldera volcanics. The blocky nature of the post-caldera volcanics described by Leat (1984) has been reflected by severe circulation losses and drilling challenges encountered during drilling of the top 300 m of the wells. The pre-caldera volcanics, predominantly trachytes, form the largest part of the stratigraphic column. The trachtyes show varied textures, fine-, medium- and coarse-grained, which could represent different episodes of lava eruptions during the pre-caldera stage. The basalts encountered at greater depths of Wells MW-08 and MW-11 are highly altered and are presumed to link with the Pliocene and Pleistocene subordinate basalts overlying the Miocene phonolites, resting on the Precambrian metamorphic basement (Leat, 1984). Circulation losses between depths 100-300 m in Wells MW-08, MW-09 and MW-11 could be linked to the syn-caldera tuffs encountered at the same depth range in Well MW-12, deduced from the increase in penetration rates at this unit of the column. However, a correlation of the tuffs reveals possible normal faults between Wells MW-12/ MW-09, MW-09 / MW-08 and MW-08 / MW-11 (Figure 7).

Kipchumba 158 Report 10
FIGURE 7: Stratigraphic correlation of wells MW-08, MW-11, MW-09 and MW-12 4.4 Aquifers For a hydrothermal system to exist, permeable formations or structures should exist to allow water to percolate through. These permeable zones form the aquifers (Lagat, 2004). Typically, aquifers are located at the intersection of faults, fractures, intrusions and lithological contacts. In a geothermal system, aquifers can either be cold or hot. The cold aquifers, which are usually encountered in the upper parts of the wells, are cased off and carefully cemented to prevent them from cooling the hot aquifers in the deeper part of the wells. The location of aquifers in Wells MW-08 and MW-11 was based on various parameters which include: temperature logs, circulation losses, changes in penetration rate during
Trachyte
Tuff Basalt
Syenite
No cuttings

Report 10 159 Kipchumba
drilling, lithological contacts, and hydrothermal alteration minerals present, but the abundance of calcite, pyrite and high alteration intensity in the wells may be correlated with permeability. 4.4.1 Well MW-08 In Well MW-08, circulation losses were noted only in small sections (Figure 8); the losses in these sections are attributed to fractures, which act as feeder zones. The shallow feeders, between the surface and 900 m, were cased off by the anchor and production casings as they are associated with cold inflows. The deeper sections are associated with hot inflows and were not cased off as the production casing was set at 928 m. The permeability of Well MW-08 is low in the production section. Eight aquifers were located in the well but, out of these, four small aquifers were identified between 990 and 2000 m depths in the production section. They are associated with highly altered basalt, tuff, fractured trachyte formations, syenitic intrusions and lithological contacts between trachyte and tuff as described below: Aquifer 1 occurs at a loss zone starting from 200 m and is characterised by a total loss of circulation and an increase in the drilling penetration rate. Aquifer 2 is a small aquifer encountered at 560 m at a loss zone. It is characterised by an increase in the penetration rate and the temperature, as recorded in the temperature logs. Aquifer 3 is located at 780 m and is associated with a fractured trachyte. The zone is marked by an increase in alteration and pyrite. Aquifer 4 forms the main aquifer in this well. It is located at 960 m just below the production casing. It is characterised by a break in the temperature profile associated with a very permeable tuff formation. Aquifer 5 is a small aquifer at 1360 m, associated with a highly fractured and altered trachytic formation. Aquifer 6 is associated with a boundary between trachyte and a highly altered basaltic formation at 1550 m. The zone is marked by increased intensity of alteration and the presence of the high-temperature alteration minerals, epidote and wollastonite. Temperature profiles show a break in the curve which characterises a coldpoint. Aquifer 7 occurs at 1980 m, a contact between a trachyte and a syenite intrusion. The temperature profile at this zone shows a break in the curve due to more cooling around the aquifer. 4.4.2 Well MW-11 Well MW-11 is a very permeable well exemplified by the significant circulation losses experienced. At shallow depths, i.e. 0-200 m, the losses experienced were due to a highly fractured blocky trachyte. There is almost no alteration at this zone, but the rocks are highly oxidized probably because of the effects of shallow underground water and/or because of closely spaced contact zones due to the post-caldera lavas. Geothermal aquifers are observed at varying depths from 490 m to the bottom of the well. Their identification is based on circulation losses, lithological characteristics, and measured temperatures. Nine aquifers were mapped in the well, all of them associated with loss zones (Figure 9). These zones are characterized by an increase in the measured temperature logs and correlate with geological observations. Aquifers 1 and 2 are associated with losses at 220 and 340 m, respectively. These aquifers are associated with the groundwater and were cased off.

Kipchumba 160 Report 10
FIGURE 8: Lithology, selected alteration minerals and temperature logs in correlation with aquifers in Well MW-08
Aquifer 3 was located at 650 m. It is a medium aquifer characterised by an increased rate of penetration and the temperature profile shows a break in the curve which indicates a cold point. Aquifers 4 and 5 form the major aquifers in the well. They are located at 1000 and 1240 m, respectively, and are characterised by a break in temperature profile, associated with a circulation loss with high rates of penetration recorded.

Report 10 161 Kipchumba
Aquifers 6 and 7 are intermediate aquifers at 1420 and 1460 m, respectively, associated with loss zones. The temperature profile at this zone shows a break in the curve due to more heat around the aquifer. Aquifers 8 and 9 were identified from a break in the temperature curves and increased rates of penetration and are located at a loss zone at depths 1620 and 1720 m, respectively.
FIGURE 9: Lithology, selected alteration minerals and temperature logs in correlation with aquifers in Well MW-11

Kipchumba 162 Report 10
5. HYDROTHERMAL ALTERATION
Hydrothermal alteration involves the change in mineralogy, texture, and chemistry of a rock due to interaction of the rock with hydrothermal fluids (hot water, steam, or gases). Primary minerals are replaced by different secondary minerals upon interaction of the rocks with the minerals. The formation and distribution of these secondary mineral assemblages is influenced by various factors which include permeability, temperature, composition of the geothermal fluid, lithology, tectonic setting and time (Browne, 1978). Analysis of hydrothermal alteration mineralogy from rock cuttings in a geothermal field is an important tool from which we acquire information about the dynamics of the geothermal system. It is also important during the drilling process, e.g. when it comes to determining the setting depth of the production casing. Apart from estimating the fluid pH, hydrothermal alteration minerals can be used to predict scaling and corrosion tendencies in fluids, measure permeability, possible cold water influx, and as a guide to the hydrology (Reyes, 1990). 5.1 Alteration of primary minerals
The primary minerals found in Wells MW-08 and MW-11 include volcanic glass, olivine, pyroxene, amphibole, feldspars, and opaque minerals (FeTi-oxides). In a geothermal environment, the interaction of the invading hydrothermal fluid with the rock leads to partial or complete rock alteration. The primary minerals are gradually replaced by alteration minerals as follows: Volcanic glass in Wells MW-08 and MW-11was encountered in the top 300 m column of the wells from the ground surface. It is transparent to translucent, exhibiting conchoidal fracturing and a vitreous lustre. It is altered into clays, zeolites, chalcedony, and may even be replaced by calcite. In thin section, it appears brown and anisotropic due to alteration to clays. Olivine is one of the primary minerals in basaltic rocks and is very susceptible to alteration. In the study wells, basalt was encountered at 1558 m in Well MW-08, and at 1680 m in Well MW-11. At this depth, olivine had been completely altered and replaced by calcite and clays. Pyroxene is the mineral most resistant to alteration. It appears as dark and shiny with a metallic lustre, embedded in a feldspar-rich groundmass. It was easily identified in thin section by its high relief and good cleavage. In Well MW-08, pyroxenes start to alter at 774-900 m depth and alter less than 10% to clays. It appears fresh again at 1180 m. From 1180 m to the bottom of the well, it shows 10-50% alteration into illite, chlorite, actinolite, and calcite. On the other hand, pyroxenes in Well MW-11 start to alter at 390 m to illite and continues to the bottom of the well. Feldspars, both sanidines and plagioclases, occurred as the major groundmass component as well as phenocrysts. Sanidine is the most abundant associated with trachytes, while plagioclase is associated with basalts. In thin sections, the sanidines appear fine grained and elongated, exhibiting the trachytic texture. It also occurs both in the groundmass and as phenocrysts in rocks exhibiting porphyritic textures. The sanidine phenocrysts were readily identified by low relief and simple twinning. At shallow depths, the feldspars are relatively unaltered but become altered progressively with depth into albite and occasionally to clays, calcite, and epidote. Alteration of feldspars in Well MW-08 starts at 666-1544 m, where 10-30% of feldspar has altered mainly to clay, calcite, albite, and quartz. Medium to high alteration intensity 50-80% is found at 1544-2318 m where the feldspar alters to chlorite and epidote. In Well MW-11, albite is first seen at 538 m and, like in Well MW-08, medium to high alteration intensity of plagioclase to epidote, illite, and calcite is seen from depths 1680 m to the bottom of the well, in association with the basaltic formation.

Report 10 163 Kipchumba
Opaque minerals appear opaque in transmitted light. They occur as idiomorphic, disseminated or irregularly shaped aggregates within the groundmass. They are generally resistant to alteration but when altered, sphene (titanite) is the main alteration product of these minerals. Sphene is first seen in Well MW-08 at 1558 m and disappears after 1810 m. In Well MW-11, sphene was first encountered at 668 m and then again at 1680-1832 m. In general, the order of decreasing susceptibility to alteration is volcanic glass, olivine, feldspars, pyroxene and opaques. 5.2 Hydrothermal minerals in Wells MW-08 and MW-11 A number of hydrothermal minerals were found in both Well MW-08 and Well MW-11. They occurred in two ways: either as replacements, replacing the primary rock-forming minerals, or as depositions infilling fractures, vesicles and vugs. Analyses of drill cuttings from the two wells has shown that the hydrothermal minerals occurring in the wells include zeolites, chalcedony, quartz, pyrite, calcite, smectite, illite, albite, epidote, wollastonite, titanite (sphene), chlorite, and actinolite. The occurrence of these minerals with depth is shown in Figures 10 and 11. In the study wells, zeolites were positively identified by petrographic analysis. The types encountered are thomsonite and scolescite. Thomsonite was first and only observed in Well MW-11 at 282 m, infilling vesicles and veins in tuff. In Well MW-08, zeolites were first encountered at 488 m as scolescite infilling vesicles. They indicate low-temperature alteration (approximately < 120°C). Chalcedony was first seen in both wells filling in cavities and vesicles. Chalcedony was first encountered at 94 m in Well MW-08 and at 62 m depth in Well MW-11. It appeared as a milky white, smooth and perfectly circular deposition. It began to be replaced by quartz at 288 m in Well MW-11. Secondary Quartz appeared mainly as a precipitation mineral filling vesicles and fractures. It was easily identified in cuttings by its typical euhedral shape, transparency and forming a regular hexagonal pyramid shape. Some of the euhedral grains of quartz were noted growing in clusters while others grew individually. In the study wells, quartz was seen both in binocular and petrographic analysis. Quartz was first identified at 390 m in Well MW-11 and at 666 m in Well MW-08 and persisted to the bottom of the wells. Calcite is a common alteration mineral with a formation temperature extending from 50 and up to 290°C (Kristmannsdóttir, 1979). It was encountered all through the well columns but showed a wide range of occurrences from little in the fresh un-altered trachyte to abundant in the fractured and highly altered trachyte, basalt and tuff formations. In binocular analysis, calcite was identified using dilute hydrochloric acid. In rock cuttings, calcite was seen to be directly precipitated in fractures and vesicles. In thin section, it occurred as radial, euhedral, and platy and could be easily distinguished by its rhomboid cleavage and high order interference colours. Pyrite occurs as euhedral cubic crystals with a brassy yellow lustre in reflected light. Pyrite is seen mainly disseminated in the feldspar-rich groundmass in both wells. It was encountered first at 480 m in Well MW-08 and at depth 420 m in Well MW-11 and was regularly identified throughout the well columns. A relative increase of pyrite in the groundmass at depths 1160-1220 m in both wells was observed. The abundance of pyrite conforms to a fractured trachyte, and is hence an indicator of permeability.

Kipchumba 164 Report 10
Albite occurs as an alteration product of sanidine and plagioclase. The first appearances of albite in the study wells was identified in thin section at 538 m and 1790 m in Wells MW-08 and MW-11, respectively, where it replaced sanidine; its formation destroys the feldspar twinning habit.
FIGURE 10: Distribution of hydrothermal alteration minerals in Well MW-08

Report 10 165 Kipchumba
FIGURE 11: Distribution of hydrothermal alteration minerals in Well MW-11 Epidote was first noted in Wells MW-08 and MW-11 at depths of 1558 m and 1172 m, respectively, as yellowish green radiating prismatic crystals growing in vesicles and also replacing plagioclase and

Kipchumba 166 Report 10
pyroxene. It occurs in association with quartz, wollastonite and actinolite. In thin section, it is yellow green with high interference colours and parallel extinction. The appearance of epidote typically correlates with a formation temperatures that of more than 240°C. Wollastonite was identified in the rock cuttings by its whitish colour and fibrous, hairy structure. It was mainly observed deposited in vesicles and occurred in association with quartz, epidote, and actinolite. It was first encountered in Wells MW-08 and MW-11 at depths of 1404 m and 1680 m, respectively. The first appearance of wollastonite marks a temperature of 270°C and can be stable at temperatures above 300°C. Actinolite appeared greenish to whitish in colour with a vitreous lustre, growing in fibrous aggregates in the cuttings. It forms at temperatures above 280°C and was first encountered at 1716 m in Well MW-11 and 1558 m in Well MW-08 and occurred intermittently down to 2180 m. Titanite (sphene) was identified in both petrographic and binocular analysis in the study wells. It appeared as white, small, and ball-like in the rock cuttings. In thin section, it is brown in colour with a very high relief and occurs as irregular anhedral grains replacing opaque minerals. Clays are common products of hydrothermal alteration of rocks. The formation of clay minerals involves chemical reactions and the physical movement of hydrothermal fluids and, in many cases, there is a zonal arrangement of the clay minerals around the source of alteration, depending on the parent rock and the nature of the hydrothermal solutions. Hence, different types of clays could be seen to occur throughout the wells’ columns ranging from low-temperature smectites occurring at the surface and shallower depths, to chlorite occurring at deeper and higher temperatures. X-ray diffraction analysis was done on 36 selected samples in addition to the petrography and binocular microscope analysis to better identify the types of clay minerals as these different types of clay minerals can be used as temperature indicators (Kristmannsdóttir, 1979; Franzson, 1998). Three types of clay were identified and they are: Smectite was mainly observed under the petrographic microscope as light green in plane-polarized light and slightly pleochroic and was found as vesicle and vein fillings. On XRD analysis, it showed peaks commonly occurring between 12.8 and 15 Å when untreated, 13 to 17 Å when treated with glycol and collapsing to 10.3 Å when heated (Figure 1 in Appendix I). Smectite is a low-temperature clay and its occurrence is an indication of temperatures lower than 200°C. In thin section, smectite was first seen at depth of 148 m in Well MW-08 and at 122 m in Well MW-11, respectively, whereas XRD analysis indicated smectite at greater depths of 796 and 1784 m in Wells MW-08 and MW-11, respectively. Chlorite was identified in all three analyses, i.e. binocular, petrographic and X-ray diffraction. In the cuttings, chlorite had a light to dark green colour and was often associated with high-temperature alteration minerals like epidote, actinolite, and wollastonite. In thin-section it was characterised as fine to coarse grained, light green coloured and fibrous in plane polarized light. It appeared light grey to white in cross polarized light, showing a feather texture and sometimes radial forms. It occurred both as a replacement of primary minerals in the rocks and as a vesicle filling. In thin-section it was first identified at 538 m depth in Well MW-11 and at 774 m in Well MW-08 and extended to the bottom of the well. Chlorite is an indicator of temperatures exceeding 200°C. In XRD it showed peaks at 14.4 Å and 7.1 Å, which did not change upon glycolation and heating (Figure 2 in Appendix I). It is only in Well MW-08 that chlorite was identified in the XRD analysis at depths of 1640-1988 m. Illite was identified through X-ray diffraction analysis. Illite forms at temperature of 200°C and above. XRD analysis showed its first appearance at depths of 666 and 288 m in Wells MW-08 and MW-11, respectively, and prevailed down to depths of 2314 and 1734 m, respectively. From the analysis, illite showed peaks between 10.2 to 10.3 in untreated, glycolated, and heated samples (Figure 3 in Appendix I).

Report 10 167 Kipchumba
5.3 Vesicles and vein fillings
Vesicles are small cavities in volcanic rocks that are formed by the expansion of gases as they are exsolved from the lava as it solidified. Vein fillings, on the other hand, are fractures that have been filled with minerals deposited from hydrothermal fluids. They dictate the porosity and permeability which are two of the primary factors that control the movement and storage of fluids in rocks, leading to the deposition of secondary minerals either in veins or vesicles. Identification of vesicle and vein fillings in this study was crucial as it reveals the sequence of mineral deposition which can be used to study the temperature conditions and the palaeo-thermal history of the geothermal system. In the top 60 m of both the well columns, vesicles were identified but were empty. At depths between 280-490 m, chalcedony, zeolites, calcite and quartz and clays were seen infilling the vesicles. At greater depths of 900-1540 m in Well MW-08, veins and minor vesicles infilled with quartz, calcite, and pyrite were noted. At this depth in Well MW-11, significant losses occurred. The high-temperature minerals, epidote, wollastonite, and actinolite, at depths of 1558 m in Well MW-08 and 1680 m in Well MW-11, were seen to fill the vesicles and veins. 5.4 Sequence of mineral deposition
Minerals are formed at their characteristic physico-chemical conditions during the history of geothermal systems (Gebrehiwot, 2010). The distribution and deposition of alteration minerals in a well gives information about the formation temperature of the well at their time of formation. From the analysis of the mineral depositional sequence, information as to whether the geothermal system has been heating up, cooling or is in thermal equilibrium can be obtained. Petrographic analysis was the main method used to obtain the highlighted mineral deposition sequence. In Well MW-08, at a shallow depth of 490m, zeolites were deposited in the vesicles, which disappeared at 666 m where secondary quartz was first seen. This indicates a temperature rise in the geothermal system. At depths from 900-1404 m in the well, veins were filled by pure quartz, but some examples were found where quartz formed first and calcite was deposited later. Vesicles were rare in this section of the column. However, vesicles at the 1404-1980 m depth range showed a number of sequences where the high-temperature minerals started with epidote, then wollastonite, and actinolite forming last (Table 1). This indicates that the system is evolving from low-temperature to high-temperature conditions. The mineral deposition sequence in Well MW-11 was rarely observed. However, from the few noted sequences (Table 2), the deposition sequences showed that at 282 m, zeolite was seen to form later than low-temperature smectites (yellowish green) at shallow depths. The disappearance of zeolite and the formation of secondary quartz at 380 m indicates a progressive evolution in the geothermal system. However, at a greater depth of 1680 m, calcite was deposited later
TABLE 1: Sequence of mineral deposition in Well MW-08
Depth (m) Alteration sequence
( early-late) Filling type
1270 (MW-08) 1416 (MW-08) 1476 (MW-08) 1588 (MW-08) 1920 (MW-08) 1978 (MW-08)
Quartz-calcite Quartz-wollastonite Calcite-quartz Quartz-epidote-wollastonite Epidote-wollastonite Quartz-chlorite-actinolite
Vein Vesicle Vesicle Vesicle Vesicle Vesicle
TABLE 2: Sequence of mineral deposition in Well MW-11
Depth (m) Alteration sequence
( early-late) Filling type
282 (MW-11) 1680 (MW-11) 1716 (MW-11)
Clays-zeolite Epidote-calcite Epidote-quartz-wollastonite
Vein Vesicle Vesicle

Kipchumba 168 Report 10
than epidote, an indication of cooling in the system at this depth in the reservoir. This is also been reflected by the 220°C measured temperature at this depth. 5.5 Mineral alteration zones From examination of the hydrothermal alteration mineralogy of the cuttings for Wells MW-08 and MW-11, four hydrothermal alteration zones were identified in addition to the top unaltered zone. They are: Unaltered zone which consists mainly of pyroclastics and trachytes showing a high level of oxidation; the rocks are unaltered. Vesicles in this zone are empty. Smectite - zeolite zone is marked by the presence of chalcedony, smectite, calcite, and zeolites of mainly thomsonite and scolecite. This zone indicates temperatures below 200°C. Quartz-illite zone: It is characterised by assemblages of calcite, quartz, albite, and illite. This zone is marked by the first appearance of secondary quartz and illite at 666 and 390 m in Wells MW-08 and MW-11, respectively. Epidote-quartz- illite zone: The first appearance of epidote at a depth of 1158 m in Well MW-08 and at 1558 in Well MW-11 marks this zone. However, it is only in Well MW-11 that this zone is identified. This zone in Well MW-08 was not identified, as wollastonite was encountered at a shallower depth than epidote. This zone indicates an alteration temperature of more than 240°C. Epidote- illite- wollastonite –Actinolite zone is characterised by the first appearance of wollastonite at 1404 m in Well MW-08 and at 1680 m in Well MW-11. This zone extends to the bottom of the wells and is characterised by the presence of epidote, actinolite, illite, and chlorite. Temperatures in this zone exceed 270-290°C. 5.6 Fluid inclusion geothermometry A fluid inclusion analysis was carried out using quartz and calcite grains obtained from Wells MW-08 and MW-11. This was carried out in order to measure the temperature of alteration mineral formation (homogenization temperatures) within the reservoir rocks and for comparison with current measured temperatures. 5.6.1 Well MW-08 Fluid inclusion measurements were done in this well at 1746 m depth. A quartz crystal was used for the analysis and the homogenisation temperature was recorded. Seventy three fluid inclusions both of primary and secondary origin were analysed and a homogenisation temperature, ranging from 265 to 315°C, was observed. These results were drawn on a histogram (Figure 12), which showed two populations. Secondary fluid inclusions were seen aligned along fractures in the crystal and gave a recorded temperature range of 275-280 and 285-290°C. The primary fluid inclusions gave a higher temperature, ranging from 295 to 315°C. The histogram was incorporated
FIGURE 12: Histogram showing the results of fluid inclusion analysis in Well MW-08
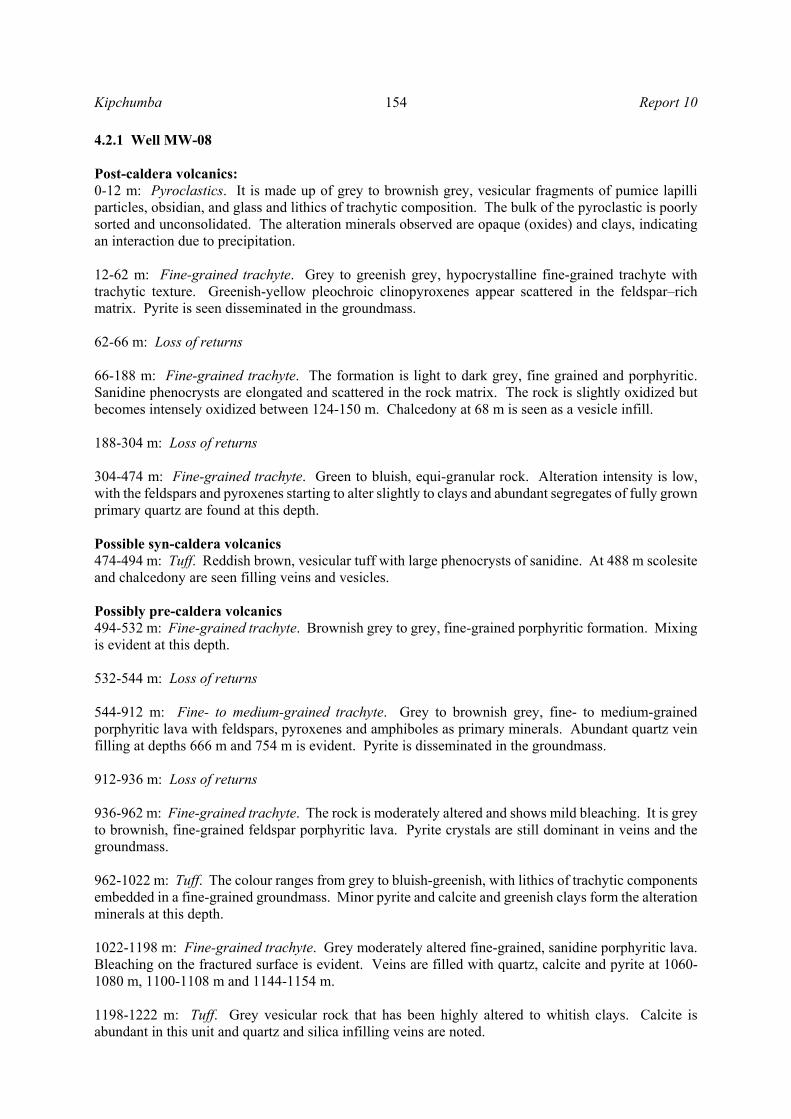
Report 10 169 Kipchumba
together with the measured, alteration and boiling point temperature curves so as to understand how the geothermal system has evolved with time. From the relationships (Figure 13), the four parameters show that between 400 to 1200 m, the measured temperature is lower than the alteration temperature, indicating cooling in this section of the well. At 1400 m depth, equilibrium exists between measured temperature and alteration, but deeper in the well below 1700 m depth, measured temperature is slightly higher (310°C) than temperature measured with fluid inclusion analysis (275-310°C), suggesting stable or maybe even slightly increasing temperature conditions at this depth in the well.
5.6.2 Well MW-11 In this well both calcite and quartz crystals were picked for fluid inclusion analysis at a depth of 1720 m. A total of fifty four fluid inclusions were identified and analysed and a histogram was drawn showing the temperatures at which inclusions homogenised (Figure 14). From the histogram, two populations were recorded. The first population ranged from 255 to 285°C with most of the inclusions homogenising between 275 and 280°C. From the analysis of the quartz crystal, the primary inclusions identified recorded higher temperatures of 300 and 325°C, forming the second population. The calcite crystal showed a higher temperature range from 305 to 335°C with the highest temperatures plotting at 310 to
0
20
40
FIGURE 13: Relationship between fluid inclusion temperatures, alteration temperatures, boiling point curve and 382 days heating temperature curve for Well MW-08

Kipchumba 170 Report 10
315°C. This implies that the system had at a time been at boiling conditions, but has since then experienced some cooling. A comparison of the fluid inclusion, alteration temperature and measured temperature after 29 days of heating is highlighted in Figure 15. It should be noted that measured temperature after only 29 days does not reflect the formation temperature. The comparison indicates cooling by ≈ 55°C at 1680 m. This was estimated from comparison of the measured temperature with the first appearance of wollastonite. The homogenisation fluid inclusion
temperature at 1720 m reflects that temperatures have been at the boiling point, ~310°C, in the past, but since then cooling has been experienced. The lowest temperature measured in the fluid inclusions at this depth is 255°C, slightly higher than the estimated measured temperature at 250°C. More fluid inclusion measurements are recommended at shallower depths to ascertain the cooling of this well.
5 5 64 3 2 3 23
7
6
6
20
4
8
12250‐255
255‐260
260‐265
265‐270
270‐275
275‐280
280‐285
285‐290
290‐295
295‐300
300‐305
305‐310
310‐315
315‐320
320‐325
325‐330
330‐335
335‐340
No. of fluid inclusions
Homogenisation temperature (°C)
Calcite
Quartz
FIGURE 14: Histogram showing the results of fluid inclusion analysis in Well MW-11
0
4
8
12
FIGURE 15: Relationship between fluid inclusion temperatures, alteration temperatures, boiling point curve and 29 days heating temperature curve for Well MW-11

Report 10 171 Kipchumba
6. DISCUSSION The litho-stratigraphic successions in Menengai geothermal field are predominantly trachytes. However, in the sub surface geology, a few lenses of tuff, syenite and basalt were encountered in the study wells. Based on the analysis of the drill cuttings, five rock units were found to form the litho-stratigraphy of Wells MW-08 and MW-11. They include: pyroclastics, trachyte, tuff, syenite, and basalt. These formations are classified based on their texture and mineralogy. The penetrated rock units correlate well with the surface geology and the three evolutionary stages: Pre-, Syn- and Post- caldera volcanic activities that started shortly before 0.18 Ma ago (Leat, 1984). Leat (1984) described the post-caldera volcanics to be composed of mainly blocky lavas, sheet-forming air-fall pumice and cinder cones composed of unconsolidated scoria. The blocky nature of these rocks was illustrated by the drilling challenges and significant losses encountered during the drilling of the top 300 m of the wells. The brown to greenish brown tuff formation encountered at 490 and 288 m in Wells MW-08 and MW-11, respectively, conforms very well to the Syn-caldera formation and its identification has aided in mapping out faults that were buried by the post-caldera volcanics as indicated in Figure 7. The pre-caldera forms the major part of the stratigraphic column of the wells. It is predominantly trachytic but has a few lenses of tuff, and intrusions of syenite were encountered. The trachyte showed varied textures in this column, which could indicate different episodes of lava eruptions during the pre-caldera volcanic stage. Worth noting is the highly altered basalt penetrated at depths of 1558 and 1680 m in Well MW-08 and Well MW-11, respectively, which is presumed to be the Pliocene and Pleistocene subordinate basalts overlying the Miocene phonolites resting on the Precambrian metamorphic basement (Leat, 1984). This can be used as a marker horizon for the pre-caldera lava sequence. However, further analyses on the composition of the basalt are needed to ascertain this. Aquifers in Wells MW-11 and MW-08 are mainly associated with tuff formations and highly fractured trachyte. However, in Well MW-08 vein fillings are abundant from 1000 m to the bottom of the well, which is in contradiction with the poor permeability of the well. However, the veins are filled with alteration minerals, thus, this could indicate that the fractures have been sealed. A comparison between the two wells shows that the major feed zone in the wells is between 990 and 2000 m, tied to faults, lithological contacts and highly permeable tuff. There is a similarity in the trend and occurrence of hydrothermal alteration minerals with depth in both wells. Low-temperature minerals were noted at shallow depths and subsequently higher-temperature alteration minerals occurred with an increase in depth. The hydrothermal minerals include: chalcedony, zeolite, smectite, calcite, illite, pyrite, quartz, albite, sphene, epidote, chlorite, wollastonite, and actinolite. Their pro-grade distribution with depth indicates a history of heating in the geothermal system around the wells. However, in Well MW-11 at 1680 m, calcite was seen forming after epidote in the vesicles. This may be an indication of temperature reversal in the well and is consistent with the temperature measurements and fluid inclusion analyses at this depth. The cooling may be attributed to the closeness of the well to the caldera ring structure, which could be channelling cold fluids, hence cooling the well. Therefore, deeper production casing of the wells closer to the caldera ring needs to be considered. On the basis of hydrothermal alteration minerals and their variations with depth, four hydrothermal mineral zones were located in order of increasing temperature and depth. They include: (1) smectite-zeolite zone, (2) quartz-illite zone, (3) epidote-quartz–illite zone, and (4) epidote-illite-wollastonite-actinolite zone. The unaltered zone formed the uppermost 60 m in both wells. Fluid inclusion studies indicate that the geothermal system around Well MW-08 is in thermal equilibrium below 1400 m depth, or may be heating slightly below 1700 m depth. From the seventy three fluid inclusions analysed at 1746 m, the homogenisation temperature ranges from 265 to 315°C

Kipchumba 172 Report 10
but with an average temperature of the analyses being 282°C; the measured temperature is about 310°C at this depth, which is at the high end of the temperature range measured in the fluid inclusions. In Well MW-11, on the other hand, comparison of measured temperature with alteration temperature and fluid inclusion analyses indicate cooling in the well. The homogenisation fluid inclusion temperature at 1720 m ranged from 255-335°C while measured temperature was 250°C. High temperatures recorded from the fluid inclusion analyses indicate boiling conditions at one point of time in the system within Well MW-11, but the temperature has since then cooled and is approximately 250°C today at this depth. It must be noted, however, that the measured temperature available was logged only 29 days after the well was completed. 7. CONCLUSIONS
From the analysis of the sample cuttings and data for Wells MW-08 and MW-11, the following conclusions can be drawn:
1. The lithostratigraphy of Wells MW-08 and MW-11 is similar and is composed of five rock types: pyroclastics, trachyte, tuff, basalt, and syenite. They conform to the stratigraphy of previous wells in the area.
2. Hydrothermal alteration minerals in Menengai geothermal field are controlled by rock type,
permeability, and temperature. 3. The major source of permeability in the wells is mainly fractures/faults; other sources of
permeability in the wells include: lithological contacts between formations and permeable tuffs. 4. Four alteration zones were identified, based on hydrothermal mineral assemblages; they include:
(1) smectite-zeolite zone, (2) quartz-illite zone, (3) epidote-quartz–illite zone, and (4) epidote-illite-wollastonite-actinolite zone. The unaltered zone formed the uppermost 60 m in both wells.
5. Comparison of fluid inclusion analysis, measured temperature, and the hydrothermal alteration
curves indicates that the geothermal system around Well MW-08 is at equilibrium at 1400 m depth, but may be slightly heating below 1700 m depth. However, analysis of alteration and temperature measurements from Well MW-11 seems to indicate cooling of the geothermal system around this well. This could be attributed to the closeness of the well to the caldera ring structure, which could be channelling cold fluids, hence cooling the well.
ACKNOWLEDGEMENTS I owe sincere appreciation to the UNU-GTP and the Government of Iceland for granting me this scholarship to participate in this six months training programme. My gratitude goes to the UNU Geothermal Training Programme staff, Dr. Ingvar Birgir Fridleifsson, Mr. Lúdvík S. Georgsson, Ms. Thórhildur Ísberg, Mr. Ingimar Gudni Haraldsson, Mr. Markús A.G. Wilde, and Ms. Málfrídur Ómarsdóttir, for their guidance, assistance and care throughout the course. My special thanks goes to my supervisors, Ms. Anette K. Mortensen, Dr. Björn S. Hardarson, and Dr. Hjalti Franzson for their dedicated support and guidance during project preparation, research and writing which made it possible for me to complete this report. I am grateful to my employer, the Geothermal Development Company, Ltd. for nominating and granting me leave to attend this vital course.

Report 10 173 Kipchumba
To the 2013 UNU Fellows, thank you for the shared experience and supportive ideas; your friendship is immeasurable. Special thanks to my fellow borehole geologists Joyce Okoo, Tito Lopeyok and Claudia M. Pichardo Lopez for their continuous support with information and ideas whenever needed. Above all, I express my deepest gratitude to my relatives and family. To my dear husband and daughters, thanks for your encouragement, sacrifice and unconditional love during my six months of study. This far the Lord has been Ebenezer.
REFERENCES Baker, B.H., and Wohlenberg, J., 1971: Structural evolution of the Kenya Rift Valley. Nature, 229,538-542. Baker, B.H., Mitchel, J.G., and Williams, L.A.J., 1988: Stratigraphy, geochronology and volcanotectonic evolution of the Kedong-Naivasha-Kinangop region, Gregory Rift Valley, Kenya. Geological Society of London, 145,107-116. Browne, P.R.L., 1978: Hydrothermal alteration in active geothermal fields. Annual Review Earth & Planetary Sciences, 6, 229-250. Franzson, H., 1998: Reservoir geology of the Nesjavellir high-temperature field in SW-Iceland. Proceedings of the 19th Annual PNOC-EDC Geothermal Conference, Manila, 13-20. GDC, 2010: Menengai geothermal prospect, an investigation for its geothermal potential. GDC, Nakuru, Kenya, Geothermal Resource Assessment Project, internal report, 66 pp. GDC, 2013: Borehole geological report of Well MW-11. GDC, Nakuru, Kenya, internal report, 16 pp. Gebrehiwot M., K., 2010: Subsurface geology, hydrothermal alteration and geothermal model of northern Skardsmýrarfjall, Hellisheidi geothermal field. University of Iceland, MSc thesis, UNU-GTP, report 5, 65 pp. Geotermica Italiana Srl., 1987: Geothermal reconnaissance survey in the Menengai- Bogoria area of the Kenya Rift Valley. UN (DTCD)/GOK, report. Hay, D.E., and Wendlandt, R.F., 1995: The origin of Kenya rift plateau-type flood phonolites: Results of high-pressure/high-temperature experiments in the system‘s phonolite-H2O and phonolite-H2O-CO2. J. Geophys. Res., 100, 401-10. Hetzel, R., and Strecker, M.R., 1994: Late Mozambique Belt structures in western Kenya and their influence on the evolution of the Cenozoic Kenya Rift. J. Structural Geology, 16-2, 189- 201. Jones, W.B., 1985: Discussion on geological evolution of trachytic caldera and volcanology of Menengai volcano, Rift Valley, Kenya. J. Geol. Soc. Lon., 142, 711 pp. Jones, W.B., and Lippard, S.J., 1979: New age determination and geology of Kenya rift – Kavirondo Rift Junction, West Kenya. J. Geol. Soc. Lond., 136, 63 pp. KenGen, 2004: Menengai volcano: Investigations for its geothermal potential. KenGen, Kenya, Geothermal Resource Assessment Project, unpubl. report,

Kipchumba 174 Report 10
Kristmannsdóttir, H., 1979: Alteration of basaltic rocks by hydrothermal activity at 100-300°C. In: Mortland, M.M., and Farmer, V.C. (editors), International Clay Conference 1978. Elsevier Scientific Publishing Co., Amsterdam, 359-367. Lagat, J., 2003: Geology and the geothermal systems of the southern segment of the Kenya Rift. Proceedings of the International Geothermal Conference IGC 2003:“Multiple integrated uses of geothermal resources”, Reykjavík, S12, 33-40. Lagat, J.K., 2004: Geology, hydrothermal alteration and fluid inclusion studies of the Olkaria Domes geothermal field, Kenya. University of Iceland, MSc thesis, UNU-GTP, Iceland, report 2, 71 pp. Lagat, J.K., and Ngenoh, D., 2010. Menengai geothermal prospect. GDC, Kenya, internal report. Leat, P.T., 1983: The structural and geochemical evolution of Menengai caldera volcano, Kenya Rift Valley. University of Lancaster, UK, PhD thesis, 482 pp. Leat, P.T., 1984: Geological evolution of the trachytic caldera volcano Menengai, Kenya Rift Valley. J. Geol. Soc. London, 141, 1057-1069. Leat, P.T., MacDonald, R., and Smith, R.L., 1984: Geochemical evolution of the Menengai caldera volcano, Kenya. J. Geophys. Res., 89, 8571-8592. Lopeyok, T.P., 2013: Borehole geology and hydrothermal mineralization of wells MW-09 AND MW-11, Menengai geothermal field, Kenya. Report 15 in: Geothermal training in Iceland 2013. UNU-GTP, Iceland. MacDonald, R., 2003: Magmatism of the Kenya Rift Valley: A review.Earth Sciences, 93, 239- 253. MacDonald, R., Bailey, D.K., and Sutherland, D., 1970: Oversaturated peralkaline glassy trachyte from Kenya. J. Petrology, 11, 507-517. MacDonald, R., and Scaillet, B., 2006: The central Kenya peralkaline province: insights into the evolution of peralkaline salic magmas. Lithos, 91, 59-73. McCall, G.J.H., 1957: The Menengai caldera, Kenya colony. Proceedings of the 20th International Geol. Congress, Section 1, 55-69. McCall, G.J.H., 1967: Geology of the Nakuru-Thomson’s Falls-Lake Hannington area. Geological Survey of Kenya, report 78, 122 pp. Mibei, G., 2012: Geology and hydrothermal alteration of Menengai Geothermal field. Case study: Wells MW-04 and MW-05. Report 21 in: Geothermal training in Iceland 2013. UNU-GTP, Iceland, 437-465. Mibei, G., and Lagat, J.K., 2011: Structural controls in Menengai geothermal field. Proceedings of the Kenya Geothermal Conference – KGC2011, Nairobi, Kenya, 28-37. Omenda, P.A., 1998: The geology and structural controls of the Olkaria geothermal system, Kenya. Geothermics, 27-1, 55-74. Omenda, P.A., 2007: The geothermal activity of the East African rift. Presented at Short Course II on Surface Exploration for Geothermal Resources, organised by UNU-GTP and KenGen, at Lake Naivasha, Kenya, 12 pp.
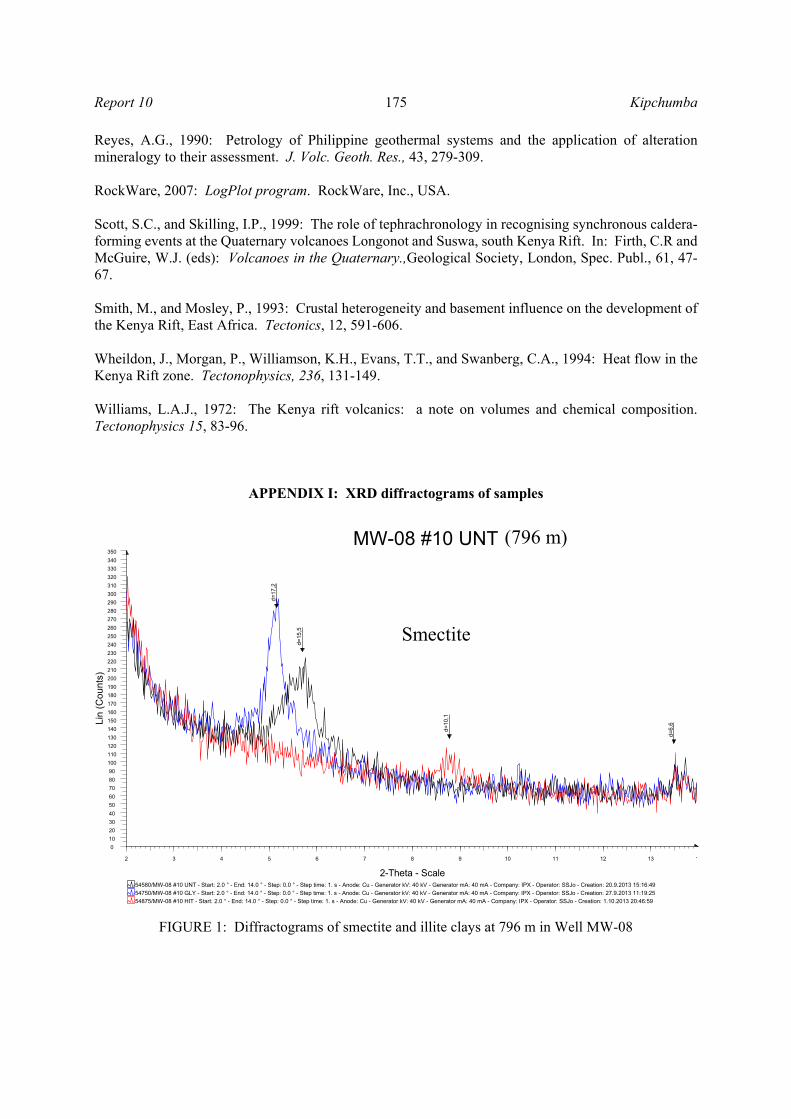
Report 10 175 Kipchumba
Reyes, A.G., 1990: Petrology of Philippine geothermal systems and the application of alteration mineralogy to their assessment. J. Volc. Geoth. Res., 43, 279-309. RockWare, 2007: LogPlot program. RockWare, Inc., USA. Scott, S.C., and Skilling, I.P., 1999: The role of tephrachronology in recognising synchronous caldera-forming events at the Quaternary volcanoes Longonot and Suswa, south Kenya Rift. In: Firth, C.R and McGuire, W.J. (eds): Volcanoes in the Quaternary.,Geological Society, London, Spec. Publ., 61, 47-67. Smith, M., and Mosley, P., 1993: Crustal heterogeneity and basement influence on the development of the Kenya Rift, East Africa. Tectonics, 12, 591-606. Wheildon, J., Morgan, P., Williamson, K.H., Evans, T.T., and Swanberg, C.A., 1994: Heat flow in the Kenya Rift zone. Tectonophysics, 236, 131-149. Williams, L.A.J., 1972: The Kenya rift volcanics: a note on volumes and chemical composition. Tectonophysics 15, 83-96.
APPENDIX I: XRD diffractograms of samples
FIGURE 1: Diffractograms of smectite and illite clays at 796 m in Well MW-08
54580/MW-08 #10 UNT
54875/MW-08 #10 HIT - Start: 2.0 ° - End: 14.0 ° - Step: 0.0 ° - Step time: 1. s - Anode: Cu - Generator kV: 40 kV - Generator mA: 40 mA - Company: IPX - Operator: SSJo - Creation: 1.10.2013 20:46:59
54750/MW-08 #10 GLY - Start: 2.0 ° - End: 14.0 ° - Step: 0.0 ° - Step time: 1. s - Anode: Cu - Generator kV: 40 kV - Generator mA: 40 mA - Company: IPX - Operator: SSJo - Creation: 27.9.2013 11:19:25
54580/MW-08 #10 UNT - Start: 2.0 ° - End: 14.0 ° - Step: 0.0 ° - Step time: 1. s - Anode: Cu - Generator kV: 40 kV - Generator mA: 40 mA - Company: IPX - Operator: SSJo - Creation: 20.9.2013 15:16:49
Lin
(C
ou
nts)
0
10
20
30
40
50
60
70
80
90
100
110
120
130
140
150
160
170
180
190
200
210
220
230
240
250
260
270
280
290
300
310
320
330
340
350
2-Theta - Scale
2 3 4 5 6 7 8 9 10 11 12 13 1
d=
6,6
d=15
,5
d=
17,2
d=10
,1
(796 m)
Smectite

Kipchumba 176 Report 10
FIGURE 2: Diffractograms of chlorite and illite clays at 1700 m in Well MW-08
FIGURE 3: Diffractograms of illite at 1546 m in Well MW-11
54591/MW-08 #21 UNT
54886/MW-08 #21 HIT - Start: 2.0 ° - End: 14.0 ° - Step: 0.0 ° - Step time: 1. s - Anode: Cu - Generator kV: 40 kV - Generator mA: 40 mA - Company: IPX - Operator: SSJo - Creation: 2.10.2013 08:59:26
54761/MW-08 #21 GLY - Start: 2.0 ° - End: 14.0 ° - Step: 0.0 ° - Step time: 1. s - Anode: Cu - Generator kV: 40 kV - Generator mA: 40 mA - Company: IPX - Operator: SSJo - Creation: 27.9.2013 13:41:18
54591/MW-08 #21 UNT - Start: 2.0 ° - End: 14.0 ° - Step: 0.0 ° - Step time: 1. s - Anode: Cu - Generator kV: 40 kV - Generator mA: 40 mA - Company: IPX - Operator: SSJo - Creation: 20.9.2013 17:17:26
Lin
(Co
unt
s)
0
100
200
300
400
500
600
700
800
900
2-Theta - Scale
2 3 4 5 6 7 8 9 10 11 12 13 1
d=7,
2
d=10
,3
d=14
,5
(1700 m)
Chlorite - Illite
54632/MW-11 #08 UNT
54855/MW-11 #08 HIT - Start: 2.000 ° - End: 14.000 ° - Step: 0.020 ° - Step time: 1. s - Anode: Cu - Generator kV: 40 kV - Generator mA: 40 mA - Company: IPX - Operator: SSJo - Creation: 1.10.2013 15:12:22
54703/MW-11_#08_GLY - Start: 2.000 ° - End: 14.000 ° - Step: 0.020 ° - Step time: 1. s - Anode: Cu - Generator kV: 40 kV - Generator mA: 40 mA - Company: IPX - Operator: SSJo - Creation: 25.9.2013 12:54:56
54632/MW-11 #08 UNT - Start: 2.000 ° - End: 14.000 ° - Step: 0.020 ° - Step time: 1. s - Anode: Cu - Generator kV: 40 kV - Generator mA: 40 mA - Company: IPX - Operator: SSJo - Creation: 23.9.2013 15:21:17
Lin
(C
ou
nts
)
0
100
200
300
400
500
d - Scale
710203040
d=1
0,3
(1546 m)
Illite