Boondoggles, Rent-Seeking, and Political Checks and ...pscourses.ucsd.edu/ps200b/Keefer Knack...
8
Boondoggles, Rent-Seeking, and Political Checks and Balances: Public Investment under Unaccountable Governments Author(s): Philip Keefer and Stephen Knack Source: The Review of Economics and Statistics, Vol. 89, No. 3 (Aug., 2007), pp. 566-572 Published by: The MIT Press Stable URL: http://www.jstor.org/stable/40043049 . Accessed: 12/01/2015 01:03 Your use of the JSTOR archive indicates your acceptance of the Terms & Conditions of Use, available at . http://www.jstor.org/page/info/about/policies/terms.jsp . JSTOR is a not-for-profit service that helps scholars, researchers, and students discover, use, and build upon a wide range of content in a trusted digital archive. We use information technology and tools to increase productivity and facilitate new forms of scholarship. For more information about JSTOR, please contact [email protected]. . The MIT Press is collaborating with JSTOR to digitize, preserve and extend access to The Review of Economics and Statistics. http://www.jstor.org This content downloaded from 137.110.38.163 on Mon, 12 Jan 2015 01:03:55 AM All use subject to JSTOR Terms and Conditions
Transcript of Boondoggles, Rent-Seeking, and Political Checks and ...pscourses.ucsd.edu/ps200b/Keefer Knack...

Boondoggles, Rent-Seeking, and Political Checks and Balances: Public Investment underUnaccountable GovernmentsAuthor(s): Philip Keefer and Stephen KnackSource: The Review of Economics and Statistics, Vol. 89, No. 3 (Aug., 2007), pp. 566-572Published by: The MIT PressStable URL: http://www.jstor.org/stable/40043049 .
Accessed: 12/01/2015 01:03
Your use of the JSTOR archive indicates your acceptance of the Terms & Conditions of Use, available at .http://www.jstor.org/page/info/about/policies/terms.jsp
.JSTOR is a not-for-profit service that helps scholars, researchers, and students discover, use, and build upon a wide range ofcontent in a trusted digital archive. We use information technology and tools to increase productivity and facilitate new formsof scholarship. For more information about JSTOR, please contact [email protected].
.
The MIT Press is collaborating with JSTOR to digitize, preserve and extend access to The Review ofEconomics and Statistics.
http://www.jstor.org
This content downloaded from 137.110.38.163 on Mon, 12 Jan 2015 01:03:55 AMAll use subject to JSTOR Terms and Conditions

BOONDOGGLES, RENT-SEEKING, AND POLITICAL CHECKS AND BALANCES: PUBLIC INVESTMENT UNDER
UNACCOUNTABLE GOVERNMENTS
Philip Keefer and Stephen Knack*
Abstract - We show that public investment is dramatically higher in countries with low-quality governance and limited political checks and balances or no competitive elections. This result is robust to a number of specifications. The most plausible interpretation of these results is that these governments use public investment as a vehicle to increase their rent-seeking. This evidence suggests that efforts to increase public invest- ment in countries with weak governance, or to measure the growth effects of productive public investment using only observed measures of public investment, should be undertaken with caution.
I. Introduction
POLICYMAKERS and international aid agencies regard
productive public investment as essential for economic development. Sachs and colleagues (2004) argue strongly that high transport costs and other infrastructure weaknesses are key bottlenecks to African development. The Commis- sion for Africa report (2005, ch. 7) urges donor nations to provide $10 billion per year more in aid for African infra- structure from 2005-2010, with a further increase to $20 billion per year over the following five years. Public invest- ment is also well-known as a vehicle for rent-seeking, however. If rent-seeking is a sufficiently powerful motiva- tion for public investment expenditures, we might expect an association between government incentives to seek rents and the quantity of public investment. The results presented here show that levels of observed public investment, whether as a fraction of national income or of total invest- ment, public and private, are substantially higher in coun- tries that exhibit low levels of a composite measure of expropriation and contract repudiation risk, law and order, corruption, and bureaucratic quality. Public investment is also much higher in countries that have noncompetitive elections and few political checks and balances.
The most plausible explanation for the findings reported below is that extra public investment associated with weak institutions is unproductive and largely intended to steer rents to government officials or their cronies. These results therefore signal the need for donor agencies to exercise particular caution in supporting public investment in coun- tries with a weak institutional environment. They also have implications for a number of research directions that are prominent in the literature.
The results first suggest some rethinking of research strategies that use observed public investment data to es- tablish the effects of public investment on growth. In addi- tion, the results here reveal additional and previously unex-
plored implications of institutions that limit government (elections and political checks and balances). The evidence below demonstrates that institutional variables that else- where in the literature are taken as proxies for limited government are associated with both less corruption and less (but, we argue, more productive) public investment, results that are consistent with predictions by Acemoglu (2005) about the effects of limited government. Finally, previous work has linked corruption to distortions in gov- ernment spending. One obvious policy conclusion from such work is the need to fight corruption more vigorously. Our findings suggest that this may be ineffective in com- bating the deeper institutional difficulties that we associate with those same spending distortions.
II. Measuring Corruption, Property Rights Security, and Political Checks and Balances
The conclusions here, that public investment rises when governments have greater incentives to seek rents, depend fundamentally on the quality of the two measures of rent- seeking incentives we use. On the one hand, rent-seeking can be viewed as the extent to which governments tax the fruits of citizen effort and retain the revenues from these taxes for their own purposes. Citizen effort drops when taxes are high. Governments that engage in significant rent-seeking therefore do so because they believe that their share of the long-run rents from high citizen effort are lower than the short-run rents that they can extract at the expense of citizen effort (Acemoglu, 2005; Clague et al., 1996). For example, governments that expect to be expelled from office regardless of whether they perform well have little incentive to restrain their rent-seeking behavior.1 Such governments also have little reason to refrain from expropriation or from the repudiation of contracts, nor do they have an incentive to ensure that citizens benefit from the rule of law or from the services of high-quality bureaucracies.
Our first indicator of government rent-seeking incentives captures these effects. It is a composite of subjective eval- uations of different dimensions of country risk prepared by the PRS Group, a firm specializing in political risks to foreign investment, and published as the International Country Risk Guide (ICRG). This is a familiar variable; the particular index here was first used in Keefer and Knack (1995). The ICRG is provided monthly to subscribers, mainly multinational investors. To examine this relationship, Received for publication April 30, 2003. Revision accepted for publi-
cation March 6, 2006. * Both authors are affiliated with the World Bank. The opinions expressed here are solely those of the authors and do not
represent the views of the World Bank or its directors.
1 A government laboring under significant negative shocks whose con- sequences are attributed by citizens to the government's own actions would confront such a situation.
The Review of Economics and Statistics, August 2007, 89(3): 566-572 © 2007 by the President and Fellows of Harvard College and the Massachusetts Institute of Technology
This content downloaded from 137.110.38.163 on Mon, 12 Jan 2015 01:03:55 AMAll use subject to JSTOR Terms and Conditions

BOONDOGGLES, RENT-SEEKING, AND POLITICAL CHECKS AND BALANCES 567
we use five variables from the ICRG to form an additive index, "quality of governance."2 These variables are bureau- cratic quality, the risk of expropriation and of repudiation of contracts by government, corruption, and the law and order tradition of the country. The index is measured on a scale of 0-50, with higher values indicating better quality of gover- nance. The median values of these are used over the period 1974-1998.3
The ICRG assigns low ratings of its corruption variable ("corruption in government") to countries in which top government officials are likely to demand special payments and where illegal payments are generally expected through- out lower levels of government. The quality of the bureau- cracy assesses the degree to which the bureaucracy has the strength and expertise to govern without drastic changes in policy or interruption of governmental services. Such bu- reaucracies have established mechanisms for recruitment and training, and some autonomy from political pressure. If politicians are unconstrained in the demands that they can place on bureaucracies, or if they are subject to frequent replacement, bureaucratic quality is likely to be lower.4 Expropriation risk tracks the risk of confiscation and forced nationalization while the risk of contract repudiation as- sesses the risk that governments will repudiate or otherwise unilaterally change the terms of contracts with foreign businesses. Finally, the extent to which disputes in a country are resolved legally and through formal channels is mea- sured in the variable "law and order tradition."
The quality of governance is a direct measure of the incentives of governments to seek rents and to refrain from establishing institutions that would limit their ability to seek rents. The multidimensional index is more informative than the simple corruption measure for several reasons. First, rent-seeking need not be corrupt. On the contrary, efforts to channel benefits away from citizens to political officials and their constituencies are usually legal. Second, political in- stitutions could limit rent-seeking behavior by politicians but bureaucratic corruption could nevertheless be high, because of capacity constraints due to poverty or lack of experience in exercising oversight over bureaucrats. Thus, low scores on the index reflect distortions associated with "excessively strong" or "excessively weak" states (Acemo- glu, 2005). The five dimensions of the quality of gover- nance, taken together, offer a clearer picture of political incen- tives to pursue rents and to undermine or refrain from building institutions that would restrain political rent-seeking.
In addition to setting high taxes in anticipation of an early departure from power, governments may also wish to deny citizens access to rents (for example, from natural re- sources). This might have little influence on citizen effort
except that citizens have no reason to acquiesce to such a decision by government. To protect their privileged access to natural resources or other exogenous sources of rents, governments restrict citizen influence on political decisions and political careers. Political checks and balances are few and elections absent.5 Regardless of the historical genesis of these institutional arrangements, governments that do not exhibit political checks and balances or that suppress elec- toral competition may have a more difficult time making the credible commitment to citizens that their assets will be safe from expropriation after they have exerted effort to accu- mulate them.6 Such governments have no reason to refrain from expropriation, since citizens have no reason to expect that they will, so again we should observe high levels of rent-seeking.
Our second measure of accountability captures these basic institutional characteristics of countries. The Database of Political Institutions (DPI) (Beck et al., 2001) contains an objective measure of checks and balances cum elections, "checks." The measure is a function of the number of parties in the government coalition (for parliamentary systems), whether the president's party has a majority in the legisla- ture (presidential systems), and whether elections are gov- erned by closed-list or open-list rules (the former granting more authority to the heads of parties). Since constitutional checks on executive behavior typically mean little if the relevant actors are not elected, the construction of checks also takes into account the DPFs legislative index of elec- toral competitiveness (LIEC), scaled one to seven.7 The average value of checks, 1974-1998, is used in the analysis below.8
To measure public investment, we follow Levine and Renelt (1992) and Devarajan, Swaroop, and Zou (1996) by taking data on public investment from the Government Finance Statistics (GFS) of the International Monetary Fund. While GFS has some data on public investment by state and local governments, its most complete and reliable coverage is of central government expenditures, not includ-
2 The results we report are not sensitive to the manner in which the index is constructed. 3 Period medians are more appropriate for ordinal data like the ICRG
indicators, but are in any case correlated at 0.99 with the period means. 4 Noll and Fiorina (1978) is one or the first ol a growing literature
examining the interaction of political and bureaucratic agents.
5 Acemoglu, Johnson, and Robinson (2001) make this argument. 6 These fundamental institutions - elections and checks and balances - are the focus here and emphasized by, among many others, North and Weingast (1989) and Acemoglu, Johnson, and Robinson (2001). However, incentives to extract rents also vary with the detailed institutions of democracy (whether governments are parliamentary or presidential, for example), as in Persson and Tabellini (2000). 7 Where there are no elections, countries receive a one; the scores rise to
seven when there are multiple candidates and multiple parties, and no single party or candidate receives more than 75% of the vote. If the legislative index of electoral competitiveness is less than five (where five indicates that multiple parties can legally be established, but where only one party wins any seats in the legislature), checks is always one. For other coding rules, see Beck et al. (2001). 8 Other commonly used measures of democracy, such as Polity IV or
Freedom House, extend across a wider set of democratic characteristics, including performance characteristics (such as human rights guarantees). These additional characteristics cloud the essential role of elections and checks and balances; because of the subjectivity of these variables, it is not possible to ensure that these multiple characteristics are equally weighted across countries or over time.
This content downloaded from 137.110.38.163 on Mon, 12 Jan 2015 01:03:55 AMAll use subject to JSTOR Terms and Conditions

568 THE REVIEW OF ECONOMICS AND STATISTICS
Table 1. - Descriptive Statistics ^___ Multivariate Sample Settler Mortality Sample
Mean Std.Dev. N Mean Std.Dev. N
Public investment/GDP 5.2 3.6 89 5.3 3.4 51 Public investment/total investment 18.4 11.6 86 19.5 12.1 49 Quality of governance index 31.3 11.2 80 26.6 8.3 45 Checks 2.9 1.6 89 2.4 1.2 51 Area (in logs) 16.7 2.1 89 16.9 2.5 51 Population (in logs) 15.7 1.7 89 15.6 1.7 51 Left party largest (prop, of years) 0.32 0.36 89 0.34 0.39 51 Price of investment goods, U.S. = 100 96.5 46.0 89 104.6 53.6 51 Per capita income (logs) 8.4 1.0 87 8.1 0.9 50 Settler mortality (logs) 4.5 1.2 51 4.5 1.2 51 Degrees from equator 25.0 17.1 89 17.1 11.4 51
Multivariate sample includes countries in either equation (3) or (4) in tables 2 and 3. Settler mortality sample includes countries in either equations (1) or (3) of table 4.
ing investments by state-owned enterprises.9 We look at average public investment over the period as a fraction of GDP and of total investment.
A number of other possible determinants of public invest- ment are taken into account in the analysis below. The returns to public investment may depend on the amount of initial public infrastructure already in place as well as the overall level of economic income. We therefore control for initial purchasing power parity-adjusted income per capita (Summers & Heston, 1991) to capture the effect of both. The land area of a country (in logs) and the log of initial population are included because the economic returns to public investment may vary with the size of a country. The political demands made on governments by citizens may vary as well with size.
Spending preferences of governments may be correlated with their ideological tendencies (left, favoring more redis- tribution and government intervention in the economy, or right, favoring less). The DPI provides information on parties' ideological tendencies, so we control for the per- centage of years from 1975 to 1998 that the largest party in the legislature is coded in DPI as left-leaning. Investment is likely to be influenced by the price of investment goods, so we account for the initial price level of investment goods in a country relative to prices in the United States (Summers & Heston, 1991). The U.S. value is 100. Public investment/ GDP should be lower where the initial price index is higher; public investment/total investment should rise if private investors are more sensitive to investment prices. Table 1 presents the summary statistics on these variables.
III. Governance, Checks and Balances, and Public Investment
A simple exercise suggests that there are dramatic differ- ences between countries with high and low values of checks
or quality of governance. If the sample is divided into two equal-sized groups (those above and below checks equal to 2.5, or those above and below a score of 30 on quality of governance), public investment in the low checks sample is 6.7% of GDP and in the low quality of governance sample it is 6.1%. Public investment is 3.9% of GDP in the high checks sample and 3.6% in the high quality of governance sample.
These differences persist in the analysis below, using ordinary and two-stage least squares estimates of the determinants of average public investment as a fraction of GDP and of total investment over the period 1974- 1998. This time period is driven by the availability of the DPI (which begins in 1975) and ICRG variables (which start in 1982). Like most empirical efforts using these institutional data, which vary relatively little over time but substantially across countries, we focus our analysis on cross-section averages.
Results in table 2 are OLS estimates of determinants of public investment/GDP. The first two columns display a large bivariate association between the quality of gover- nance and checks and balances. The association changes little when controls are added in the remaining columns. A ten-point increase in the quality of governance is associated with a reduction in public investment of 1.2% of GDP, not controlling for income per capita. The effect of an increase in checks by one point on the seven-point scale is nearly the same. Income per capita is highly correlated both with the quality of governance (as Acemoglu, Johnson, & Robinson, 2001, also report) and with checks. Nevertheless, results are robust to the inclusion of initial income per capita in columns 5 and 6. Initial income per capita is itself not a significant determinant of public investment, nor are the other controls.
The dependent variable shifts to public investment/total investment in table 3, but the results are similar. A ten-point increase in quality of governance is associated with a reduction in the ratio of public to total investment by 3 or 4 percentage points, depending on the specification. A one- point increase in checks reduces public investment/total
9 Barro (1991) appears to use the general government public investment, including decentralized government expenditures from GFS where avail- able. For a few dozen countries, Easterly and Rebelo (1993) supplement GFS data on central government public investment with World Bank country reports that most notably include data on investments by state- owned enterprises.
This content downloaded from 137.110.38.163 on Mon, 12 Jan 2015 01:03:55 AMAll use subject to JSTOR Terms and Conditions
BOONDOGGLES, RENT-SEEKING, AND POLITICAL CHECKS AND BALANCES 569
Table 2. - Determinants of Public Investment/GDP
OLS Regressions 1 2 3 4 5 6
Quality of governance -0.120 -0.121 -0.093 (period median) (0.027) (0.031) (0.048)
Checks -1.145 -1.171 -1.017 (period mean) (0.206) (0.196) (0.229)
Area -0.294 -0.331 -0.286 -0.343 (logsqkm) (0.225) (0.215) (0.239) (0.230)
Population -0.305 -0.211 -0.382 -0.237 (log of initial) (0.352) (0.321) (0.377) (0.354)
Mean years that largest party 0.529 0.336 0.405 0.291 is left-leaning (1.111) (0.943) (1.094) (0.944)
Price of investment 0.004 -0.001 0.003 -0.002 goods (initial) (0.007) (0.007) (0.008) (0.007)
Log per capita income -0.404 -0.362 (initial) (0.636) (0.462)
R2 0.16 0.23 0.30 0.36 0.29 0.36 No. ofobs. 93 114 79 88 77 86
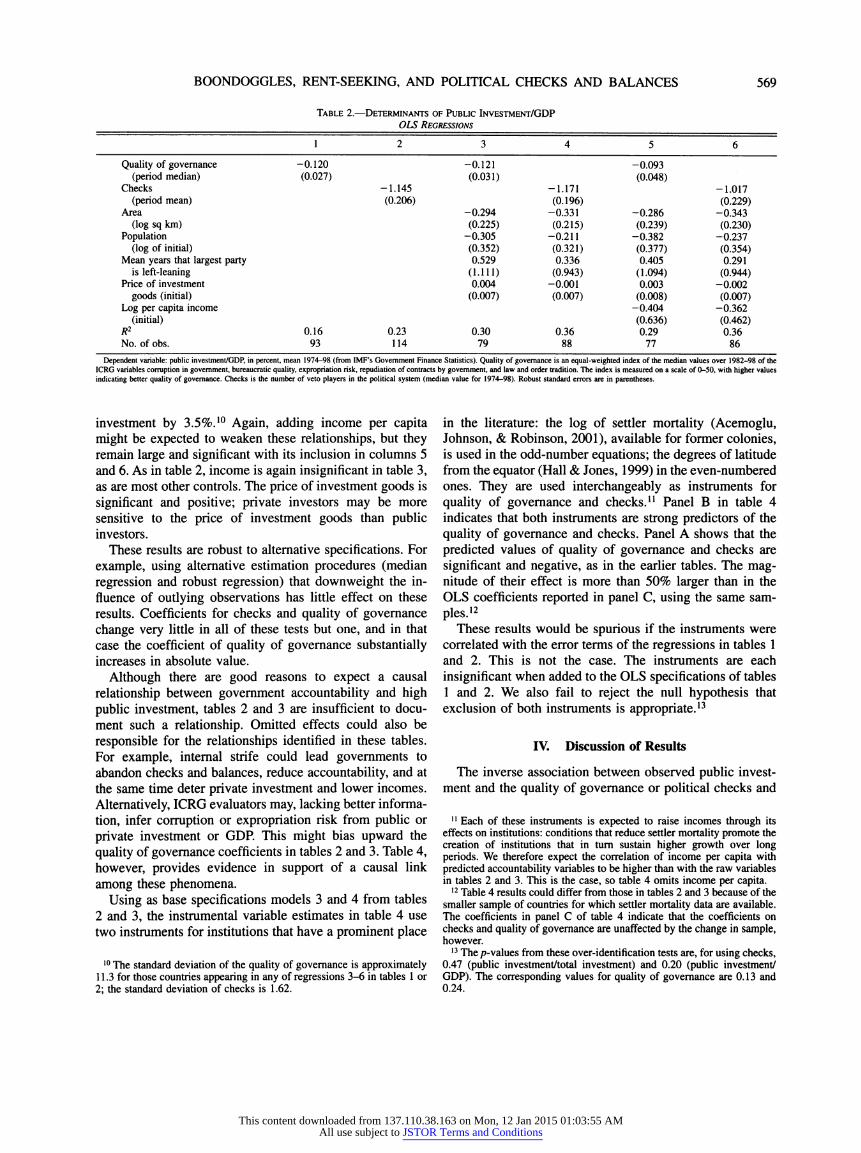
Dependent variable: public investment/GDP, in percent, mean 1974-98 (from IMF's Government Finance Statistics). Quality of governance is an equal-weighted index of the median values over 1982-98 of the ICRG variables corruption in government, bureaucratic quality, expropriation risk, repudiation of contracts by government, and law and order tradition. The index is measured on a scale of 0-50, with higher values indicating better quality of governance. Checks is the number of veto players in the political system (median value for 1974-98). Robust standard errors are in parentheses.
investment by 3.5%. 10 Again, adding income per capita might be expected to weaken these relationships, but they remain large and significant with its inclusion in columns 5 and 6. As in table 2, income is again insignificant in table 3, as are most other controls. The price of investment goods is significant and positive; private investors may be more sensitive to the price of investment goods than public investors.
These results are robust to alternative specifications. For example, using alternative estimation procedures (median regression and robust regression) that downweight the in- fluence of outlying observations has little effect on these results. Coefficients for checks and quality of governance change very little in all of these tests but one, and in that case the coefficient of quality of governance substantially increases in absolute value.
Although there are good reasons to expect a causal relationship between government accountability and high public investment, tables 2 and 3 are insufficient to docu- ment such a relationship. Omitted effects could also be responsible for the relationships identified in these tables. For example, internal strife could lead governments to abandon checks and balances, reduce accountability, and at the same time deter private investment and lower incomes. Alternatively, ICRG evaluators may, lacking better informa- tion, infer corruption or expropriation risk from public or private investment or GDP. This might bias upward the quality of governance coefficients in tables 2 and 3. Table 4, however, provides evidence in support of a causal link among these phenomena.
Using as base specifications models 3 and 4 from tables 2 and 3, the instrumental variable estimates in table 4 use two instruments for institutions that have a prominent place
in the literature: the log of settler mortality (Acemoglu, Johnson, & Robinson, 2001), available for former colonies, is used in the odd-number equations; the degrees of latitude from the equator (Hall & Jones, 1999) in the even-numbered ones. They are used interchangeably as instruments for quality of governance and checks.11 Panel B in table 4 indicates that both instruments are strong predictors of the quality of governance and checks. Panel A shows that the predicted values of quality of governance and checks are significant and negative, as in the earlier tables. The mag- nitude of their effect is more than 50% larger than in the OLS coefficients reported in panel C, using the same sam- ples.12
These results would be spurious if the instruments were correlated with the error terms of the regressions in tables 1 and 2. This is not the case. The instruments are each insignificant when added to the OLS specifications of tables 1 and 2. We also fail to reject the null hypothesis that exclusion of both instruments is appropriate.13
IV. Discussion of Results
The inverse association between observed public invest- ment and the quality of governance or political checks and
10 The standard deviation of the quality of governance is approximately 11.3 for those countries appearing in any of regressions 3-6 in tables 1 or 2; the standard deviation of checks is 1.62.
11 Each of these instruments is expected to raise incomes through its effects on institutions: conditions that reduce settler mortality promote the creation of institutions that in turn sustain higher growth over long periods. We therefore expect the correlation of income per capita with predicted accountability variables to be higher than with the raw variables in tables 2 and 3. This is the case, so table 4 omits income per capita. 12 Table 4 results could differ from those in tables 2 and 3 because of the smaller sample of countries for which settler mortality data are available. The coefficients in panel C of table 4 indicate that the coefficients on checks and quality of governance are unaffected by the change in sample, however.
13 The/?- values from these over-identification tests are, for using checks, 0.47 (public investment/total investment) and 0.20 (public investment/ GDP). The corresponding values for quality of governance are 0.13 and 0.24.
This content downloaded from 137.110.38.163 on Mon, 12 Jan 2015 01:03:55 AMAll use subject to JSTOR Terms and Conditions

570 THE REVIEW OF ECONOMICS AND STATISTICS
Table 3. - Determinants of Public Investment/Total Investment
OLS Regressions
12 3 4 5 6
Quality of governance -0.392 -0.372 -0.286 (period median) (0.081) (0.095) (0.159)
Checks -3.622 -3.531 -2.404 (period mean) (0.612) (0.637) (0.700)
Area -0.765 -0.668 -0.657 -0.632 (logsqkm) (0.605) (0.814) (0.608) (0.800)
Population (log -0.225 -0.176 -0.580 -0.596 of initial) (0.795) (0.884) (0.871) (1.007)
Mean years that largest 0.243 -1.580 0.024 -1.818 party is left-leaning (2.806) (2.991) (2.759) (3.082)
Price of investment 0.055 0.064 0.047 0.055 goods (initial) (0.019) (0.022) (0.022) (0.023)
Log per capita income -1.146 -2.590 (initial) (2.038) (1.665)
R2 0.16 0.23 0.35 0.36 0.33 0.38 No. of obs. 93 1 14 78 85 76 83
Dependent variable: public investment/(public + private investment), in percent, mean 1974-98 (from IMF's Government Finance Statistics). Quality of governance is an equal-weighted index of the median values over 1982-98 of the ICRG variables corruption in government, bureaucratic quality, expropriation risk, repudiation of contracts by government, and law and order tradition. The index is measured on a scale of 0-50, with higher values indicating better quality of governance. Checks is the number of veto players in the political system (median value for 1974-98). Robust standard errors are in parentheses.
balances has two possible explanations. One seems more plausible, but we can discard neither based on the evidence presented above. First, in countries where governance or checks on political behavior are weak (where rulers are strong), governments face fewer political costs from rent- seeking. Because public investment is a favored vehicle for extracting rents, observed public investment rises. This result is consistent with the argument in Acemoglu (2005) that strong rulers are freer to extract revenues for their own benefit. The evidence is insufficient to test the further prediction that strong states that are unable to collect reve- nues will undertake lower productive public investment, since productive public investment is unobserved.
It could be, however, that public investment is not dis- proportionately used to seek rents. This does not seem to be the case. From pork barrel spending in the United States to white elephant steel factories in Nigeria, public investment has served purposes other than maximization of growth, ranging from securing political support to increasing per- sonal fortunes. In Turkmenistan, where roads were crum- bling and water was unavailable for hours on end, the authorities built an international airport with the capacity to receive 4.5 million visitors a year, though only a few hundred thousand used the airport; authorities further in- sisted on building the control tower on the wrong side of the terminal, blocking the controllers' view of the runway.14 Statistical evidence suggests as well that public investment improves the quality of infrastructure only when the quality of governance is high (Keefer & Knack, 2002). 15
The second explanation for the inverse association of public investment and governance is that governments with no interest in rent-seeking nevertheless find themselves
unable to demonstrate their credibility. They therefore in- crease productive public investment in order to offset the fact that their lack of credibility has driven off private investment. This explanation seems less plausible because governments unable to make credible commitments (for example, governments with short horizons) also tend to have fewer incentives to promote growth. The findings here therefore at least advise caution when increasing public investment in countries with a weak institutional environ- ment.
The findings also have implications for a number of research directions prominent in the literature. A significant body of research uses observed public investment data to assess the impact of public investment or public infrastruc- ture on economic growth. Pritchett (1996) and others have argued that observed public investment is a poor proxy for productive investment. Our results suggest that it may not only be a noisy indicator, but a systematically biased one as well: there may be an inverse correlation between observed and productive public investment. Attempts to use observed public investment to assess the effect of public investment on growth are unlikely to yield accurate estimates without controlling for the possibility of this inverse correlation.
Another line of research investigates the effects of cor- ruption on government decision making and specifically on the allocation of public spending. Tanzi and Davoodi (1997) conclude that public investment is strongly associated with greater corruption. They argue explicitly that this "extra" public investment is aimed at rent-seeking. Mauro (1998) finds similar, though weaker, evidence of the same phenom- enon. Our findings, particularly the strong relationship be- tween public investment spending and political checks and balances and competitive elections, indicate that the con- nection between government decisions and corruption is the product of deeper phenomena that may influence both corruption and public investment simultaneously. Support- ing this, the results reported above are equally strong using
14 "Palaces and Poverty in Central Asia," Washington Post, November 11, 1994, p. A35. Robinson and Torvik (2005) provide more examples. 15 There, the quality of infrastructure is approximated by an index of such indicators as electricity losses, kilometers of paved roads, and access to adequate sanitation.
This content downloaded from 137.110.38.163 on Mon, 12 Jan 2015 01:03:55 AMAll use subject to JSTOR Terms and Conditions

BOONDOGGLES, RENT-SEEKING, AND POLITICAL CHECKS AND BALANCES 571
Table 4. - Instrumental Variables Estimates of the Determinants of Public Investment/GDP
Public Investment/GDP (%) Public Inv./Total Inv. (%)
12 3 4 5 6 7 8
Panel A: Two-Stage Least Squares
Quality of -0.166 -0.179 -0.603 -0.466 governance (0.099) (0.043) (0.285) (0.116)
Checks -1.515 -1.356 -6.621 -4.484 (0.814) (0.338) (3.306) (1.157)
Area -0.472 -0.402 -0.313 -0.373 -1.364 -0.936 -0.738 -0.885 (logsqkm) (0.274) (0.233) (0.251) (0.216) (0.780) (0.617) (0.976) (0.713)
Population (log of -0.023 -0.138 -0.136 -0.136 0.881 0.043 0.062 0.222 initial) (0.398) (0.300) (0.369) (0.300) (1.136) (0.794) (1.449) (0.994)
Left-party largest 2.758 0.741 2.475 0.434 5.519 0.632 4.643 -0.826 (mean) (1.121) (0.932) (1.111) (0.877) (3.330) (2.537) (4.745) (3.065)
Price of investment 0.001 0.002 -0.002 -0.001 0.047 0.052 0.044 0.058 goods (initial) (0.009) (0.008) (0.008) (0.007) (0.025) (0.022) (0.036) (0.027)
Panel B: First-Stage Regressions
Log settler -3.676 -0.438 -3.661 -0.416 mortality (0.959) (0.134) (0.976) (0.136)
Degrees lat. 0.450 0.056 0.455 0.054 from equator (0.051) (0.008) (0.053) (0.008)
Area -0.127 -0.976 -0.047 -0.149 -0.124 -0.982 -0.043 -0.152 (logsqkm) (0.717) (0.586) (0.092) (0.083) (0.727) (0.589) (0.093) (0.085)
Population (log of 0.859 1.370 0.057 0.225 0.865 1.349 0.068 0.234 initial) (0.980) (0.740) (0.134) (0.112) (0.993) (0.744) (0.136) (0.114)
Left-party largest 1.968 2.235 0.398 0.374 2.098 1.913 0.552 0.477 (mean) (2.882) (2.435) (0.388) (0.352) (3.029) (2.512) (0.407) (0.376)
Price of investment 0.027 -0.010 -0.001 -0.003 0.027 -0.010 -0.001 -0.003 goods (initial) (0.024) (0.022) (0.003) (0.003) (0.024) (0.022) (0.003) (0.003)
# 33 ^58 ~21 49 33 ^58 ^28 47
Panel C: OLS
Quality of -0.110 -0.121 -0.360 -0.373 governance (0.055) (0.032) (0.165) (0.095)
Checks -1.279 -1.171 -4.230 -3.531 (0.380) (0.196) (1.267) (0.637)
No. of obs. 45 79 51 88 44 78 49 85
Panel A reports the two-stage least squares estimates with public investment/GDP (in percent, mean 1974-98) as the dependent variable in columns 1-4 and public investment/total investment (in percent, mean 1974-98) as the dependent variable in columns 5-8, instrumenting for the institutional variable with log settler mortality and/or degrees from equator. Panel B reports the corresponding first-stage regressions. Panel C reports the OLS coefficient from regressing the indicated public investment variable on the indicated institutional variable, for the same (2SLS) sample, with the other control variables listed in panel A (full results not reported to save space).
a quality of governance index that excludes the corruption variable; at the same time, corruption used alone is not as statistically significant.
Others have found no connection between institutions -
specifically, democracy - and many government spending decisions. Mulligan, Gil, and Sala-i-Martin (2004) contrast two arguments. On the one hand, the presence of democratic institutions should influence public spending by giving the poor greater opportunity to redistribute spending to their own benefit. On the other, all leaders, democratic or not, seek to maximize the gains from dealing with interest groups, so that underlying economic interests rather than political institutions should determine cross-country differ- ences in observed public spending outcomes. Mulligan et al. find that noninstitutional variables are significant determi- nants of social and education spending, while their measure of democracy is not. Our results suggest that political institutions affect spending at least to the extent that they facilitate citizen control of political rent-seeking.
In our tables 2 and 3 regressions using checks, an objec- tive measure of two key democratic institutions (elections and political checks and balances), checks remains a signif- icant determinant of public investment even when we con- trol for these same noninstitutional measures.16 Even if citizens cannot systematically influence who benefits from redistributive government spending, and provided that pub- lic investment is, indeed, a preferred vehicle for rent- seeking, the robustness of these results implies that demo- cratic institutions influence the degree to which citizens can control rent-seeking behavior by politicians.
The findings here also contribute to the literature on the effects of credible commitment on policymaking. Typically,
16 Their five noninstitutional variables are a communist dummy, a British legal origin dummy, the log of population, the fraction of the population over 65, and the log of initial income. Adding British legal origin and the fraction of the population over 65 does not change our results; mean years that the largest party is left-wing captures the same effect as the communist dummy.
This content downloaded from 137.110.38.163 on Mon, 12 Jan 2015 01:03:55 AMAll use subject to JSTOR Terms and Conditions

572 THE REVIEW OF ECONOMICS AND STATISTICS
this literature has found that governments unable to make credible commitments create a greater risk of expropriation on citizens or limit government ability to conduct monetary policy and that political checks and balances mitigate the credibility problem.17 Acemoglu (2005) offers theoretical support for the argument that limited government should also affect government spending. The results here support this line of analysis, demonstrating that political checks and balances also influence the composition of government spending, and may do so because of the influence they have on government incentives to seek rents.
V. Conclusion
We document that observed public investment as a frac- tion of national income or total investment is much higher in countries that exhibit weak governance or few political checks and balances. Further research is needed to deter- mine the extent to which public investment in these coun- tries is less productive and intended to serve the private interests of government officials, or is rather an effort by those same public officials to compensate for their inability to offer a secure environment to private investors. If the former explanation is correct, scaling up aid for infrastruc- ture or other public investment in countries with weak governance will have little impact on economic growth. Advocates of dramatic increases in aid for infrastructure often acknowledge that scaled-up funding should be accom- panied by anticorruption programs, to ensure the resources are well spent (Commission for Africa, 2005). However, policies to fight corruption similarly may be ineffective in counteracting the more deeply seated incentive structure that leads to distortions in public investment.
17 Acemoglu, Johnson, and Robinson (2002) and North and Weingast (1989) emphasize the importance of political checks and balances for the security of property rights. Keefer and Stasavage (2003) demonstrate that political checks and balances improve the credibility of government monetary policy, thereby reducing inflation.
REFERENCES
Acemoglu, Daron, "Politics and Economics in Weak and Strong States," Journal of Monetary Economics 52:7 (2005), 1199-1226.
Acemoglu, Daron, Simon Johnson, and James Robinson, "The Colonial Origins of Comparative Development: An Empirical Investiga- tion," American Economic Review 91:5 (2001), 1369-1401.
"Reversal of Fortune: Geography and Institutions in the Making of the Modern World Income Distribution," Quarterly Journal of Economics 117:4 (2002), 1231-1294.
Barro, Robert, "Economic Growth in a Cross Section of Countries," Quarterly Journal of Economics 106:2 (1991), 407-^44.
Beck, Thorsten, George Clarke, Alberto Groff, Philip Keefer, and Patrick Walsh, "New Tools in Comparative Political Economy: The Data- base of Political Institutions," World Bank Economic Review 15:1 (2001), 165-176.
Clague, Christopher, Philip Keefer, Stephen Knack, and Mancur Olson, "Property and Contract Rights in Autocracies and Democracies," Journal of Economic Growth 1:2 (1996), 243-276.
Commission for Africa, Our Common Interest: Report of the Commission for Africa, http://www.commissionforafrica.org/english/report/in- troduction.html (2005).
Devarajan, Shantayanan, Vinaya Swaroop, and Heng-fu Zou, "The Com- position of Public Expenditure and Economic Growth," Journal of Monetary Economics 37:2 (1996), 313-344.
Easterly, William, and Sergio Rebelo, Fiscal Policy and Economic Growth: An Empirical Investigation," Journal of Monetary Eco- nomics 32:3 (1993), 417^58.
Hall, Robert E., and Charles I. Jones, "Why Do Some Countries Produce So Much More Output per Worker than Others?" Quarterly Jour- nal of Economics 114:1 (1999), 83-116.
Keefer, Philip, and Stephen Knack, "Institutions and Economic Perfor- mance: Cross-Country Tests Using Alternative Institutional Mea- sures," Economics and Politics 7:3 (1995), 207-227.
"Boondoggles and Expropriation: Rent-Seeking and Policy Dis- tortion when Property Rights are Insecure," World Bank policy research working paper no. 2910 (2002).
Keefer, Philip, and David Stasavage, "The Limits of Delegation: Veto Players, Central Bank Independence, and the Credibility of Mon- etary Policy," American Political Science Review 97:3 (2003), 407^23.
Levine, Ross, and David Renelt, "A Sensitivity Analysis of Cross-Country Growth Equations," American Economic Review 82:4 (1992), 942- 963.
Mauro, Paulo, "Corruption and the Composition of Government Expen- diture," Journal of Public Economics 69:2 (1998), 263-279.
Mulligan, Casey, Ricard Gil, and Xavier Sala-i-Martin, "Do Democracies Have Different Public Policies than Non-democracies?" Journal of Economic Perspectives 18:1 (2004), 51-74.
Noll, Roger, and Morns Fiorina, Voters, Legislators and Bureaucrats: A Rational Choice Perspective on the Growth of Bureaucracy," Jour- nal of Public Economics 9:3 (1978), 239-254.
North, Douglass, and Barry Weingast, "Constitutions and Commitments: The Evolution of Institutions Governing Public Choice in 17th Century England," Journal of Economic History 49:4 (1989), 803-832.
Persson, Torsten, and Guido Tabellini, Political Economics: Explaining Public Policy (Cambridge, MA: MIT Press, 2000).
Pritchett, Lant, "Mind Your Ps and Qs: The Cost of Public Investment Is Not the Value of Public Capital," World Bank policy research working paper no. 1660 (1996).
Robinson, James, and Ragnar Torvik, "White Elephants," Journal of Public Economics 89:2-3 (2005), 197-210.
Sachs, Jeffrey, with John W. McArthur et al., Ending Afnca s Poverty Trap," Brookings Papers on Economic Activity 2004:1 (2004), 117-240.
Summers, Robert, and Alan Heston, "The Penn World Table (Mark V): An Extended Set of International Comparisons, 1950-88," Quarterly Journal of Economics 106:2 (1991), 327-336.
Tanzi, Vito, and Hamid Davoodi, "Corruption, Public Investment and Growth," IMF working paper WP/97/139 (1997).
This content downloaded from 137.110.38.163 on Mon, 12 Jan 2015 01:03:55 AMAll use subject to JSTOR Terms and Conditions