Bob James - Virginia Tech · PDF fileNew trends in calf feeding and housing – The good...
79
New trends in calf feeding and housing – The good and not-so-good! Bob James
-
Upload
duonghuong -
Category
Documents
-
view
225 -
download
1
Transcript of Bob James - Virginia Tech · PDF fileNew trends in calf feeding and housing – The good...

New trends in calf feeding and housing – The good and not-so-good!
Bob James

Colostrum Management
• Quality, quantity, quick and clean
• >85% of 1st milking colostrum over 50 g/liter
• Using Brix Refractometer
– Not temperature sensitive
– More durable than colostrometer
– Readings > 22 indicate good quality colostrum
– RID values > 50mg IgG/mL
• 4 liters - 1st 12 hours

Clean colostrum
It’s a race between bacteria in the environment or the initial feeding and the antibodies in colostrum.

One reason why it’s important
Early consumption of colostrum before exposure to ???
Colostrum protein

One reason why it’s important!
Early exposure to E. coli without colostrum intake
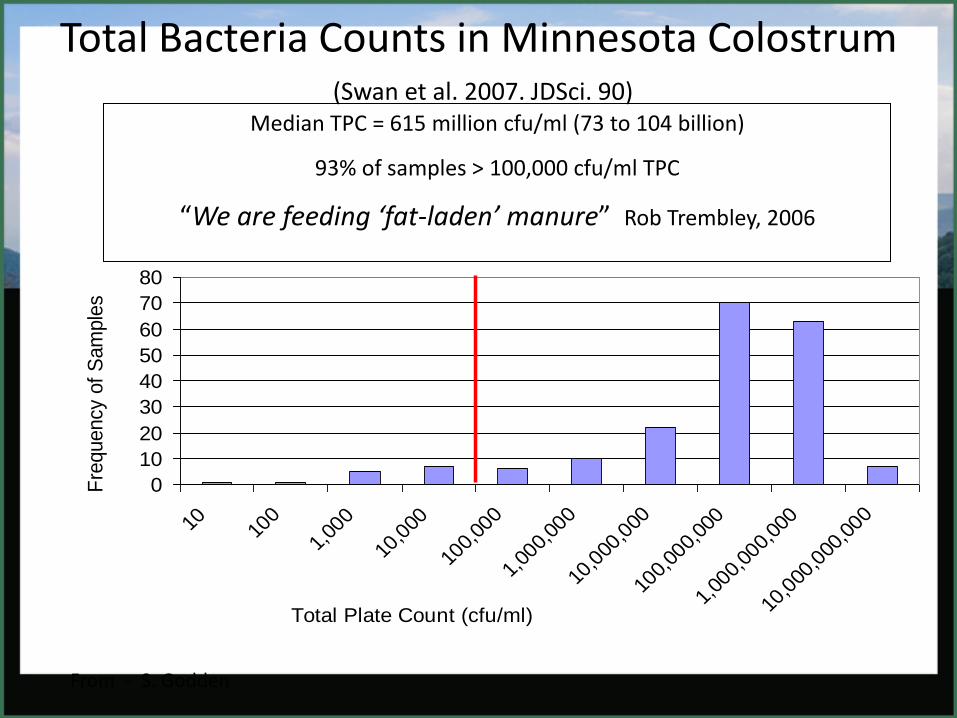
Total Bacteria Counts in Minnesota Colostrum (Swan et al. 2007. JDSci. 90)
0
10
20
30
40
50
60
70
80
10 100
1,00
0
10,0
00
100,
000
1,00
0,00
0
10,0
00,0
00
100,
000,
000
1,00
0,00
0,00
0
10,0
00,0
00,0
00
Total Plate Count (cfu/ml)
Fre
quency o
f S
am
ple
s
Median TPC = 615 million cfu/ml (73 to 104 billion)
93% of samples > 100,000 cfu/ml TPC
“We are feeding ‘fat-laden’ manure” Rob Trembley, 2006
From - S. Godden
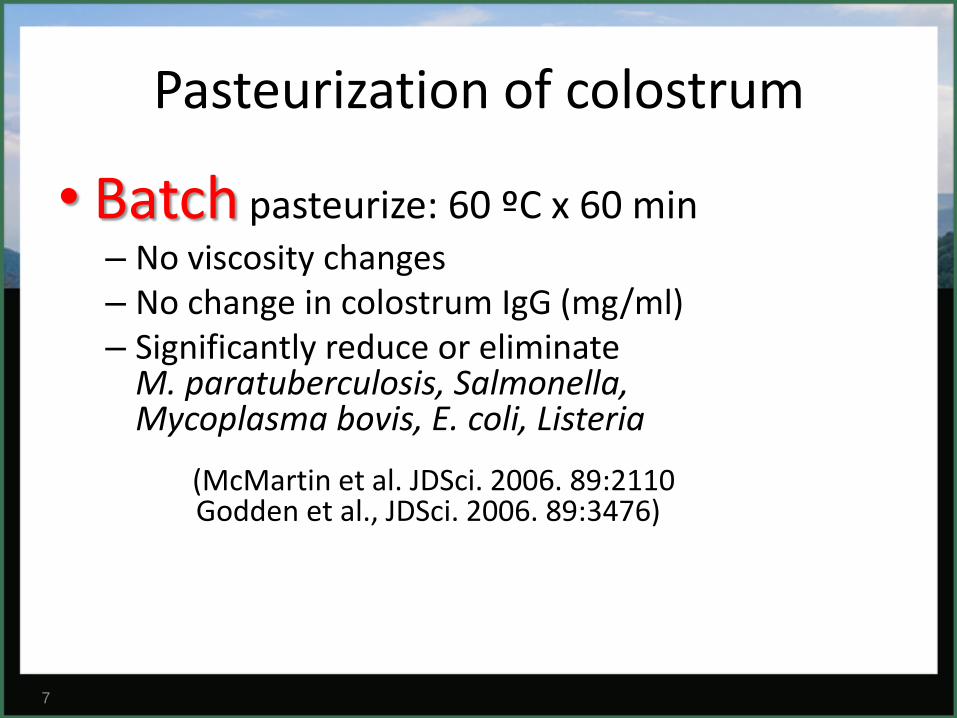
Pasteurization of colostrum
• Batch pasteurize: 60 ºC x 60 min – No viscosity changes – No change in colostrum IgG (mg/ml) – Significantly reduce or eliminate
M. paratuberculosis, Salmonella, Mycoplasma bovis, E. coli, Listeria
(McMartin et al. JDSci. 2006. 89:2110 Godden et al., JDSci. 2006. 89:3476)
7
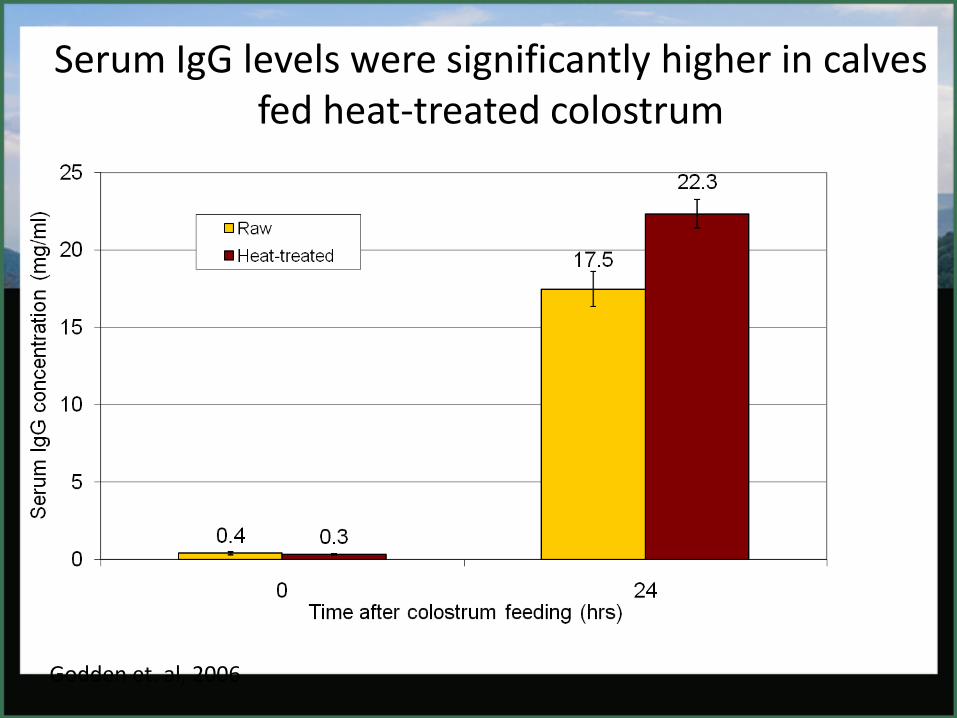
Serum IgG levels were significantly higher in calves fed heat-treated colostrum
Godden et. al, 2006

Recent UMN Field Study M. Donahue, S. Godden et al. 2012
• 1,000 calves / 6 herds – ½ fed raw and ½ fed heat-treated colostrum
• Colostrum total plate count and serum IgG – negative effect
• Colostrum IgG concentration – positive effect
• Heat treatment – positive – independent of Total plate count
• Colostrum Total Coliform Count and risk of scours – positive.
9
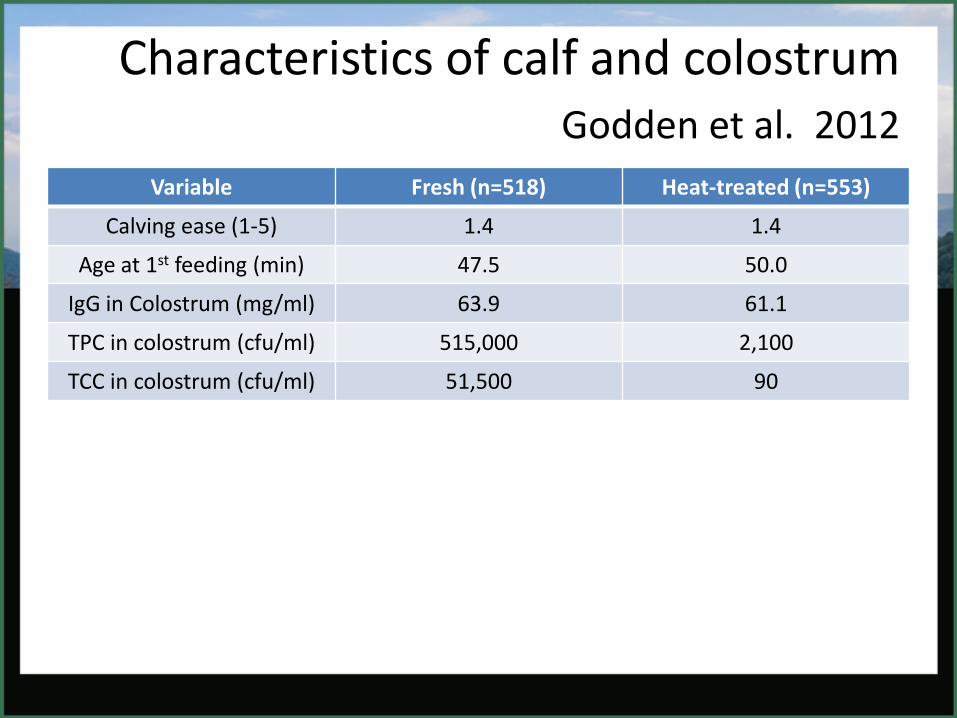
Characteristics of calf and colostrum Godden et al. 2012
Variable Fresh (n=518) Heat-treated (n=553)
Calving ease (1-5) 1.4 1.4
Age at 1st feeding (min) 47.5 50.0
IgG in Colostrum (mg/ml) 63.9 61.1
TPC in colostrum (cfu/ml) 515,000 2,100
TCC in colostrum (cfu/ml) 51,500 90

Disconnect between critical control points! - evaluation plan!
• Location
– Calving area
– Fresh cow milking
– Calf housing
• People – who is responsible?
– Fresh cow milking?
– Colostrum handling?
– Calf feeding
11
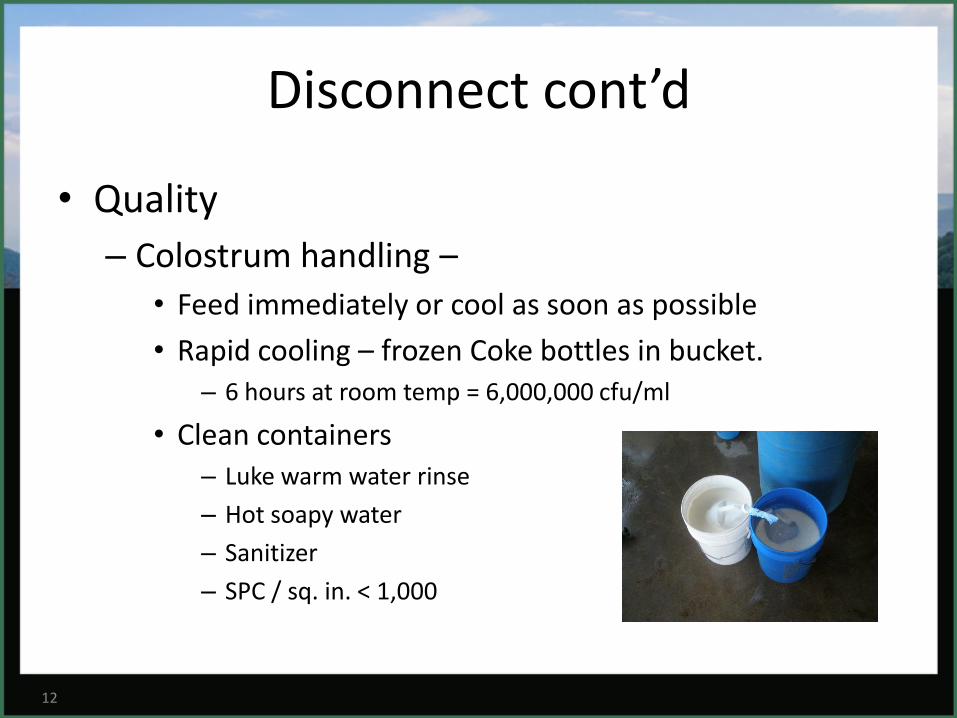
Disconnect cont’d
• Quality
– Colostrum handling –
• Feed immediately or cool as soon as possible
• Rapid cooling – frozen Coke bottles in bucket. – 6 hours at room temp = 6,000,000 cfu/ml
• Clean containers – Luke warm water rinse
– Hot soapy water
– Sanitizer
– SPC / sq. in. < 1,000
12

Two recent herd visits • Dairy 1
– >25,000,000 /ml SPC, >15,000 coliform /ml, E. coli - TNTC
– 8 calves < 7 days - serum protein – 3.9 – 4.6 g/dl.
• Dairy 2 – >25,000,000/ml, >15,000 coliform, E. coli TNTC -
– 9 calves < 7 days – serum protein 3.9 – 5.2 g/dl
13

Economic comparison of conventional vs. biologically normal systems
• Michael Overton – DVM
University of Georgia
AABP - 2010

Economic analysis Initial calf value = $200
Net Results Outputs Conventional Biologically Normal
Calf investment cost at calving
225 223
Average age @ 1st service 14.0 11.3
Average age @ 1st calving 24.7 22.0
Average daily gain (lb) 1.52 1.98
Total rearing cost/heifer $1,706 $1,687
Ave. cost/day $2.27 $2.52
Additional milk value $170
Net cost/heifer $1706 $1537

Economic analyses
• Based on assumptions used in this model – Net results (Biologically normal vs. traditional) – Feed cost $74.29 – Labor cost $(14.66) – Health/vet med $(14.65) – Interest cost $(15.50) – Reproductive culls $(7.45) – Other costs $(20.36) – Total “dead calf” costs $(21.49) – Net result $(19.81) Total value of biologically normal = $190
Waste Milk – Treasure?
• Treasure
– High nutrient value – on a powder basis – 29% fat and 27% protein
– Low cost - $.25/gallon on CA dairies
– What is the true cost?

or Trouble • Antibiotic residues
• Bacterial growth
– Mycoplasma
– Mycobacterium – JOHNE’S
– Staph…
– Coliforms
– Salmonella
– Endotoxins?
• Dirt and flies
Goals of pasteurization
• Standard plate count - <20,000 cfu/ml
• Alkaline phosphatase activity - < 500 mU/ml
– Enzyme naturally present in milk which is destroyed when adequate temperature/time have been achieved.

Pasteurization time and temperature combination
Type Time Temp
Co
Temp
Fo
Batch 30 min. 63 145
HTST 15 sec. 72 161

Concerns with batch pasteurizers
• Batch
– Time to heat and cool milk - hours
– Dead spots if poorly agitated.
– Head space above the liquid must be heated properly.
– Sanitation is not easily automated
– More suited to smaller operations with <100 calves
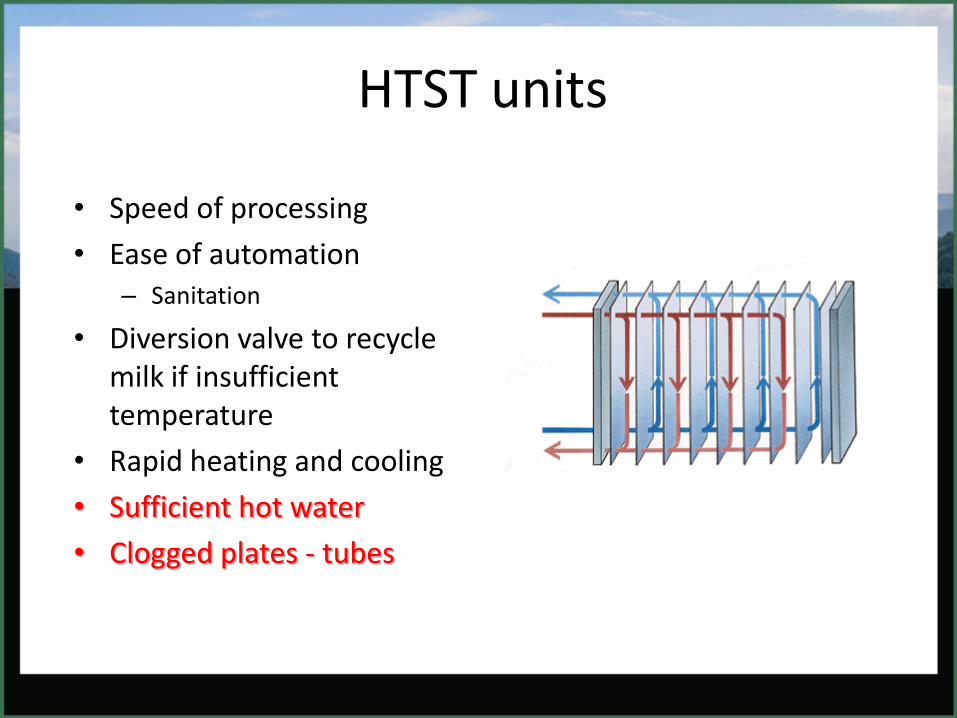
HTST units
• Speed of processing
• Ease of automation – Sanitation
• Diversion valve to recycle milk if insufficient temperature
• Rapid heating and cooling
• Sufficient hot water
• Clogged plates - tubes
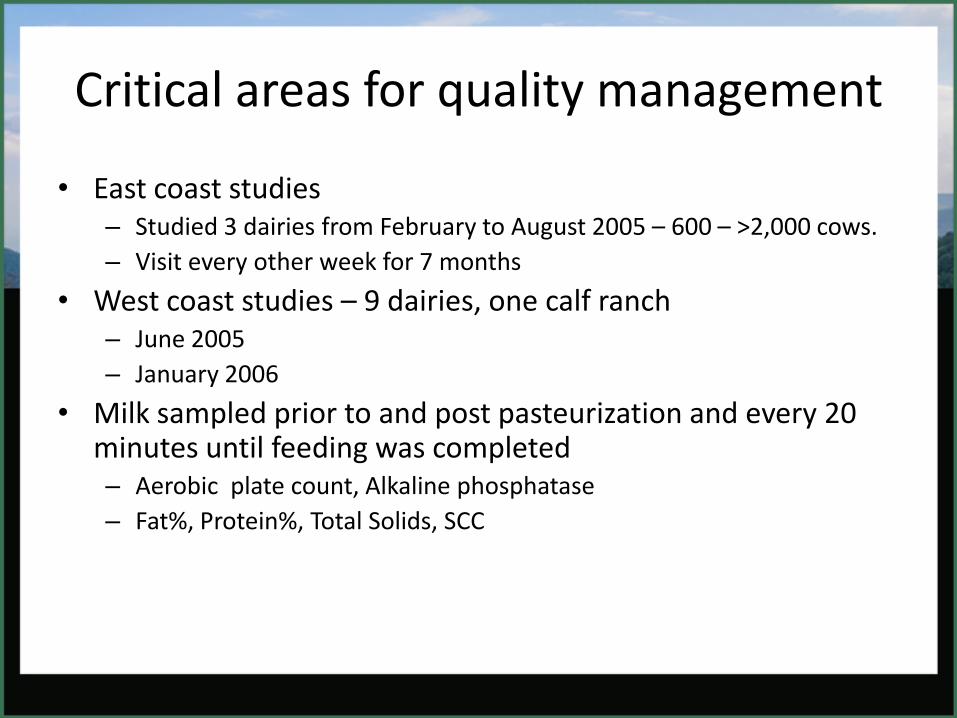
Critical areas for quality management
• East coast studies – Studied 3 dairies from February to August 2005 – 600 – >2,000 cows.
– Visit every other week for 7 months
• West coast studies – 9 dairies, one calf ranch – June 2005
– January 2006
• Milk sampled prior to and post pasteurization and every 20 minutes until feeding was completed – Aerobic plate count, Alkaline phosphatase
– Fat%, Protein%, Total Solids, SCC

Wisconsin study (Jorgensen, Hoffman et al, 2005)
• 62 milk samples from 32 farms or calf ranches evaluated – pre and post pasteurization
• Measured:
– Nutrient composition
– Somatic cell count
– Alkaline phosphatase
– Antibiotic residues
– Standard plate counts
– Identification of principal microorganisms
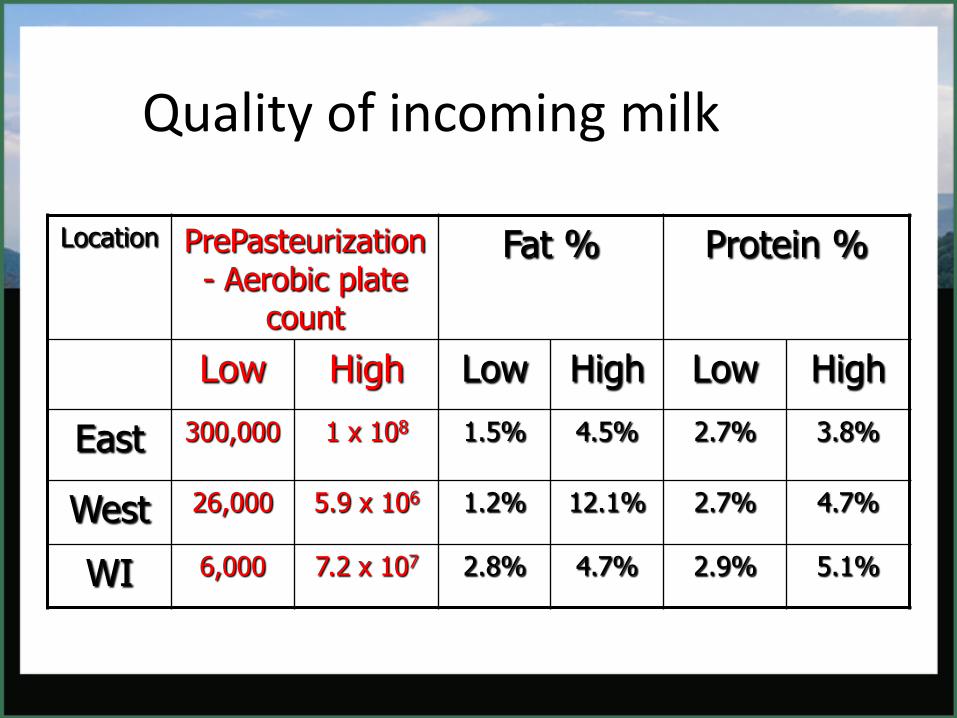
Location PrePasteurization - Aerobic plate
count
Fat % Protein %
Low High Low High Low High
East 300,000 1 x 10⁸ 1.5% 4.5% 2.7% 3.8%
West 26,000 5.9 x 10⁶ 1.2% 12.1% 2.7% 4.7%
WI 6,000 7.2 x 10⁷ 2.8% 4.7% 2.9% 5.1%
Quality of incoming milk

Pre vs. Post Pasteurization Aerobic Plate Counts
Sample from 3 East Coast dairies obtained over 7 month period.
10,000
100,000
1,000,000
10,000,000
100,000,000
Farm 1 Farm 2 Farm 3
cfu/mlPrePast APC
PostPastAPC

Pre vs. Post Pasteurization Aerobic Plate Counts – Western
Sorted by Pasteurizer Type
Only two herds had batch pasteurizers

Quality of post pasteurized milk
• East herds - pasteurized milk ave. Aerobic plate count - 105,000 cfu/ml
• West Herds – pasteurized milk ave. Aerobic plate count - 19,400 cfu/ml

Farm #1 – refrigerated milk – 50oF – 5.6X10⁸
100
1000
10000
100000
1000000
10000000
100000000
1000000000
2/22 3/8 3/22 4/5 4/19 5/3 5/17 5/31 6/14 6/28 7/12 7/26 8/9 8/23
Date
c.f.u/ml
PrePastAPC PostPastAPC
"Goal"

Factors influencing microbial growth in waste milk
• Exposure of milk to flies, manure, dirt
• Cleanliness of storage tanks and length of time milk is held prior to pasteurization.
• Temperature of milk during storage
• Cleanliness of pasteurization equipment
• Cleanliness of bottles, tanks, buckets receiving pasteurized milk.
• Microbial content of milk from the cow
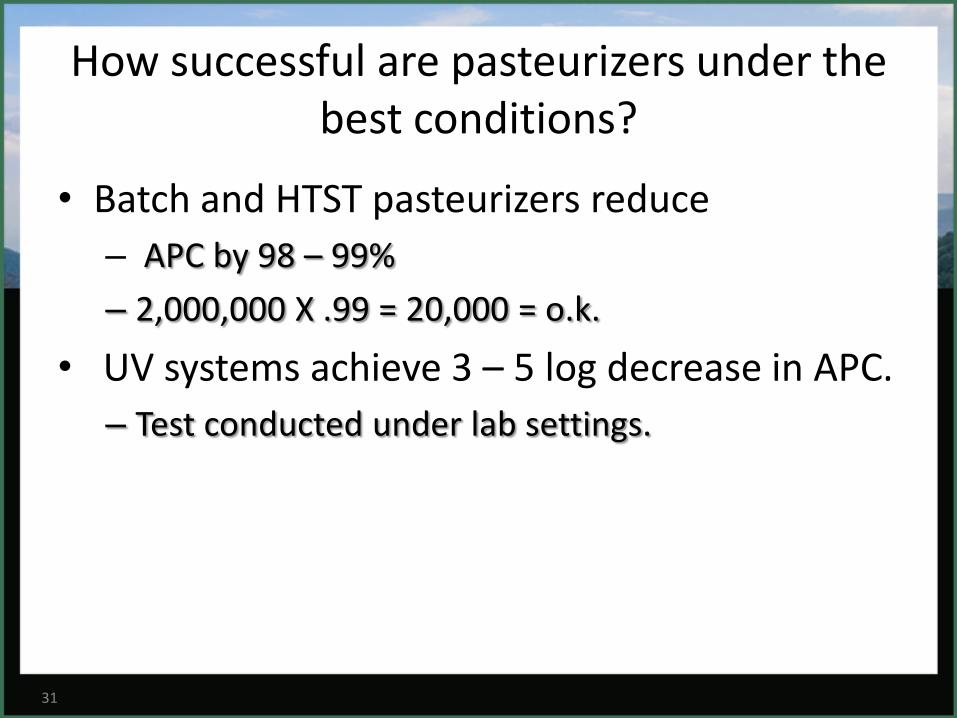
How successful are pasteurizers under the best conditions?
• Batch and HTST pasteurizers reduce
– APC by 98 – 99%
– 2,000,000 X .99 = 20,000 = o.k.
• UV systems achieve 3 – 5 log decrease in APC.
– Test conducted under lab settings.
31
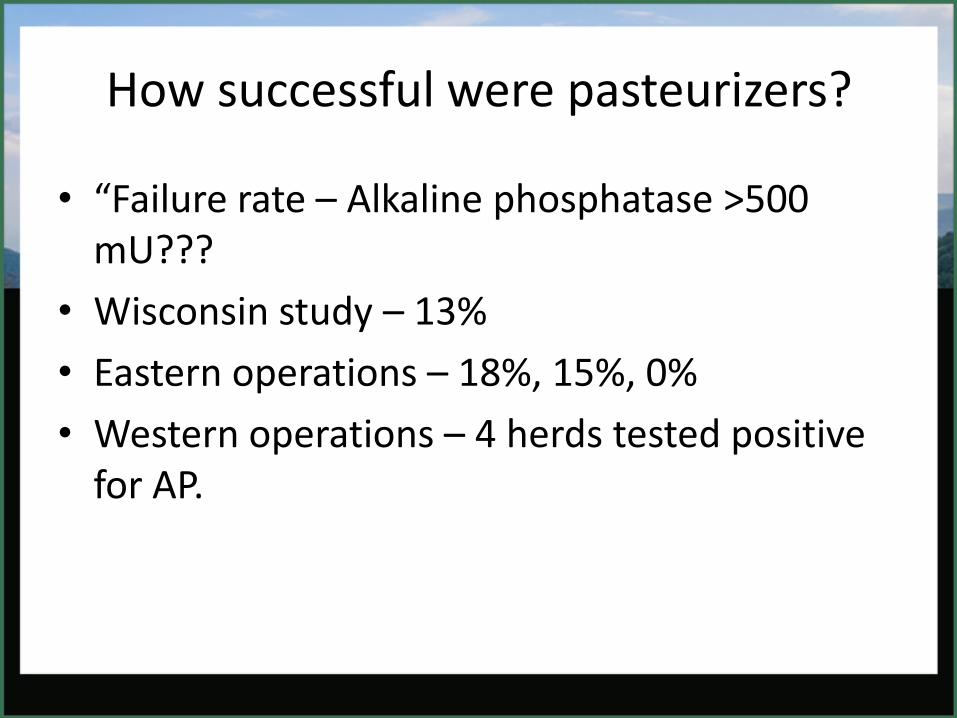
How successful were pasteurizers?
• “Failure rate – Alkaline phosphatase >500 mU???
• Wisconsin study – 13%
• Eastern operations – 18%, 15%, 0%
• Western operations – 4 herds tested positive for AP.

Efficacy of on-farm pasteurized waste milk systems on 31 WI operations
• Antibiotic residues
– 65% β-Lactam positive
– 68% non-β-Lactam positive
• Questionable pasteurization (13%)
cfu/ml PrePast PostPast
APC 8,822,000 35,000
E. Coli 10,000 134
Salmonella spp. 243 <10 Jorgensen et al., 2005
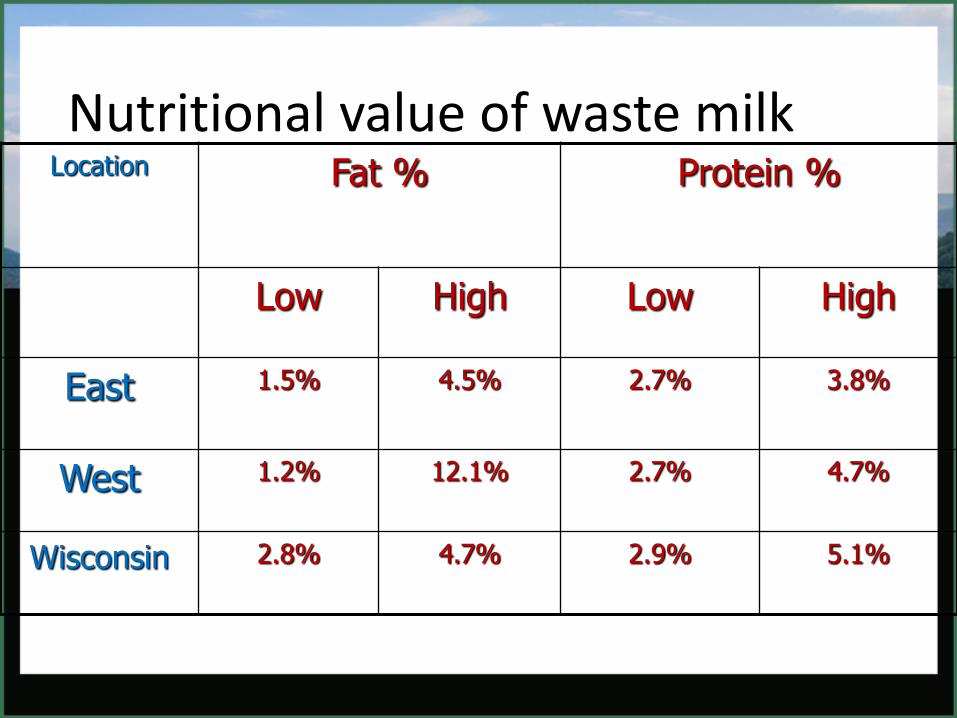
Location Fat % Protein %
Low High Low High
East 1.5% 4.5% 2.7% 3.8%
West 1.2% 12.1% 2.7% 4.7%
Wisconsin 2.8% 4.7% 2.9% 5.1%
Nutritional value of waste milk
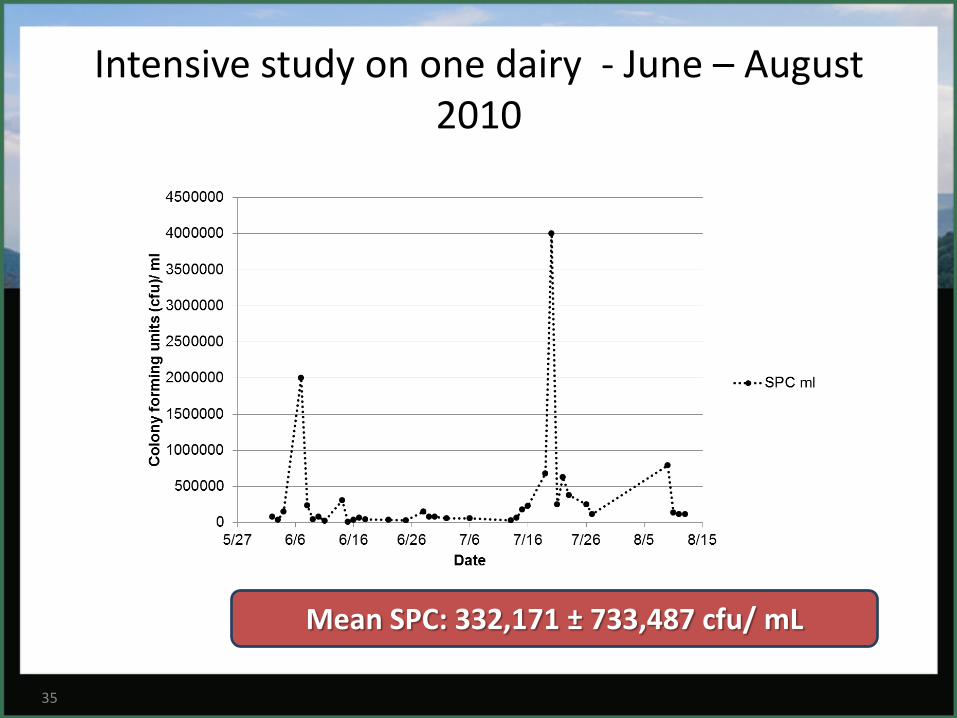
Intensive study on one dairy - June – August 2010
35
Mean SPC: 332,171 ± 733,487 cfu/ mL
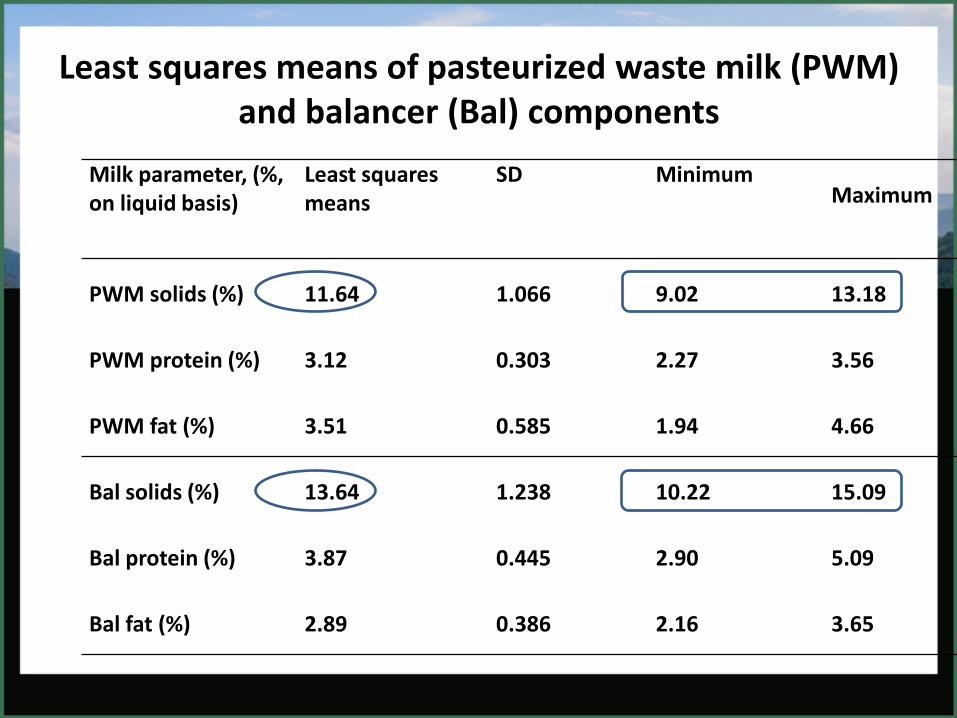
Least squares means of pasteurized waste milk (PWM) and balancer (Bal) components
Milk parameter, (%, on liquid basis)
Least squares means
SD Minimum Maximum
PWM solids (%) 11.64 1.066 9.02 13.18
PWM protein (%) 3.12 0.303 2.27 3.56
PWM fat (%) 3.51 0.585 1.94 4.66
Bal solids (%) 13.64 1.238 10.22 15.09
Bal protein (%) 3.87 0.445 2.90 5.09
Bal fat (%) 2.89 0.386 2.16 3.65

Reasons for variation in nutritional value
• Addition of flush water to the receiving tank prior to sanitizing the milking system.
• Poor agitation – sampling of waste milk
• Interval between pasteurization and feeding – Buckets
– Bottles
• Fresh cow vs. treated cow inventory in the sick pen.

Post pasteurization quality control Sample obtained prior to an every 20 minutes
10,000
100,000
1,000,000
10,000,000
PrePast
(23)
PostPast
(26)
Feed1 (16) Feed3 (11) Feed5 (4) Feed7 (2) Feed9 (1)
SPC
cfu/ml
Aerobic plate count on 10 western operations

Pasteurizer cleaning
• Rinse – warm water
• Caustic detergent
• Sanitize with acid cleaner
• Never allow HTST unit to run dry. Commercial machines have automatic flow sensors to prevent “cooking” of milk between plates.
• Cleaning “batch” pasteurizers?

Microbial quality during feeding
• Cleanliness of receiving tank and hoses
• Cleanliness of bottles and buckets
• Farm a – 8 of 14 post pasteurization samples exceeded 100,000 cfu/ml
• Farm b – 4 of 14 samples exceeded 200,000 cfu/ml – Staph - >20,000 cfu/ml
– Coliforms - >1,000 cfu/ml
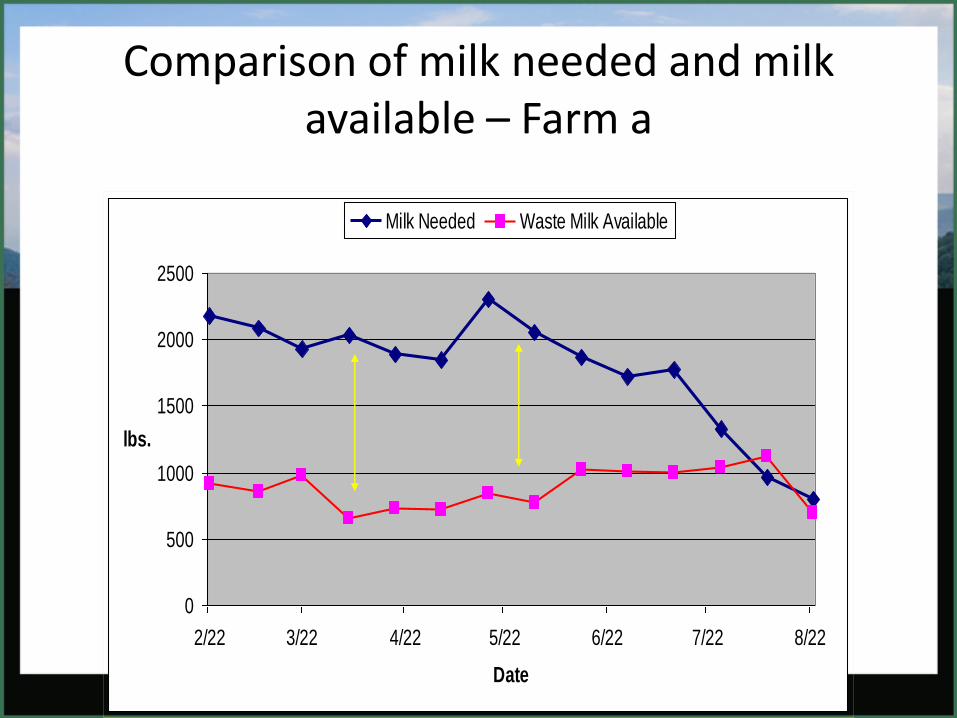
Comparison of milk needed and milk available – Farm a
0
500
1000
1500
2000
2500
2/22 3/22 4/22 5/22 6/22 7/22 8/22
Date
lbs.
Milk Needed Waste Milk Available

Supply of waste milk relative to needs – Farm b
0
500
1000
1500
2000
2500
3000
3500
4000
4500
5000
2/22 3/8 3/22 4/5 4/19 5/3 5/17 5/31 6/14 6/28 7/12 7/26 8/9 8/23
Date
lbs.
Milk Needed Waste Milk Available
Excess waste milk - cost due to excessive discarded milk?

Farm a
Daily Variation in Waste Milk Supply
0100200300400500600700800900
2/24/2005
3/10/2005
3/24/2005
4/7/2005
4/21/2005
5/5/2005
5/19/2005
6/2/2005
6/16/2005
6/30/2005
7/14/2005
7/28/2005
8/11/2005
Time
lbs.
44
Options to meet shortfall in waste milk supply
Compromise between nutrition of calf and expense
1. Additional saleable milk from bulk tank
2. Supplement waste milk by adding solids from milk replacer, whey protein and/or fat supplements
3. Switch calves to milk replacer.

45
Supplementing waste milk
2.5
3.5
4.5
5.5
6.5
7.5
8.5
9.5
10.5
11.5
12.5
13.5
Fat Protein Total Solids
%
PostPast
PostPastMR
Heifer Ranch PostPast
Heifer Ranch Mix Tank
46
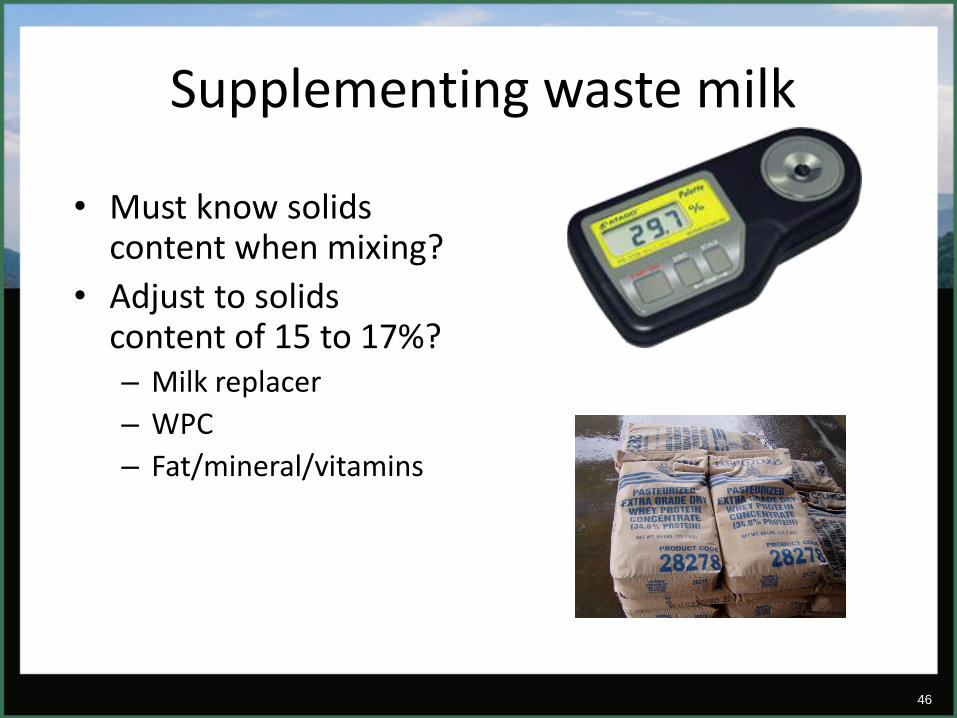
Supplementing waste milk
• Must know solids content when mixing?
• Adjust to solids content of 15 to 17%? – Milk replacer
– WPC
– Fat/mineral/vitamins

47
Switch calves to milk replacer
• Start on pasteurized waste milk or milk replacer
• Switch to opposite > 3weeks of age or vice versa.

Alternate strategy to extend waste milk Scott et al., 2006
• 62 calves ( 45 heifers, 17 bulls) – Holsteins, Jerseys and Crosses
• Born 3/21 – 10/10 2005
• Feeding rates (lb. milk solids) – determined at birth – 2.5 lb. – Holstein
– 2.0 lb. – Cross
– 1.5 lb. - Jersey
whole milk or milk replacer – equal!!!

Average daily gain
0
0.1
0.2
0.3
0.4
0.5
0.6
0.7
0.8
0.9
P1 TP P2
TRT 1 TRT 2 TRT 3
kg/d
Period
*
* = P < 0.05
50
Economics of pasteurized waste milk feeding systems
• What is the cost of waste milk?
– Free? There is a cost to the milking operation.
– Best herds produce enough for 30% of calf needs?
– California – waste milk sold to calf ranches - $2.90/cwt.

51
Important considerations
• Cost for milk replacer of similar nutrient content as waste milk.
• Accurate estimates of costs in various categories
• Net benefit varies greatly depending on input and milk replacer costs.

Pasteurizer Conclusions
• Pre Past storage is key
– Cooled, agitated
• Post Past handling important
– Automatic tank washers
• Timing is important
– Milking, storage, pasteurization, feeding
• More waste milk per calf on west coast
• Hot water supply/protocols for employees

Group Housing
53

Free choice acidified milk
54
http://www.omafra.gov.on.ca/english/livestock/dairy/facts/mimick.htm
Dangerous compound at 85% level – care in handling Higher intake – 8 – 12 quarts / calf / day

Principles of calf autofeeders
55
Biotic industries, Bell Buckle, TN

Computer controlled feeders
56
Biotic Industries Bell Buckle, TN
“Basic” System
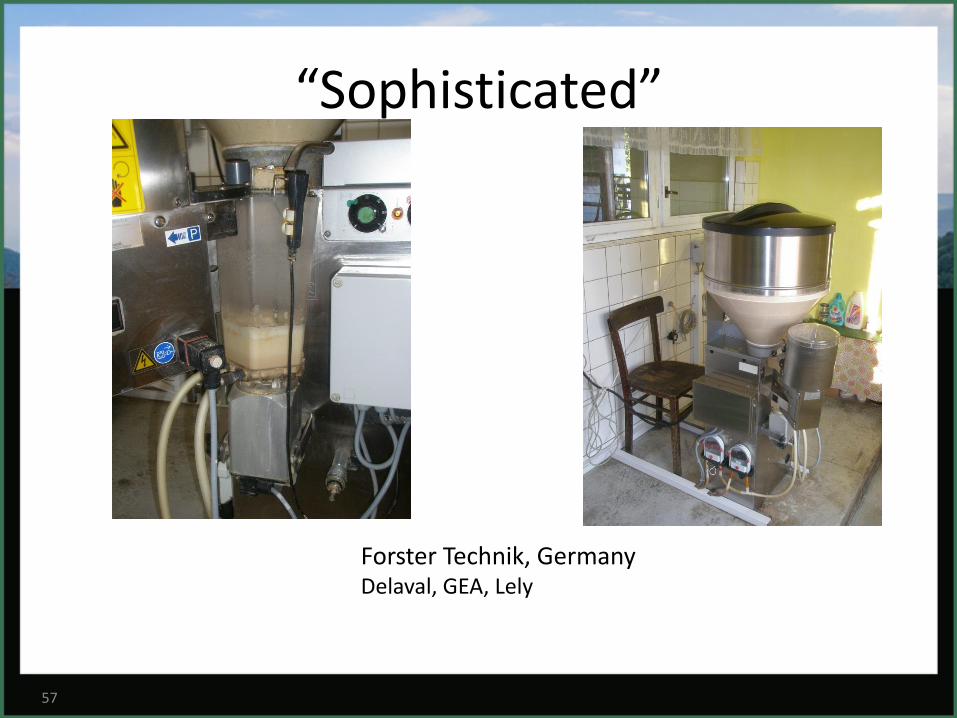
“Sophisticated”
57
Forster Technik, Germany Delaval, GEA, Lely

Behavior of calves when managed in groups
• Early life social adaptation
– Calves raised in pairs and less post weaning “slump” problems – Chua et al (2001)
• Cross sucking
– Calves raised on nipple buckets had lower incidence than those raised on open buckets – Jensen (2002)
– Less problem with autofeeders as compared to mob feeders

Age at introduction to group
• Day 6 compared to Day 14?
– More restless 1st day after introduction - Rasmussen et al, 2006)
– Needed more guidance to feeder
(Jensen, 2008)
• 50% less risk of respiratory disease if wait to 14 d
(Svensson and Liberg, 2006)
59
Photo – Jensen - 2009

Important concepts of group feeding.
Calves per feed station Calves per feed station
60
More calves / feeder = More competition More calves = increased
Rate of intake
Jensen, 2004

Calves per feeder?
• Manufacturers recommend 20 – 25 per station
• Most herds we surveyed had less than 20/feeder
• Difference in two systems.
61
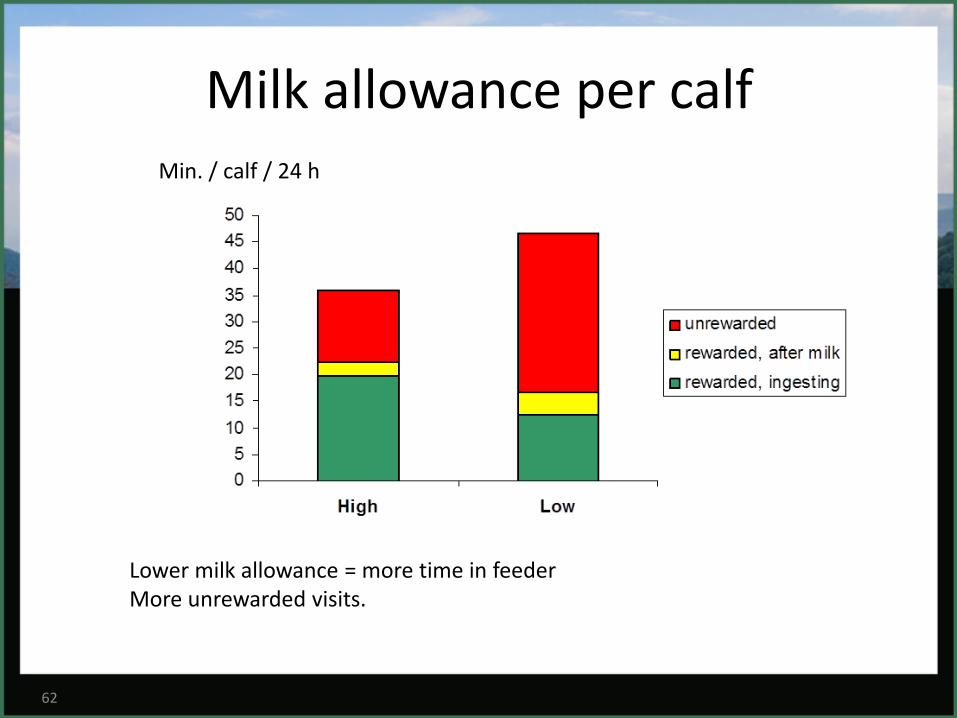
Milk allowance per calf
62
Lower milk allowance = more time in feeder More unrewarded visits.
Min. / calf / 24 h

Milk portions per day.
63
• More portions/ day = more occupation after feeding • Limits cross sucking • Depends on stocking rate and total fed. (Jensen, 2004)
Min. / calf / 24 h

Feeding waste milk and milk replacer
• Challenges
– Managing the pasteurizer – timing
• Milking fresh and hospital cows
• Pasteurize
• Cool
• Deliver to the autofeeder
• Monitor pasteurizer function
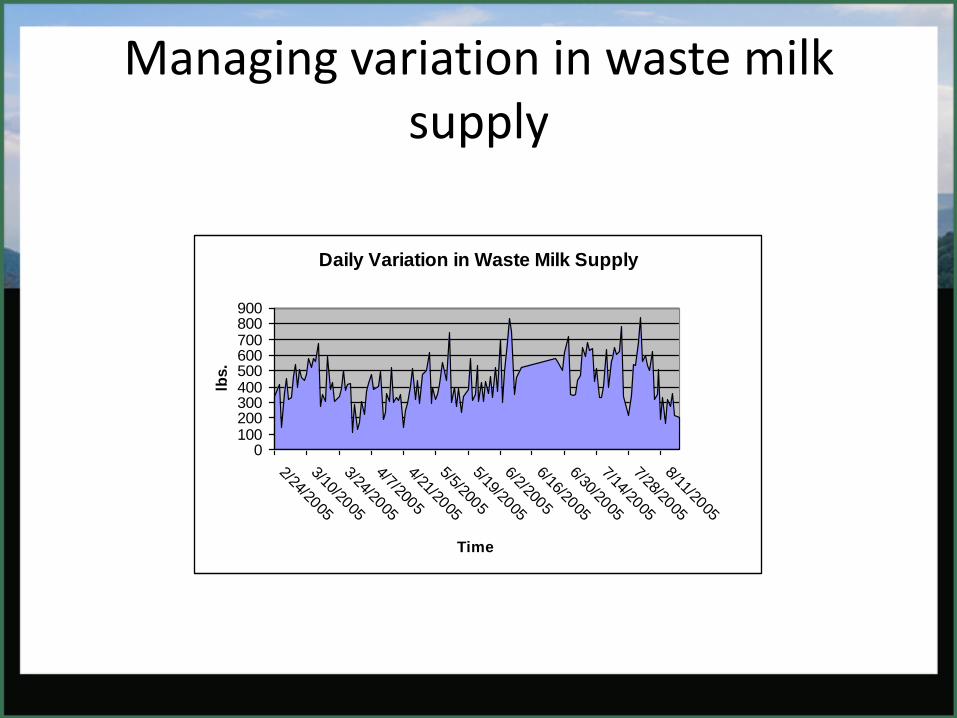
Managing variation in waste milk supply
Daily Variation in Waste Milk Supply
0100200300400500600700800900
2/24/2005
3/10/2005
3/24/2005
4/7/2005
4/21/2005
5/5/2005
5/19/2005
6/2/2005
6/16/2005
6/30/2005
7/14/2005
7/28/2005
8/11/2005
Time
lbs.
Virginia Tech Research Machado and James, 2012
• 10 dairies in VA and NC identified with feeders.
– Survey of management
– Measure: Temperature, SPC, Brix refractometer to estimate solids.
– 6 farms visited monthly between June and September
66
Management practices
• Age when started on autofeeder – 2 – 14 days
• Training calves to feeder
• Milk replacer used – 20:20 – 28:20
• All milk
• Milk replacers with some milk proteins replaced with modified soy flour, soy protein concentrate….
67

Dairy Herd size Management strategy
Feeder type # calves/ feeder Milk replacer
1 280 Technology Sophisticated 20 25:20
2 400 Technology Basic 16-21 24:18
3 3,100 Additional method Basic 20 20:20
4 900 Additional method Basic 15-19 22:18
5 220 Labor Sophisticated 12-35 20:20
6 250 Labor Basic 11-20 28:20
7 190 Labor Basic 25 28:20
8 500 Feeding rates Sophisticated 25 20:20
9 1,300 Feeding rates Basic 17 22:20
10 125 n/a Basic 20 20:20

Management strategies
• Technological advancement: purchased feeders more than 2 years ago and have made technological advancements in other areas on the dairy
• Additional method: fed calves individually but used the autofeeders as alternative method of feeding an abundant number of calves which exceeded current individual housing facilities
Management strategies
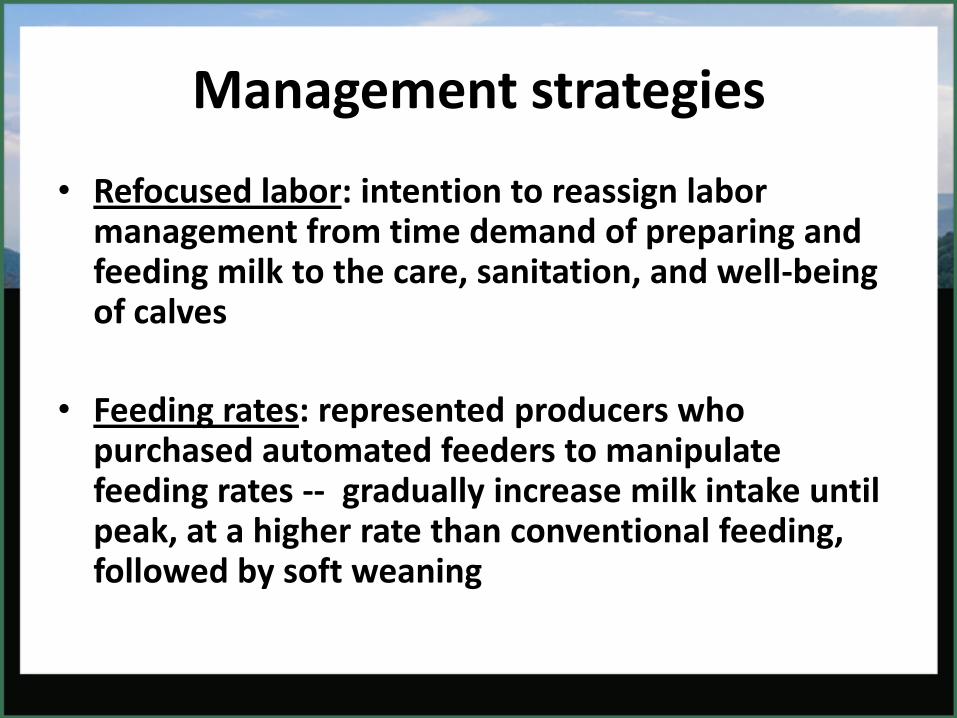
• Refocused labor: intention to reassign labor management from time demand of preparing and feeding milk to the care, sanitation, and well-being of calves
• Feeding rates: represented producers who purchased automated feeders to manipulate feeding rates -- gradually increase milk intake until peak, at a higher rate than conventional feeding, followed by soft weaning

Data collection – Duplicate milk replacer samples at the time of the
survey
– Sanitation of the autofeeder (SPC)
– Temperature of the milk replacer liquid
– Refractometer to estimate solids?????
Brix refractometer can monitor changes within feed type

Mean standard plate count (105), temperature (°C), and refractometer (Brix) reading by machine type
Machine type Variable N Mean SD Minimum Maximum
Basic SPC 89 69.25 73.71 0.00 500.00
Brix 35 12.00 2.10 7.00 18.00
Temperature 31 38.8 6.72 87 118
Sophisticated SPC 44 13.39 22.03 0.00 88.00
Brix 15 10.37 1.68 7.00 13.00
Temperature 14 38.5 6.76 81 107
**note: Brix refractometer reads 2% less than total solids??

Category Variable N Mean SD
Minimum Maximum
Technology SPC 18 25.94 17.04 0.00 67.00
Brix 5 10.10 2.84 7.00 12.50
Temperature 4 37.2 4.77 93 103
Additional calves SPC 18 63.17 45.42 8.00 181.00
Brix 8 10.31 1.22 9.00 13.00
Temperature 7 39.2 5.62 95 110
Refocused labor SPC 12 8.33 16.96 0.00 54.00
Brix 5 12.00 1.97 9.50 14.00
Temperature 3 39.0 2.80 99 104
Feeding rates SPC 77 48.66 44.30 0.00 187.00
Brix 30 11.88 2.09 7.00 18.00
Temperature 29 39.3 6.64 87 118

• There is no goal for SPC for milk replacer. – Bacteria should be less than 20,000 cfu/ml in pasteurized
waste milk
• These averages were all well over 100,000 cfu/ml
• Calf liquid diets should be fed at a range of 100-105°C
• Averages were within feeding guidelines >> the minimum (81°F) and maximums (118C) indicated a lack of accuracy in several systems – These temperature extremes could cause cold stress or
decrease milk intake. MR doesn’t dissolve well at lower temperatures.

Summary
• Of the autofeeders studied, Biotic (basic) more than Förester-Technik (sophisticated) machines, appear to require greater attention and maintenance
• Producers with the assumption that calves can be fed and left alone were not satisfied with the autofeeder – additional method

Credits –
• Kayla Machado • Cooperating dairies
Land O Lakes Animal Milk
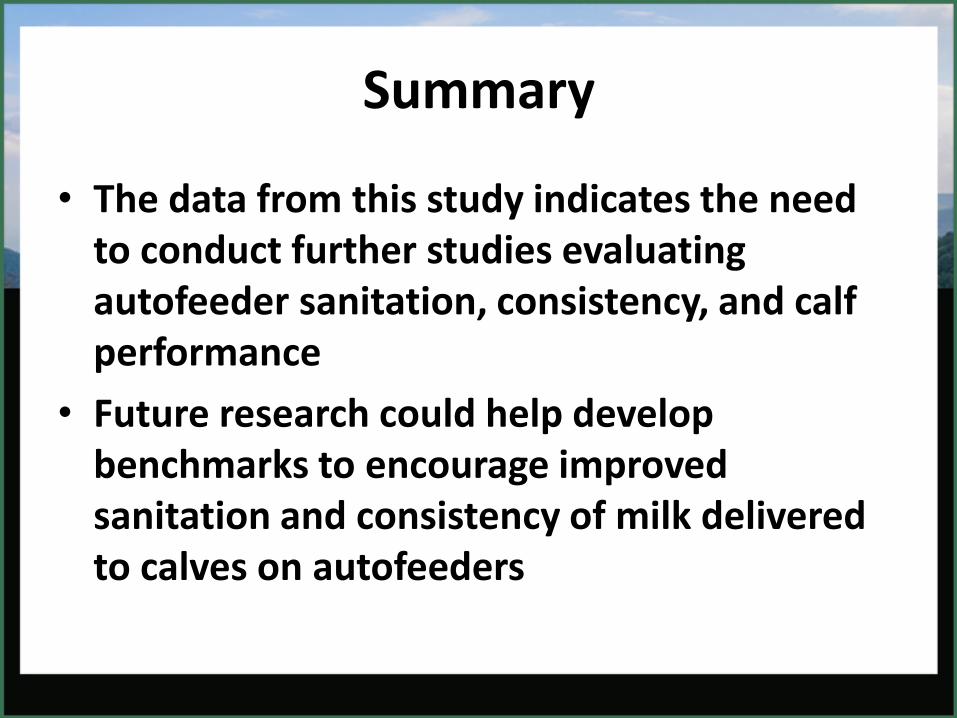
Summary
• The data from this study indicates the need to conduct further studies evaluating autofeeder sanitation, consistency, and calf performance
• Future research could help develop benchmarks to encourage improved sanitation and consistency of milk delivered to calves on autofeeders
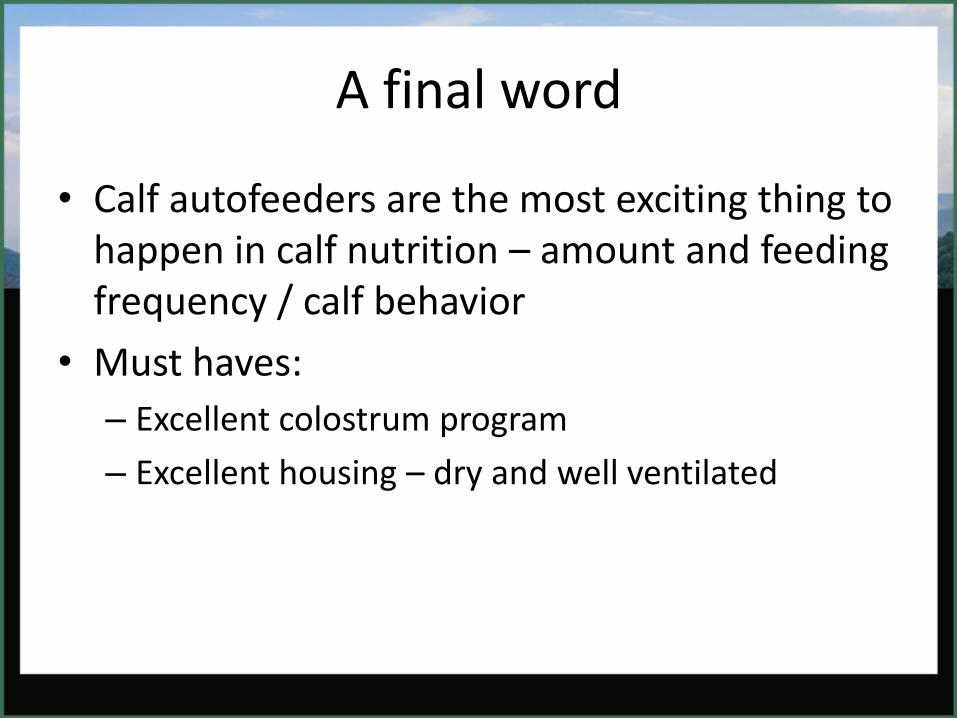
A final word
• Calf autofeeders are the most exciting thing to happen in calf nutrition – amount and feeding frequency / calf behavior
• Must haves:
– Excellent colostrum program
– Excellent housing – dry and well ventilated

A final word
• Critical – Initial health status
– Stocking density
– All in and all out vs. continually adding calves. • Compromise
• People skills must be different – Routines
• Machine monitoring
• Calf monitoring