ARIN Board of Trustees Report Vint Cerf Chair, ARIN Board of Trustees

Board of Trustees Meeting Agenda
January 13, 2020 6:00p.m. Location: Community Meeting Room
Library Board members, please bring your e-meeting packet with you! Please notify Library Board President Mike English or Lara Lorenzi [email protected], by Monday morning if you are unable
to attend the meeting. The meeting will be chaired by Mike English.
Mission: to provide access to information and services that address the educational, cultural and recreational needs of the community the library serves
I. Call to order, roll II. Public welcome – All general public comments limited to 5 minutes III. Consent Agenda 2 minutes
a. Minutes b. Director’s Report c. Youth Services Report d. Adult Services Report e. Development Report f. Circulation Report g. Statistics h. Financials
IV. New Business - Discussion Items a. Insurance Coverage info- Lara Lorenzi 10 minutes b. One time funding increase for materials CC- Lara Lorenzi 10 minutes c. Meeting day/dates for 2020-2021-discuss the
Possibility of changing days- Lara Lorenzi 10 minutes d. Trustee Openings- Announcement/Process- Lara Lorenzi 5 minutes e. PA Library Association- Director’s Institute- Lara Lorenzi 5 minutes f. Other new business 5 minutes
V. Old Business – Discussion Items a. Other old business? 5 minutes
VI. Public Comments on Meeting – Limit 3 minutes per person VII. Executive Session Move to Executive Session – to meet with an attorney or other professional advisor to discuss agency business, which, if discussed in public, would lead to the disclosure of information protected by law.
VIII. Next meeting Monday February 10, 2020 – /Adjournment


1 | P a g e
Director’s Report submitted by: Lara Lorenzi January 2020 Library Board of Trustees Meeting Informational Updates:
• The library will be closed on Monday January 20, 2020 for Martin Luther King Jr. Day. • The PASD budget meetings are as follows:
Thursday 1/23 at 6pm Thursday 2/20 Budget Town Hall 6pm Monday 3/9 at 6pm Wednesday 3/25 at 6pm Monday 4/13 at 6pm (proposed final budget ad approval) Monday 5/4 at 6pm
• Currently PASD Board workshop and PASD Board meetings will be held on Monday evenings. This is be a discussion item on our agenda. The full PASD meeting calendar is provided in our board packet.
• I have been gathering full time salary information as requested by our president. This way we will have information to make comparison with our current full time salaries and theirs. We will be able to work on a compensation plan going forward for these individuals. The specific information I received was from the following member libraries: CCL, Easttown and Tredyffrin.
• I have been gathering information regarding healthcare costs. I will give a preliminary presentation at the board meeting. I am also waiting on information from an insurance broker and will reach out to a few others as well.
Personnel Updates: Facilities Update:
• Routine maintenance has been performed by PASD. • Currently still on-going. Some of the lights in the children’s library are being replaced with brighter LED lights. This is
project has been in the works for some time and we are excited to see the lights getting swapped out. The lower level is quite dark and the new lighting really brightens up the space.
• We continue to have elevator problems. PASD is very aware of the issue and the elevator repair company has been out many times this past month trying to fix the issues. This is an on-going concern. Currently the elevator is working fine again but we are anticipating the possibility of more issues.
• We have a leak that is being looked into by PASD. A skylight on the upper level is leaking and it has damaged the paint and the wall board. Hopefully it will be an easy leak to fix. PASD will be out to check on it to see what needs to be done.
Statistical updates: Door Count:
• Door Count YTD: o July 2016 –June 2017: 112,448 o July 2017-June 2018: 130,553 o July 2018- June 2019: 124,294 o July 2018-December 2018: 64,371 o July 2019-December 2019: 67,265
This is a 4% increase over the same period last year. • Door Count Current month:

2 | P a g e
• October o October 2018: 11,024 o October 2019: 11,377
This is a 3% increase over last year. • November
o November 2018: 9,467 o November 2019: 10,007
This is a 6% increase over last year. • December
o December 2018: 7,685 o December 2019: 8,222
This is a 7 % increase over last year. E-Material Circulation: (Circulation calculated by patron’s home library.)
• October o E-book: 2,327 o Audio: 1,787 o Total: 4,114
• November o E-books: 2,242 o Audio: 1,644 o Total: 3,886
• December o E-Book: 2,377 o Audio: 1,738 o Total: 4,115
Chester County Library System Updates:
• The Chester County Commissioners have approved $100,000 to be distributed to the CCLS member libraries for the sole purpose of purchasing more materials (traditional or electronic). We will be receiving an additional $9,436.91 for this purpose. We will need to report the expenditures much like a restricted donation/grant. This is a one-time grant funds and they will not add to the collection maintenance standards. I have included the full document in the board packet for your review. This is very exciting and we are very grateful to the Funding Task Force for spearheading this initiative. We are in the process of sending a thank you to the county commissioners.
Computer updates:
• The next joint SAC/DLM meeting will take place on Tuesday January 14th. A lite dinner will be served at 5:30 and the meeting will begin promptly at 6pm. The meeting will be held at the Chester County Library Exton. I will be attending the meeting along with our board representative Kim Moretti.
• The password for the trustee website has changed- it is now: Library2020! State Updates: None at this time. Meetings Attended: Date Meeting/Outreach/Training 12/10 Chamber Brunch Monthly meeting with Mark Pinto 12/11 HUB meeting at PASD Staff Appreciation Dinner 12/12 Weekly meeting with Mike English Rotary 12/17 Monthly meeting with Rebecca Krause

3 | P a g e
12/20 ½ Sick- ½ Personal day 12/23 Vacation 12/24 &12/25 Library Closed 12/26, 27 & 30 Vacation 12/31 & 1/1 Library Closed 1/2 Meeting with Chris Porcelli- Funding calendar/tasks 1/7 Meeting with Chris Porcelli- Donor info. and Marketing/Fundraising 2020-2021 Plan Weekly meeting with Mike English 1/8 HUB meeting at PASD Admin. Building Meeting with Chris Porcelli- Novel Lunch 1/9 Rotary meeting at Manor of Hope
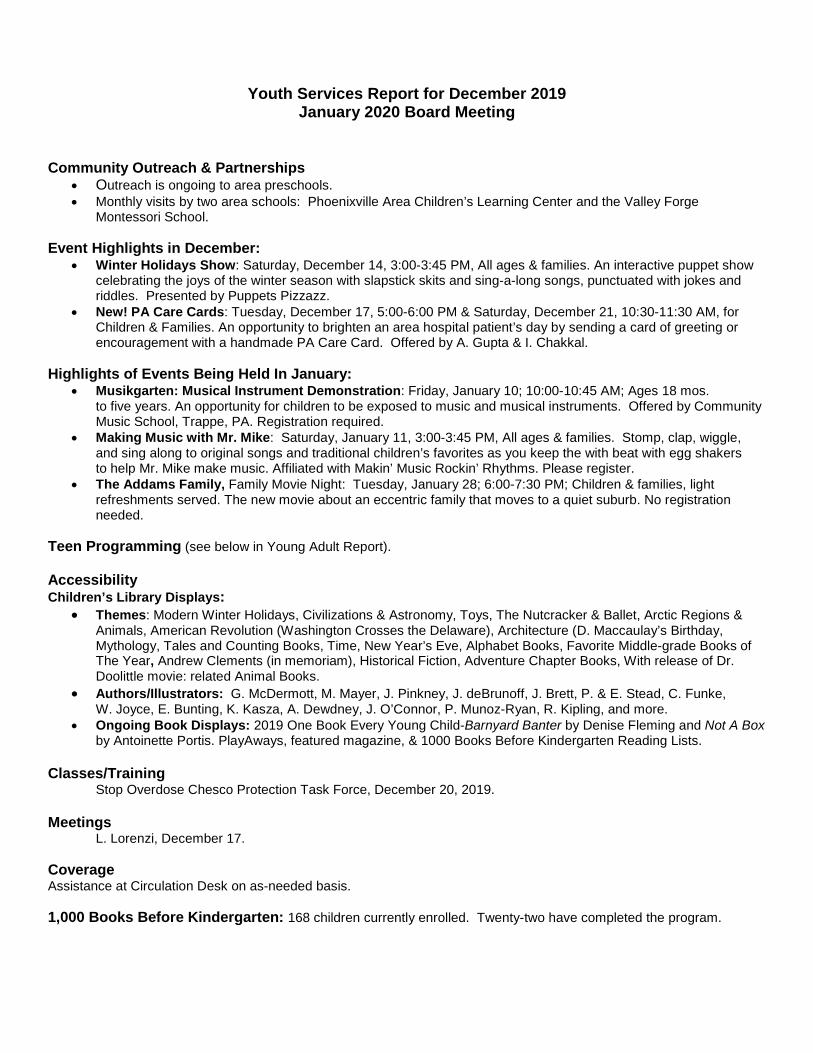
Youth Services Report for December 2019 January 2020 Board Meeting
Community Outreach & Partnerships
• Outreach is ongoing to area preschools. • Monthly visits by two area schools: Phoenixville Area Children’s Learning Center and the Valley Forge
Montessori School. Event Highlights in December:
• Winter Holidays Show: Saturday, December 14, 3:00-3:45 PM, All ages & families. An interactive puppet show celebrating the joys of the winter season with slapstick skits and sing-a-long songs, punctuated with jokes and riddles. Presented by Puppets Pizzazz.
• New! PA Care Cards: Tuesday, December 17, 5:00-6:00 PM & Saturday, December 21, 10:30-11:30 AM, for Children & Families. An opportunity to brighten an area hospital patient’s day by sending a card of greeting or encouragement with a handmade PA Care Card. Offered by A. Gupta & I. Chakkal.
Highlights of Events Being Held In January:
• Musikgarten: Musical Instrument Demonstration: Friday, January 10; 10:00-10:45 AM; Ages 18 mos. to five years. An opportunity for children to be exposed to music and musical instruments. Offered by Community Music School, Trappe, PA. Registration required.
• Making Music with Mr. Mike: Saturday, January 11, 3:00-3:45 PM, All ages & families. Stomp, clap, wiggle, and sing along to original songs and traditional children’s favorites as you keep the with beat with egg shakers to help Mr. Mike make music. Affiliated with Makin’ Music Rockin’ Rhythms. Please register.
• The Addams Family, Family Movie Night: Tuesday, January 28; 6:00-7:30 PM; Children & families, light refreshments served. The new movie about an eccentric family that moves to a quiet suburb. No registration needed.
Teen Programming (see below in Young Adult Report). Accessibility Children’s Library Displays:
• Themes: Modern Winter Holidays, Civilizations & Astronomy, Toys, The Nutcracker & Ballet, Arctic Regions & Animals, American Revolution (Washington Crosses the Delaware), Architecture (D. Maccaulay’s Birthday, Mythology, Tales and Counting Books, Time, New Year’s Eve, Alphabet Books, Favorite Middle-grade Books of The Year, Andrew Clements (in memoriam), Historical Fiction, Adventure Chapter Books, With release of Dr. Doolittle movie: related Animal Books.
• Authors/Illustrators: G. McDermott, M. Mayer, J. Pinkney, J. deBrunoff, J. Brett, P. & E. Stead, C. Funke, W. Joyce, E. Bunting, K. Kasza, A. Dewdney, J. O’Connor, P. Munoz-Ryan, R. Kipling, and more.
• Ongoing Book Displays: 2019 One Book Every Young Child-Barnyard Banter by Denise Fleming and Not A Box by Antoinette Portis. PlayAways, featured magazine, & 1000 Books Before Kindergarten Reading Lists.
Classes/Training Stop Overdose Chesco Protection Task Force, December 20, 2019. Meetings
L. Lorenzi, December 17.
Coverage Assistance at Circulation Desk on as-needed basis. 1,000 Books Before Kindergarten: 168 children currently enrolled. Twenty-two have completed the program.

Monthly Statistics (Overall totals): Programs/Activities/Visits Attendance/Individuals Preschool Programs 1-2-3 Learn With Me 5 133 Children/Adults 4-5-6 Active Beehive 3 82 Children/Adults Preschool Yoga 2 63 Children/Adults Happy Feet Music Class 1 13 Children/Adults Little Sprouts Nature Class 1 23 Children/Adults Preschool-Other 17 423 Children/Adults PACLC-in-house outreach 1 30 Children/Adults Outreach 6 153 Children/Adults School Age Programs PA Care Cards 1 5 Children/Adults/Young adults(2) Mixed Ages Puppets Pizzazz: Winter Holidays Show 1 54 Children/Adults (inc. 2 Young Adults) Subtotal –Regular Children’s Sessions 38 979 Children/Adults/Young Adults Young Adult-R.Livsey Dungeons & Dragons 4 3 Young Adults Subtotal of Young Adults 4 3 Young Adults/Adults Subtotal of All Programs 42 982 Children/Young Adults/Adults Visiting Groups without a Program Subtotal of Visiting Groups Total Programs/Events 42 982 Children/Young Adults/Adults Computer Usage Statistics for December 2019: Internet Stations-Individual Usage:
• Children’s: 84 sessions (This number is unusually low, but no way to verify otherwise.) Total Children’s users: 84. • Young Adult: 53 desktop users, plus three laptop sessions. Total Young Adult users: 56
AWE Literacy Station: 464 sessions, 218 hours, 28-minute average session.
December 2019
Youth Adult Report
Program Overview Continuing weekly programming for the Youth Services Department Library Displays
• Created flyer for the January Movie Matinee • Creating flyer for Teen Paint Night in March • Decorated the downstairs bulletin board with a snow theme • Decorated the Community Room with a holiday theme • Updated the door going into the Young Adult Room with flyers for upcoming events
Coverage Coverage at Circulation Desk: on as-needed basis.
Monthly Statistic
Programs/Activities Attendance Dungeons & Dragons (4) 3 young adults Total Programs (4) 3 young adults
Other Activities/ Programs
• Provided the Young Adult Room with a passive activity of winter themed coloring pages • Attended Chesco’s StopOD training – December 20th
Webinars Attended
• YA-Y! The Latest Reads for Teens – December 3rd • Reaching New Heights: Winter/Spring Titles for Young Readers – December 4th • The Future Ready Librarian® Fireside Chat Let’s talk innovation, literacy, equitable digital access and more! – December
12th
Other Planning • Planning a Lego day for the kids of all ages when they are off of school for conferences February 13th. • Looking into planning a horror teen program with a fellow co-worker that would happen once a month. • Furthermore, looking at starting a guessing game with the young adults during the winter. • Also in the works, Christine and I are thinking of things young adults can do for National Honor Society volunteer hours with
the potential for kids to “adopt” an area of the library to care for.

December 2019 Adult Services Report
Regular Activities • Work weekly passport application acceptance shifts and schedule appointments. • Performed 4 notary acts. • Proctored 4 exams. Meetings/Workshops/Other Events Attended • Monthly meeting with Lara 12/10. • Opioid overdose workshop at Library 12/20.
Upcoming Special Programs/Events • “Redner’s Supermarket Nutrition Tour” at Phoenixville Redner’s Warehouse Market
with Meredith McGrath, Redner’s Corporate Dietician 1/14. • “After Brandywine/Daily Life of a Revolutionary War Soldier” with John Ebenreiter &
Walter Hook 1/16. • “Facebook 101” with Christine Tarlecki 1/18. • “Social Security Planning” with Mike Polin, Premier Planning Group 1/21 & 1/23. • “Real ID in PA: Who Needs It and Why” with staff of State Rep. Melissa Shusterman &
Scott John of PennDOT 1/24 & 1/28. • “Create a Valentine’s Day Glass” with Laura Grablutz 1/25. • Local Author Book Talk: Adrianne Delgado: Nourish, Eat, Repeat 1/27. • “First-Time Home Buyer Workshop” with Donna Cable, Re/Max Professional Realty &
Kimberly Kozelsky, First Choice Loan Services 1/30. • “Blogging 101” with Christine Tarlecki 2/1. • “Sick Presidents” with Robert Smith 2/3. • “The ABCs of LGBT” with Rebekah Foster 2/4. • “Chocolate Tasting Program” with Gail Warner, Bridge Street Chocolates 2/6. • Local Author Book Talk: June McInerney: Miss Elmira’s Secret Treasure 2/10.
Program/Event/Other Planning • Scheduling special programs for April and beyond. • Planning to offer monthly “Cookbook Club” starting in February. • Partnering with Census Bureau to disseminate information to alleviate undercounting.
December Passport Application Acceptance Statistics
Appointments 237 Income $11,350
vs. November
Appointments 196 Income $6,795
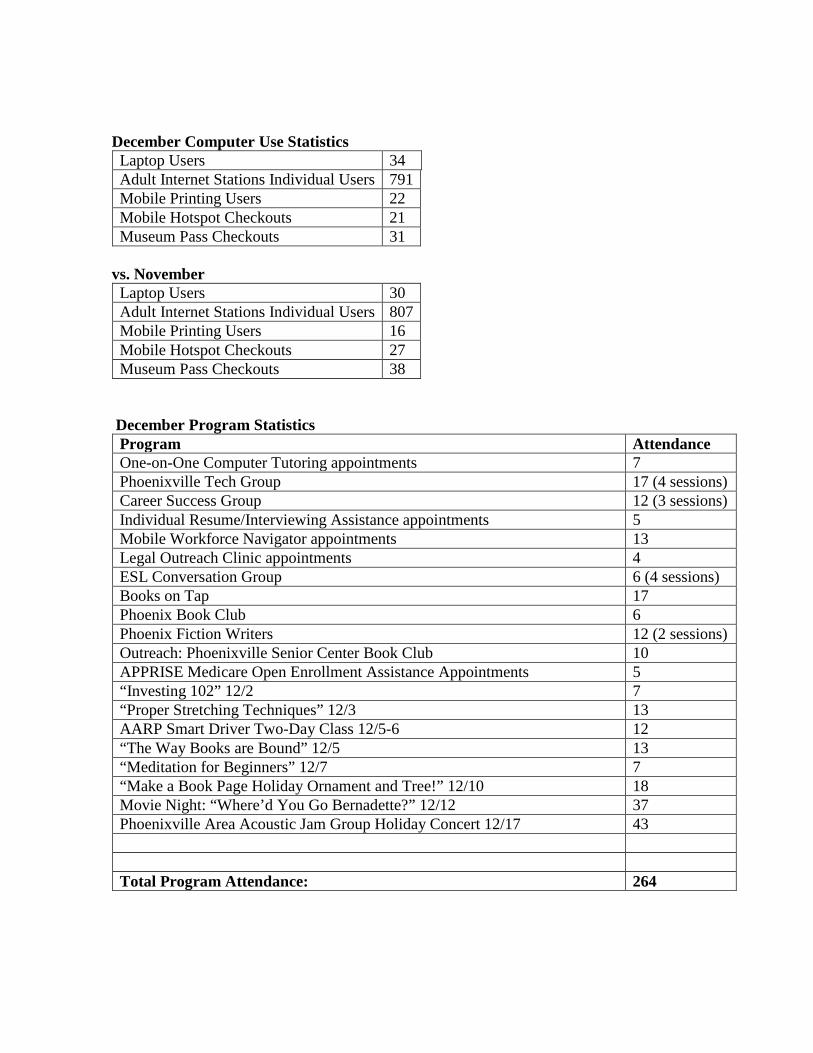
December Computer Use Statistics
Laptop Users 34 Adult Internet Stations Individual Users 791 Mobile Printing Users 22 Mobile Hotspot Checkouts 21 Museum Pass Checkouts 31
vs. November
Laptop Users 30 Adult Internet Stations Individual Users 807 Mobile Printing Users 16 Mobile Hotspot Checkouts 27 Museum Pass Checkouts 38
December Program Statistics
Program Attendance One-on-One Computer Tutoring appointments 7 Phoenixville Tech Group 17 (4 sessions) Career Success Group 12 (3 sessions) Individual Resume/Interviewing Assistance appointments 5 Mobile Workforce Navigator appointments 13 Legal Outreach Clinic appointments 4 ESL Conversation Group 6 (4 sessions) Books on Tap 17 Phoenix Book Club 6 Phoenix Fiction Writers 12 (2 sessions) Outreach: Phoenixville Senior Center Book Club 10 APPRISE Medicare Open Enrollment Assistance Appointments 5 “Investing 102” 12/2 7 “Proper Stretching Techniques” 12/3 13 AARP Smart Driver Two-Day Class 12/5-6 12 “The Way Books are Bound” 12/5 13 “Meditation for Beginners” 12/7 7 “Make a Book Page Holiday Ornament and Tree!” 12/10 18 Movie Night: “Where’d You Go Bernadette?” 12/12 37 Phoenixville Area Acoustic Jam Group Holiday Concert 12/17 43 Total Program Attendance: 264

Respectfully submitted, Mark Pinto Adult Services Director
www.phoenixvillelibrary.org | 183 Second Avenue | Phoenixville, PA 19460 | 610-933-3013
Discover Your Community
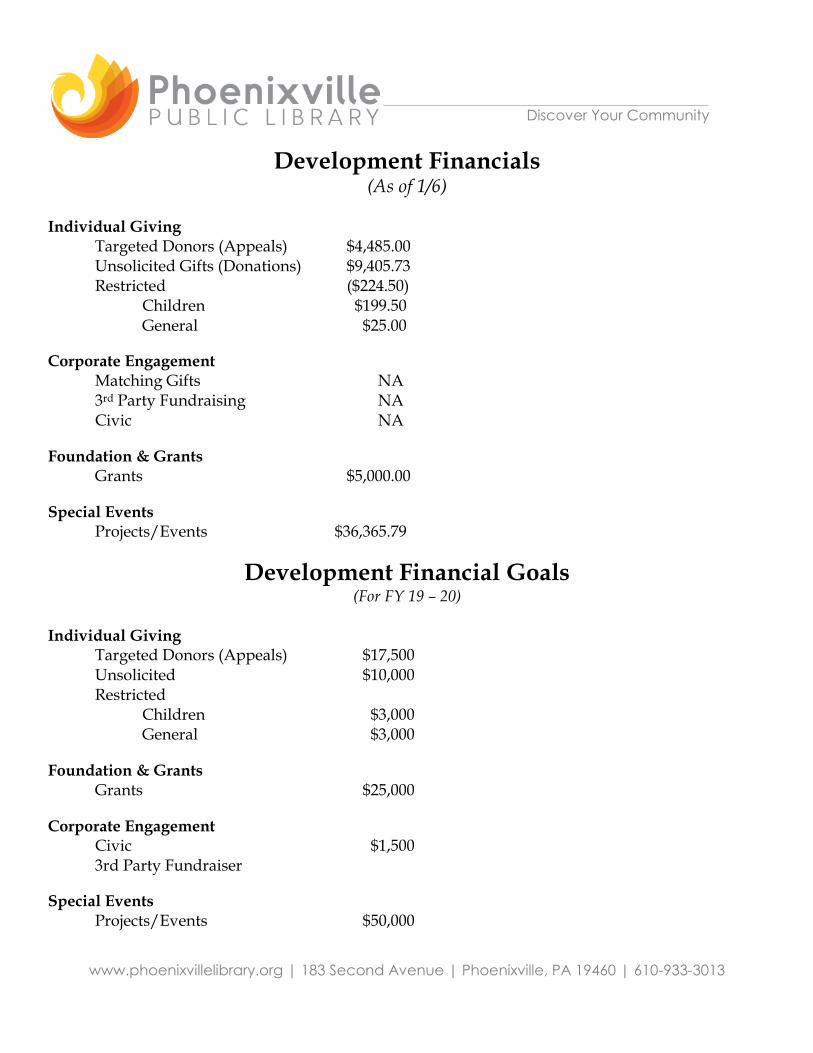
Development Financials (As of 1/6)
Individual Giving
Targeted Donors (Appeals) $4,485.00 Unsolicited Gifts (Donations) $9,405.73 Restricted ($224.50)
Children $199.50 General $25.00
Corporate Engagement Matching Gifts NA 3rd Party Fundraising NA Civic NA
Foundation & Grants Grants $5,000.00
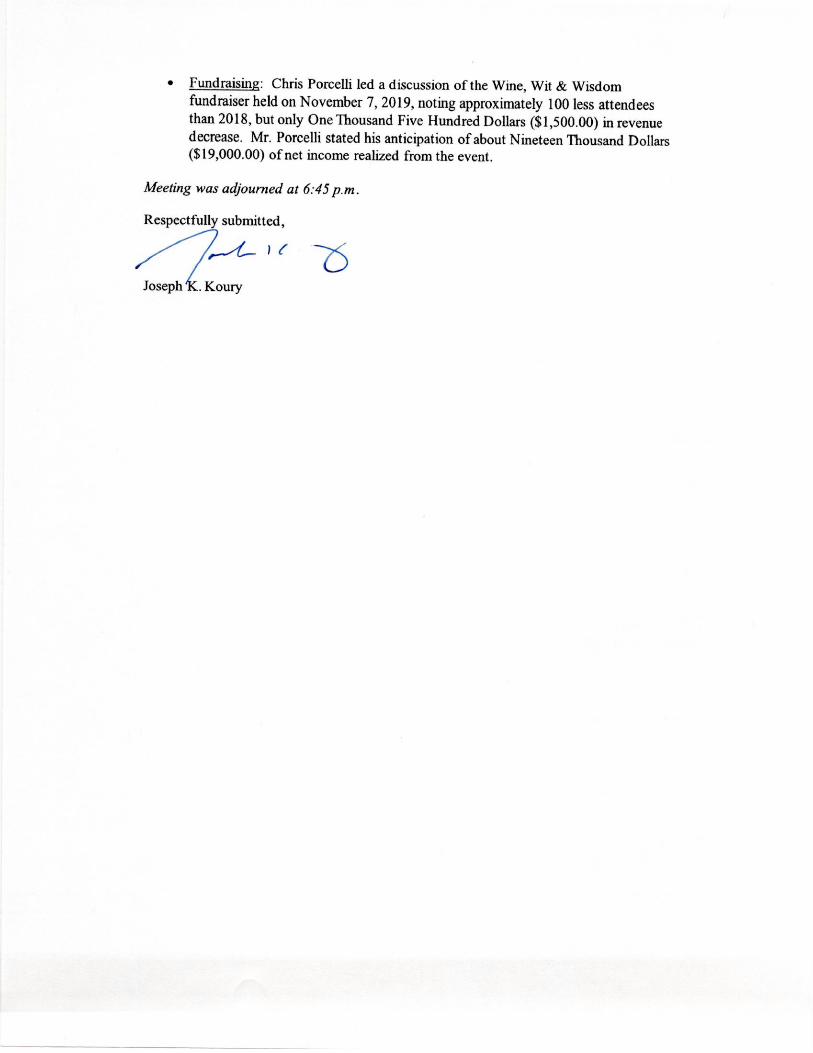
Special Events Projects/Events $36,365.79
Development Financial Goals (For FY 19 – 20)
Individual Giving Targeted Donors (Appeals) $17,500 Unsolicited $10,000
Restricted Children $3,000 General $3,000
Foundation & Grants Grants $25,000
Corporate Engagement Civic $1,500 3rd Party Fundraiser
Special Events Projects/Events $50,000

www.phoenixvillelibrary.org | 183 Second Avenue | Phoenixville, PA 19460 | 610-933-3013
Discover Your Community
Development Report Cont. Grants / Corporate Engagement
Phoenixville Public Hospital - $5,000 (Pending) o Partnership – health literacy programming
Giant – December Bags 4 My Cause Program - $71 Annual Report
Attached End of calendar year - Annual Giving Summary
Pending - finalizing numbers Meetings
Michael English & Stephanie Allen
Kit - Towne Book Center
Chamber Brunch
Rotary – Gene Krack
Colonial Theatre – Ken Metzner, Michal Kortsarts, Lara Lorenzi, Rebecca Krause
Give Smart - Allison Kurtz
Columbia Station – KT Mallory
Kimberton Conference Center – Caitlin MacLelland
Susan Graham – Phoenixville Public Hospital
www.phoenixvillelibrary.org | 183 Second Avenue | Phoenixville, PA 19460 | 610-933-3013
Discover Your Community
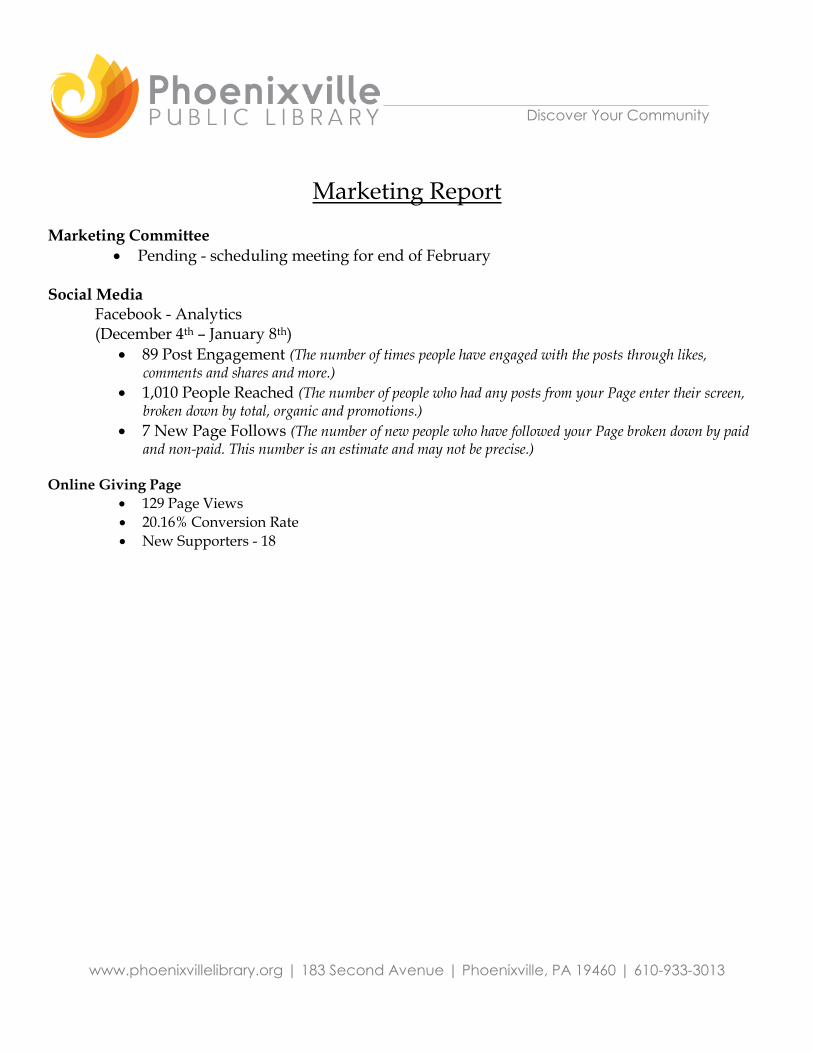
Marketing Report
Marketing Committee
Pending - scheduling meeting for end of February Social Media
Facebook - Analytics (December 4th – January 8th)
89 Post Engagement (The number of times people have engaged with the posts through likes, comments and shares and more.)
1,010 People Reached (The number of people who had any posts from your Page enter their screen, broken down by total, organic and promotions.)
7 New Page Follows (The number of new people who have followed your Page broken down by paid and non-paid. This number is an estimate and may not be precise.)
Online Giving Page
129 Page Views
20.16% Conversion Rate
New Supporters - 18

Circulation Report for January 2020
Volunteers:
o Year-to-Date Total Hours of Volunteering: 904.5 o Total Hours of Volunteering for December: 136.2
Library Card Sign-ups for October: o Total Amount of Patron Applications for December: 72
- Online Applications Total: 16 Circulation Staff Continuing Education:
o Chesco StopOD – December 20th o The Positions Model for Improving Personal Influence and Workplace Interactions Webinar – January 7th (I am
attending). Meetings:
o Meeting with Lara – December 19th o Circulation Meeting – January 15th o Meeting with Lara – January 21st
Circulation Staff:
o A lot of staff attended the Staff Holiday party on December 11th. I was told by multiple staff that they had a great time at the party.
Additional Updates:
o Attending ALA’s Midwinter Meeting Exhibits – January 27th Respectfully Submitted, Christine Nicholson Circulation Manager & Volunteer Coordinator December 2019

Jan Feb March April May June July Aug Sept Oct Nov Dec
2017 262,035 245,750 288,969 259,935 259,816 312,658 335,336 313,923 257,492 260,067 248,305 215,355
2018 247,701 239,217 273,700 252,754 244,343 298,119 333,834 302,813 250,078 251,841 235,589 212,096
2019 254,735 239,468 259,202 244,767 234,245 283,551 328,561 288,000 240,818 246,938 231,751 212,762
-
50,000
100,000
150,000
200,000
250,000
300,000
350,000
400,000
Sierra Circulation 2017, 2018 and 2019
2017 2018 2019
Jan Feb March April May June July Aug Sept Oct Nov Dec
2017 32,777 30,353 33,156 31,076 32,658 32,324 38,404 37,984 33,221 34,445 32,742 34,374
2018 39,517 35,554 40,880 39,606 41,221 43,825 49,446 49,190 44,838 46,512 44,617 45,459
2019 52,474 48,270 52,779 50,521 52,922 55,778 59,442 58,194 53,763 54,197 51,585 54,681
- 20,000 40,000 60,000 80,000
OverDrive Circulation 2017, 2018 and 2019
2017 2018 2019
Jan Feb March April May June July Aug Sept Oct Nov Dec
2017 294,812 276,103 322,125 291,011 292,474 344,982 373,740 351,907 290,713 294,512 281,047 249,729
2018 287,218 274,771 314,580 292,360 285,564 341,944 383,280 352,003 294,916 298,353 280,206 257,555
2019 307,209 287,738 311,981 295,288 287,167 339,329 388,003 346,194 294,581 301,135 283,336 267,443
0100,000200,000300,000400,000500,000
Circulation 2017, 2018 and 2019
2017 2018 2019

1
2
3
4
5
6
7
8
9
10
11
12
13
20
21
24
25
26
27
28
29
30
31
32
33
34
35
36
37
38
39
40
41
42
43
44
45
46
47
48
49
50
51
52
53
54
55
56
57
58
59
A B C D E F G H I J K L M N O U
Circulation Comparisons 2019 January February March April May June July August September October November December Total
ATGLEN 2015 2202 1966 2136 1933 1826 2453 3218 2255 1760 2031 2328 2021 26129 -6.54%
2016 1732 1851 2085 1748 1801 3004 2865 2632 2145 2488 2402 1970 26723 2.27%
2017 1979 2014 2652 2418 2463 2919 3064 2692 2289 2058 2040 1711 28299 5.90%
2018 2282 2322 2412 2312 2196 3385 3595 2825 2046 2451 2294 2127 30247 6.88%
2019 2846 2239 2568 2454 2372 2789 3065 2599 2160 2150 2642 2015 29899 -1.15%
AVON GROVE 2015 11938 11595 12376 12101 11269 14689 17630 15641 13017 12482 11510 10358 154606 -4.01%
2016 11230 12395 12620 12241 11840 14923 16493 15707 12466 11651 10901 9955 152422 -1.41%
2017 10090 9617 11285 10205 10693 13708 15089 13925 11352 11106 10354 8281 135705 -10.97%
2018 9921 10844 11813 10590 10220 13313 16106 14095 11408 11291 10014 8830 138445 2.02%
2019 11857 11207 11573 11378 11424 13905 17138 14038 11252 11660 10449 9266 145147 4.84%
CCL/HANKIN 2015 144258 137057 147755 133315 127403 166006 173892 162749 137639 133545 129445 123917 1716981 -3.23%
2016 139036 137550 143223 136492 133730 161273 167029 159409 131729 129112 126027 120119 1684729 -1.88%
2017 132202 123260 144753 129706 129062 149185 160461 151917 127112 127719 122498 110904 1608779 -4.51%
2018 126699 121709 138899 127420 123573 145591 162876 149438 127242 125674 119511 111398 1580030 -1.79%
2019 131898 124255 135942 126009 123301 145315 161746 146273 126353 127487 119761 114852 1583192 0.20%
CHESTER SPRINGS 2015 2681 2513 2681 2582 2365 3085 3622 3224 2335 2338 2306 2199 31931 -6.59%
2016 2203 2567 2520 2118 2454 3116 3701 3334 2543 2664 2387 2394 32001 0.22%
2017 3173 3094 3533 3272 3242 3490 4327 4045 3317 3566 3325 2861 41245 28.89%
2018 3097 2912 3760 3388 2996 3692 4721 4088 3002 3138 2919 2867 40580 -1.61%
2019 3628 3444 3634 3328 3121 4089 5216 4611 3753 3839 3723 3232 45618 12.41%
COATESVILLE 2015 4594 4385 4631 4546 3857 5818 6893 5924 4799 4689 4411 4093 58640 -0.25%
2016 4554 5014 4918 4741 4801 6150 6503 5580 4301 4513 4051 3211 58337 -0.52%
2017 4404 4365 4803 4592 4109 5272 5309 4937 4097 4016 3645 3147 52696 -9.67%
2018 3751 3337 3769 3930 3955 5007 5175 4241 3376 3825 3343 2985 46694 -11.39%
2019 4038 3982 4098 4473 4281 5350 6520 5004 4434 4848 4141 4222 55391 18.63%
DOWNINGTOWN 2015 9472 10025 10696 9554 8847 12782 13368 11452 10507 10136 9686 8606 125131 28.67%
2016 9496 9974 10915 10121 10094 13129 13571 13106 11466 10478 9477 8661 130488 4.28%
2017 13299 12880 14607 13148 14460 17606 18102 17316 15036 15685 14082 11990 178211 36.57%
2018 12705 12259 14176 13312 13709 17203 18394 17109 14778 14552 13931 11328 173456 -2.67%
2019 14002 13202 14228 13512 13545 16894 19723 17222 14850 14598 13696 12343 177815 2.51%
EASTTOWN 2015 23032 20912 23111 21758 20543 25409 28425 25208 22525 22422 21269 20088 274702 1.12%
2016 22479 22349 23254 22167 21806 25686 25484 25373 21683 22410 20838 19285 272814 -0.69%
2017 24754 23207 27535 23889 25082 28548 31446 30112 24984 25394 23027 21465 309443 13.43%
2018 27973 24084 28349 27487 27068 30526 33781 32462 28684 28684 26673 25587 341358 10.31%
2019 30566 28729 30529 29221 29231 33377 36995 33153 29586 29798 28005 27419 366609 7.40%
HONEY BROOK 2015 5711 5693 5571 5681 4939 6948 8137 6664 5705 5756 5349 5652 71806 0.83%
2016 6287 6814 6367 6110 5635 7358 8355 7179 5674 5948 5600 5399 76726 6.85%
2017 5265 5706 5935 5705 5862 6152 6945 6306 5129 4974 5298 4607 67884 -11.52%
2018 5416 5298 6292 5851 5389 6327 7555 6122 5504 5967 5720 5420 70861 4.39%
2019 6051 6068 5853 5821 5518 6650 7552 6507 5270 5969 5802 4884 71945 1.53%

60
61
62
63
64
65
66
67
68
69
70
71
72
73
74
75
76
77
78
79
80
81
82
83
84
85
86
87
88
89
90
91
92
93
94
95
102
103
104
107
108
109
110
111
112
113
114
115
116
117
118
A B C D E F G H I J K L M N O U
January February March April May June July August September October November December Total
KENNETT 2015 15021 12842 13575 10084 12511 18526 20492 18492 14806 14467 13717 13951 178484 -0.83%
2016 13854 13535 14864 13971 13968 18430 19464 19299 14195 13873 13564 12173 181190 1.52%
2017 15918 14231 16467 15153 15184 17888 20029 19076 14579 15061 14573 13371 191530 5.71%
2018 13977 13147 15378 13999 14772 17625 20430 19251 14658 15465 14189 13277 186168 -2.80%
2019 13948 12581 14144 13752 13691 16360 20071 16926 13556 14258 13490 12777 175554 -5.70%
MALVERN 2015 10047 9063 10880 10169 10663 12303 15225 13823 10754 11185 9889 8982 132983 -1.73%
2016 8257 8723 9046 8124 7833 10528 10944 10444 8047 7906 7762 6456 104070 -21.74%
2017 6452 6243 7431 6574 6880 8467 9505 8950 7172 7416 6853 5934 87877 -15.56%
2018 6405 6096 6715 6137 6318 8353 10024 9158 6619 7166 6367 6077 85435 -2.78%
2019 6959 6470 7080 6435 6482 7957 9783 8479 6384 6491 6042 5679 84241 -1.40%
OXFORD 2015 9824 9348 10195 9688 9124 11925 14310 12610 10513 10486 9794 8561 126378 -3.62%
2016 10101 9930 10175 9071 9616 12459 12477 12216 9867 9749 9465 8234 123360 -2.39%
2017 9356 8425 9962 8779 9080 11236 12124 11406 9762 9852 9314 7820 117116 -5.06%
2018 8922 8768 9747 9779 9012 11180 12117 11964 9870 10368 9255 7781 118763 1.41%
2019 10087 8920 10355 10203 9516 10613 12359 11274 9283 9813 9103 8228 119754 0.83%
PARKESBURG 2015 5988 5524 6009 5733 4728 6015 6090 5822 5564 6153 5776 5243 68645 -4.89%
2016 5063 5352 6117 5356 4525 6188 6123 5858 5174 4711 5229 4833 64529 -6.00%
2017 4574 4094 5461 4865 4611 5523 4925 4994 4623 4995 4837 4262 57764 -10.48
2018 4365 4671 4750 5011 3994 4958 5472 5044 4194 4946 4731 4022 56158 -2.78%
2019 4805 4558 4712 4310 3442 4283 5178 4224 3946 4835 4636 4592 53521 -4.70%
PHOENIXVILLE 2015 18953 17975 20545 19512 17576 24239 26231 23933 19569 18861 18403 16380 242177 1.08%
2016 18142 17905 18874 18431 17577 22324 25259 23675 18234 17233 17936 15728 231318 -4.48%
2017 16863 15638 17989 16775 16883 20432 23422 21426 16406 16913 16482 14150 213379 -7.76
2018 16378 15456 18147 17387 17182 21454 24052 21636 17349 18362 17113 14747 219263 2.77%
2019 18264 16664 17865 17693 16611 20239 24236 21452 17445 17899 16604 15078 220050 0.36%
SPRING CITY 2015 3755 3375 3807 3751 3312 4538 5374 4223 3623 3549 3342 3131 45780 30.75%
2016 3371 3409 3770 3182 3153 4456 4443 4637 3583 3515 3166 3136 43821 -4.28%
2017 3376 2977 3149 3244 2855 4285 4370 4329 3281 3493 3062 2484 40905 -6.65
2018 2772 2887 3401 2923 3007 4212 4618 4166 3163 3102 2704 2318 39273 -3.99%
2019 2948 2858 3144 2892 3184 3971 4980 3791 2666 2734 2551 2171 37890 -3.52%
TREDYFFRIN/PAOLI 2015 28397 26554 29826 26823 26856 30768 33426 33110 27225 27733 26910 26597 344225 -1.98%
2016 29112 29095 30008 29071 28985 33163 36592 34309 29413 29917 28226 28149 366040 6.34%
2017 30829 28503 32762 30000 29348 34212 36846 34562 28763 29743 28788 26777 371133 1.39%
2018 30450 29542 33492 30027 29914 34180 37196 34597 30110 30224 29301 27796 376829 1.53%
2019 32444 30670 33220 31319 29629 32899 36563 35057 31093 31583 29979 29330 383786 1.85%
WEST CHESTER 2015 13147 12302 13483 12440 12219 16145 17986 15878 12978 13674 13108 11850 165210 0.39%
2016 12766 12923 13203 12582 12230 15853 16431 16343 12526 11858 11289 10335 158339 -4.16%
2017 12278 11849 13801 12686 12660 16059 17776 15914 12811 12521 12869 9965 161189 1.80%
2018 12105 11439 13480 12807 12309 14938 17168 15807 12913 13138 12141 10995 159240 -1.21%
2019 12868 11891 13036 12488 11819 14638 16878 15584 12550 13173 12712 11355 158992 -0.16%

119
120
121
122
123
124
125
126
127
128
129
130
131
132
133
134
135
136
137
138
139
140
141
142
143
144
145
146
147
148
A B C D E F G H I J K L M N O U
January February March April May June July August September October November December Total
System 2009 314514 316598 351000 330124 313584 393702 438914 395383 336133 332569 318368 286320 4127209
2010 325911 314476 365487 314192 307260 384072 430039 406160 330681 322851 325194 276392 4102715
2011 321538 312861 355908 319915 309108 386003 411359 405555 327730 316272 318126 287588 4071963
2012 331201 327004 351807 319127 307838 383042 421728 376945 303187 312090 312984 271283 4018236
2013 322760 310288 335590 312997 308489 366229 433261 379949 303346 316223 298777 269065 3956974
2014 303205 282462 330326 299557 296856 347702 411539 361843 317450 294446 285698 274294 3805378
2015 309020 291129 317277 289670 278038 361649 394319 361008 303319 299507 287243 271629 3763808 -1.09%
2016 297683 299386 311959 295526 290048 358040 375734 359101 293046 288026 278320 260038 3706907 -1.51%
2017 294812 276103 322125 291011 292474 344982 373740 351907 290713 294512 281047 249729 3663155 -1.18%
2018 287218 274771 314580 292360 285564 341944 383280 352003 294916 298353 280206 257555 3662750 -0.01%
2019 307209 287738 311981 295288 287167 339329 388003 346194 294581 301135 283336 267443 3709404 1.27%
2010 to 2009 2010<2009 3.62% -0.68% 4.12% -4.83% -2.02% -2.45% -2.03% 2.72% -1.63% -2.91% 2.14% -3.47% -0.60%
2011 to 2010 2011<2010 -1.35% -0.52% -2.62% 1.83% 0.60% 1.00% -4.35% -0.15% -0.89% -1.00% -2.17% 0.41% -0.75%
2012 to 2011 2012<2011 3.01% 4.52% -4.15% -0.25% -0.41% -0.77% 2.52% -7.05% -7.49% -1.32% -1.62% -5.67% -1.32%
2013 to 2012 2013<2012 -2.55% -5.11% -4.61% -1.92% 0.21% -4.39% 2.74% 0.80% 0.05% 1.21% -4.55% -0.82% -1.52%
2014 to 2013 2014<2013 -6.06% -8.97% -1.57% -4.29% -3.77% -5.06% -5.01% -4.77 4.65 -6.89% -4.38% 1.94% -3.83%
2015 to 2014 2015<2014 1.92% 3.07% -3.95% -3.30% -6.34% 4.01% -4.18% -0.23% -4.45% 1.72% 0.54% -0.97% -1.09%
2016 to 2015 2016<2015 -3.67% 2.84% -1.68% 2.02% 4.32% -0.99% -4.71% -0.53% -3.39% -3.83% -3.11% -4.27% -1.51%
2017 to 2016 2017<2016 -0.96% -7.78% 3.26% -1.53% 0.84% -3.65% -0.54% -2.00% -0.80% 2.25% 0.98% -3.96% -1.18%
2018 to 2017 2018<2017 -2.58% -0.48% -2.34% 0.46% -2.36% -0.88% 2.55% 0.00% 1.45% 1.30% -0.30% 3.13% -0.01%
2018 to 2019 2019<2018 6.96% 4.72% -0.83% 1.01% 0.56% -0.76% 1.23% -0.17% -0.12% 0.93% 1.10% 3.83% 1.27%
YTD 2018 287218 274771 314580 292360 285564 341944 383280 352003 294916 298353 280206 257555 3662750
YTD 2019 307209 287738 311981 295288 287167 339329 388003 346194 294581 301135 283336 267443 3709404 1.27%

December 2019 Circulation
Sierra OverDrive Total
Atglen 1728 287 2015
Avon Grove 6818 2448 9266
Chester County/Hankin 95283 19569 114852
Chester Springs 2004 1228 3232
Coatesville 4025 197 4222
Downingtown 9969 2374 12343
Easttown 16421 10998 27419
Honey Brook 4600 284 4884
Kennett 9013 3764 12777
Malvern 4904 775 5679
Oxford 6385 1843 8228
Parkesburg 4391 201 4592
Phoenixville 12336 2742 15078
Spring City 1836 335 2171
Tredyffrin/Paoli 24304 5026 29330
West Chester 8745 2610 11355
TOTAL 212762 54681 267443
1%
3%
43%
1%
2%5%
10%
2%
5%
2%
3%
2%
6%
1%
11%
4%Atglen
Avon Grove
Chester County/Hankin
Chester Springs
Coatesville
Downingtown
Easttown
Honey Brook
Kennett
Malvern
Oxford
Parkesburg
Phoenixville
Spring City
Tredyffrin/Paoli
West Chester

OverDrive Percentage Distribution 2019
Library Percentage January February March April May June July August Sept October Nov Dec Total
TOTAL 52474 48270 52779 50521 52922 55778 59442 58194 53763 54197 51585 54681 644606
Atglen 0.53% 276 253 277 265 278 293 312 306 282 285 271 287 3385
Avon Grove 4.48% 2349 2161 2363 2262 2369 2497 2661 2605 2407 2426 2310 2448 28861
Chester County/HH 35.79% 18779 17275 18889 18080 18940 19962 21273 20827 19241 19396 18461 19569 230692
Chester Springs 2.24% 1178 1084 1185 1134 1188 1252 1334 1306 1207 1217 1158 1228 14471
Coatesville 0.36% 189 174 190 182 191 201 214 210 194 195 186 197 2325
Downingtown 4.34% 2278 2095 2291 2193 2297 2421 2580 2526 2334 2353 2239 2374 27983
Easttown 20.11% 10554 9709 10615 10162 10644 11219 11956 11705 10813 10901 10375 10998 129650
HoneyBrook 0.52% 273 251 274 262 275 290 309 302 279 281 268 284 3348
Kennett 6.88% 3612 3323 3633 3478 3643 3840 4092 4006 3701 3731 3551 3764 44373
Malvern 1.42% 744 684 748 716 750 790 842 825 762 768 731 775 9134
Oxford 3.37% 1769 1627 1779 1703 1784 1880 2003 1961 1812 1827 1739 1843 21725
Parkesburg 0.37% 192 177 193 185 194 204 218 213 197 199 189 201 2363
Phoenixville 5.01% 2631 2420 2647 2533 2654 2797 2981 2918 2696 2718 2587 2742 32323
Spring City 0.61% 322 296 324 310 325 342 365 357 330 332 316 335 3953
Tredyffrin/Paoli 9.19% 4823 4437 4851 4644 4864 5127 5464 5349 4942 4981 4741 5026 59250
West Chester 4.77% 2505 2304 2520 2412 2526 2663 2838 2778 2566 2587 2463 2610 30773
Total 100.0% 52474 48270 52779 50521 52922 55778 59442 58194 53763 54197 51585 54681 644606

1
2
3
4
5
6
7
8
9
10
11
12
13
14
15
16
17
18
19
20
21
22
23
24
25
26
27
28
29
30
31
32
33
34
35
36
37
38
39
40
41
42
43
44
45
A B C D E F G H I J K L M N Q R S
Computer Usage 2019 (Sessions)
2019 YTD 2018 Annual 2017 Annual
January February March April May June July 16-31 August September October November December Total Percentage Percentage Percentage
Atglen 172 275 227 261 295 252 1482 0.78% 1.99% 1.40%
Avon Grove 682 1120 1019 1226 889 663 5599 2.93% 2.00% 1.85%
Chester County 6084 10234 9358 8311 7689 6858 48534 25.39% 31.22% 31.81%
Chester Springs 155 154 211 204 177 140 1041 0.54% 1.74% 0.90%
Coatesville 1516 2672 2442 2649 2074 1906 13259 6.94% 4.59% 5.40%
Downingtown 1132 1798 1590 1769 1475 1089 8853 4.63% 2.64% 2.50%
Easttown 2076 3370 3247 3831 3262 2889 18675 9.77% 10.75% 9.31%
Hankin 1289 2008 1940 2286 2003 1756 11282 5.90% 9.04% 9.19%
Honey Brook 231 385 346 334 314 309 1919 1.00% 1.25% 1.33%
Kennett 1184 2005 1740 1810 1612 1343 9694 5.07% 4.57% 5.18%
Malvern 607 958 734 846 753 647 4545 2.38% 2.06% 2.10%
Oxford 633 1328 1368 1281 928 939 6477 3.39% 2.28% 2.64%
Paoli 562 1207 1021 1025 1075 977 5867 3.07% 2.55% 2.58%
Parkesburg 254 602 532 558 423 307 2676 1.40% 0.74% 1.14%
Phoenixville 1679 3135 2552 2774 2347 1955 14442 7.55% 6.96% 6.47%
Spring City 362 646 660 619 561 465 3313 1.73% 1.25% 1.42%
Tredyffrin 2876 5222 4644 4969 4257 3521 25489 13.33% 10.57% 11.04%
West Chester 951 1569 1516 1538 1349 1115 8038 4.20% 3.80% 3.74%
System 22445 38688 35147 36291 31483 27131 191185 100.00% 100.00% 100.00%
Note:
2017 and 2018 based on minutes
2019 based on sessions

December 2019 Computer Usage (Sessions)
Envisionware Wireless Total
Atglen 67 185 252
Avon Grove 273 390 663
Chester County 2657 4201 6858
Chester Springs 54 86 140
Coatesville 858 1048 1906
Downingtown 544 545 1089
Easttown 943 1946 2889
Hankin 536 1220 1756
Honey Brook 180 129 309
Kennett 472 871 1343
Malvern 263 384 647
Oxford 483 456 939
Paoli 326 651 977
Parkesburg 158 149 307
Phoenixville 951 1004 1955
Spring City 272 193 465
Tredyffrin 1078 2443 3521
West Chester 339 776 1115
TOTAL 10454 16677 27131
1%
2%
25%
<1
7%
4%
11%6%1%
5%
2%
3%
4%
<1
7%
<1
13%
4%
Computer Usage
Atglen
Avon Grove
Chester County
Chester Springs
Coatesville
Downingtown
Easttown
Hankin
Honey Brook
Kennett
Malvern
Oxford
Paoli
Parkesburg
Phoenixville
Spring City
Tredyffrin
West Chester

1
2
3
4
5
6
7
8
9
10
11
12
13
14
15
16
17
18
19
20
21
22
23
24
25
26
27
28
29
30
31
32
33
34
35
36
37
38
39
40
41
42
43
44
45
46
47
48
A B C D E F G H I J K L M N O R
Door Count Comparisons 2019
January February March April May June July August September October November December Total vs Prior year
Atglen
2014 1470 2737 1930 1698 2066 2508 3476 2690 2075 2192 1620 1642 26104
2015 1657 2025 1986 1916 2077 2261 3049 2423 1971 1873 1746 1403 24387 -6.58%
2016 1239 1293 1705 1707 1813 2605 2795 2515 1903 1739 1480 1317 22111 -9.33%
2017 1277 1464 1719 1577 1868 2425 2862 2712 1939 1929 1535 1313 22620 2.30%
2018 1556 1506 1714 1702 2010 2977 3261 2485 1884 1893 1656 1298 23942 5.84%
2019 1753 1501 1761 1781 1792 2476 2652 1847 1639 1714 1460 1347 21723 -9.27%
Avon Grove
2014 7091 6793 8768 9064 9019 11319 14238 11363 9225 10081 8572 7837 113370
2015 7903 8322 8563 9556 8816 12616 14036 12149 10364 10463 8550 7721 119059 5.02%
2016 8021 9221 10343 9405 8978 11831 12663 12197 8785 9380 8512 6859 116195 -2.41%
2017 7661 8233 9031 8428 9017 11582 11149 11070 8189 8788 7964 6474 107586 -7.41%
2018 7065 7973 9237 8805 9115 10718 13116 11713 8338 8966 7651 6311 109008 1.32%
2019 7602 6680 8233 9043 8509 10881 12812 10576 8155 9165 7812 5882 105350 -3.36%
Chester County
2014 35273 32677 39932 39145 35522 40655 49080 42849 39358 38675 33098 32781 459045
2015 34517 34245 36337 37431 32654 43148 44925 42159 34460 34882 32416 30665 437839 -4.62%
2016 31951 34219 36879 36029 33303 41592 43575 43503 33587 33822 32123 29991 430574 -1.66%
2017 34640 32743 41443 39025 36160 43154 47660 46510 35819 36958 34510 31142 459764 6.78%
2018 34479 36748 37918 38170 35526 42083 47453 43422 35524 35968 32698 32324 452313 -1.62%
2019 36441 34793 38496 36405 33223 40524 46845 42052 33777 34142 31804 30102 438604 -3.03%
Chester Springs
2014 1407 964 1549 2078 1645 1710 2571 1655 1575 1917 1596 1569 20236
2015 1504 1349 1694 2448 1789 2331 3001 2418 2146 2208 2396 2164 25448 25.76%
2016 1729 2056 2295 3579 2398 2003 2657 2388 1973 2148 1918 1732 26876 5.61%
2017 1670 1560 1710 1825 2030 1933 2352 2001 1603 1847 1625 1449 21605 -19.61%
2018 1387 1356 1597 1430 1556 1987 2863 1942 1538 1601 1468 1418 20143 -6.77%
2019 1651 1727 1868 1868 1716 2442 3246 2375 1844 1761 1774 1667 23939 18.85%
Coatesville
2014 6023 5709 8801 9211 8988 8997 11485 10316 9020 9422 6984 7064 102020
2015 7274 6718 8093 8822 7923 8705 8957 8231 7079 6715 5013 5154 88684 -13.07%
2016 4423 5383 5209 5264 5138 6078 6705 7153 6067 4908 3800 3454 63582 -28.30%
2017 4480 5117 5643 5667 5714 7142 7718 8001 6279 6367 5608 4603 72339 13.77%
2018 5023 5379 5586 6378 6788 7606 7345 6513 5053 5956 4697 4386 70710 -2.25%
2019 5871 4975 5900 6842 6519 6747 7080 6326 5669 6692 4961 4558 72140 2.02%
Downingtown
2014 7175 6268 8382 7231 7905 9674 12923 9610 7790 7807 6545 6593 97903
2015 4702 6313 7428 7366 6846 9330 10072 8639 7983 8149 7412 6305 90545 -7.52%
2016 6439 7022 9145 9457 8024 10095 9905 10359 9425 9635 7682 6186 103374 14.17%
2017 7589 7781 9210 7751 8092 11231 9805 10893 8959 10226 8337 7097 106971 3.48%
2018 7674 8804 10167 9050 8978 11910 11835 11625 9209 10599 7710 6745 114306 6.86%
2019 8156 8387 10301 9235 9048 12016 12990 12643 10605 10753 8408 6866 119408 4.46%
49
50
51
52
53
54
55
56
57
58
59
60
61
62
63
64
65
66
67
68
69
70
71
72
73
74
75
76
77
78
79
80
81
82
83
84
85
86
87
88
89
90
91
92
93
94
95
96
A B C D E F G H I J K L M N O R
January February March April May June July August September October November December Total vs Prior year
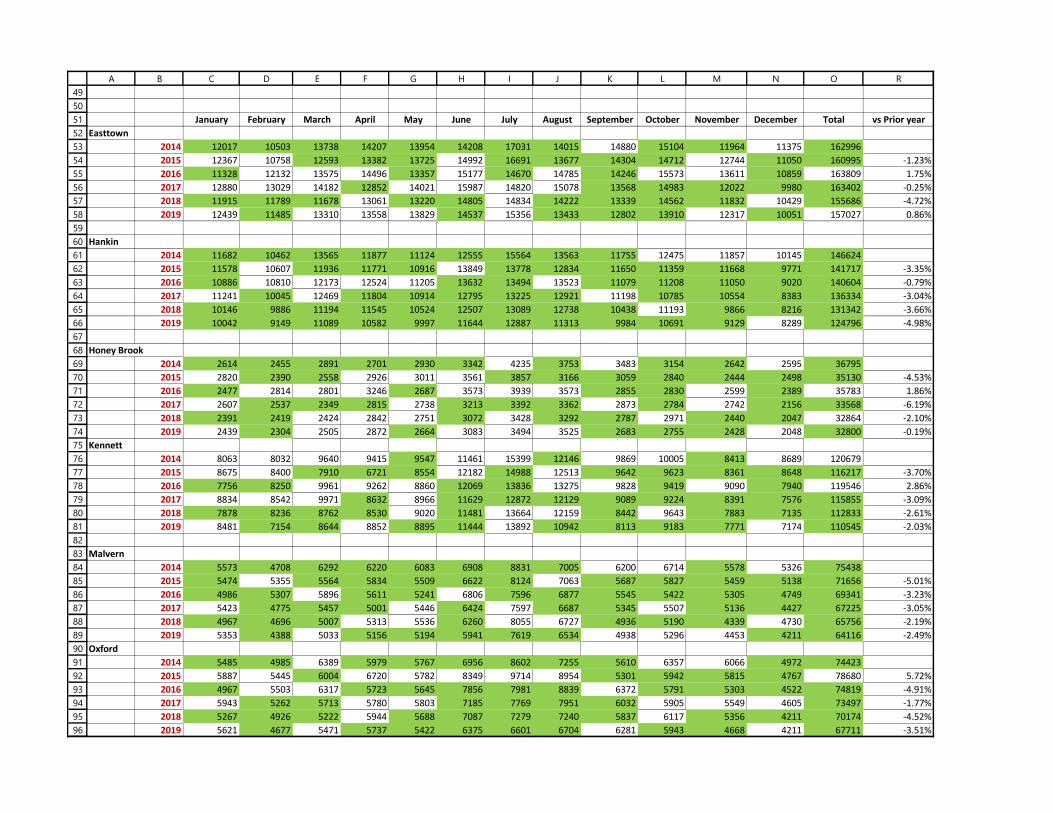
Easttown
2014 12017 10503 13738 14207 13954 14208 17031 14015 14880 15104 11964 11375 162996
2015 12367 10758 12593 13382 13725 14992 16691 13677 14304 14712 12744 11050 160995 -1.23%
2016 11328 12132 13575 14496 13357 15177 14670 14785 14246 15573 13611 10859 163809 1.75%
2017 12880 13029 14182 12852 14021 15987 14820 15078 13568 14983 12022 9980 163402 -0.25%
2018 11915 11789 11678 13061 13220 14805 14834 14222 13339 14562 11832 10429 155686 -4.72%
2019 12439 11485 13310 13558 13829 14537 15356 13433 12802 13910 12317 10051 157027 0.86%
Hankin
2014 11682 10462 13565 11877 11124 12555 15564 13563 11755 12475 11857 10145 146624
2015 11578 10607 11936 11771 10916 13849 13778 12834 11650 11359 11668 9771 141717 -3.35%
2016 10886 10810 12173 12524 11205 13632 13494 13523 11079 11208 11050 9020 140604 -0.79%
2017 11241 10045 12469 11804 10914 12795 13225 12921 11198 10785 10554 8383 136334 -3.04%
2018 10146 9886 11194 11545 10524 12507 13089 12738 10438 11193 9866 8216 131342 -3.66%
2019 10042 9149 11089 10582 9997 11644 12887 11313 9984 10691 9129 8289 124796 -4.98%
Honey Brook
2014 2614 2455 2891 2701 2930 3342 4235 3753 3483 3154 2642 2595 36795
2015 2820 2390 2558 2926 3011 3561 3857 3166 3059 2840 2444 2498 35130 -4.53%
2016 2477 2814 2801 3246 2687 3573 3939 3573 2855 2830 2599 2389 35783 1.86%
2017 2607 2537 2349 2815 2738 3213 3392 3362 2873 2784 2742 2156 33568 -6.19%
2018 2391 2419 2424 2842 2751 3072 3428 3292 2787 2971 2440 2047 32864 -2.10%
2019 2439 2304 2505 2872 2664 3083 3494 3525 2683 2755 2428 2048 32800 -0.19%
Kennett
2014 8063 8032 9640 9415 9547 11461 15399 12146 9869 10005 8413 8689 120679
2015 8675 8400 7910 6721 8554 12182 14988 12513 9642 9623 8361 8648 116217 -3.70%
2016 7756 8250 9961 9262 8860 12069 13836 13275 9828 9419 9090 7940 119546 2.86%
2017 8834 8542 9971 8632 8966 11629 12872 12129 9089 9224 8391 7576 115855 -3.09%
2018 7878 8236 8762 8530 9020 11481 13664 12159 8442 9643 7883 7135 112833 -2.61%
2019 8481 7154 8644 8852 8895 11444 13892 10942 8113 9183 7771 7174 110545 -2.03%
Malvern
2014 5573 4708 6292 6220 6083 6908 8831 7005 6200 6714 5578 5326 75438
2015 5474 5355 5564 5834 5509 6622 8124 7063 5687 5827 5459 5138 71656 -5.01%
2016 4986 5307 5896 5611 5241 6806 7596 6877 5545 5422 5305 4749 69341 -3.23%
2017 5423 4775 5457 5001 5446 6424 7597 6687 5345 5507 5136 4427 67225 -3.05%
2018 4967 4696 5007 5313 5536 6260 8055 6727 4936 5190 4339 4730 65756 -2.19%
2019 5353 4388 5033 5156 5194 5941 7619 6534 4938 5296 4453 4211 64116 -2.49%
Oxford
2014 5485 4985 6389 5979 5767 6956 8602 7255 5610 6357 6066 4972 74423
2015 5887 5445 6004 6720 5782 8349 9714 8954 5301 5942 5815 4767 78680 5.72%
2016 4967 5503 6317 5723 5645 7856 7981 8839 6372 5791 5303 4522 74819 -4.91%
2017 5943 5262 5713 5780 5803 7185 7769 7951 6032 5905 5549 4605 73497 -1.77%
2018 5267 4926 5222 5944 5688 7087 7279 7240 5837 6117 5356 4211 70174 -4.52%
2019 5621 4677 5471 5737 5422 6375 6601 6704 6281 5943 4668 4211 67711 -3.51%
97
98
99
100
101
102
103
104
105
106
107
108
109
110
111
112
113
114
115
116
117
118
119
120
121
122
123
124
125
126
127
128
129
130
131
132
133
134
135
136
137
138
139
140
141
142
143
144
A B C D E F G H I J K L M N O R
January February March April May June July August September October November December Total vs Prior year
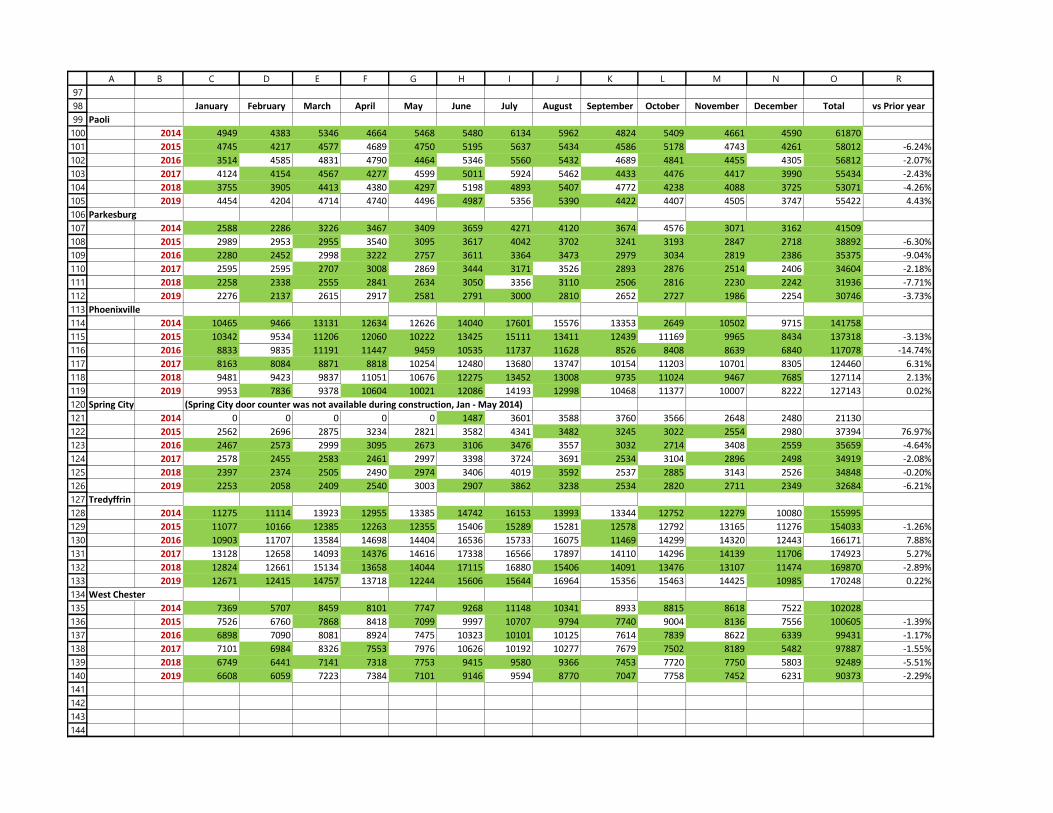
Paoli
2014 4949 4383 5346 4664 5468 5480 6134 5962 4824 5409 4661 4590 61870
2015 4745 4217 4577 4689 4750 5195 5637 5434 4586 5178 4743 4261 58012 -6.24%
2016 3514 4585 4831 4790 4464 5346 5560 5432 4689 4841 4455 4305 56812 -2.07%
2017 4124 4154 4567 4277 4599 5011 5924 5462 4433 4476 4417 3990 55434 -2.43%
2018 3755 3905 4413 4380 4297 5198 4893 5407 4772 4238 4088 3725 53071 -4.26%
2019 4454 4204 4714 4740 4496 4987 5356 5390 4422 4407 4505 3747 55422 4.43%
Parkesburg
2014 2588 2286 3226 3467 3409 3659 4271 4120 3674 4576 3071 3162 41509
2015 2989 2953 2955 3540 3095 3617 4042 3702 3241 3193 2847 2718 38892 -6.30%
2016 2280 2452 2998 3222 2757 3611 3364 3473 2979 3034 2819 2386 35375 -9.04%
2017 2595 2595 2707 3008 2869 3444 3171 3526 2893 2876 2514 2406 34604 -2.18%
2018 2258 2338 2555 2841 2634 3050 3356 3110 2506 2816 2230 2242 31936 -7.71%
2019 2276 2137 2615 2917 2581 2791 3000 2810 2652 2727 1986 2254 30746 -3.73%
Phoenixville
2014 10465 9466 13131 12634 12626 14040 17601 15576 13353 2649 10502 9715 141758
2015 10342 9534 11206 12060 10222 13425 15111 13411 12439 11169 9965 8434 137318 -3.13%
2016 8833 9835 11191 11447 9459 10535 11737 11628 8526 8408 8639 6840 117078 -14.74%
2017 8163 8084 8871 8818 10254 12480 13680 13747 10154 11203 10701 8305 124460 6.31%
2018 9481 9423 9837 11051 10676 12275 13452 13008 9735 11024 9467 7685 127114 2.13%
2019 9953 7836 9378 10604 10021 12086 14193 12998 10468 11377 10007 8222 127143 0.02%
Spring City (Spring City door counter was not available during construction, Jan - May 2014)
2014 0 0 0 0 0 1487 3601 3588 3760 3566 2648 2480 21130
2015 2562 2696 2875 3234 2821 3582 4341 3482 3245 3022 2554 2980 37394 76.97%
2016 2467 2573 2999 3095 2673 3106 3476 3557 3032 2714 3408 2559 35659 -4.64%
2017 2578 2455 2583 2461 2997 3398 3724 3691 2534 3104 2896 2498 34919 -2.08%
2018 2397 2374 2505 2490 2974 3406 4019 3592 2537 2885 3143 2526 34848 -0.20%
2019 2253 2058 2409 2540 3003 2907 3862 3238 2534 2820 2711 2349 32684 -6.21%
Tredyffrin
2014 11275 11114 13923 12955 13385 14742 16153 13993 13344 12752 12279 10080 155995
2015 11077 10166 12385 12263 12355 15406 15289 15281 12578 12792 13165 11276 154033 -1.26%
2016 10903 11707 13584 14698 14404 16536 15733 16075 11469 14299 14320 12443 166171 7.88%
2017 13128 12658 14093 14376 14616 17338 16566 17897 14110 14296 14139 11706 174923 5.27%
2018 12824 12661 15134 13658 14044 17115 16880 15406 14091 13476 13107 11474 169870 -2.89%
2019 12671 12415 14757 13718 12244 15606 15644 16964 15356 15463 14425 10985 170248 0.22%
West Chester
2014 7369 5707 8459 8101 7747 9268 11148 10341 8933 8815 8618 7522 102028
2015 7526 6760 7868 8418 7099 9997 10707 9794 7740 9004 8136 7556 100605 -1.39%
2016 6898 7090 8081 8924 7475 10323 10101 10125 7614 7839 8622 6339 99431 -1.17%
2017 7101 6984 8326 7553 7976 10626 10192 10277 7679 7502 8189 5482 97887 -1.55%
2018 6749 6441 7141 7318 7753 9415 9580 9366 7453 7720 7750 5803 92489 -5.51%
2019 6608 6059 7223 7384 7101 9146 9594 8770 7047 7758 7452 6231 90373 -2.29%
145
146
147
148
149
150
151
152
153
154
155
156
157
158
159
160
161
162
163
164
165
166
167
168
169
170
171
172
173
174
175
176
177
178
179
180
181
182
183
184
185
186
187
188
189
190
A B C D E F G H I J K L M N O R
January February March April May June July August September October November December Total vs Prior year
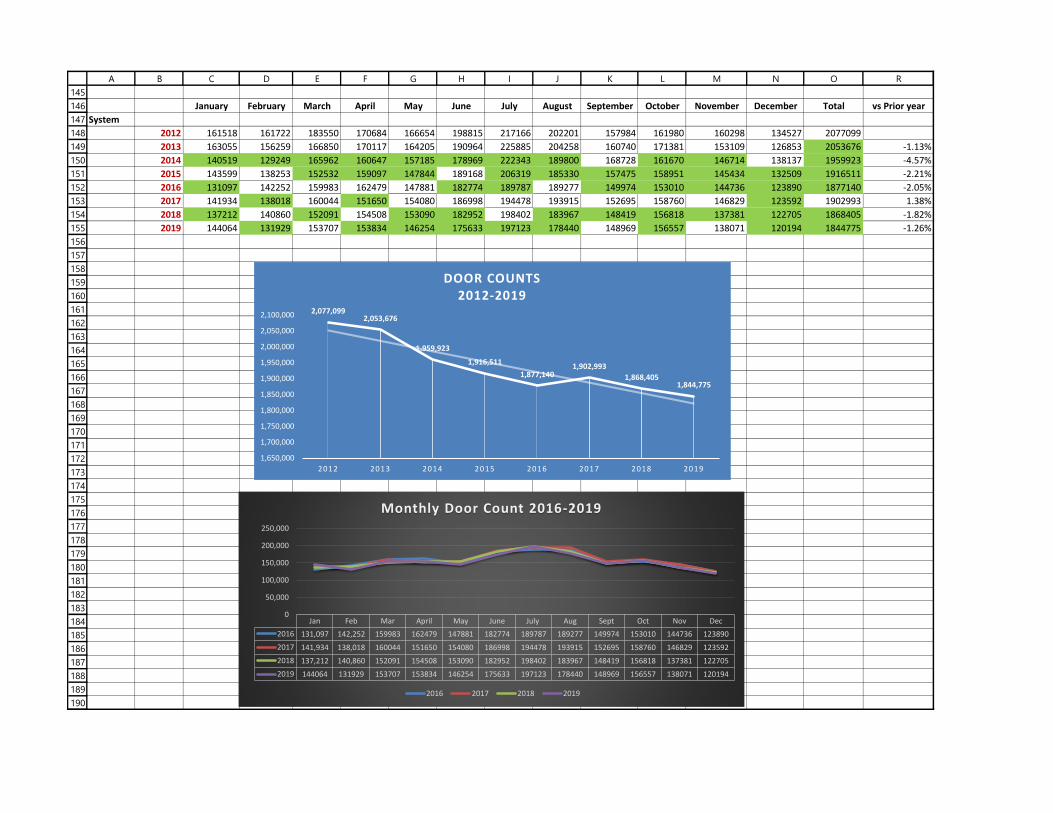
System
2012 161518 161722 183550 170684 166654 198815 217166 202201 157984 161980 160298 134527 2077099
2013 163055 156259 166850 170117 164205 190964 225885 204258 160740 171381 153109 126853 2053676 -1.13%
2014 140519 129249 165962 160647 157185 178969 222343 189800 168728 161670 146714 138137 1959923 -4.57%
2015 143599 138253 152532 159097 147844 189168 206319 185330 157475 158951 145434 132509 1916511 -2.21%
2016 131097 142252 159983 162479 147881 182774 189787 189277 149974 153010 144736 123890 1877140 -2.05%
2017 141934 138018 160044 151650 154080 186998 194478 193915 152695 158760 146829 123592 1902993 1.38%
2018 137212 140860 152091 154508 153090 182952 198402 183967 148419 156818 137381 122705 1868405 -1.82%
2019 144064 131929 153707 153834 146254 175633 197123 178440 148969 156557 138071 120194 1844775 -1.26%
2,077,0992,053,676
1,959,923
1,916,511
1,877,1401,902,993
1,868,4051,844,775
1,650,000
1,700,000
1,750,000
1,800,000
1,850,000
1,900,000
1,950,000
2,000,000
2,050,000
2,100,000
2012 2013 2014 2015 2016 2017 2018 2019
DOOR COUNTS 2012-2019
Jan Feb Mar April May June July Aug Sept Oct Nov Dec
2016 131,097 142,252 159983 162479 147881 182774 189787 189277 149974 153010 144736 123890
2017 141,934 138,018 160044 151650 154080 186998 194478 193915 152695 158760 146829 123592
2018 137,212 140,860 152091 154508 153090 182952 198402 183967 148419 156818 137381 122705
2019 144064 131929 153707 153834 146254 175633 197123 178440 148969 156557 138071 120194
0
50,000
100,000
150,000
200,000
250,000
Monthly Door Count 2016-2019
2016 2017 2018 2019

11:31 AM 01/06/20 Cash Basis
Phoenixville Public Library Balance Sheet Prev Year Comparison
As of December 31, 2019
Page 1 of 2
Dec 31, 19 Dec 31, 18 $ Change % Change
ASSETS
Current Assets
Checking/Savings
100 · Phoenixville Federal Savings #1
100.7 · Certificate of Deposit (59971) 30,000.00 0.00 30,000.00 100.0%
100.6 · Certificate of Deposit (59970) 20,000.00 0.00 20,000.00 100.0%
100.5 · Certificate of Deposit (59969) 20,000.00 0.00 20,000.00 100.0%
100.1 · Operating Checking (040016792) 51,810.87 25,669.87 26,141.00 101.84%
100.2 · Operating Money Market 189,244.97 255,073.97 -65,829.00 -25.81%
100.3 · Operating Credit Card Receipts 11,721.79 6,943.21 4,778.58 68.82%
Total 100 · Phoenixville Federal Savings #1 322,777.63 287,687.05 35,090.58 12.2%
105 · Petty Cash
105.6 · Paypal 5,369.00 5,369.00 0.00 0.0%
105 · Petty Cash - Other 500.00 500.00 0.00 0.0%
Total 105 · Petty Cash 5,869.00 5,869.00 0.00 0.0%
106 · Circulation Cash 500.00 500.00 0.00 0.0%
Total Checking/Savings 329,146.63 294,056.05 35,090.58 11.93%
Other Current Assets130 · Prepaid Expenses 8,509.00 8,509.00 0.00 0.0%
Total Other Current Assets 8,509.00 8,509.00 0.00 0.0%
Total Current Assets 337,655.63 302,565.05 35,090.58 11.6%
Fixed Assets
150 · General Fixed Assets
150.1 · Leasehold Improvements
150.1.1 · 1999/2000 Addition 0.02 0.02 0.00 0.0%
150.1.2 · General 0.06 0.06 0.00 0.0%
Total 150.1 · Leasehold Improvements 0.08 0.08 0.00 0.0%
150.6 · Computer Equipment -0.12 -0.12 0.00 0.0%
150.8 · Furniture & Fixtures 0.28 0.28 0.00 0.0%
Total 150 · General Fixed Assets 0.24 0.24 0.00 0.0%
Total Fixed Assets 0.24 0.24 0.00 0.0%TOTAL ASSETS 337,655.87 302,565.29 35,090.58 11.6%
LIABILITIES & EQUITY
Liabilities
Current Liabilities
Accounts Payable
201 · Accounts Payable -502.33 2,808.51 -3,310.84 -117.89%
220 · Credit Card Payables 717.50 717.50 0.00 0.0%
Total Accounts Payable 215.17 3,526.01 -3,310.84 -93.9%
Other Current Liabilities
221 · Accounts Payable - Other 0.01 0.01 0.00 0.0%
230 · Employee Costs Payable
230.5 · Accrued Vacation 7,358.00 7,358.00 0.00 0.0%
230.1 · Salaries Payable 14,412.95 14,412.95 0.00 0.0%

11:31 AM 01/06/20 Cash Basis
Phoenixville Public Library Balance Sheet Prev Year Comparison
As of December 31, 2019
Page 2 of 2
Dec 31, 19 Dec 31, 18 $ Change % Change
Total 230 · Employee Costs Payable 21,770.95 21,770.95 0.00 0.0%
Total Other Current Liabilities 21,770.96 21,770.96 0.00 0.0%
Total Current Liabilities 21,986.13 25,296.97 -3,310.84 -13.09%
Total Liabilities 21,986.13 25,296.97 -3,310.84 -13.09%
Equity
310 · Contributed Capital 0.24 0.24 0.00 0.0%
319 · Net Assets 279,138.25 271,946.73 7,191.52 2.64%
Net Income 36,531.25 5,321.35 31,209.90 586.5%
Total Equity 315,669.74 277,268.32 38,401.42 13.85%TOTAL LIABILITIES & EQUITY 337,655.87 302,565.29 35,090.58 11.6%

11:32 AM 01/06/20 Cash Basis
Phoenixville Public Library Profit & Loss Budget vs. Actual
July through December 2019
Page 1 of 5
Jul - Dec 19 Budget $ Over Budget % of Budget Prev. Year
Ordinary Income/Expense
Income
400 · Appropriations
400.1 · Appropriation - P.A.S.D. 283,652.50 566,411.00 -282,758.50 50.08% 283,652.50
400.2 · Appropriation - County 35,049.23 71,000.00 -35,950.77 49.37% 36,126.66
400.3 · Appropriation - State 0.00 84,000.00 -84,000.00 0.0% 0.00
400.4 · Appropriation - Charlestown Tws 0.00 5,500.00 -5,500.00 0.0% 0.00
400.5 · Appropriation - Schuylkill Twp 1,500.00 1,500.00 0.00 100.0% 1,500.00
Total 400 · Appropriations 320,201.73 728,411.00 -408,209.27 43.96% 321,279.16
412 · Development Income
412.1 · Grants 5,400.00 25,000.00 -19,600.00 21.6% 2,000.00
412.2 · Projects/Events 36,365.79 50,000.00 -13,634.21 72.73% 47,370.25
412.3 · Annual Appeal 4,485.00 17,500.00 -13,015.00 25.63% 6,425.00
412.4 · Donations
412.4.1 · Unrestricted 9,401.68 10,000.00 -598.32 94.02% 3,080.00
412.4.2 · Restricted - General 115.00 3,000.00 -2,885.00 3.83% 120.00
412.4.3 · Restricted - Children's 199.50 3,000.00 -2,800.50 6.65% 308.61
Total 412.4 · Donations 9,716.18 16,000.00 -6,283.82 60.73% 3,509.45
412.5 · Civic Organizations 139.75 1,500.00 -1,360.25 9.32% 245.84
Total 412 · Development Income 56,106.72 110,000.00 -53,893.28 51.01% 59,550.54
420 · Operations Income
420.10 · Notary Services 155.00 300.00 -145.00 51.67% 0.00
420.9 · Hot Spots 1,610.00 4,000.00 -2,390.00 40.25% 1,652.00
420.1 · Fines 11,004.16 23,000.00 -11,995.84 47.84% 10,858.78
420.2 · Passport Applications 54,295.00 126,000.00 -71,705.00 43.09% 54,667.50
420.3 · Interest 376.81 1,500.00 -1,123.19 25.12% 497.07
420.4 · Items Sold 2,029.90 4,000.00 -1,970.10 50.75% 2,634.25
420.5 · Lost Books 1,158.82 2,500.00 -1,341.18 46.35% 1,463.15
420.6 · Other (Copier, etc.) 2,917.64 5,500.00 -2,582.36 53.05% 2,627.03
420.7 · Rentals/Community Room 112.50 0.00 112.50 100.0% 250.00
420.8 · Rentals/Collection
420.8.1 · Library Income 7,096.33 13,000.00 -5,903.67 54.59% 8,016.99

11:32 AM 01/06/20 Cash Basis
Phoenixville Public Library Profit & Loss Budget vs. Actual
July through December 2019
Page 2 of 5
Jul - Dec 19 Budget $ Over Budget % of Budget Prev. Year
420.8.2 · PA Sales Tax -37.52 0.00 -37.52 100.0% -2.40
Total 420.8 · Rentals/Collection 7,058.81 13,000.00 -5,941.19 54.3% 8,014.59
Total 420 · Operations Income 80,718.64 179,800.00 -99,081.36 44.89% 82,664.37
Total Income 457,027.09 1,018,211.00 -561,183.91 44.89% 463,494.07
Expense
500 · Adult Library
500.15 · Mobile Hotspots 2,022.31 3,200.00 -1,177.69 63.2% 0.00
500.14 · Museum Passes 305.00 1,500.00 -1,195.00 20.33% 0.00
500.13 · Professional Develop. Material 779.47 900.00 -120.53 86.61% 894.47
500.1 · Books
500.1.1 · Physical Books 14,209.21 31,000.00 -16,790.79 45.84% 15,281.69
500.1.2 · E-Books 5,896.58 14,122.00 -8,225.42 41.76% 4,393.32
Total 500.1 · Books 20,105.79 45,122.00 -25,016.21 44.56% 19,675.01
500.2 · Magazines & Newspapers 5,764.79 5,200.00 564.79 110.86% 5,156.34
500.3 · Audios 3,307.65 7,000.00 -3,692.35 47.25% 4,348.94
500.4 · Videos 2,833.08 7,000.00 -4,166.92 40.47% 4,724.68
500.5 · Software 286.13 400.00 -113.87 71.53% 297.39
500.6 · Reference 764.75 1,500.00 -735.25 50.98% 293.42
500.7 · Programs - Adult 2,860.00 5,200.00 -2,340.00 55.0% 1,808.00
500.8 · Program Supplies - Adult 907.83 1,600.00 -692.17 56.74% 897.18
Total 500 · Adult Library 39,936.80 78,622.00 -38,685.20 50.8% 38,095.43
510 · Youth Library
510.1 · Books
510.1.1 · Physical Books 10,466.40 27,000.00 -16,533.60 38.76% 8,267.53
510.1.2 · E-Books 3,488.45 7,330.00 -3,841.55 47.59% 1,430.42
Total 510.1 · Books 13,954.85 34,330.00 -20,375.15 40.65% 9,697.95
510.2 · Magazines 639.71 650.00 -10.29 98.42% 675.05
510.3 · Audios 964.98 2,500.00 -1,535.02 38.6% 863.40
510.4 · Videos 2,478.17 3,500.00 -1,021.83 70.81% 1,647.96
510.5 · Software 385.39 1,000.00 -614.61 38.54% 326.14
510.7 · Programs - Children 2,795.00 8,000.00 -5,205.00 34.94% 2,451.50
510.8 · Program Supplies - Children 1,575.08 6,000.00 -4,424.92 26.25% 1,510.06

11:32 AM 01/06/20 Cash Basis
Phoenixville Public Library Profit & Loss Budget vs. Actual
July through December 2019
Page 3 of 5
Jul - Dec 19 Budget $ Over Budget % of Budget Prev. Year
510.13 · Young Adult - All 1,991.88 4,000.00 -2,008.12 49.8% 1,301.44
510.14 · Programs - Young Adults 145.45 730.00 -584.55 19.93% 432.20
510.15 · Program Supplies - Young Adult 187.18 700.00 -512.82 26.74% 44.36
Total 510 · Youth Library 25,117.69 61,410.00 -36,292.31 40.9% 18,950.06
520 · Development Expense
520.8 · Donor Management 0.00 3,948.00 -3,948.00 0.0% 3,638.25
520.1 · Annual Appeal 2,727.00 5,600.00 -2,873.00 48.7% 2,835.60
520.3 · Special Events 18,826.78 22,500.00 -3,673.22 83.68% 35,817.05
520.5 · Marketing 161.52 1,872.00 -1,710.48 8.63% 909.96
Total 520 · Development Expense 21,715.30 33,920.00 -12,204.70 64.02% 43,200.86
530 · Administration
530.1 · General
530.1.1 · Audit/Form 990 5,500.00 8,100.00 -2,600.00 67.9% 5,000.00
530.1.2 · Library Board Expenses 1,700.04 1,700.00 0.04 100.0% 2,259.33
530.1.3 · Staff Development/Memberships 932.59 2,100.00 -1,167.41 44.41% 2,659.61
530.1.4 · Insurance 1,326.00 1,500.00 -174.00 88.4% -1,326.00
530.1.5 · Advertising 219.00 1,000.00 -781.00 21.9% 219.00
530.1.6 · Legal Expense 0.00 5,000.00 -5,000.00 0.0% 0.00
530.1.7 · Credit Card Fees 2,338.18 2,700.00 -361.82 86.6% 670.08
530.1.8 · Marketing and Website 1,555.09 1,500.00 55.09 103.67% 2,030.45
530.1.9 · Miscellaneous 0.00 150.00 -150.00 0.0% 0.00
Total 530.1 · General 13,570.90 23,750.00 -10,179.10 57.14% 11,512.47
540 · Utilities
540.1 · Electricity 7,952.18 14,600.00 -6,647.82 54.47% 7,893.44
540.2 · Gas 1,283.36 3,000.00 -1,716.64 42.78% 1,226.85
540.3 · Telephone 2,462.57 5,500.00 -3,037.43 44.77% 2,852.56
540.4 · Trash Collection 178.00 300.00 -122.00 59.33% 170.00
540.5 · Water & Sewer 622.72 1,350.00 -727.28 46.13% 908.72
Total 540 · Utilities 12,498.83 24,750.00 -12,251.17 50.5% 13,051.57
550 · Computer Expense
550.2 · Hardware 0.00 4,000.00 -4,000.00 0.0% 592.74
550.3 · Hardware Maintenance 345.00 0.00

11:32 AM 01/06/20 Cash Basis
Phoenixville Public Library Profit & Loss Budget vs. Actual
July through December 2019
Page 4 of 5
Jul - Dec 19 Budget $ Over Budget % of Budget Prev. Year
550.4 · Software 1,958.00 1,000.00 958.00 195.8% 600.00
550.5 · Software Maintenance 450.11 1,500.00 -1,049.89 30.01% 642.35
550.6 · Supplies 1,666.21 3,000.00 -1,333.79 55.54% 1,534.44
Total 550 · Computer Expense 4,419.32 9,500.00 -5,080.68 46.52% 3,369.53
560 · Other Supplies and Expense
560.1 · Collection Maintenance 1,638.61 2,800.00 -1,161.39 58.52% 850.28
560.2 · Library 2,826.58 4,000.00 -1,173.42 70.67% 2,970.17
560.3 · Office 2,865.75 4,000.00 -1,134.25 71.64% 2,629.93
560.4 · Postage 3,415.69 6,500.00 -3,084.31 52.55% 3,368.66
Total 560 · Other Supplies and Expense 10,746.63 17,300.00 -6,553.37 62.12% 9,819.04
570 · Equipment Leasing/Rental 2,655.30 5,090.00 -2,434.70 52.17% 4,399.08
580 · Buildings & Grounds
580.1 · Maintenance580.1.2 · Grounds 42.44 1,000.00 -957.56 4.24% 100.00
Total 580.1 · Maintenance 42.44 1,000.00 -957.56 4.24% 100.00
580.5 · Janitorial Expense
580.5.1 · Service 8,870.00 16,600.00 -7,730.00 53.43% 8,810.00
580.5.2 · Supplies 1,747.87 3,000.00 -1,252.13 58.26% 1,911.81
Total 580.5 · Janitorial Expense 10,617.87 19,600.00 -8,982.13 54.17% 10,721.81
580.7 · Minor Improvements and Repairs 0.00 500.00 -500.00 0.0% 0.00
Total 580 · Buildings & Grounds 10,660.31 21,100.00 -10,439.69 50.52% 10,821.81
Total 530 · Administration 54,551.29 101,490.00 -46,938.71 53.75% 52,973.50
610 · Salaries & Benefits
610.1 · Salaries
610.1.1 · Full-Time 164,611.47 397,187.00 -232,575.53 41.44% 184,265.04
610.1.2 · Part-Time 47,344.39 100,611.00 -53,266.61 47.06% 50,000.53
610.1.3 · Passport Agents 5,958.52 21,148.00 -15,189.48 28.18% 6,270.43
610.1.4 · Consultants 0.00 0.00 0.00 0.0% 2,208.92
Total 610.1 · Salaries 217,914.38 518,946.00 -301,031.62 41.99% 242,744.92
610.2 · Social Security Expense 16,091.27 39,669.00 -23,577.73 40.56% 17,728.01
610.3 · Employee Benefit Expense
610.3.2 · H.S.A. Contribution 1,249.95 9,000.00 -7,750.05 13.89% 0.00
11:32 AM 01/06/20 Cash Basis
Phoenixville Public Library Profit & Loss Budget vs. Actual
July through December 2019
Page 5 of 5
Jul - Dec 19 Budget $ Over Budget % of Budget Prev. Year
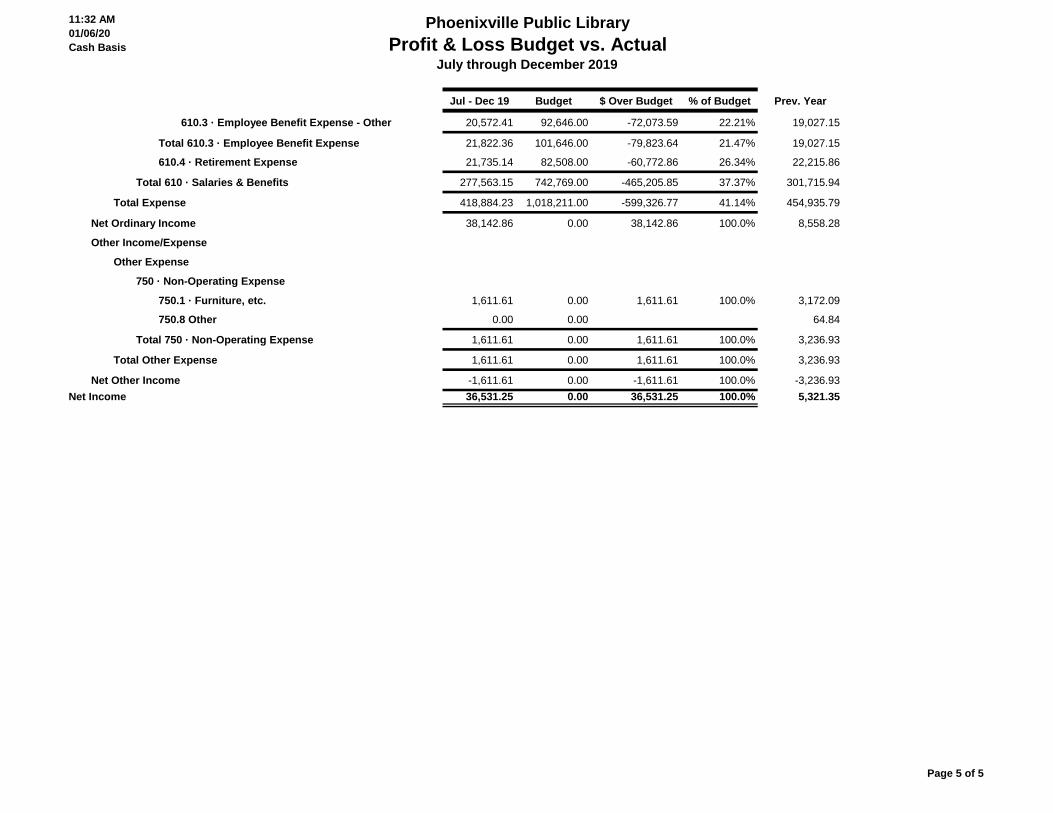
610.3 · Employee Benefit Expense - Other 20,572.41 92,646.00 -72,073.59 22.21% 19,027.15
Total 610.3 · Employee Benefit Expense 21,822.36 101,646.00 -79,823.64 21.47% 19,027.15
610.4 · Retirement Expense 21,735.14 82,508.00 -60,772.86 26.34% 22,215.86
Total 610 · Salaries & Benefits 277,563.15 742,769.00 -465,205.85 37.37% 301,715.94
Total Expense 418,884.23 1,018,211.00 -599,326.77 41.14% 454,935.79
Net Ordinary Income 38,142.86 0.00 38,142.86 100.0% 8,558.28
Other Income/Expense
Other Expense
750 · Non-Operating Expense
750.1 · Furniture, etc. 1,611.61 0.00 1,611.61 100.0% 3,172.09
750.8 Other 0.00 0.00 64.84
Total 750 · Non-Operating Expense 1,611.61 0.00 1,611.61 100.0% 3,236.93
Total Other Expense 1,611.61 0.00 1,611.61 100.0% 3,236.93
Net Other Income -1,611.61 0.00 -1,611.61 100.0% -3,236.93Net Income 36,531.25 0.00 36,531.25 100.0% 5,321.35


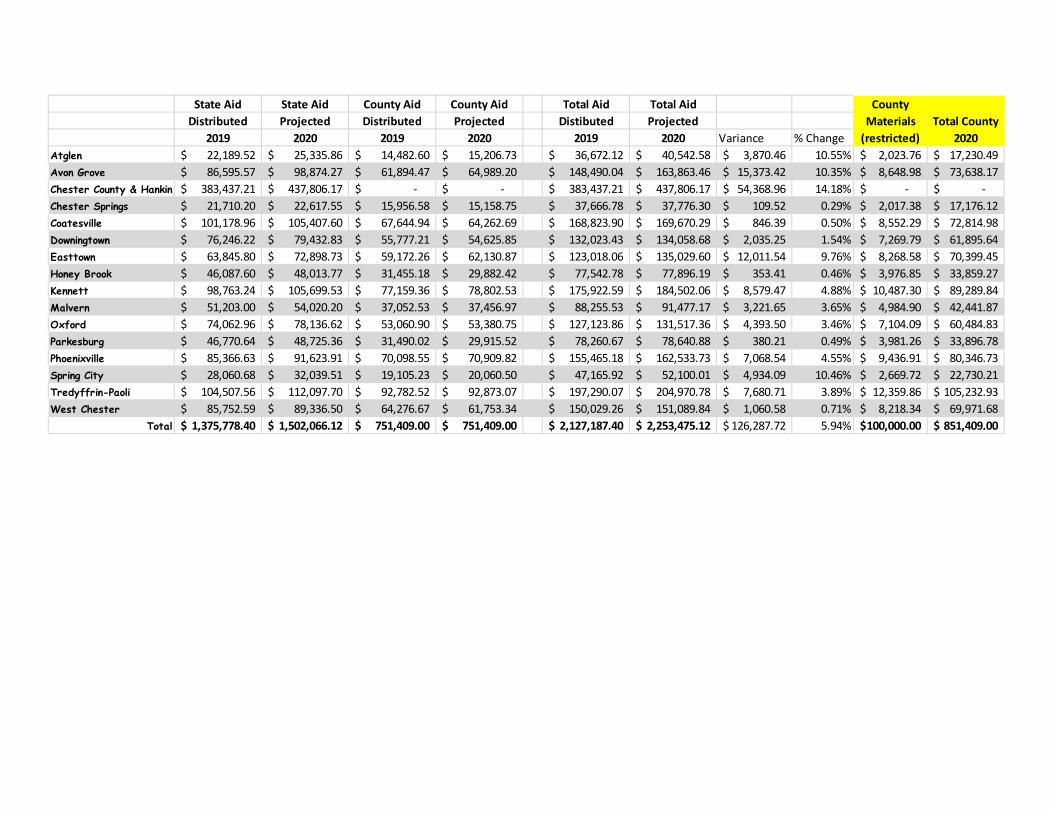
Friday, December 13, 2019 To: Earl Baker, President Board of Trustees From: Joseph Sherwood Executive Director Re: $100,000 Member Library Materials Grant At the December 12, 2019 County of Chester Commissioners meeting the Commissioners approved the 2020 Budget. I was informed from our Chester County Finance Liaison that the $100,000 request has been approved.
The request specified the following: We request an additional $100,000 to be distributed to the member libraries based on the current formula for distribution of County funds. This formula excludes Chester County Library and the Henrietta Hankin Branch Library since the County has previously appropriated amounts to them for this purpose ($50,000 in 2019) broken out separately in the budget. The requested amount for 2020 would be used solely for library materials by the members themselves based on their own unique community and subject matter demands.
As a reminder: • These funds are to be spent on collections by the members, so you will be required to show
the commissioners what they were spent on (as we would do for any funder). • These are one-time grant funds and do not add to the collection maintenance standards. • These funds are eligible to be used for print or electronic materials.
Materials Amount100,000.00$
Chester County Funding PercentageAtglen 15,206.73$ 2.02% 2,023.76$
Avon Grove 64,989.20$ 8.65% 8,648.98$ Chester County & Hankin -$ 0.00% -$
Chester Springs 15,158.75$ 2.02% 2,017.38$ Coatesville 64,262.69$ 8.55% 8,552.29$
Downingtown 54,625.85$ 7.27% 7,269.79$ Easttown 62,130.87$ 8.27% 8,268.58$
Honey Brook 29,882.42$ 3.98% 3,976.85$ Kennett (formerly BTML) 78,802.53$ 10.49% 10,487.30$
Malvern 37,456.97$ 4.98% 4,984.90$ Oxford 53,380.75$ 7.10% 7,104.09$
Parkesburg 29,915.52$ 3.98% 3,981.26$ Phoenixville 70,909.82$ 9.44% 9,436.91$
Spring City 20,060.50$ 2.67% 2,669.72$ Tredyffrin & Paoli 92,873.07$ 12.36% 12,359.86$
West Chester 61,753.34$ 8.22% 8,218.34$ Total 751,409$ 100% 100,000.00$
2020 Funding Formula County Amount
State Aid State Aid County Aid County Aid Total Aid Total AidDistributed Projected Distributed Projected Distibuted Projected
2019 2020 2019 2020 2019 2020 Variance % ChangeAtglen 22,189.52$ 25,335.86$ 14,482.60$ 15,206.73$ 36,672.12$ 40,542.58$ 3,870.46$ 10.55% 2,023.76$ 17,230.49$ Avon Grove 86,595.57$ 98,874.27$ 61,894.47$ 64,989.20$ 148,490.04$ 163,863.46$ 15,373.42$ 10.35% 8,648.98$ 73,638.17$ Chester County & Hankin 383,437.21$ 437,806.17$ -$ -$ 383,437.21$ 437,806.17$ 54,368.96$ 14.18% -$ -$ Chester Springs 21,710.20$ 22,617.55$ 15,956.58$ 15,158.75$ 37,666.78$ 37,776.30$ 109.52$ 0.29% 2,017.38$ 17,176.12$ Coatesville 101,178.96$ 105,407.60$ 67,644.94$ 64,262.69$ 168,823.90$ 169,670.29$ 846.39$ 0.50% 8,552.29$ 72,814.98$ Downingtown 76,246.22$ 79,432.83$ 55,777.21$ 54,625.85$ 132,023.43$ 134,058.68$ 2,035.25$ 1.54% 7,269.79$ 61,895.64$ Easttown 63,845.80$ 72,898.73$ 59,172.26$ 62,130.87$ 123,018.06$ 135,029.60$ 12,011.54$ 9.76% 8,268.58$ 70,399.45$ Honey Brook 46,087.60$ 48,013.77$ 31,455.18$ 29,882.42$ 77,542.78$ 77,896.19$ 353.41$ 0.46% 3,976.85$ 33,859.27$ Kennett 98,763.24$ 105,699.53$ 77,159.36$ 78,802.53$ 175,922.59$ 184,502.06$ 8,579.47$ 4.88% 10,487.30$ 89,289.84$ Malvern 51,203.00$ 54,020.20$ 37,052.53$ 37,456.97$ 88,255.53$ 91,477.17$ 3,221.65$ 3.65% 4,984.90$ 42,441.87$ Oxford 74,062.96$ 78,136.62$ 53,060.90$ 53,380.75$ 127,123.86$ 131,517.36$ 4,393.50$ 3.46% 7,104.09$ 60,484.83$ Parkesburg 46,770.64$ 48,725.36$ 31,490.02$ 29,915.52$ 78,260.67$ 78,640.88$ 380.21$ 0.49% 3,981.26$ 33,896.78$ Phoenixville 85,366.63$ 91,623.91$ 70,098.55$ 70,909.82$ 155,465.18$ 162,533.73$ 7,068.54$ 4.55% 9,436.91$ 80,346.73$ Spring City 28,060.68$ 32,039.51$ 19,105.23$ 20,060.50$ 47,165.92$ 52,100.01$ 4,934.09$ 10.46% 2,669.72$ 22,730.21$ Tredyffrin-Paoli 104,507.56$ 112,097.70$ 92,782.52$ 92,873.07$ 197,290.07$ 204,970.78$ 7,680.71$ 3.89% 12,359.86$ 105,232.93$ West Chester 85,752.59$ 89,336.50$ 64,276.67$ 61,753.34$ 150,029.26$ 151,089.84$ 1,060.58$ 0.71% 8,218.34$ 69,971.68$
Total 1,375,778.40$ 1,502,066.12$ 751,409.00$ 751,409.00$ 2,127,187.40$ 2,253,475.12$ 126,287.72$ 5.94% 100,000.00$ 851,409.00$
County Materials
(restricted)Total County
2020
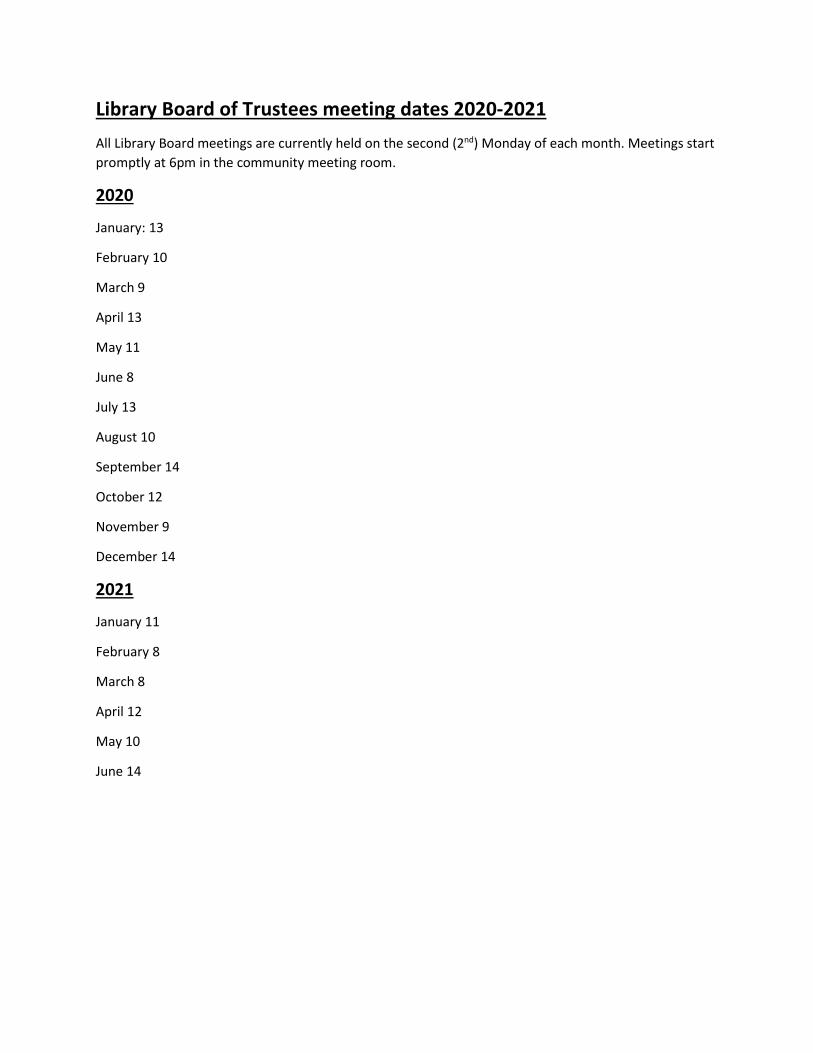
Library Board of Trustees meeting dates 2020-2021 All Library Board meetings are currently held on the second (2nd) Monday of each month. Meetings start promptly at 6pm in the community meeting room.
2020
January: 13
February 10
March 9
April 13
May 11
June 8
July 13
August 10
September 14
October 12
November 9
December 14
2021
January 11
February 8
March 8
April 12
May 10
June 14
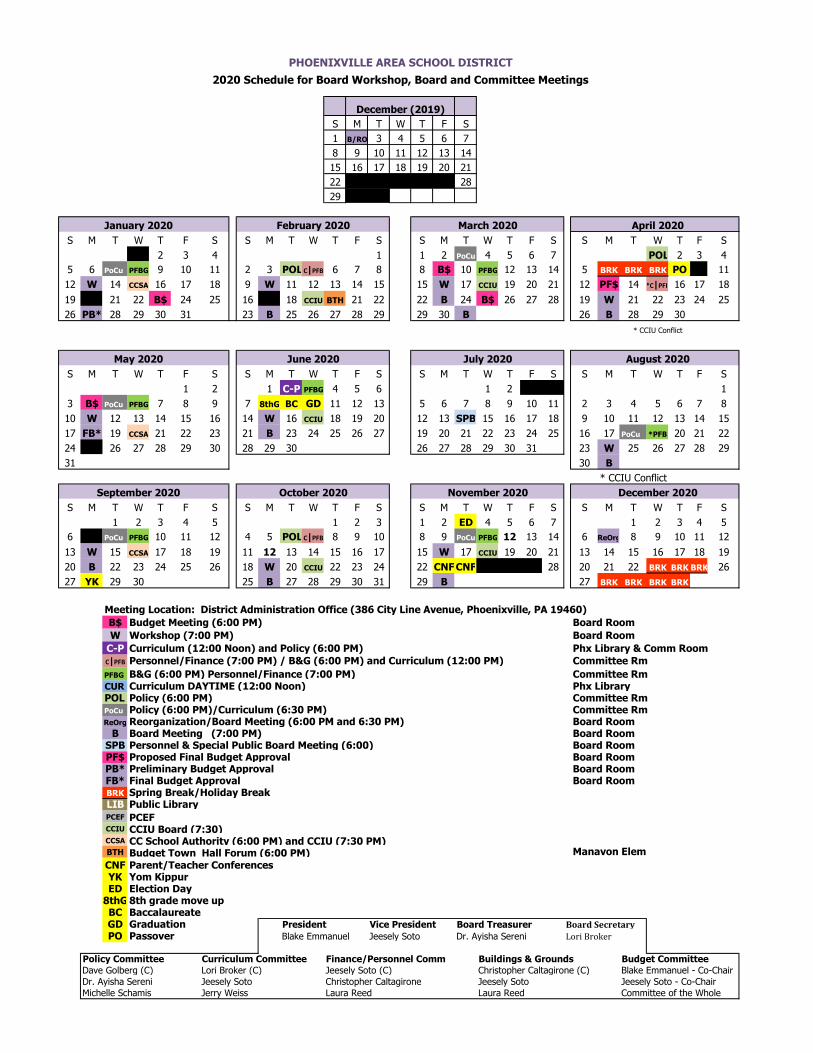
PHOENIXVILLE AREA SCHOOL DISTRICT
2020 Schedule for Board Workshop, Board and Committee Meetings
December (2019)
S M T W T F S
1 B/RO 3 4 5 6 7
8 9 10 11 12 13 14
15 16 17 18 19 20 21
22 18 18 18 18 18 28
29 18 18
January 2020 March 2020 April 2020
S M T W T F S S M T W T F S S M T W T F S S M T W T F S
18 2 3 4 1 1 2 PoCu 4 5 6 7 POL 2 3 4
5 6 PoCu PFBG 9 10 11 2 3 POLC|PFB 6 7 8 8 B$ 10 PFBG 12 13 14 5 BRK BRK BRK PO 18 11
12 W 14 CCSA 16 17 18 9 W 11 12 13 14 15 15 W 17 CCIU 19 20 21 12 PF$ 14 *C|PFB 16 17 18
19 18 21 22 B$ 24 25 16 18 18 CCIU BTH 21 22 22 B 24 B$ 26 27 28 19 W 21 22 23 24 25
26 PB* 28 29 30 31 23 B 25 26 27 28 29 29 30 B 26 B 28 29 30
* CCIU Conflict
May 2020 June 2020 July 2020 August 2020
S M T W T F S S M T W T F S S M T W T F S S M T W T F S
1 2 1 C-P PFBG 4 5 6 1 2 18 18 1
3 B$ PoCu PFBG 7 8 9 7 8thG BC GD 11 12 13 5 6 7 8 9 10 11 2 3 4 5 6 7 8
10 W 12 13 14 15 16 14 W 16 CCIU 18 19 20 12 13 SPB 15 16 17 18 9 10 11 12 13 14 15
17 FB* 19 CCSA 21 22 23 21 B 23 24 25 26 27 19 20 21 22 23 24 25 16 17 PoCu *PFBG 20 21 22
24 18 26 27 28 29 30 28 29 30 26 27 28 29 30 31 23 W 25 26 27 28 29
31 30 B
* CCIU Conflict
September 2020 October 2020 November 2020 December 2020
S M T W T F S S M T W T F S S M T W T F S S M T W T F S
1 2 3 4 5 1 2 3 1 2 ED 4 5 6 7 1 2 3 4 5
6 18 PoCu PFBG 10 11 12 4 5 POLC|PFB 8 9 10 8 9 PoCu PFBG 12 13 14 6 ReOrg 8 9 10 11 12
13 W 15 CCSA 17 18 19 11 12 13 14 15 16 17 15 W 17 CCIU 19 20 21 13 14 15 16 17 18 19
20 B 22 23 24 25 26 18 W 20 CCIU 22 23 24 22 CNF CNF 18 18 18 28 20 21 22 BRK BRK BRK 26
27 YK 29 30 25 B 27 28 29 30 31 29 B 27 BRK BRK BRK BRK
Meeting Location: District Administration Office (386 City Line Avenue, Phoenixville, PA 19460)
B$ Budget Meeting (6:00 PM) Board Room
W Workshop (7:00 PM) Board Room
C-P Curriculum (12:00 Noon) and Policy (6:00 PM) Phx Library & Comm Room
C|PFB Personnel/Finance (7:00 PM) / B&G (6:00 PM) and Curriculum (12:00 PM) Committee Rm
PFBG B&G (6:00 PM) Personnel/Finance (7:00 PM) Committee RmCUR Curriculum DAYTIME (12:00 Noon) Phx LibraryPOL Policy (6:00 PM) Committee RmPoCu Policy (6:00 PM)/Curriculum (6:30 PM) Committee RmReOrg Reorganization/Board Meeting (6:00 PM and 6:30 PM) Board Room
B Board Meeting (7:00 PM) Board RoomSPB Personnel & Special Public Board Meeting (6:00) Board RoomPF$ Proposed Final Budget Approval Board RoomPB* Preliminary Budget Approval Board RoomFB* Final Budget Approval Board RoomBRK Spring Break/Holiday BreakLIB Public LibraryPCEF PCEFCCIU CCIU Board (7:30)CCSA CC School Authority (6:00 PM) and CCIU (7:30 PM)BTH Budget Town Hall Forum (6:00 PM) Manavon Elem
CNF Parent/Teacher ConferencesYK Yom KippurED Election Day
8thG 8th grade move upBC BaccalaureateGD Graduation President Vice President Board Treasurer Board Secretary
PO Passover Blake Emmanuel Jeesely Soto Dr. Ayisha Sereni Lori Broker
Policy Committee Curriculum Committee Finance/Personnel Comm Buildings & Grounds Budget Committee
Dave Golberg (C) Lori Broker (C) Jeesely Soto (C) Christopher Caltagirone (C) Blake Emmanuel - Co-Chair
Dr. Ayisha Sereni Jeesely Soto Christopher Caltagirone Jeesely Soto Jeesely Soto - Co-Chair
Michelle Schamis Jerry Weiss Laura Reed Laura Reed Committee of the Whole
February 2020

Page 1 of 1
Board Calendar – 2020 Jan Feb Mar Apr May Jun Jul Aug Sep Oct Nov Dec
Meeting Schedule
Workshop – 7:00 pm 13 10 16 20 11 15 - 24 14 19 16 -
Board Meeting – 7:00 pm 27 24 23 27 18 22 14 (6)
31 21 26 30 7
Building and Grounds – 6:00 pm 8 5 11 15 6 3 - 19 9 7 11 -
Finance – 7:00 pm 8 5 11 15 6 3 - 19 9 7 11 -
Policy – 6:00 pm 7 4 3 1 5 2 - 18 8 6 10 -
Curriculum – Night 6:30 pm & Day 12 noon 7N 5D 3N 15D 5N 2D - 18N 8N 7D 10N -
Library Board – 6:00 pm 13 10 9 13 11 15 13 10 14 12 9 14
PCEF – 6:00 pm 27 - 16 - 4 15
CCIU – 7:30 pm 15 19 18 15 20 17 - 19 16 21 18 -
CCIU Authority – 6:00 PM 15 - - - 20 - - - 16 - - -
Budget Town Hall Meeting – 6:00 PM – Manavon 20
Budget Meetings – 6:00 PM 23/27 9 13 4/18

Pennsylvania Library Association- Directors’ Institute
Dates: Sunday May 31-Wednesday June 2, 2020
Location: Harrisburg
Cost: $400- includes meals, lodging, custom content, supplies and professional facilitation
The program is specially designed for library directors, assistant directors and branch managers.
Application and deadlines:
Completed application, resume, statement of interest and letter of recommendation are due no later than March 5, 2020.